Biotic versus Abiotic Controls on Bioavailable Soil Organic Carbon


1
Earth Research Institute and Department of Ecology, Evolution, and Marine Biology, University of California at Santa Barbara, Santa Barbara, CA 93106, USA
2
Department of Soil, Water, and Environmental Science, University of Arizona, Tucson, AZ 85721, USA
*
Author to whom correspondence should be addressed.
Soil Syst. 2018, 2(1), 10; https://doi.org/10.3390/soilsystems2010010
Submission received: 15 December 2017
/
Revised: 11 February 2018
/
Accepted: 12 February 2018
/
Published: 22 February 2018
(This article belongs to the Special Issue Soil Organic Matter Dynamics)
Abstract
:Processes controlling microbial access to soil organic matter are critical for soil nutrient cycling and C stabilization. The bioavailability of soil organic matter partly depends on the rate that substrates become water-soluble, which is determined by some combination of biological, biochemical, and purely abiotic processes. Our goal was to unravel these biotic and abiotic processes to better understand mechanisms controlling the dynamics of bioavailable soil organic carbon (SOC). We sampled soils in a California annual grassland from manipulated plots with and without plants to help distinguish bioavailable SOC generated from mineral-associated organic matter versus from plant detritus (i.e., the “light fraction”). In the laboratory, soils were incubated for 8 months under all possible combinations of three levels of moisture and two levels of microbial biomass using continuous chloroform sterilization. We measured cumulative carbon dioxide (CO2) production and the net change in soil water-extractable organic C (WEOC) to quantify C that was accessed biologically or biochemically. Under the driest conditions, microbes appeared to primarily access WEOC from recent plant C, with the other half of CO2 production explained by extracellular processes. These results suggest that dry, uncolonized conditions promote the adsorption of WEOC onto mineral surfaces. Under wetter conditions, microbial access increased by two orders of magnitude, with a large concomitant decrease in WEOC, particularly in soils without plant inputs from the previous growing season. The largest increase in WEOC occurred in wet sterilized soil, perhaps because exoenzymes and desorption continued solubilizing C but without microbial consumption. A similar amount of WEOC accumulated in wet sterilized soil whether plants were present or not, suggesting that desorption of mineral-associated C was the abiotic WEOC source. Based on these results, we hypothesize that dry-live and wet-uncolonized soil microsites are sources of bioavailable SOC, whereas wet-live and dry-uncolonized microsites are sinks.
1. Introduction
Forecasting changes in soil carbon (C) stocks depends on a mechanistic understanding of soil C pools and how they respond to environmental changes, particularly changes in moisture. As moisture varies, one soil C pool that may be particularly sensitive is water-soluble soil organic carbon (SOC). This pool is composed of small, hydrophilic molecules, such as saccharides, that can be easily mobilized and then taken up and metabolized by microbial cells [1,2]. Water-soluble SOC provides immediate resources to soil microorganisms and thus plays a dominant role in controlling their short-term responses of microbial activity to environmental changes, such as rewetting following drought [3,4]. This immediately bioavailable SOC pool appears to be what fuels respiration in the short-term [5,6], and its existence may be why first-order models (e.g., CENTURY) fail to capture pulse events [7]; thus, we need to better understand what controls its accumulation and dynamics. This is particularly true in conditions where soil moisture varies and the production and consumption of bioavailable SOC may be regulated differently.
Factors influencing microbial access to C may be critical for controlling the balance of production and consumption of bioavailable SOC and, therefore, for long-term soil C storage [8]. Water is, of course, key in influencing access because it links cells and substrates. When soil water films are sufficiently connected, microbial activity can regulate the concentration of bioavailable SOC because dissolved substrates can diffuse to cells and be taken up [9]. If the concentration of bioavailable SOC decreases over time, then this is usually interpreted as microbial consumption [10,11,12]; the C was accessed, metabolized, and respired. If bioavailable SOC remains steady or accumulates over time, then microbial access is probably limited. Air pockets prevent the diffusion of soluble resources to microbial cells [13]. Therefore, both soil CO2 emission and bioavailable SOC are proxies for C accessibility.
Microbial access to bioavailable SOC also depends on the rate at which substrates become water-soluble, which is driven by some unknown combination of biological, biochemical, and purely abiotic processes [11,14,15,16,17]. Plants transfer large amounts of labile C to soil, mostly as long-chain organic polymers. Microbial exoenzymes and other biochemical mechanisms solubilize SOC by fragmenting the polymers (i.e., depolymerization) [18,19,20]. Purely abiotic oxidation reactions can solubilize SOC by increasing the polarity of oxygen-containing functional groups [21]. This type of solubilization is largely a mystery, however, because the effects of recent plant inputs versus older mineral-associated C are not usually separated in studies on soil organic matter dynamics. Furthermore, desorption and adsorption processes in soil are difficult to quantify when live microbes are acting simultaneously.
To explain, and predict, the responses of soil organic matter and microbial communities to changing moisture regimes, we need to understand the mechanisms controlling bioavailable SOC dynamics. Particularly, we need to understand the balance of biological and physicochemical processes in regulating bioavailable SOC. Our approach was to combine field and laboratory manipulations in a seasonally dry grassland. To quantify the role of plant inputs on bioavailable SOC, we measured pools of water-extractable organic carbon (WEOC). We sampled soils from plots with plants and others where plants were completely removed for an entire growing season. To quantify the role of microbial activity and water availability, we did a laboratory incubation in which “live” soils were compared to those that were kept sterile for over 8 months under different moisture treatments. Our predictions were: (i) less WEOC would accumulate in soils from plots where plants had been removed, (ii) more WEOC would accumulate when microbes are killed, and (iii) the greatest amounts of WEOC would accumulate under dry-live and wet-sterile conditions. In dry-live conditions, microbes may continue to produce exoenzymes that break down organic polymers, but the soluble monomers cannot necessarily diffuse back to cells. Under wet-sterile conditions, hydrologically connected conditions should allow for higher rates of desorption and exoenzyme activities, but without microbial uptake, potentially allowing WEOC to accumulate.
2. Materials and Methods
2.1. Site Description
We studied a seasonally dry grassland at the University of California Sedgwick Reserve near Santa Ynez, CA, USA (370 m above sea level (ASL), 34.7120° N, 120.0388° W). The site experiences a Mediterranean-type climate with hot dry summers and cooler wet winters. The mean annual precipitation and temperature are 380 mm and 16.8 °C, respectively. Roughly 90% of annual precipitation falls between November and April. During the year preceding soil sampling in August 2013, annual precipitation was roughly 50% below average (175 mm).
The soil was keyed as a thermic Pachic Haploxeroll with a silty clay loam texture, pH 6.0, 2.2% C, and 0.21% nitrogen (N). The soil is derived from the Paso-Robles formation, which is poorly consolidated alluvial material formed from montmorillinite that eroded from nearby Monterey Shale deposits. The soil also contains some amount of Franciscan Complex minerals, including ultramafics (e.g., serpentinite), sandstone, and chert. Vegetation is dominated by nonnative Mediterranean annual grasses; primarily Bromus diandrus, Bromus hordaceous, and Avena fatua.
2.2. Plant Removal
To create a gradient of plant influence, grasses and forbs were removed by hand continuously during the growing season. Plots (2 m by 1 m) were selected in December 2012 based on similar initial plant cover and composition; plots were segregated into three blocks, and all treatments were replicated in each block (n = 3). A relatively flat area (<2% grade) was selected to minimize lateral flow of water between adjacent treatments. Plots were spaced at least 1 m apart to minimize edge effects and transfer of plant C between plots by water or wind.
Manipulation of plant C input began on 14 December 2012 by removing all existing plant litter (i.e., thatch) from the soil surface gently by hand. Thatch removal was done to minimize any confounding effects of older litter so that each treatment would have similar initial conditions. We created four levels of plant removal: 0%, 30%, 60%, and 90%. However, in this study, we focused on the most extreme comparison between 0% and 90% removal. For the 0% plant removal treatment, plots were not altered after the initial thatch removal. For the 90% plant removal treatment, we tried to remove all plants as soon as possible after germination. The plant removal treatments were maintained every 7 to 10 days during the growing season and as needed during the dry season. Our goal was to alter plant C input during the growing season, but not to extend the length of the growing season. Edge effects of root growth from outside the plots were minimized by clearing a ~30 cm perimeter around every plot using a motorized weed whacker and garden shears.
2.3. Laboratory Soil Incubations
To separate biotic and abiotic mechanisms that create and consume soil WEOC, we manipulated soil microbial biomass and water content in the laboratory for 8 months. An 8-month period was chosen to simulate the prolonged dry season in southern California after plant senescence.
2.3.1. Soil Sampling
Surface soils (0–10 cm) were collected from field plots on 15 July 2013 after one growing season of plant removal. We collected one 5 cm diameter soil core from near the center of each plot. In the laboratory, soils were sieved to <4 mm to remove large rocks and then air dried for two weeks at 22 °C to ensure that all soils began at a similar (dry) water content.
2.3.2. Incubation Setup
To separate biotic and abiotic controls on WEOC dynamics, soils were incubated in the dark at 30 °C (i.e., a common temperature of surface soils during dry season) for roughly 8 months from 26 August 2013 until 12 May 2014. There were a total of three factors manipulated in full-factorial design: (i) microbial abundance, (ii) soil moisture, and (iii) plant C input during the previous growing season. Originally, field irrigation (i.e., plots that were watered during the 2 months preceding soil sampling) was included as a factor in the laboratory soil incubations. However, in terms of WEOC, the field irrigated soils behaved the same as the non-irrigated soils. Therefore, we combined these treatments statistically for the laboratory incubations, providing two plant-covered plots and two bare plots in each of the three blocks (i.e., n = 6).
Air-dry soils (25 g) from plots with and without plants were placed in individual 50 mL glass beakers inside 1 L canning jars. Soils were exposed to two levels of microbial abundance and three levels of water content. Microbial abundance was either unmanipulated (i.e., live treatment) or reduced using continuous chloroform (CHCl3) fumigation (i.e., sterilized treatment) [22,23]. In a fume hood, all soils assigned to the sterilized treatment were first fumigated continuously for 72 h in an aluminum pressure cooker to release WEOC from live cells. After this pre-fumigation, soils were subsampled for initial measurements of microbial biomass and WEOC (described in detail below). We decided not to “flush” the soils with water to remove initial WEOC and the extra microbial WEOC in the fumigated treatment because there is no straightforward way to extract all WEOC from soil organic and mineral particles without major disturbance to soil structure. Repeated rewetting would have repeatedly released more soil WEOC [5]. Rather than beginning with no WEOC, soils were left undisturbed with the goal of quantifying the net change in WEOC during an 8-month incubation.
After pre-fumigation, soil water content was adjusted to 5%, 25%, and 50% of water-holding capacity (WHC). The WHC for this soil was 0.69 g H2O g−1, as measured by saturation on Whatman Grade 1 filter paper followed by 24 h of gravitational draining under 100% humidity. A soil water content of 5% WHC is typical during the summer dry season at this site, 25% WHC is typical during the winter wet season, and 50% WHC was intended to maximize hydrological connectivity while preventing oxygen limitation [24,25]. Deionized water was added using a spray bottle with a fine mist. After adjusting soil moisture, each beaker was immediately placed back into a jar and sealed with an airtight lid to prevent drying. The 25% and 50% WHC treatments also contained 5 mL of water pipetted to the bottom of the jar (i.e., outside of the beaker) in order to maintain 100% humidity and minimize evaporation from the soil during the incubation. Our intent was to investigate discrete, constant levels of soil moisture rather than rewetting cycles. Henceforth, the 5%, 25%, and 50% WHC treatments are referred to as Dry, Moist, and Wet, respectively.
The beakers with soil were placed inside individual 1 L canning jars, and a 12 mL vial with CHCl3 was carefully placed inside the jar next to the beaker. The jars were sealed using lids with butyl rubber septa and Teflon tape wrapped around the rubber seals to prevent corrosion. Using a vacuum pump (with an attached hose and needle to insert into a septum), each jar was evacuated and air was allowed to rush back in (using a needle open to atmosphere) to enhance CHCl3 movement into soil micro-pores to maximize microbial killing efficiency.
2.3.3. Soil Measurements
Initial and final soil microbial biomass were estimated using substrate-induced respiration (SIR) to confirm the efficacy of the sterilization treatment [26]. Measurements on the sterilized soils were done without chloroform present; hence, the microbial biomass assay was non-sterile. Because we used glucose as the sole substrate, this assay is henceforth referred to as “glucose-induced respiration”. Glucose is a straightforward indicator of biological activity in this soil [22]. Immediately after the pre-fumigation (initial) and 8-month incubation (final), a 5 g subsample of soil was transferred from each beaker to a 132 mL canning jar with 10 mL of deionized water. A glucose solution (50 mg glucose dissolved in 1 mL ultrapure water) was added to the soil slurry before sealing the jars with an airtight lid with a septum. The amount of glucose added (10 mg g−1 soil) was based on an assumed optimum [27]. The headspace carbon dioxide (CO2) concentration was measured 0.5, 1.5, and 2.5 h after adding the glucose solution. Each gas sample (1 mL) was collected using a glass syringe with side-port needle, and then immediately measured using a non-dispersive infrared gas analyzer (LI-820, LiCor, Inc., Lincoln, NE, USA). Rates of CO2 production were calculated by the slope of linear regression and expressed as µg CO2-C per gram of oven-dry soil equivalent per hour. These rates of glucose-induced respiration correlate with soil microbial biomass, but we report raw rates instead due to uncertainty in this correlation across treatments.
Cumulative soil CO2 production was measured in all incubation jars. The headspace CO2 concentration inside each sealed jar was measured immediately after adding water, and then again 2, 8, 16, 22, 31, 44, 63, 79, 106, 136, 171, and 259 days later. Each gas sample (1 mL) was collected using a glass syringe with side-port needle, and then immediately measured using the same infrared gas analyzer. Live soils were vented weekly to prevent oxygen depletion and CO2 buildup above 2%. Soils in the sterilized treatment, which are known to have very low rates of CO2 production [22], were vented approximately monthly in a fume hood and refilled with fresh chloroform as needed. Headspace CO2 concentration was measured before and after venting to account for variation between jars. Cumulative CO2 production was expressed as µg CO2-C per gram of oven-dry soil equivalent.
Water-extractable organic carbon (WEOC) was measured at the beginning and end of the soil incubations [17,28]. Soil WEOC extraction involved shaking (180 rpm) 8 g of oven-dry soil equivalent in 32 mL of deionized water in a 50 mL centrifuge tube for 3 h. The goal was to shake long enough to release WEOC from aggregates but short enough to limit any microbial growth in the sterilized soils. After shaking, the tubes were centrifuged (3000 g, 15 min) and the supernatant (10 mL) was pipetted into a clean 12 mL centrifuge tube and stored at −20 °C until analysis on a total organic carbon analyzer (TOC-V CSN, Shimadzu Scientific Instruments, Columbia, MD, USA). The net change in WEOC during the incubation was calculated by subtracting the final concentration from the initial. Care was taken to sample the centrifuged supernatant below any floating organic matter to ensure that measured WEOC was either dissolved or suspended in the solution. Although filtration can improve the relationship between WEOC concentration and microbial activity [29], filtration required hours for these clayey soils which increased the risk of microbial regrowth and associated WEOC consumption. Thus, we centrifuged the samples and immediately froze the extracts.
2.4. Statistical Analyses
The effects of sterilization, plant removal, and moisture level on soil microbial biomass, cumulative CO2 production, and the net change in WEOC were first identified using a three-way, full-factorial analysis of variance (ANOVA) at an alpha level of 0.05 (JMP 12 software, SAS Institute, Cary, NC, USA). The block design of field plots was not statistically significant for any measured variables. Specific treatment means were then compared using Tukey HSD post hoc tests at an alpha level of 0.05.
3. Results
3.1. Microbial Biomass
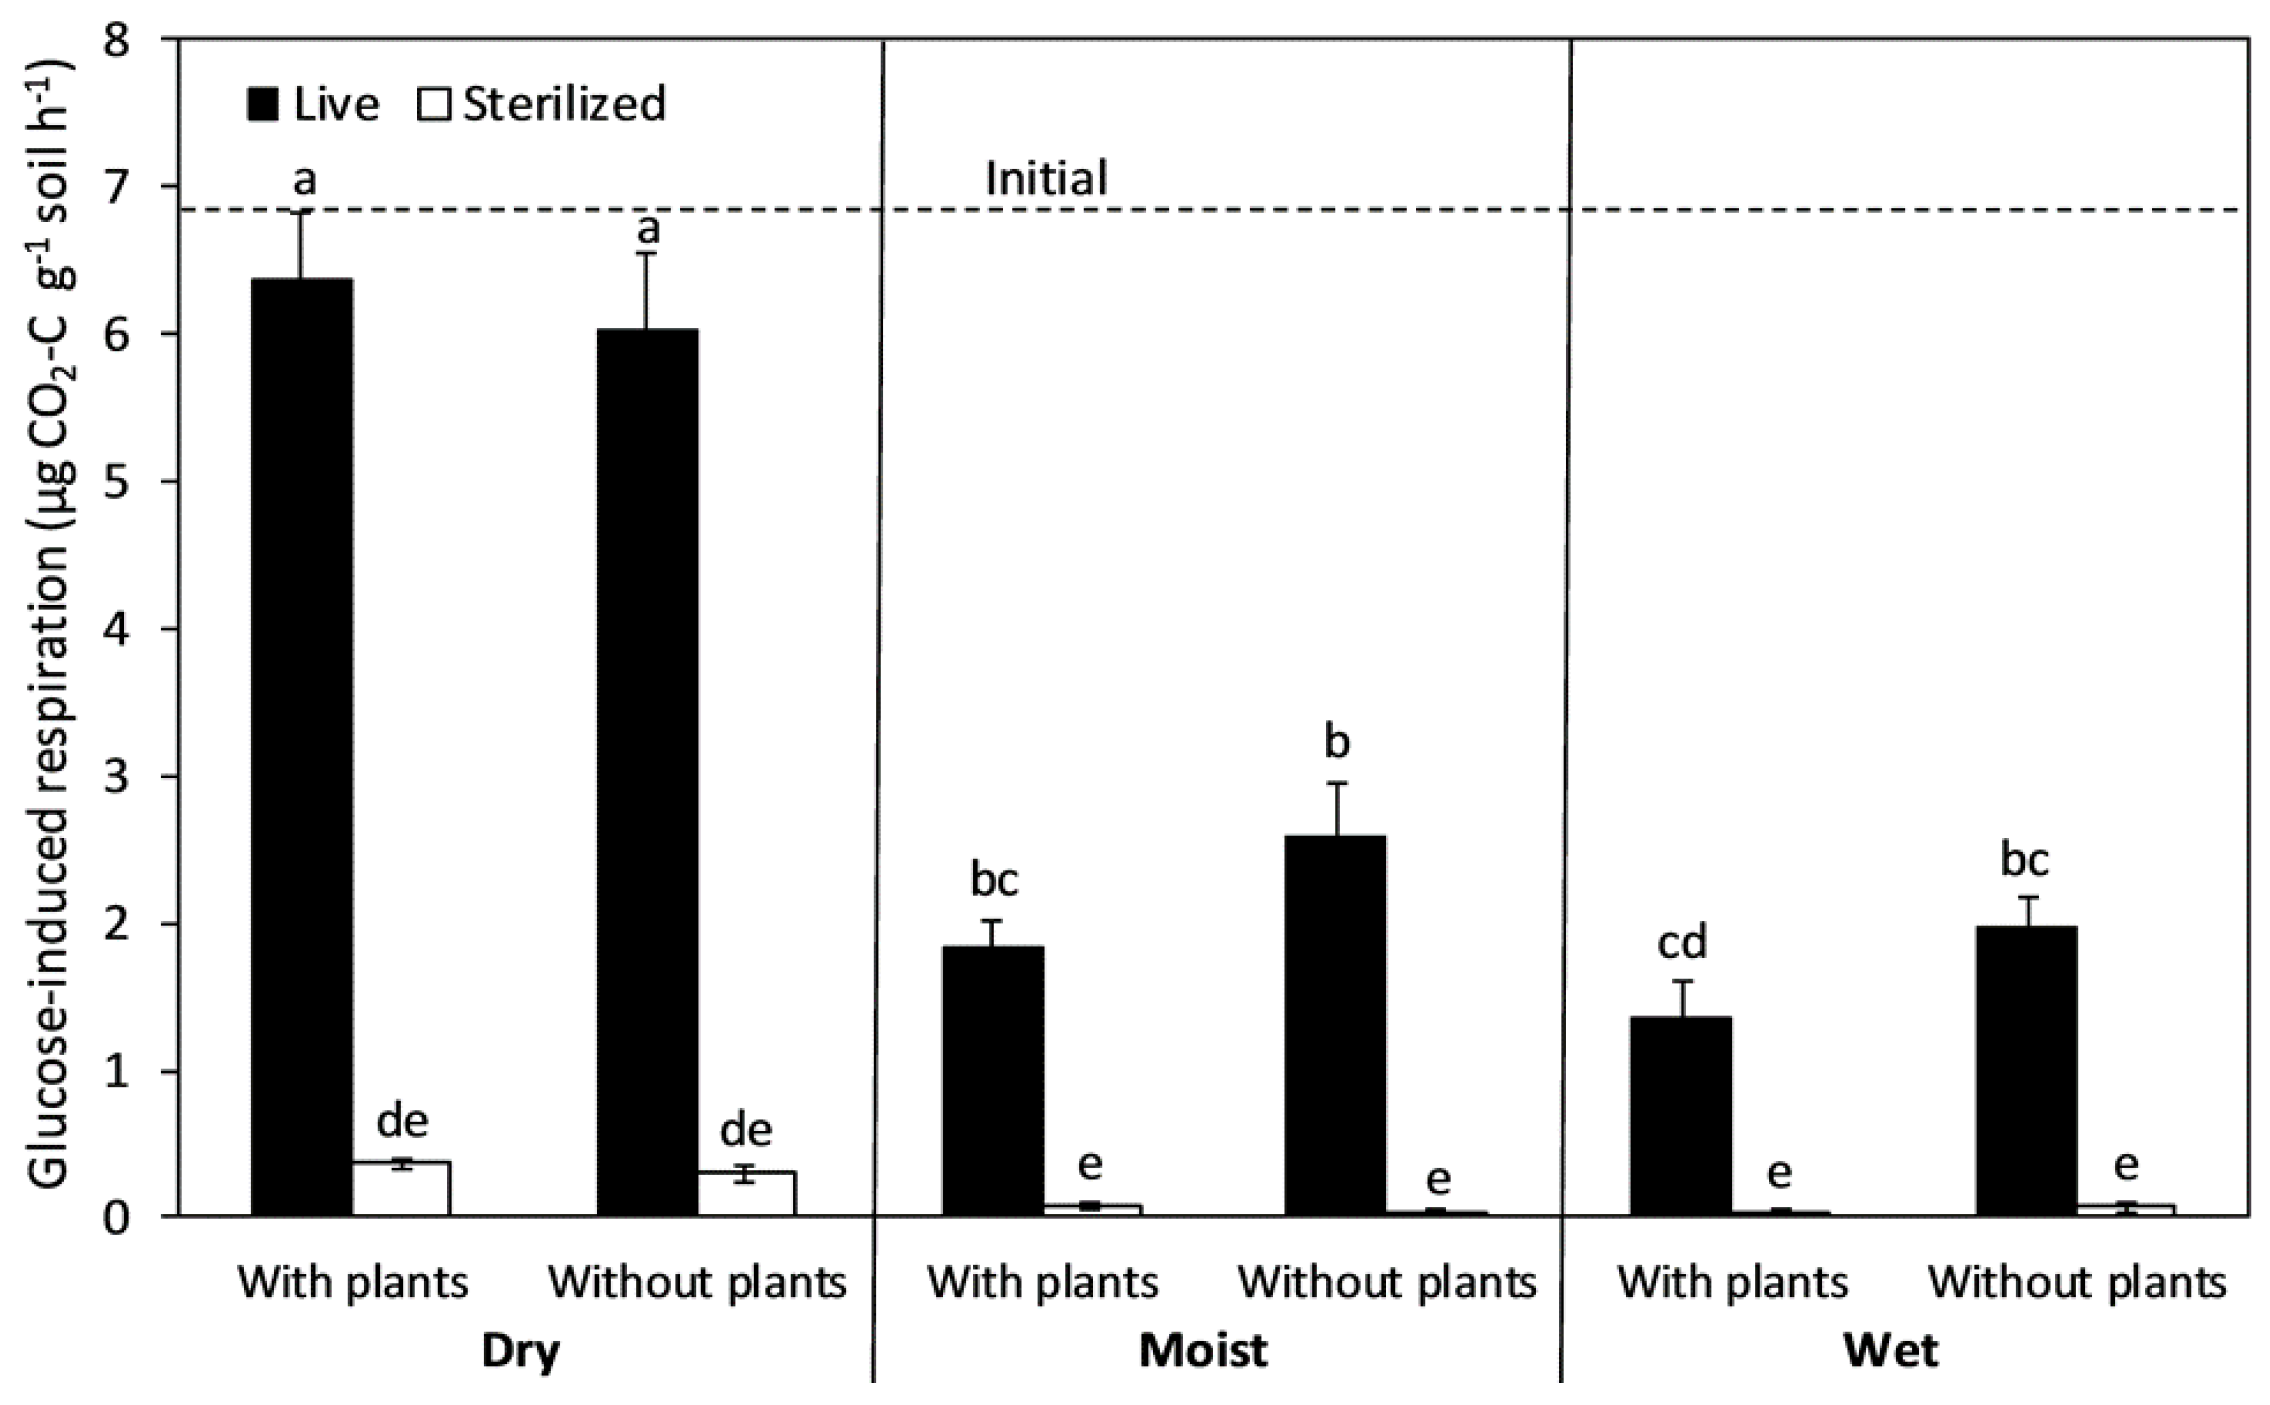
The killing efficiency of chloroform fumigation after 8 months ranged from 94% in dry soils with plants to 98% in moist soils without plants (Figure 1). The reduction in microbial biomass (as measured by glucose-induced respiration) did not depend on plant removal (Table 1), but it did depend on soil moisture level, with a slightly lower killing efficiency in dry soils. In the live treatment, soils maintained under moist and wet conditions had 57–79% lower microbial biomass than under dry conditions; plant inputs from the previous growing season did not alter this response. Compared with initial levels, microbial biomass in the continuously dry soils decreased by 6–11% during the incubation period.
3.2. Cumulative CO2 Emission
Sterilization and plant removal decreased cumulative soil CO2 emission whereas water addition increased it (Figure 2). In all treatments, initial CO2 release was relatively rapid and release rates declined over time; however, CO2 production never stopped completely, even after 8 months. The effect of water addition on cumulative soil CO2 emission depended on the sterilization treatment (Table 1); moist and wet conditions increased CO2 emission in live soils (by over two orders of magnitude) but not in sterilized soils. The effect of plant removal also depended on the sterilization treatment; plant removal decreased CO2 emission in live soils but not in sterilized soils. There was a two-way interaction between plant removal and soil moisture whereby plant removal decreased CO2 emission in moist and wet soils but not in dry soils. One year of plant removal resulted in 22.4% less CO2 emission in the moist treatment and 21.8% less CO2 emission in the wet treatment. For the live soils with plants, 0.08%, 11%, and 14% of total soil C (assuming 2.2% for all samples) was respired over 8 months from the dry, moist, and wet soils, respectively. For the sterilized soils with plants, 0.04%, 0.29%, and 0.33% of total soil C was respired from the dry, moist, and wet soils, respectively.
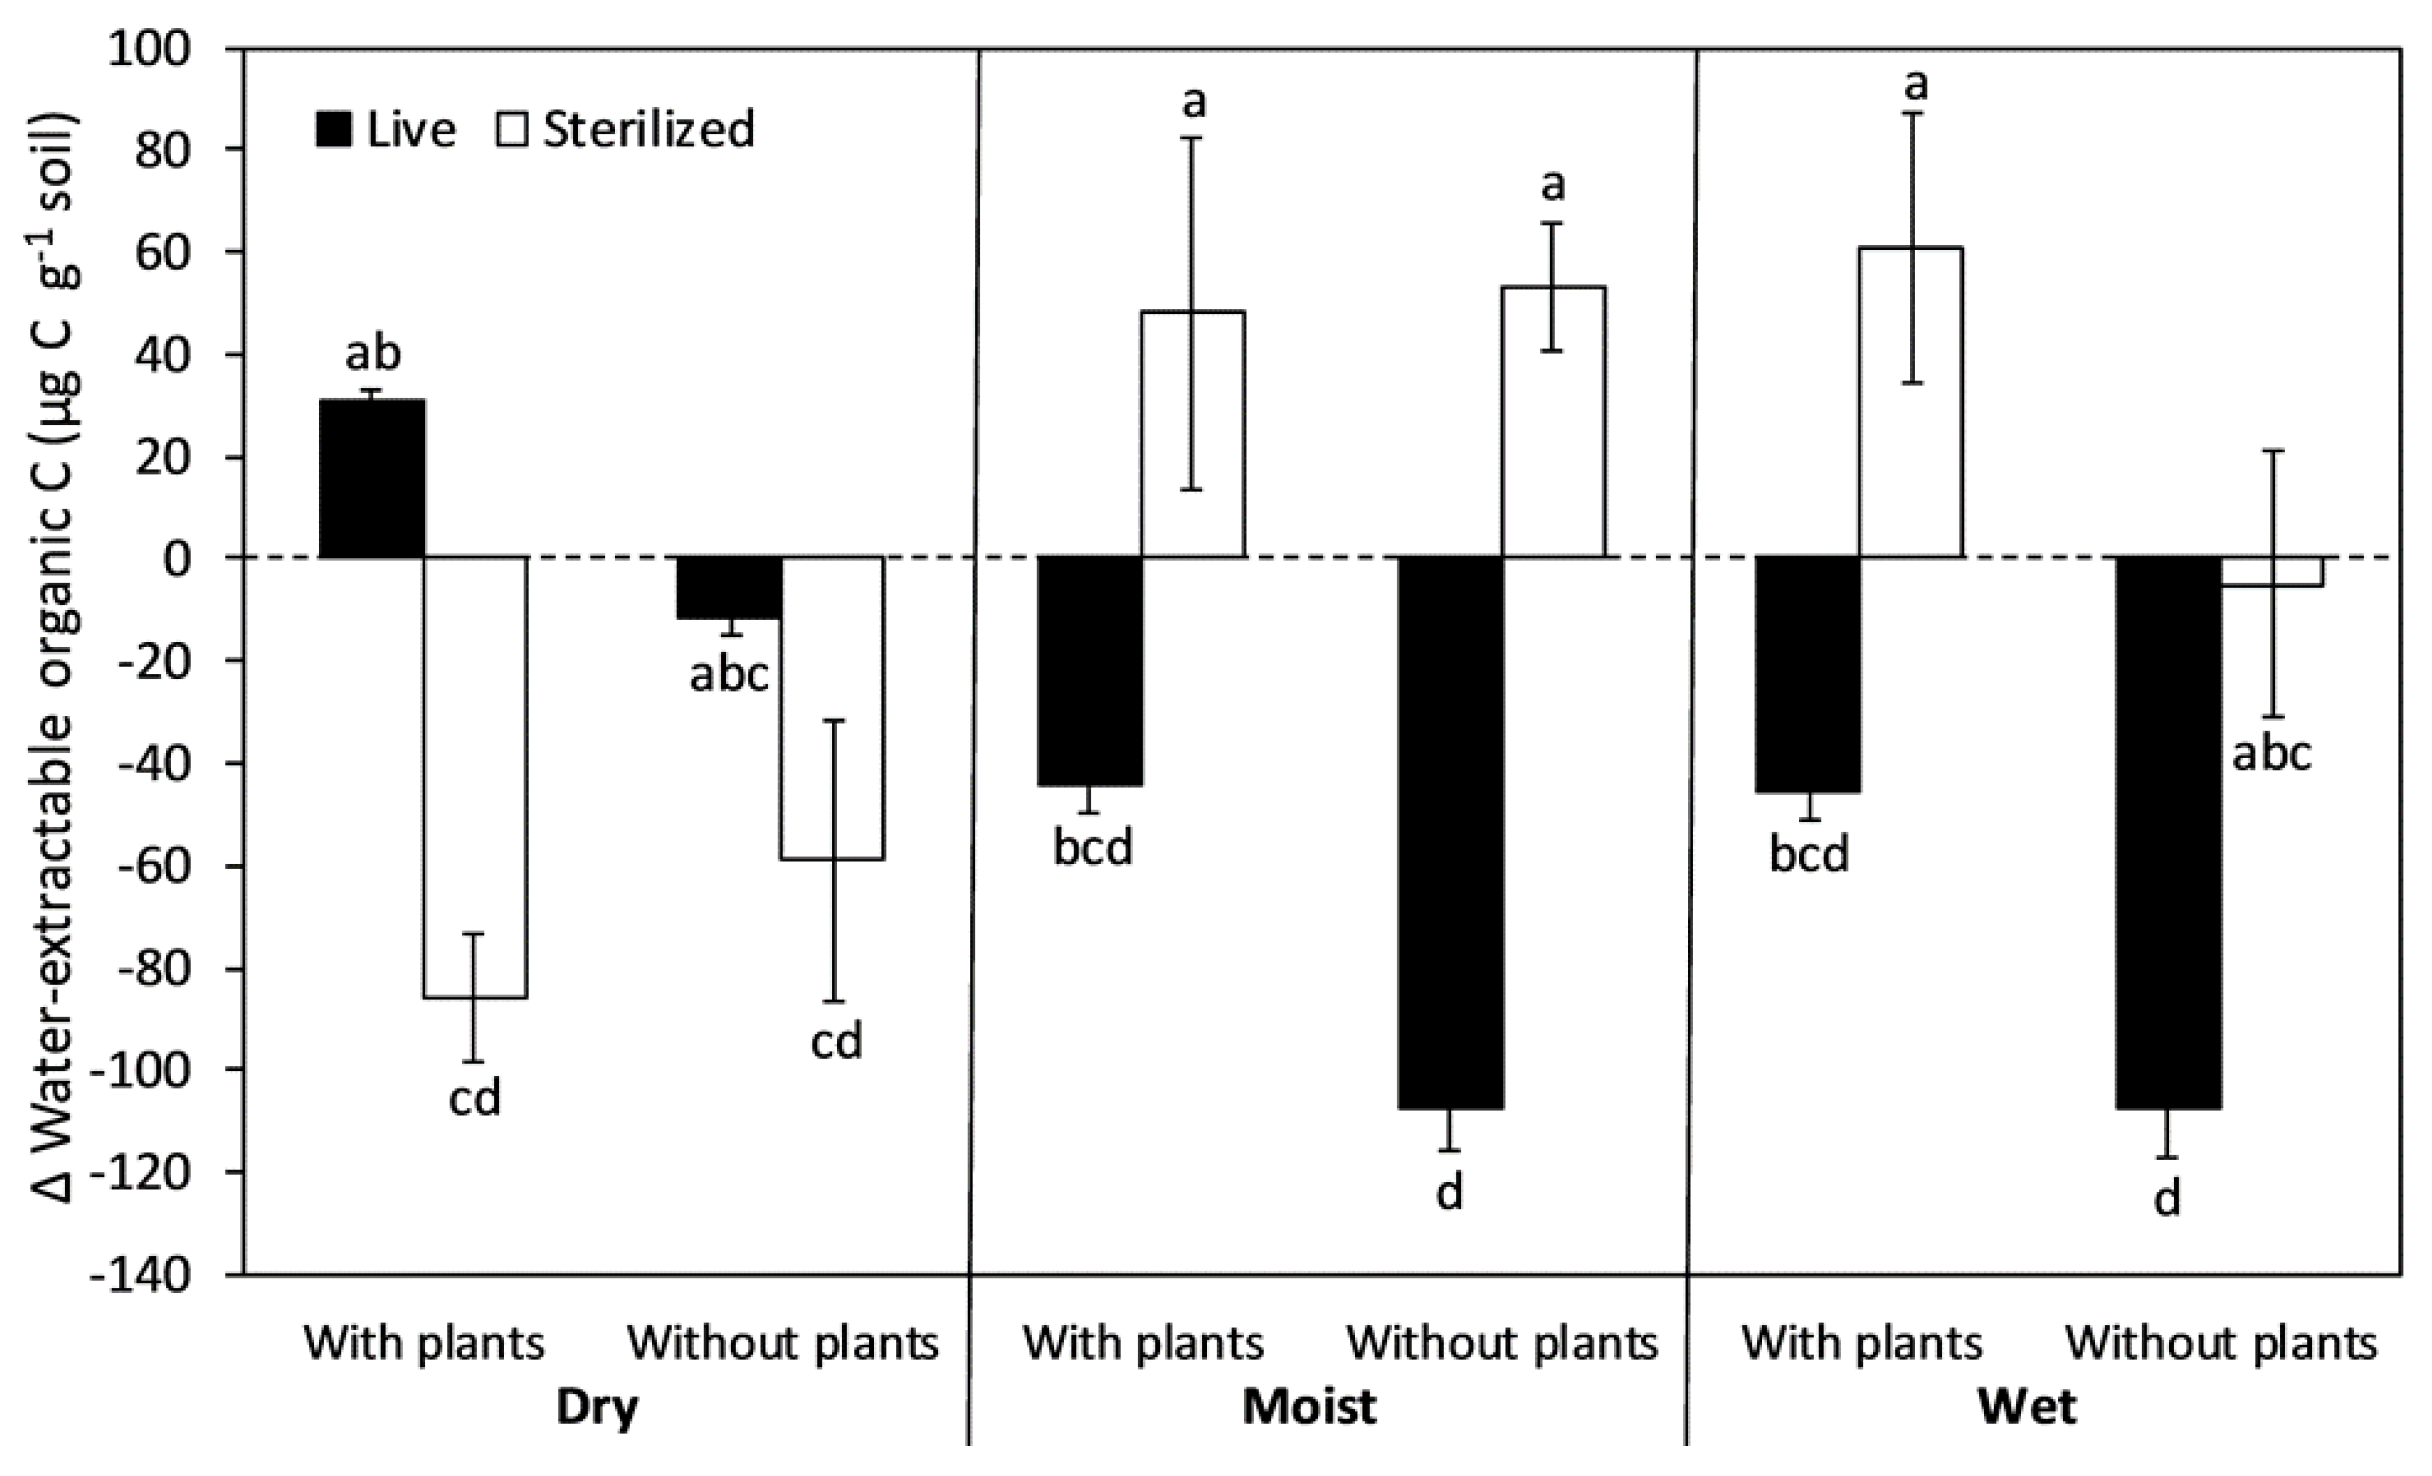
3.3. Water-Extractable Organic Carbon (WEOC)
The net change in soil WEOC during the 8-month incubation ranged from an accumulation of 61 µg C g−1 soil in the wet sterilized treatment with plants to a depletion of 107 µg C g−1 soil in the moist and wet treatments without plants (Figure 3). Effects of plant removal and moisture level depended on the sterilization treatment (Table 1). Plant removal consistently caused a greater depletion of WEOC in live soils, whereas in sterilized soils, plant removal had little effect except in the wet treatment where it tended to decrease WEOC accumulation. Moisture level strongly influenced the response of soil WEOC to sterilization. Under dry conditions, sterilization tended to switch soils from WEOC accumulation to depletion. Under moist and wet conditions, however, sterilization tended to switch soils from WEOC depletion to accumulation. This pattern was strongest when plants were present.
4. Discussion
These full-factorial manipulations of soil microbial biomass, plant inputs, and moisture were intended to promote a more mechanistic understanding of the various biotic and abiotic processes that control dynamics of bioavailable SOC. Microbes and plants were removed from seasonally dry grassland soils—without destroying their physical structure—to help isolate the abiotic signal of adsorption and desorption processes. Soil moisture was varied to help isolate the role of the physical accessibility of substrates for consumption by live microbes versus solubilization by exoenzymes and purely abiotic processes.
Our first prediction was that more WEOC would accumulate in soils with plant inputs from the previous growing season. This prediction was confirmed for soils with living microbes. Microbes, therefore, seemed to be critical in processing recent plant C. Under the driest conditions, WEOC only accumulated in soils with plants, perhaps because microbes produced exoenzymes that were able to decompose and solubilize plant polymers despite limited microbial access to these soluble products [25,30,31]. Accumulation of WEOC may have been even greater if we had considered live plant roots and their many associated microbes [32]. The lack of WEOC accumulation under dry conditions without plants suggests that these organic molecules do not come from recent C inputs. Under moist and wet conditions, WEOC was clearly depleted, particularly when plants were removed, which is consistent with our CO2 emission data showing increased microbial access to substrates. Particularly without recent plant inputs, the soil WEOC pool was unable to keep pace with microbial respiration.
Our first prediction (i.e., more WEOC accumulation in soils with plant inputs from the previous growing season), however, was incorrect for sterilized soils. The WEOC in sterilized soils surprisingly showed little response to plant removal, except under the wettest conditions. If adsorption onto mineral surfaces was responsible for depleting WEOC in dry sterilized soils, then a majority of this adsorption involved existing rather than recently deposited C. For example, it has been theorized that organic molecular fragments self-assemble into layers that adhere to mineral surfaces [33], which our results suggest may be more likely to happen to existing SOC rather than recent plant inputs, and more likely to happen when microbes are not present to intercept these small molecules before they have a chance to adsorb onto organo-mineral surfaces [34,35,36].
When we increased water availability, sterilized soils generally showed a net accumulation of WEOC. A likely explanation for this would be that desorption and exoenzymes were solubilizing SOC, but it was not consumed by microbes. Furthermore, water addition would have diluted the soil solution perhaps making WEOC less likely to adsorb. Moist conditions suggest that the source of WEOC when it accumulated was not exoenzymes, but rather desorption of older, mineral-associated organic matter. However, the wettest conditions suggest that enzymatic breakdown of plant inputs might be a source of bioavailable SOC because WEOC only accumulated with recent plant inputs. Predicting the influence of plant inputs on bioavailable SOC, therefore, appears to be more straightforward for live soil microsites than uncolonized ones.
Our second prediction was that more soil WEOC would accumulate when microbes were killed. This was the case in moist and wet soils. As previously mentioned, water addition seemed to favor the desorption and accumulation of WEOC when microbes were killed. What are the possible sources of this solubilized SOC under sterilized conditions? It is possible that the outer layer of clay-adsorbed SOC may be the most accessible (i.e., the “kinetic zone” in the model of Kleber et al. [32]), and can act as a source of WEOC when there is no microbial uptake. Another possible source is continued extracellular enzyme activity under sterilized conditions [37]; enzymes might continue to solubilize SOC polymers into monomers when there is enough water to support their activity. Accumulation of bioavailable SOC under sterilized conditions challenges the notion that live microbes are the primary replenisher of this pool in mineral soil [9,38]. There are certainly biochemical and purely abiotic processes occurring in sterile microsites in soil that should influence the scientific community’s broader interpretation of soil WEOC.
Strong depletion of soil WEOC under sterile, dry conditions also challenges the dominant role of microbes in maintaining the bioavailable SOC pool. Surprisingly, instead of accumulating WEOC, as occurred when sterile soils had connected water films that promote diffusion, dry conditions made soils a sink for WEOC [34]. Perhaps adsorption and ligand exchange with iron and aluminum oxyhydroxides during dry periods partly explain why the total pool of bioavailable SOC is always much larger than the amount solubilized by any single wetting event [5]. There may be soil microenvironments where bioavailable SOC becomes insoluble and stabilized on or inside organo-mineral particles [15]. This transition from soluble to stable is a key gap in the current mechanistic understanding of soil C sequestration, one critical to resolve if we are to try to reduce atmospheric CO2 by “loading” soils with organic matter that persists for centuries to millennia in an insoluble, protected form [39,40,41,42]. Stabilization of bioavailable SOC by adsorption may be responsible for observations of relatively old radiocarbon in surface soils [43]. Our results point toward dry, uncolonized soil microsites as these adsorption hotspots.
Our third and final prediction was that the greatest amount of soil WEOC would accumulate under dry-live and wet-sterile conditions. This prediction was correct regardless of plant removal, but only for the intermediate soil moisture treatment. For the driest and wettest treatments, this prediction was only correct when plants were present. Under dry-live conditions, WEOC accumulation indicates an active role of live microbes in solubilizing SOC; exoenzymes likely decompose recent plant C inputs, but the soluble products are not immediately accessible to microbes [8,44]. In the field, less precipitation has also been shown to increase accumulation of soil WEOC [31,45]. Under wet-uncolonized conditions, WEOC accumulation indicates the potential for C leakage, although under field conditions microbes would be there to consume that C. Our results suggest that wet but uncolonized soil microsites are a dependable source of bioavailable SOC.
Less soil microbial biomass in wetter soils is not a novel finding [46,47,48], but this pattern remains counterintuitive and does not match with the common pattern of more soil microbial biomass in wetter climates [49] or in manipulative experiments with altered precipitation [50,51]. One possible explanation for less microbial biomass in wetter soils is that connected water films provide greater access for soil fauna (e.g., protozoans and nematodes) and viruses to kill bacteria and fungi [52,53]. This is the top-down, food web, explanation. Greater microbial biomass and diversity [54] in drier soils is consistent with a more hydrologically disconnected microenvironment. The bottom-up, resource supply, explanation for less microbial biomass in wetter soils is that microbes became substrate-limited [55,56,57]. However, this bottom-up explanation is less likely because soil respiration continued at high rates in wet soils (indicating access to substrates). Dry soils probably experienced a more severe substrate limitation, yet the reduction in microbial biomass by water addition was not alleviated by plant inputs from the previous growing season. Although the mechanism(s) is unknown, higher microbial biomass in drier soils challenges the assumption that soil microbes are most abundant when water and live plants are also most abundant.
Our results support the argument that some portion of soil CO2 emission is generated by extracellular or acellular mechanisms, such as exoenzyme activities [22,58,59,60]. In moist and wet soils, we found that sterile CO2 emission accounted for 2–4% of the cumulative soil CO2 flux over 8 months. In dry soils, acellular CO2 emission accounted for 56% in soils with plants and 117% in soils without plants (although the rates remained very low). Although CO2 emissions from dry soils are low, the global land area of arid and semi-arid soils is large [61], as is the contribution of extracellular CO2 emission in dry soil. The contribution of mineral-associated SOC to abiotic soil CO2 emission in seasonally (or perennially) dry ecosystems therefore warrants future research: what are the specific substrates and what are the mechanisms of release? Because chloroform fumigation does not have a 100% killing efficiency [62,63], we also cannot rule out the possibility that live microbes were responsible for a small fraction of CO2 emission in the sterilized treatment. However, if microbes were responsible for CO2 emission in dry soil, then killing microbes should have decreased CO2 emission rather than increasing it. Therefore, extracellular CO2 emission seems likely to be quantitatively important in dry soils.
Scaling up microsite dynamics to soil profiles and landscapes remains a challenge [64,65]. By killing microbes without destroying soil structure, we provide a means to simplify soil structure into four types of common microenvironments: dry-live, dry-uncolonized, wet-live, and wet-uncolonized. It should be noted that most of a soil particle’s surface area is uncolonized at any given time: estimated to be as high as 96–99% uncolonized [66]. By explicitly incorporating microsite differences in biogeochemical dynamics due to water and microbes, it may be possible to improve predictive soil C models for characterizing soil heterogeneity and spatial upscaling to profiles and landscapes [67,68]. If microbial access to soil C depends on the rate that substrates become soluble, then efforts to sequester soil C need to better understand and manage solubilization processes [35]. Our results indicate that dry-live and wet-uncolonized soil microsites are sources of bioavailable SOC whereas dry-uncolonized and wet-live microsites are sinks. However, wet-live microsites are likely less an ultimate sink because a large portion of the C is respired as CO2. In terms of C loading, therefore, dry-uncolonized soil microsites appear to be the most promising candidate. In terms of accumulating bioavailable SOC during dry periods [31], live microsites are most likely responsible. By assigning bioavailable SOC dynamics to specific types of microsites, it may be possible to make mathematical sense of whole-soil or even landscape-scale patterns.
To conclude, our original goal was a more mechanistic understanding of the various biotic and abiotic processes controlling bioavailable SOC (e.g., water-soluble or WEOC). Based on our results, we propose that when the diffusion of soluble resources is constrained, live microbes are most active in processing bioavailable SOC derived from recent plant C inputs, but they compete with adsorption onto organo-mineral surfaces. In wetter soils, increased microbial access predictably depletes bioavailable SOC; rather than competing with biological consumption, however, biochemical and purely abiotic processes both release bioavailable SOC that partly fuels biology. In terms of replenishing bioavailable SOC pools, biological processes appear to be most important under dry conditions whereas physicochemical processes appear most important under wet conditions. In terms of stabilizing bioavailable SOC, on the other hand, the pattern would likely be the reverse: physicochemical processes dominate under dry conditions and biological processes (e.g., microbial residues [69]) dominate wet conditions.
Acknowledgements
We thank Kate McCurdy and staff at the University of California Sedgwick Reserve for site access and logistical support. We thank Kenneth Marchus, David Bustillo, Theo Tzeng, Lauren Croshaw, Keri Opalk, and Jennifer King for their help with laboratory analyses. We thank members of the Schimel Lab at University of California Santa Barbara for constructive feedback on interpreting and presenting data. This work was supported by National Science Foundation grant DEB-1145875.
Author Contributions
Joseph C. Blankinship and Joshua P. Schimel conceived and designed the experiments; Joseph C. Blankinship performed the experiments; Joseph C. Blankinship and Joshua P. Schimel analyzed the data and wrote the paper.
Conflicts of Interest
The authors declare no conflict of interest.
References
- Marschner, B.; Kalbitz, K. Controls of bioavailability and biodegradability of dissolved organic matter in soils. Geoderma 2003, 113, 211–235. [Google Scholar] [CrossRef]
- Von Lützow, M.; Kögel-Knabner, I.; Ekschmitt, K.; Flessa, H.; Guggenberger, G.; Matzner, E.; Marschner, B. SOM fractionation methods: Relevance to functional pools and to stabilization mechanisms. Soil Biol. Biochem. 2007, 39, 2183–2207. [Google Scholar] [CrossRef]
- Marschner, B.; Noble, A.D. Chemical and biological processes leading to the neutralisation of acidity in soil incubated with litter materials. Soil Biol. Biochem. 2000, 32, 805–813. [Google Scholar] [CrossRef]
- Guo, X.; Drury, C.F.; Yang, X.; Reynolds, D.W.; Fan, R. The extent of soil drying and rewetting affects nitrous oxide emissions, denitrification, and nitrogen mineralization. Soil Sci. Soc. Am. J. 2014, 78, 194–204. [Google Scholar] [CrossRef]
- Qualls, R.G. Comparison of the behavior of soluble organic and inorganic nutrients in forest soils. For. Ecol. Manag. 2000, 138, 29–50. [Google Scholar] [CrossRef]
- Fierer, N.; Schimel, J.P. Effects of drying–rewetting frequency on soil carbon and nitrogen transformations. Soil Biol. Biochem. 2002, 34, 777–787. [Google Scholar] [CrossRef]
- Lawrence, C.R.; Neff, J.C.; Schimel, J.P. Does adding microbial mechanisms of decomposition improve soil organic matter models? A comparison of four models using data from a pulsed rewetting experiment. Soil Biol. Biochem. 2009, 41, 1923–1934. [Google Scholar] [CrossRef]
- Schimel, J.P.; Schaeffer, S.M. Microbial control over carbon cycling in soil. Front. Microbiol. 2012, 3, 348. [Google Scholar] [CrossRef] [PubMed]
- Dai, O.H.; David, M.B.; Vance, G.F. Characterization of solid and dissolved carbon in a spruce-fir Spodosol. Biogeochemistry 1996, 35, 339–365. [Google Scholar] [CrossRef]
- Jandl, R.; Sollins, P. Water-extractable soil carbon in relation to the belowground carbon cycle. Biol. Fert. Soils 1997, 25, 196–201. [Google Scholar] [CrossRef]
- Wagai, R.; Sollins, P. Biodegradation and regeneration of water-soluble carbon in a forest soil: Leaching column study. Biol. Fert. Soils 2002, 35, 18–26. [Google Scholar] [CrossRef]
- Kalbitz, K.; Schmerwitz, J.; Schwesig, D.; Matzner, E. Biodegradation of soil-derived dissolved organic matter as related to its properties. Geoderma 2003, 113, 273–291. [Google Scholar] [CrossRef]
- Manzoni, S.; Schimel, J.P.; Porporato, A. Responses of soil microbial communities to water stress: Results from a meta-analysis. Ecology 2012, 93, 930–938. [Google Scholar] [CrossRef] [PubMed]
- Moore, T.R.; De Souza, W.; Koprivnjak, J.F. Controls on the sorption of dissolved organic carbon by soils. Soil Sci. 1992, 154, 120–129. [Google Scholar] [CrossRef]
- Kalbitz, K.; Solinger, S.; Park, J.H.; Michalzik, B.; Matzner, E. Controls on the dynamics of dissolved organic matter in soils: A review. Soil Sci. 2000, 165, 277–304. [Google Scholar] [CrossRef]
- Neff, J.C.; Asner, G.P. Dissolved organic carbon in terrestrial ecosystems: Synthesis and a model. Ecosystems 2001, 4, 29–48. [Google Scholar] [CrossRef]
- Chantigny, M.H. Dissolved and water-extractable organic matter in soils: A review on the influence of land use and management practices. Geoderma 2003, 113, 357–380. [Google Scholar] [CrossRef]
- Reid, I.D.; Abrams, G.D.; Pepper, J.M. Water-soluble products from the degradation of aspen lignin by Phanerochaete chrysosporium. Can. J. Bot. 1982, 60, 2357–2364. [Google Scholar] [CrossRef]
- Sinsabaugh, R.S. Enzymic analysis of microbial pattern and process. Biol. Fert. Soils 1994, 17, 69–74. [Google Scholar] [CrossRef]
- Wallenstein, M.D.; Weintraub, M.N. Emerging tools for measuring and modeling the in situ activity of soil extracellular enzymes. Soil Biol. Biochem. 2008, 40, 2098–2106. [Google Scholar] [CrossRef]
- Kleber, M.; Eusterhues, K.; Keiluweit, M.; Mikutta, C.; Mikutta, R.; Nico, P.S. Chapter one-mineral–organic associations: Formation, properties, and relevance in soil environments. Adv. Agron. 2015, 130, 1–140. [Google Scholar]
- Blankinship, J.C.; Becerra, C.A.; Schaeffer, S.M.; Schimel, J.P. Separating cellular metabolism from exoenzyme activity in soil organic matter decomposition. Soil Biol. Biochem. 2014, 71, 68–75. [Google Scholar] [CrossRef]
- Blankinship, J.C.; Fonte, S.J.; Six, J.; Schimel, J.P. Plant versus microbial controls on soil aggregate stability in a seasonally dry ecosystem. Geoderma 2016, 272, 39–50. [Google Scholar] [CrossRef]
- Silver, W.L.; Lugo, A.E.; Keller, M. Soil oxygen availability and biogeochemistry along rainfall and topographic gradients in upland wet tropical forest soils. Biogeochemistry 1999, 44, 301–328. [Google Scholar] [CrossRef]
- Manzoni, S.; Katul, G. Invariant soil water potential at zero microbial respiration explained by hydrological discontinuity in dry soils. Geophys. Res. Lett. 2014, 41, 7151–7158. [Google Scholar] [CrossRef]
- Anderson, J.P.E.; Domsch, K.H. A physiological method for the quantitative measurement of microbial biomass in soils. Soil Biol. Biochem. 1978, 10, 215–221. [Google Scholar] [CrossRef]
- West, A.W.; Sparling, G.P. Modifications to the substrate-induced respiration method to permit measurement of microbial biomass in soils of differing water contents. J. Microbiol. Methods 1986, 5, 177–189. [Google Scholar] [CrossRef]
- Boyer, J.N.; Groffman, P.M. Bioavailability of water extractable organic carbon fractions in forest and agricultural soil profiles. Soil Biol. Biochem. 1996, 28, 783–790. [Google Scholar] [CrossRef]
- Rees, R.M.; Parker, J.P. Filtration increases the correlation between water extractable organic carbon and soil microbial activity. Soil Biol. Biochem. 2005, 37, 2240–2248. [Google Scholar] [CrossRef]
- Ren, C.; Zhao, F.; Shi, Z.; Chen, J.; Han, X.; Yang, G.; Feng, Y.; Ren, G. Differential responses of soil microbial biomass and carbon-degrading enzyme activities to altered precipitation. Soil Biol. Biochem. 2017, 115, 1–10. [Google Scholar] [CrossRef]
- Schaeffer, S.M.; Homyak, P.M.; Boot, C.M.; Roux-Michollet, D.; Schimel, J.P. Soil carbon and nitrogen dynamics throughout the summer drought in a California annual grassland. Soil Biol. Biochem. 2017, 115, 54–62. [Google Scholar] [CrossRef]
- Cheng, W.; Zhang, Q.; Coleman, D.C.; Carroll, C.R.; Hoffman, C.A. Is available carbon limiting microbial respiration in the rhizosphere? Soil Biol. Biochem. 1996, 28, 1283–1288. [Google Scholar] [CrossRef]
- Kleber, M.; Sollins, P.; Sutton, R. A conceptual model of organo-mineral interactions in soils: Self-assembly of organic molecular fragments into zonal structures on mineral surfaces. Biogeochemistry 2007, 85, 9–24. [Google Scholar] [CrossRef]
- Guggenberger, G.; Kaiser, K.; Zech, W. Mobilization and immobilization of dissolved organic matter in forest soils. J. Plant Nutr. Soil Sci. 1998, 161, 401–408. [Google Scholar] [CrossRef]
- Kalbitz, K.; Schwesig, D.; Rethemeyer, J.; Matzner, E. Stabilization of dissolved organic matter by sorption to the mineral soil. Soil Biol. Biochem. 2005, 37, 1319–1331. [Google Scholar] [CrossRef]
- Keil, R.G.; Mayer, L.M. Mineral matrices and organic matter. Treatise Geochem. Org. Geochem. 2014, 12, 337–359. [Google Scholar]
- Schimel, J.; Becerra, C.A.; Blankinship, J. Estimating decay dynamics for enzyme activities in soils from different ecosystems. Soil Biol. Biochem. 2017, 114, 5–11. [Google Scholar] [CrossRef]
- Nakanishi, T.; Atarashi-Andoh, M.; Koarashi, J.; Saito-Kokubu, Y.; Hirai, K. Carbon isotopes of water-extractable organic carbon in a depth profile of forest soil imply a dynamic relationship with soil carbon. Eur. J. Soil Sci. 2012, 63, 495–500. [Google Scholar] [CrossRef]
- Six, J.; Conant, R.T.; Paul, E.A.; Paustian, K. Stabilization mechanisms of soil organic matter: Implications for C-saturation of soils. Plant Soil 2002, 241, 155–176. [Google Scholar] [CrossRef]
- Lal, R. Soil carbon sequestration impacts on global climate change and food security. Science 2004, 304, 1623–1627. [Google Scholar] [CrossRef] [PubMed]
- Paustian, K.; Lehmann, J.; Ogle, S.; Reay, D.; Robertson, G.P.; Smith, P. Climate-smart soils. Nature 2016, 532, 49–57. [Google Scholar] [CrossRef] [PubMed]
- Jackson, R.B.; Lajtha, K.; Crow, S.E.; Hugelius, G.; Kramer, M.G.; Piñeiro, G. The ecology of soil carbon: Pools, vulnerabilities, and biotic and abiotic controls. Annu. Rev. Ecol. Evol. Syst. 2017, 48, 419–445. [Google Scholar] [CrossRef]
- Ahrens, B.; Braakhekke, M.C.; Guggenberger, G.; Schrumpf, M.; Reichstein, M. Contribution of sorption, DOC transport and microbial interactions to the 14C age of a soil organic carbon profile: Insights from a calibrated process model. Soil Biol. Biochem. 2015, 88, 390–402. [Google Scholar] [CrossRef]
- Dungait, J.A.; Hopkins, D.W.; Gregory, A.S.; Whitmore, A.P. Soil organic matter turnover is governed by accessibility not recalcitrance. Glob. Chang. Biol. 2012, 18, 1781–1796. [Google Scholar] [CrossRef]
- Zsolnay, A.; Görlitz, H. Water extractable organic matter in arable soils: Effects of drought and long-term fertilization. Soil Biol. Biochem. 1994, 26, 1257–1261. [Google Scholar] [CrossRef]
- Zhang, Q.; Zak, J.C. Effects of water and nitrogen amendment on soil microbial biomass and fine root production in a semi-arid environment in West Texas. Soil Biol. Biochem. 1998, 30, 39–45. [Google Scholar] [CrossRef]
- Parker, S.S.; Schimel, J.P. Soil nitrogen availability and transformations differ between the summer and the growing season in a California grassland. Appl. Soil Ecol. 2011, 48, 185–192. [Google Scholar] [CrossRef]
- Ma, L.; Guo, C.; Lü, X.; Yuan, S.; Wang, R. Soil moisture and land use are major determinants of soil microbial community composition and biomass at a regional scale in northeastern China. Biogeosciences 2015, 12, 2585–2596. [Google Scholar] [CrossRef]
- Insam, H. Are the soil microbial biomass and basal respiration governed by the climatic regime? Soil Biol. Biochem. 1990, 22, 525–532. [Google Scholar] [CrossRef]
- Blankinship, J.C.; Niklaus, P.A.; Hungate, B.A. A meta-analysis of responses of soil biota to global change. Oecologia 2011, 165, 553–565. [Google Scholar] [CrossRef] [PubMed]
- Ren, C.; Chen, J.; Lu, X.; Doughty, R.; Zhao, F.; Zhong, Z.; Han, X.; Yang, G.; Feng, Y.; Ren, G. Responses of soil total microbial biomass and community compositions to rainfall reductions. Soil Biol. Biochem. 2018, 116, 4–10. [Google Scholar] [CrossRef]
- Vargas, R.; Hattori, T. Protozoan predation of bacterial cells in soil aggregates. FEMS Microbiol. Lett. 1986, 38, 233–242. [Google Scholar] [CrossRef]
- Van Veen, J.A.; van Overbeek, L.S.; van Elsas, J.D. Fate and activity of microorganisms introduced into soil. Microbiol. Mol. Biol. Rev. 1997, 61, 121–135. [Google Scholar] [PubMed]
- Carson, J.K.; Gonzalez-Quiñones, V.; Murphy, D.V.; Hinz, C.; Shaw, J.A.; Gleeson, D.B. Low pore connectivity increases bacterial diversity in soil. Appl. Environ. Microbiol. 2010, 76, 3936–3942. [Google Scholar] [CrossRef] [PubMed]
- Vance, E.D.; Chapin, F.S. Substrate limitations to microbial activity in taiga forest floors. Soil Biol. Biochem. 2001, 33, 173–188. [Google Scholar] [CrossRef]
- Schimel, J.P.; Weintraub, M.N. The implications of exoenzyme activity on microbial carbon and nitrogen limitation in soil: A theoretical model. Soil Biol. Biochem. 2003, 35, 549–563. [Google Scholar] [CrossRef]
- Brooks, P.D.; McKnight, D.; Elder, K. Carbon limitation of soil respiration under winter snowpacks: Potential feedbacks between growing season and winter carbon fluxes. Glob. Chang. Biol. 2005, 11, 231–238. [Google Scholar] [CrossRef]
- Maire, V.; Alvarez, G.; Colombet, J.; Comby, A.; Despinasse, R.; Dubreucq, E.; Joly, M.; Lehours, A.-C.; Perrier, V.; Shahzad, T.; et al. An unknown oxidative metabolism substantially contributes to soil CO2 emissions. Biogeosciences 2013, 10, 1155–1167. [Google Scholar] [CrossRef]
- Kéraval, B.; Lehours, A.C.; Colombet, J.; Amblard, C.; Alvarez, G.; Fontaine, S. Soil carbon dioxide emissions controlled by an extracellular oxidative metabolism identifiable by its isotope signature. Biogeosciences 2016, 13, 6353–6362. [Google Scholar] [CrossRef]
- Wang, B.; Lerdau, M.; He, Y. Widespread production of nonmicrobial greenhouse gases in soils. Glob. Chang. Biol. 2017, 23, 4472–4482. [Google Scholar] [CrossRef] [PubMed]
- Feng, S.; Fu, Q. Expansion of global drylands under a warming climate. Atmos. Chem. Phys. 2013, 13, 10081–10094. [Google Scholar] [CrossRef]
- Jenkinson, D.S.; Powlson, D.S. The effects of biocidal treatments on metabolism in soil—I. fumigation with chloroform. Soil Biol. Biochem. 1976, 8, 167–177. [Google Scholar] [CrossRef]
- Zelles, L.; Palojärvi, A.; Kandeler, E.; von Lützow, M.; Winter, K.; Bai, Q.Y. Changes in soil microbial properties and phospholipid fatty acid fractions after chloroform fumigation. Soil Biol. Biochem. 1997, 29, 1325–1336. [Google Scholar] [CrossRef]
- Gärdenäs, A.I.; Ågren, G.I.; Bird, J.A.; Clarholm, M.; Hallin, S.; Ineson, P.; Kätterer, T.; Knicker, H.; Nilsson, S.I.; Näsholm, T.; et al. Knowledge gaps in soil carbon and nitrogen interactions–from molecular to global scale. Soil Biol. Biochem. 2011, 43, 702–717. [Google Scholar] [CrossRef]
- Vereecken, H.; Schnepf, A.; Hopmans, J.W.; Javaux, M.; Or, D.; Roose, T.; Vanderborght, J.; Young, M.H.; Amelung, W.; Aitkenhead, M.; et al. Modeling soil processes: Review, key challenges, and new perspectives. Vadose Zone J. 2016, 15, 57. [Google Scholar] [CrossRef] [Green Version]
- Holden, P.A.; Ritz, K.; Young, I. How do the microhabitats framed by soil structure impact soil bacteria and the processes that they regulate. In The Architecture and Biology of Soils: Life in Inner Space; CABI: Cambridge, MA, USA, 2011; p. 118. [Google Scholar]
- Manzoni, S.; Porporato, A. Soil carbon and nitrogen mineralization: Theory and models across scales. Soil Biol. Biochem. 2009, 41, 1355–1379. [Google Scholar] [CrossRef]
- Wieder, W.R.; Allison, S.D.; Davidson, E.A.; Georgiou, K.; Hararuk, O.; He, Y.; Hopkins, F.; Luo, Y.; Smith, M.J.; Sulman, B.N.; et al. Explicitly representing soil microbial processes in Earth system models. Glob. Biogeochem. Cycles 2015, 29, 1782–1800. [Google Scholar] [CrossRef]
- Kallenbach, C.M.; Frey, S.D.; Grandy, A.S. Direct evidence for microbial-derived soil organic matter formation and its ecophysiological controls. Nat. Commun. 2016, 7, 13630. [Google Scholar] [CrossRef] [PubMed]
Figure 1.
Glucose-induced soil respiration as a proxy for total soil microbial biomass at the end of an 8-month incubation with and without chloroform sterilization. The dry, moist, and wet treatments were maintained at 5%, 25%, and 50% of soil water-holding capacity, respectively. The soils without plants were from field plots in an annual grassland where all grasses and forbs were continuously removed for the entire preceding growing season. The columns and bars show means and standard errors (n = 6). Letters indicate differences using Tukey HSD post hoc tests at an alpha level of 0.05. The dashed line shows initial rates at the start of the incubation.

Figure 2.
Cumulative soil CO2 emission during an 8-month incubation in grassland soils exposed to full-factorial combinations of chloroform sterilization, plant removal, and water addition. The columns and bars show means and standard errors (n = 6). Letters indicate differences using Tukey HSD post hoc tests at an alpha level of 0.05.

Figure 3.
Net change in soil water-extractable organic carbon (WEOC) during 8-month incubations after exposure to full-factorial combinations of chloroform sterilization, plant removal, and water addition. The columns and bars show means and standard errors (n = 6). Positive values indicate an accumulation of WEOC whereas negative values indicate a depletion. Letters indicate differences using Tukey HSD post hoc tests at an alpha level of 0.05.

Table 1.
Three-way ANOVA results for the effects of full-factorial treatments of continuous chloroform sterilization, plant removal, and soil water availability on the soil microbial biomass (estimated by substrate-induced respiration), cumulative CO2 emission, and the net change in water-extractable organic carbon (WEOC).
| Treatment | df | Microbial Biomass | Cumulative CO2 Emission | WEOC | |||
|---|---|---|---|---|---|---|---|
| F stat | p-value | F stat | p-value | F stat | p-value | ||
| Ster | 1 | 485.45 | <0.0001 * | 719.51 | <0.0001 * | 25.06 | <0.0001 * |
| Plant | 1 | 1.14 | 0.29 | 12.03 | 0.0010 * | 11.41 | 0.0014 * |
| H2O | 2 | 109.42 | <0.0001 * | 206.33 | <0.0001 * | 1.19 | 0.31 |
| Ster × Plant | 1 | 1.46 | 0.23 | 11.47 | 0.0013 | 5.04 | 0.029 * |
| Ster × H2O | 2 | 84.54 | <0.0001 * | 190.46 | <0.0001 * | 44.77 | <0.0001 * |
| Plant × H2O | 2 | 1.61 | 0.21 | 3.14 | 0.051 * | 2.83 | 0.068 |
| Ster × Plant × H2O | 2 | 1.29 | 0.28 | 2.83 | 0.067 | 1.55 | 0.22 |
Notes: ‘Ster’ refers to laboratory sterilization; ‘Plant’ refers to field plant removal; ‘H2O’ refers to laboratory soil moisture manipulation; ‘df’ is numerator degrees of freedom; * indicates p-value ≤0.05.
© 2018 by the authors. Licensee MDPI, Basel, Switzerland. This article is an open access article distributed under the terms and conditions of the Creative Commons Attribution (CC BY) license (http://creativecommons.org/licenses/by/4.0/).
Share and Cite
MDPI and ACS Style
Blankinship, J.C.; Schimel, J.P. Biotic versus Abiotic Controls on Bioavailable Soil Organic Carbon. Soil Syst. 2018, 2, 10. https://doi.org/10.3390/soilsystems2010010
AMA Style
Blankinship JC, Schimel JP. Biotic versus Abiotic Controls on Bioavailable Soil Organic Carbon. Soil Systems. 2018; 2(1):10. https://doi.org/10.3390/soilsystems2010010
Chicago/Turabian StyleBlankinship, Joseph C., and Joshua P. Schimel. 2018. "Biotic versus Abiotic Controls on Bioavailable Soil Organic Carbon" Soil Systems 2, no. 1: 10. https://doi.org/10.3390/soilsystems2010010