Microscopic Effect on Filamentary Coherent Structure Dynamics in Boundary Layer Plasmas


1
National Institute for Fusion Science (NIFS), National Institutes of Natural Sciences (NINS), Toki, Gifu 509-5292, Japan
2
Department of Fusion Science, SOKENDAI (The Graduate University for Advanced Studies), Toki, Gifu 509-5292, Japan
*
Author to whom correspondence should be addressed.
Plasma 2018, 1(1), 61-67; https://doi.org/10.3390/plasma1010006
Submission received: 5 March 2018
/
Revised: 19 March 2018
/
Accepted: 19 March 2018
/
Published: 22 March 2018
(This article belongs to the Special Issue Multiscale Methods in Plasma Physics)
Abstract
:This study has demonstrated kinetic behaviors on the plasma filament propagation with the three-dimensional (3D) Particle-in-Cell (PIC) simulation. When the ion-to-electron temperature ratio is higher, the poloidal symmetry breaking in the filament propagation occurs. The poloidal symmetry breaking is thought to be induced by the unbalanced potential structure that arises from the effect of the gyro motion of plasma particles.
1. Introduction
In recent magnetic plasma confinement experiments, the radial density profile of boundary layer plasmas has been observed to be flatter than the exponential profile expected by the diffusive radial transport [1]. Such a flat profile is thought to be provided by the intermittent filamentary coherent structures along the magnetic field line, which are called “blobs” [2]. The filamentary structures in boundary layers have been observed in various experiments [3,4,5,6,7,8,9,10,11,12,13,14] (a large number of the experiments are also listed in Tables II and III in Ref. [15]). In addition, filamentary structures similar to blobs are universally found in astrophysical and space plasmas, e.g., the filamentary structures along the flux tubes on the surface of the sun [16]. Since there is the possibility that such a non-diffusive radial transport damages the vessel wall of a magnetic confinement device, many authors have theoretically and numerically investigated dynamics of the blob propagation on the basis of two-dimensional reduced fluid models [14,15]. These previous works revealed that the size of a blob, , is on the order of , where is defined by , is the ion acoustic speed given by , is the ion cyclotron frequency, is the electron temperature, and is the ion mass. This fact indicates that the blob size on the cross-section is slightly larger than the ion Larmor radius. That is, it is possible for some kinetic effects to influence the macroscopic dynamics of blob. Thus, we have studied such multiscale physics on the filament dynamics by using the three-dimensional (3D) electrostatic particle-in-cell (PIC) simulation code [17,18,19,20,21]. In this paper, we investigate the dependence of the blob behaviors on the temperature ratio between ion and electron, , i.e., the ion Larmor radius, with the 3D-PIC code. The 3D-PIC simulation method used in this work is briefly described in Section 2. In Section 3, we show the simulation results, which reveal that the poloidal symmetry breaking occurs in high plasmas. In Section 4 and Section 5, we offer discussion and summarize our work.
2. Methods
In this section, we briefly describe the simulation method and configuration. In the 3D-PIC simulation, an external magnetic field is set to be parallel to the z-axis and the magnitude of the magnetic field is given by , i.e., , where is the system size in the x direction and is the magnetic field strength at . This means that the , y, and z directions correspond to the radial, poloidal, and toroidal directions, respectively. In the y and z directions, the periodic boundary condition is applied. A plasma blob is initially set as a cylindrical profile along the magnetic field between both edges. The initial density profile of the blob in the poloidal cross-section is given by the Gauss distribution with the radial and poloidal widths, and . The simulation parameters are as follows. The ion-to-electron mass ratio is . The external magnetic field strength at is . The radial and poloidal sizes of a blob are . The initial ratio between the ion and electron temperatures is set as , , or . Therefore, the ion Larmor radius is , , or . In order to confirm some physical properties, any additional collision processes [22] and heat and particle sources are not included in the calculation. Other parameters, e.g., the system size, the number of spatial cells, and the initial blob density amplitude, are the same as those in Ref. [21]. In addition, the detailed descriptions regarding the simulation code and the calculation of the position of the electron center of mass in a blob can be found in Ref. [21].
3. Results
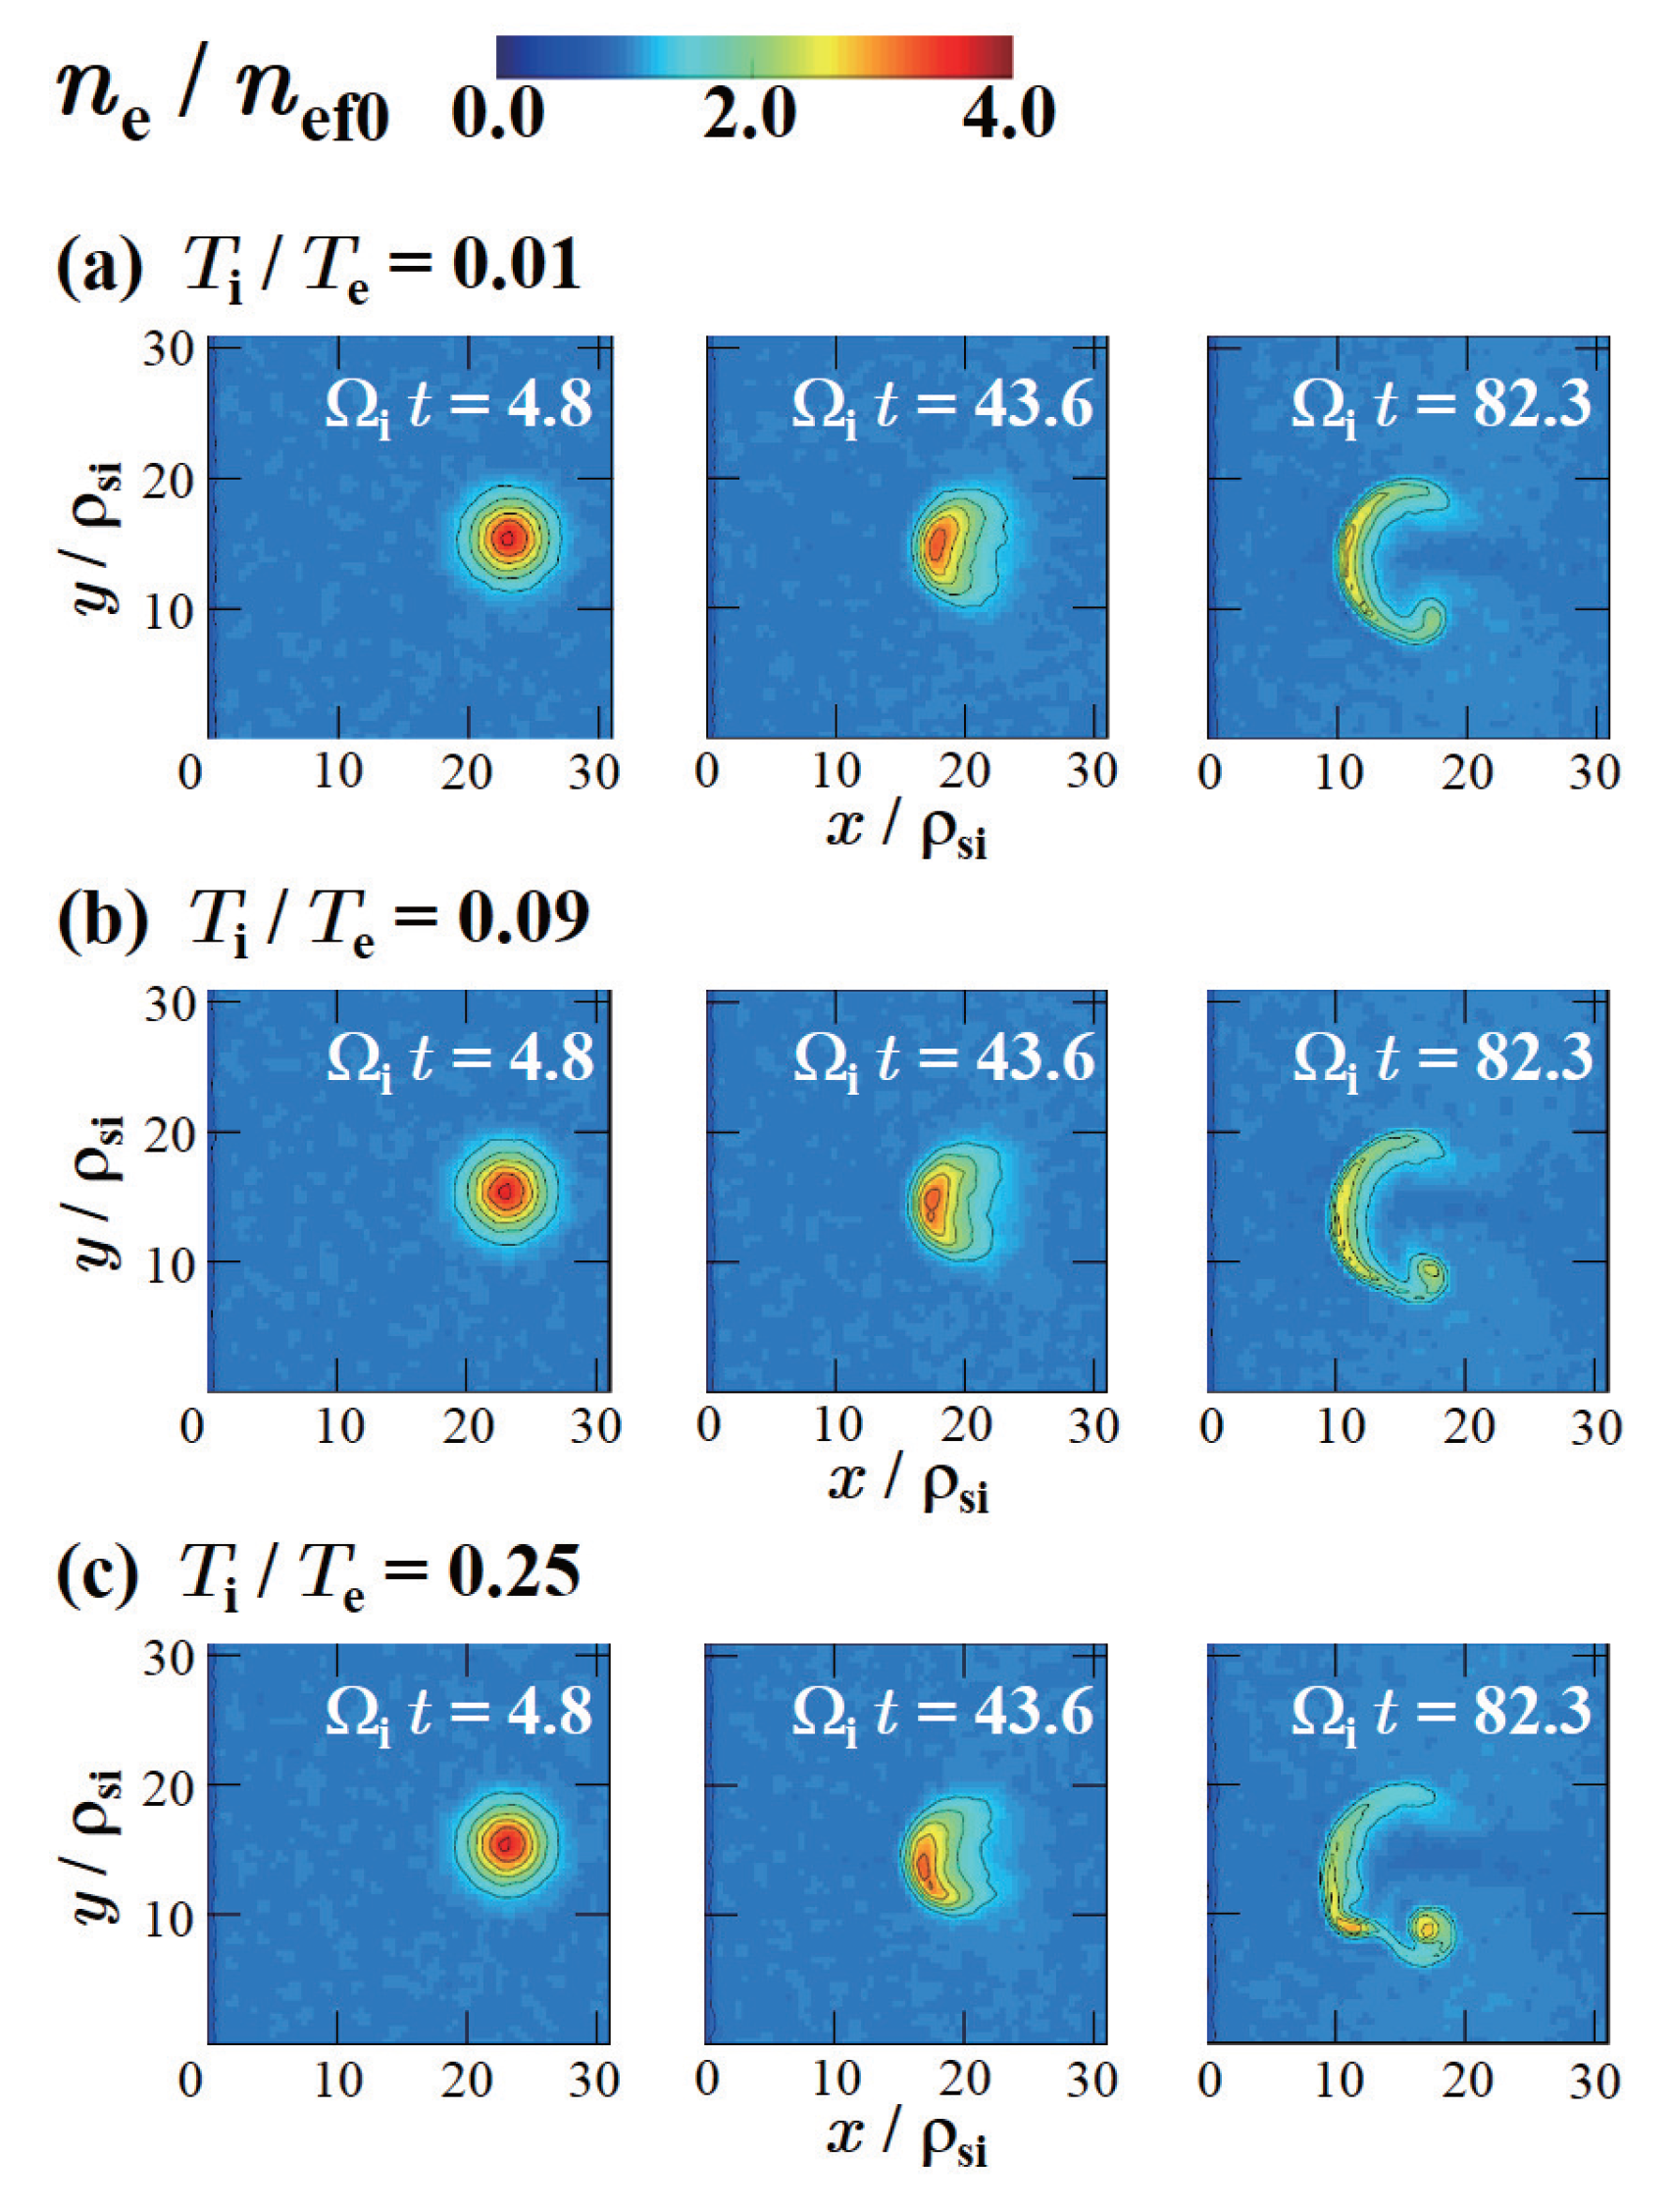
Figure 1 demonstrates the blob propagations in various cases. As shown in Figure 1a where , the propagation in the radial () direction is observed to be symmetric in the poloidal (y) direction, which is in agreement with the previous results based on the fluid model [23]. However, Figure 1b,c indicate that the poloidal symmetry breaking in the blob propagation occurs in the high cases.
The poloidal symmetry breaking induces the poloidal motion of the blob as seen from Figure 2, which shows the time variations of the poloidal component of the position of the electron center of mass in a blob, . From Figure 2, it is found that the blob poloidal velocity is larger in the higher cases than that in the low case. Furthermore, the poloidal motion induced by the symmetry breaking makes the radial propagation slower than the theoretical velocity. Figure 3 represents the time variations of the x component of the position of the electron center of mass in a blob, . We calculate the radial propagation velocity of a blob from these data between and 70, and show the relation between and the observed radial propagation velocity in Figure 4 in which the theoretical velocity represented by the broken line is derived from Equation (33) in Ref. [21], which is proportional to . Figure 4 indicates that the observed propagation velocity in the high case is much slower than the theoretical propagation velocity . The observed deviation from the theoretical propagation velocity is thought to occur due to the poloidal motion, i.e., the symmetry breaking. The origin of the deviation is discussed in Section 4. It is also found that the deceleration of the radial propagation occurs after in Figure 3. The deceleration in the final stage may arise from the collapse of the blob shape.
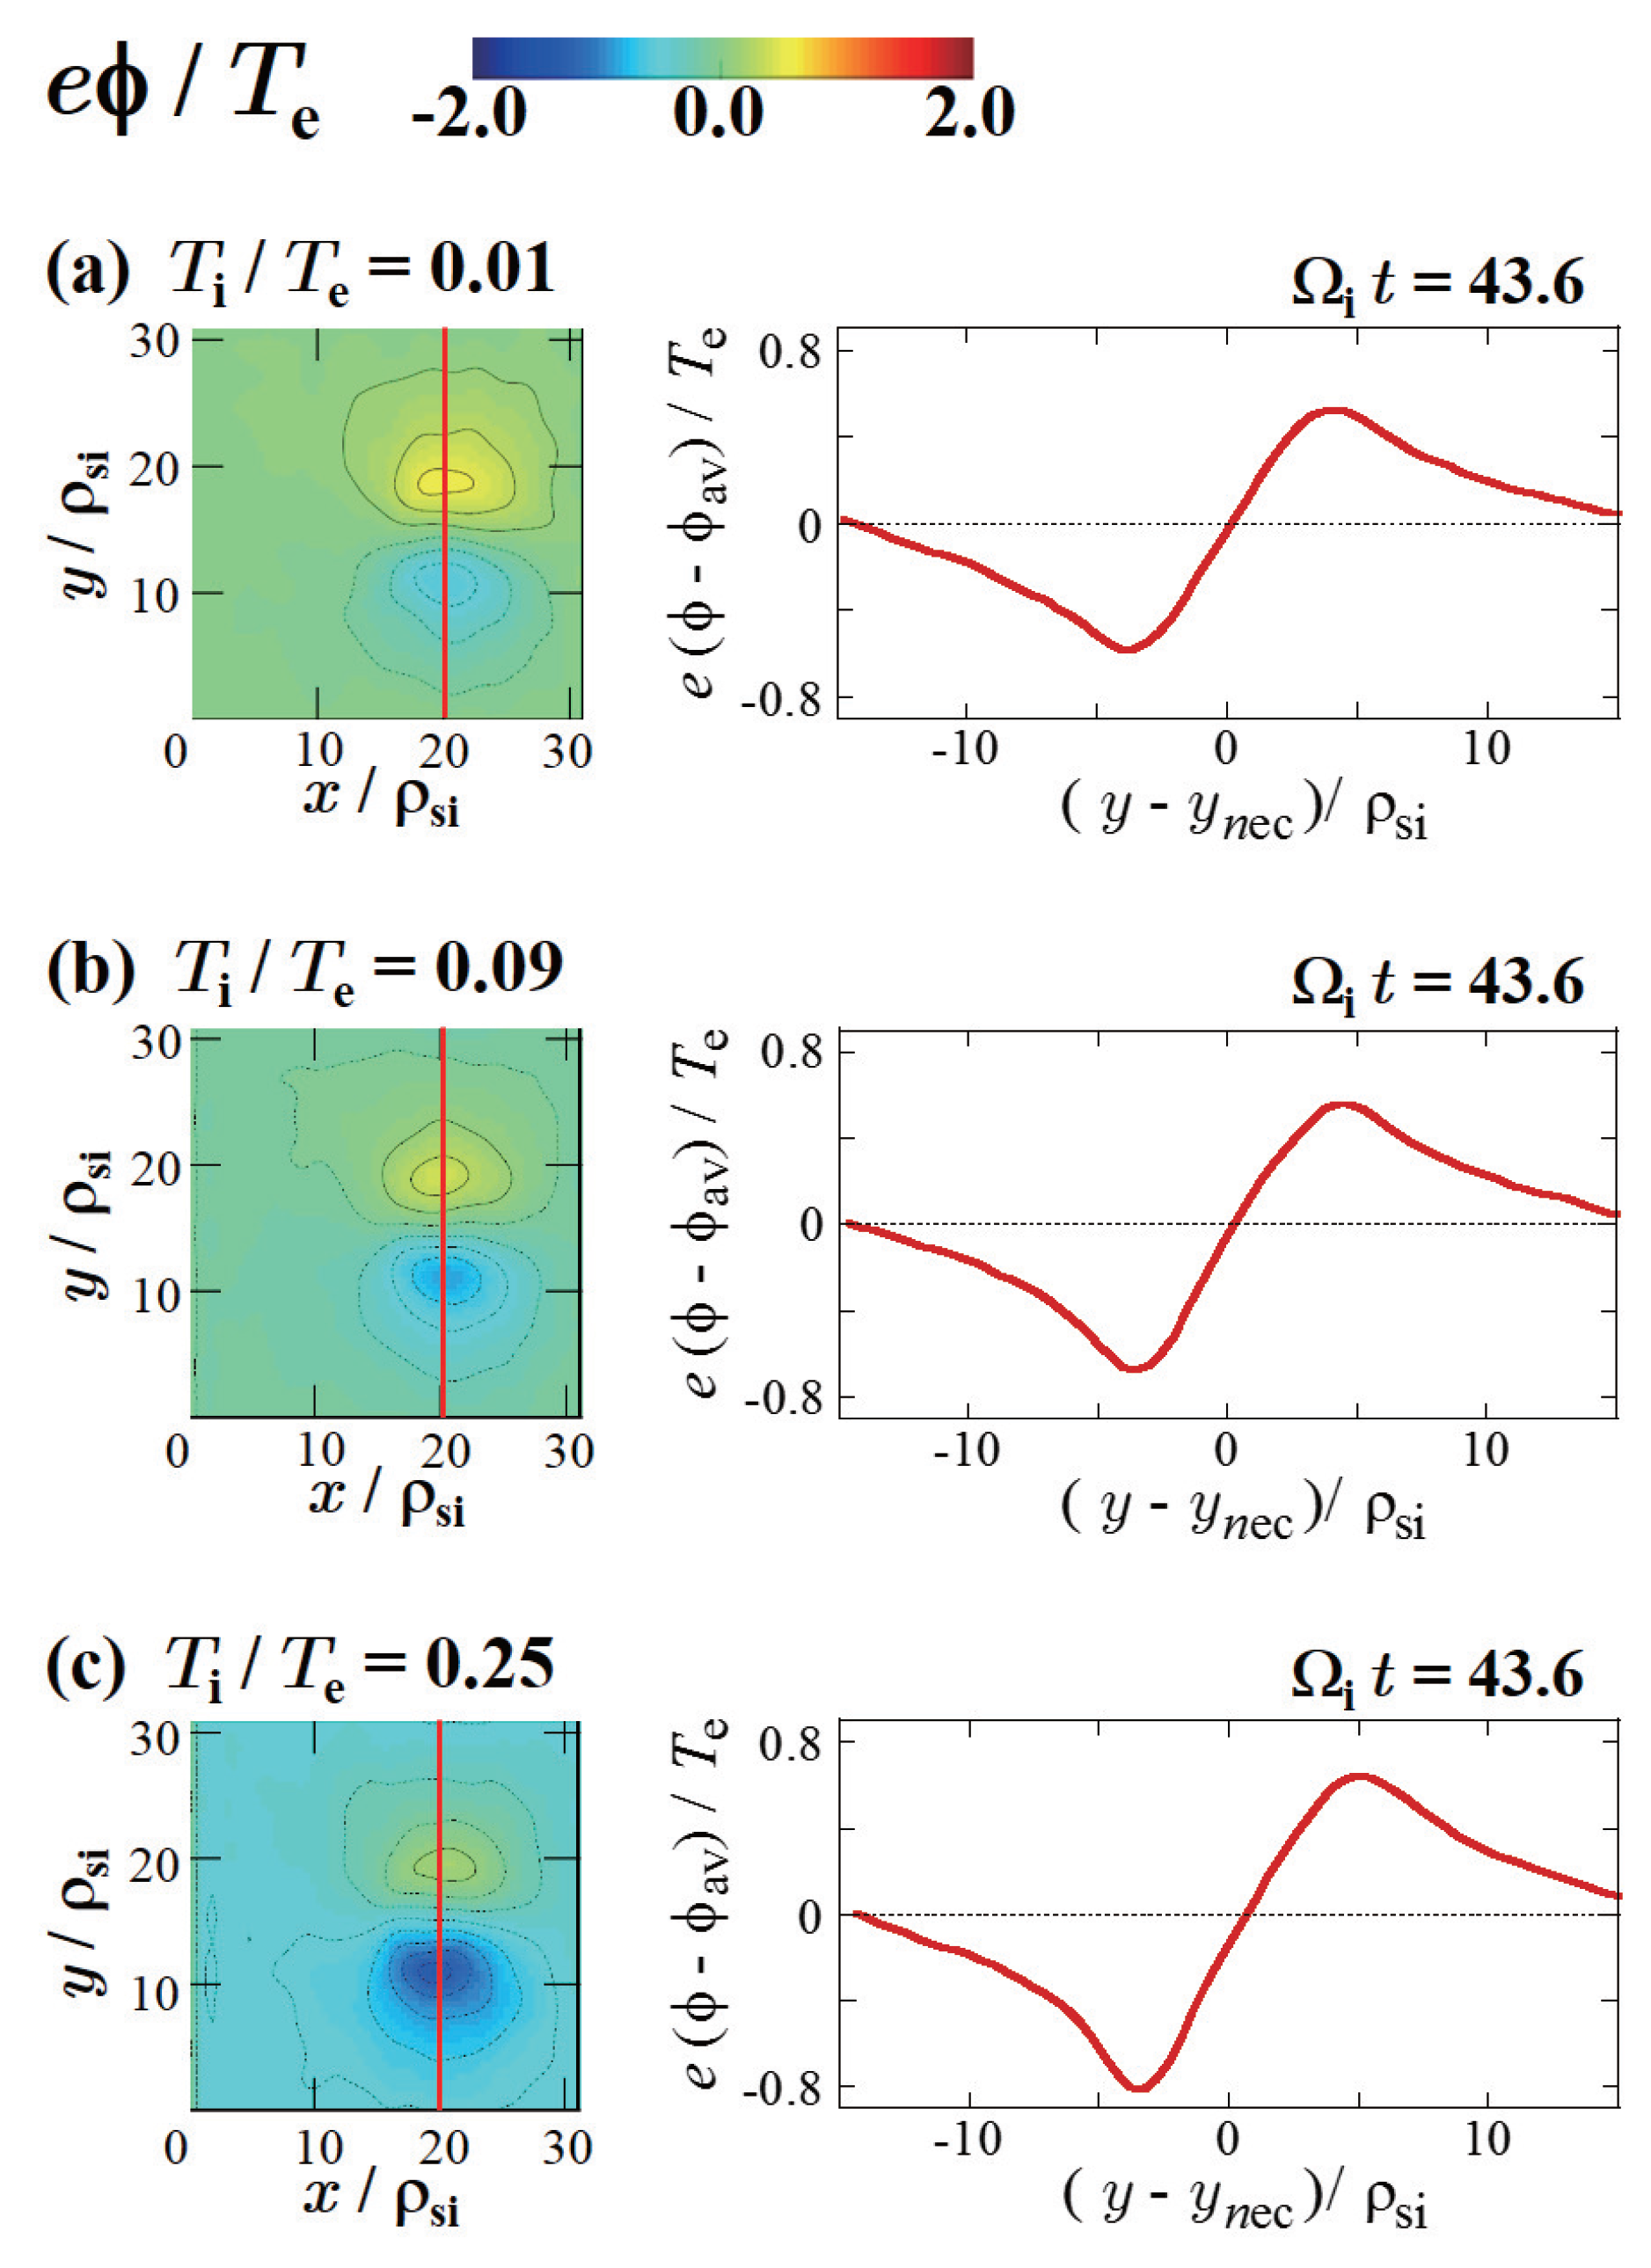
In order to investigate the origin of the poloidal symmetry breaking on the blob propagation, the electric potential structure in a blob is analyzed. In a blob, the dipole potential structure in the poloidal cross-section is produced with the charge separation by the grad-B drift. The drift induced by such a potential structure moves the blob and collapses the blob into a mushroom shape as shown in Figure 1a. On the other hand, Figure 5 shows that the peak of the potential hill, , becomes smaller than that of the potential well, , in the higher cases, where , , and are the maximum, the minimum, and the average values of potential, respectively. On each 1D profile shown in the right panels in Figure 5, the ratios between the amplitude of the potential hill and the amplitude of the potential well are observed as , , and . Such an unbalanced dipole potential structure in a blob in the high plasma is thought to arise from the broader distribution of positive charge than that of negative charge due to the large ion Larmor radius. In such a potential structure, the drift on the potential well side is more intense than that on the potential hill side. Therefore, more plasma particles are transported to the potential well side and the poloidal symmetry breaking appears.
4. Discussion
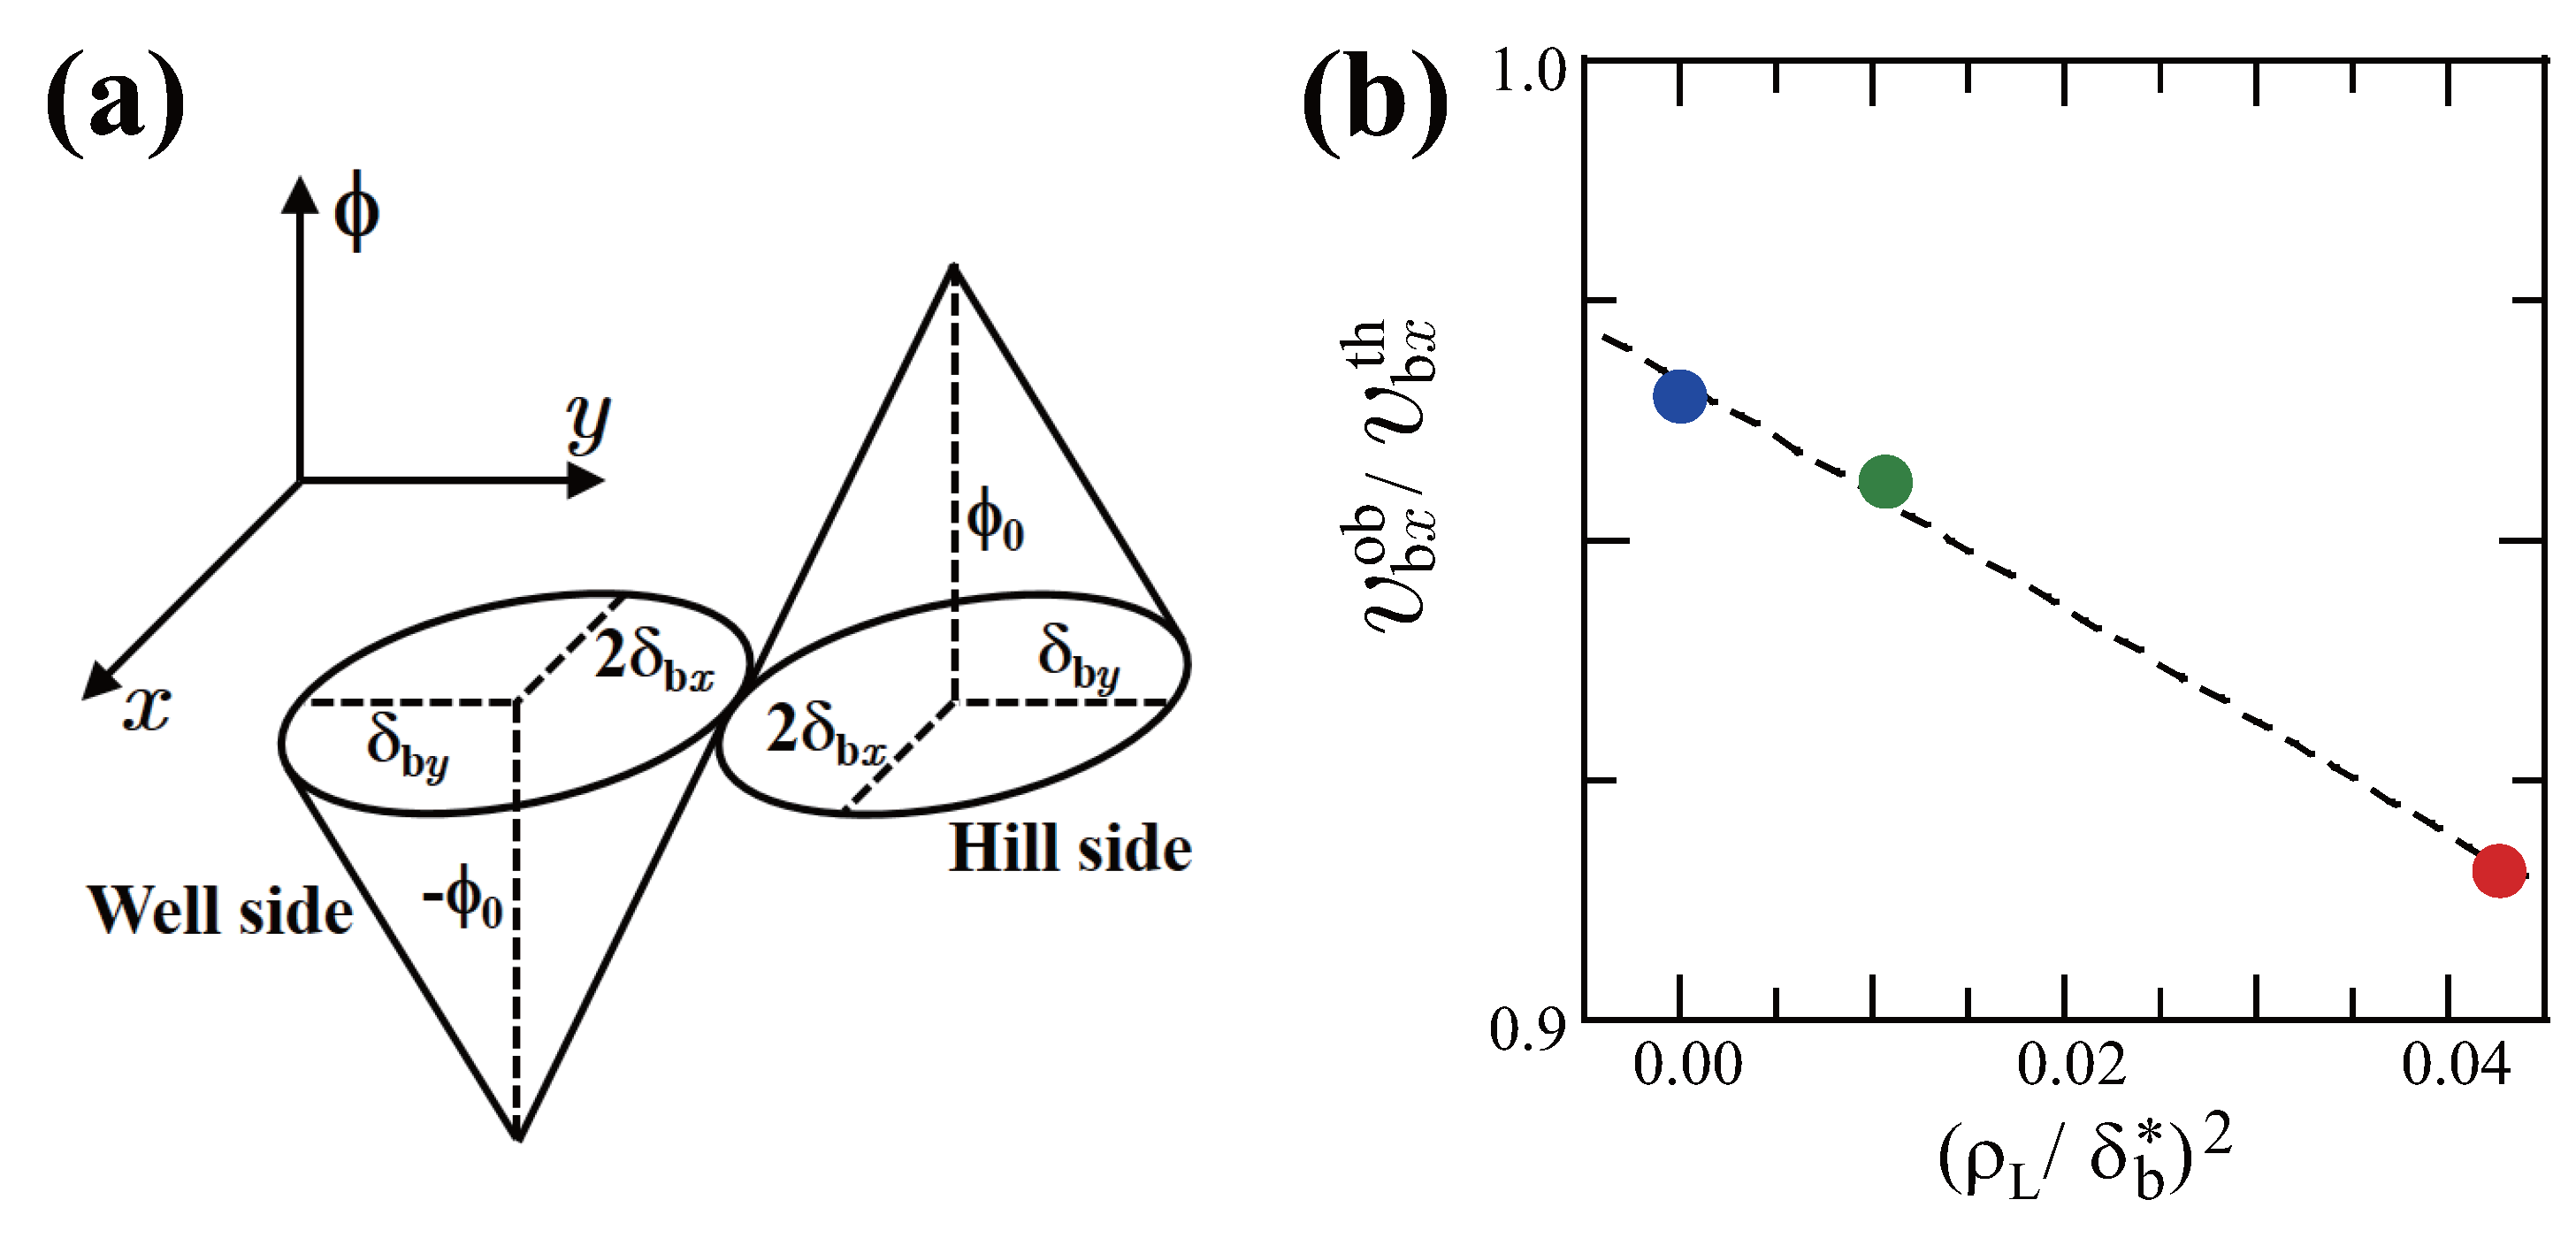
Here, the deviation of the radial propagation from the theoretical velocity by the unbalanced dipole potential structure in a blob is roughly estimated. We assume that the potential forms on the hill side and the well side are simple elliptical cones as shown in Figure 6a, in which the height and the lengths of the radial and poloidal semi-axes of the base are given by , , and , respectively, and that the volumes of each cone are kept constant as . In this simple estimation, the radial propagation velocity without considering the ion gyro motion effect is given by , where B is the magnitude of the magnetic field. If the lengths of the radial and poloidal semi-axes of the base become and , respectively, on the hill (+)/well (−) side with considering the ion gyro motion effect, the modified heights on each side are obtained as
and
where is defined by , and are the ion and electron Larmor radii, respectively, and is the coefficient for the ion gyro motion effect. Thus, the mean poloidal velocity in the front of a blob is estimated as
Assuming that the magnitude of the blob velocity is kept constant as , the estimation of the radial propagation velocity in the finite plasmas is obtained as
where . This means that has a linear relation with , which is indicated by Figure 6b where the relation between and is shown.
In the simulations shown in Section 3, the slightly moderate values are chosen for because this paper focuses on the investigation of the fundamental processes and the system size is still small. However, it is often observed that in fusion boundary layer plasmas. In addition, although the dynamics are solved in the 3D space and 3D velocity coordinate in the simulations, the 3D behaviors on the blob dynamics have not been observed clearly because the periodic boundary condition is applied in the z direction and the system size in the z direction is too small for 3D behaviors to appear. We plan to investigate the dynamics in high ion temperature plasmas as and 3D kinetic effects on the blob dynamics with the large-scale simulations where the self-consistent sheath formation in the vicinity of both edges in the z direction is computed. Furthermore, in future work, it is important to investigate kinetic effects on filament dynamics in the detached state with the PIC-MCC (PIC with Monte Carlo collision) code [22].
5. Conclusions
In this work, we have studied the dependence of the blob behaviors on as the first step toward the investigation of the multiscale physics, i.e., the dynamics between microscopic and macroscopic hierarchies, in the blob transport dynamics. The 3D-PIC simulations have revealed the poloidal symmetry breaking in the blob propagation in the high plasma, which is induced by the unbalanced dipole potential structure in a blob due to the large ion Larmor radius. The poloidal symmetry breaking disturbs the radial propagation of a filament. The ratio between the observed and theoretical radial propagation velocities has a linear relation with the square of the difference between the ion and electron gyro radii.
Acknowledgments
The authors are grateful to Akiyoshi Hatayama (Keio Univ.) for stimulating discussions. The simulations were carried out on the Plasma Simulator (PS)/NIFS and the high-performance computer system of Nagoya University. This work was performed with the support and under the auspices of the NIFS Collaboration Research programs (NIFS17KNSS086, NIFS17KNXN342, NIFS17KNTS046, NIFS17KNTS049, and NIFS16KNTT038), supported by JSPS KAKENHI Grant Number JP23740411, and partially supported by “Joint Usage/Research Center for Interdisciplinary Large-scale Information Infrastructures” and “High Performance Computing Infrastructure” in Japan (Project ID: jh160023-NAH and jh170003-NAH).
Author Contributions
Hiroki Hasegawa and Seiji Ishiguro conceived and designed the simulations; Seiji Ishiguro contributed the bases of the simulation code and the analysis tools; Hiroki Hasegawa developed the simulation code and the analysis tools, performed the simulations, analyzed the data, and wrote the paper.
Conflicts of Interest
The authors declare no conflict of interest. The founding sponsors had no role in the design of the study; in the collection, analyses, or interpretation of data; in the writing of the manuscript, and in the decision to publish the results.
References
- Umansky, M.V.; Krasheninnikov, S.I.; LaBombard, B.; Terry, J.L. Comments on particle and energy balance in the edge plasma of Alcator C-Mod. Phys. Plasmas 1998, 5, 3373–3376. [Google Scholar] [CrossRef]
- Krasheninnikov, S.I. On scrape off layer plasma transport. Phys. Lett. A 2001, 283, 368–370. [Google Scholar] [CrossRef]
- Boedo, J.A.; Rudakov, D.; Moyer, R.; Krasheninnikov, S.; Whyte, D.; McKee, G.; Tynan, G.; Schaffer, M.; Stangeby, P.; West, P.; et al. Transport by intermittent convection in the boundary of the DIII-D tokamak. Phys. Plasmas 2001, 8, 4826–4833. [Google Scholar] [CrossRef]
- Antar, G.Y.; Counsell, G.; Yu, Y.; Labombard, B.; Devynck, P. Universality of intermittent convective transport in the scrape-off layer of magnetically confined devices. Phys. Plasmas 2003, 10, 419–428. [Google Scholar] [CrossRef]
- Maqueda, R.J.; Wurden, G.A.; Zweben, S.; Roquemore, L.; Kugel, H.; Johnson, D.; Kaye, S.; Sabbagh, S.; Maingi, R. Edge turbulence measurements in NSTX by gas puff imaging. Rev. Sci. Instrum. 2001, 72, 931–934. [Google Scholar] [CrossRef]
- Boedo, J.A.; Rudakov, D.L.; Moyer, R.A.; McKee, G.R.; Colchin, R.J.; Schaffer, M.J.; Stangeby, P.G.; West, W.P.; Allen, S.L.; Evans, T.E.; et al. Transport by intermittency in the boundary of the DIII-D tokamak. Phys. Plasmas 2003, 10, 1670–1677. [Google Scholar] [CrossRef]
- Liu, H.Q.; Hanada, K.; Nishino, N.; Ogata, R.; Ishiguro, M.; Gao, X.; Zushi, H.; Nakamura, K.; Fujisawa, A.; Idei, H.; et al. Cross-field motion of plasma blob-filaments and related particle flux in an open magnetic field line configuration on QUEST. J. Nucl. Mater. 2013, 438, S513–S517. [Google Scholar] [CrossRef]
- Birkenmeier, G.; Manz, P.; Carralero, D.; Laggner, F.M.; Fuchert, G.; Krieger, K.; Maier, H.; Reimold, F.; Schmid, K.; Dux, R.; et al. Filament transport, warm ions and erosion in ASDEX Upgrade L-modes. Nucl. Fusion 2015, 55, 033018. [Google Scholar] [CrossRef]
- Zweben, S.J.; Myra, J.R.; Davis, W.M.; D’Ippolito, D.A.; Gray, T.K.; Kaye, S.M.; LeBlanc, B.P.; Maqueda, R.J.; Russell, D.A.; Stotler, D.P.; et al. Blob structure and motion in the edge and SOL of NSTX. Plasma Phys. Control. Fusion 2016, 58, 044007. [Google Scholar] [CrossRef]
- Allan, S.Y.; Elmore, S.; Fishpool, G.; Dudson, B.; MAST Team; EUROFusion MST1 Team. Ion temperature measurements of L-mode filaments in MAST by retarding field energy analyser. Plasma Phys. Control. Fusion 2016, 58, 045014. [Google Scholar] [CrossRef]
- Tanaka, H.; Ohno, N.; Tsuji, Y.; Kajita, S.; Masuzaki, S.; Kobayashi, M.; Morisaki, T.; Tsuchiya, H.; Komori, A.; LHD Experimental Group. Enhancement of cross-field transport into the private region of detached-divertor in Large Helical Device. Phys. Plasmas 2010, 17, 102509. [Google Scholar] [CrossRef]
- De la Cal, E.; Semwal, P.; Aguilera, A.M.; van Milligen, B.; de Pablos, J.L.; Khan, Z.; Hidalgo, C. Double imaging with an intensified visible fast camera to visualize the fine structure of turbulent coherent plasma structures (blobs) in TJ-II. Plasma Phys. Control. Fusion 2014, 56, 105003. [Google Scholar] [CrossRef]
- Tanaka, H.; Ohno, N.; Tsuji, Y.; Okazaki, K.; Kajita, S. Statistical Analysis of the Spatial Behavior of Plasma Blobs Around the Plasma Column in a Linear Plasma Device. Contrib. Plasma Phys. 2012, 52, 424–428. [Google Scholar] [CrossRef]
- Krasheninnikov, S.I.; D’Ippolito, D.A.; Myra, J.R. Recent theoretical progress in understanding coherent structures in edge and SOL turbulence. J. Plasma Phys. 2008, 74, 679–717. [Google Scholar] [CrossRef]
- D’Ippolito, D.A.; Myra, J.R.; Zweben, S.J. Convective transport by intermittent blob-filaments: Comparison of theory and experiment. Phys. Plasmas 2011, 18, 060501. [Google Scholar] [CrossRef]
- Ryutova, M. Physics of Magnetic Flux Tubes; Springer: Berlin/Heidelberg, Germany, 2015; ISBN 978-3-662-45242-4. [Google Scholar]
- Ishiguro, S.; Hasegawa, H. Three-dimensional particle-in-cell simulation of scrape-off-layer plasmas. J. Plasma Phys. 2006, 72, 1233–1237. [Google Scholar] [CrossRef]
- Hasegawa, H.; Ishiguro, S. Particle Simulation of Plasma Blob Dynamics: Preliminary Results. Plasma Fusion Res. 2012, 7, 2401060. [Google Scholar] [CrossRef]
- Hasegawa, H.; Ishiguro, S. Study of self-consistent particle flows in a plasma blob with particle-in-cell simulations. Phys. Plasmas 2015, 22, 102113. [Google Scholar] [CrossRef]
- Hasegawa, H.; Ishiguro, S. Impurity transport caused by blob and hole propagations. Nucl. Fusion 2017, 57, 116008. [Google Scholar] [CrossRef]
- Hasegawa, H.; Ishiguro, S. Development and Verification of the Three-dimensional Electrostatic Particle Simulation Code for the Study of Blob and Hole Propagation Dynamics. Plasma Fusion Res. 2017, 12, 1401044. [Google Scholar] [CrossRef]
- Pianpanit, T.; Ishiguro, S.; Hasegawa, H. Observation of the Strong Temperature Gradient in Detached Plasma by PIC Simulation with Monte Carlo Collision. Plasma Fusion Res. 2016, 11, 2403040. [Google Scholar] [CrossRef]
- Bian, N.; Benkadda, S.; Paulsen, J.V.; Garcia, O.E. Blobs and front propagation in the scrape-off layer of magnetic confinement devices. Phys. Plasmas 2003, 10, 671–676. [Google Scholar] [CrossRef]
Figure 1.
Blob dynamics for various cases. The time evolutions of the electron density distribution in poloidal cross-section for (a), (b), and (c) are presented, where is the electron density of background plasma. Here, the initial radial and poloidal sizes of a blob in each case are set as .
Figure 1.
Blob dynamics for various cases. The time evolutions of the electron density distribution in poloidal cross-section for (a), (b), and (c) are presented, where is the electron density of background plasma. Here, the initial radial and poloidal sizes of a blob in each case are set as .

Figure 2.
Time variations of the poloidal component of the position of the electron center of mass in a blob, . The blue, green, and red circles represent the observations for , , and , respectively. Here, is the initial poloidal position of the center of a blob.
Figure 2.
Time variations of the poloidal component of the position of the electron center of mass in a blob, . The blue, green, and red circles represent the observations for , , and , respectively. Here, is the initial poloidal position of the center of a blob.
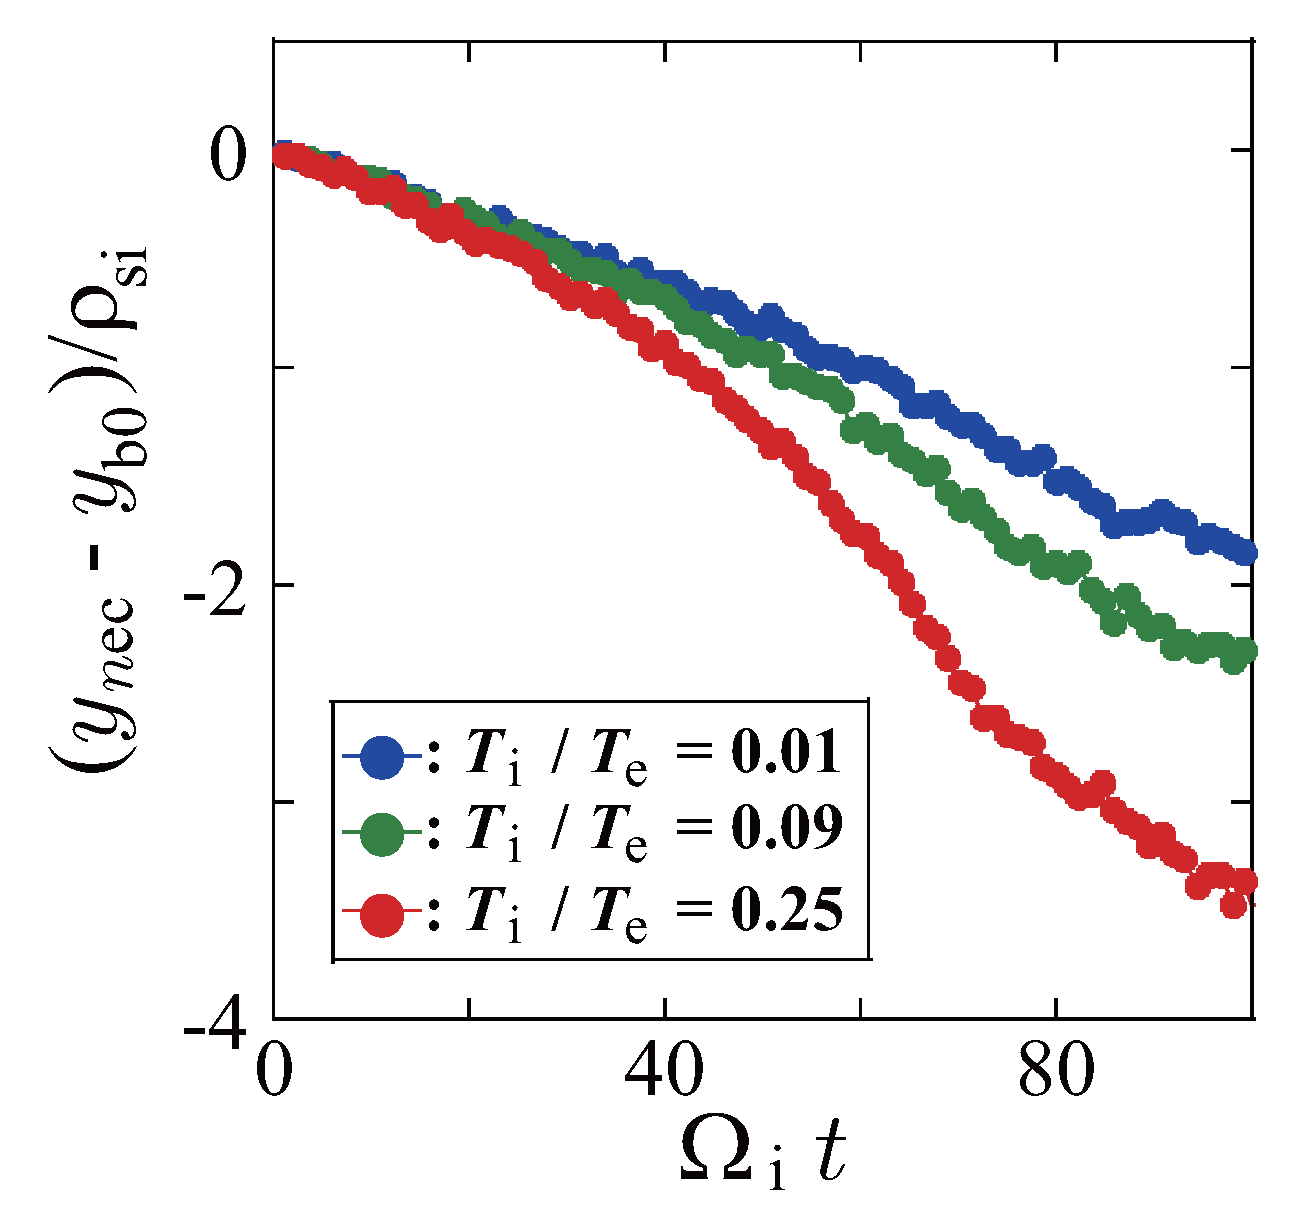
Figure 3.
Time variations of the x component of the position of the electron center of mass in a blob, . The blue, green, and red circles represent the observations for , , and , respectively. Here, is the initial radial position of the center of a blob.
Figure 3.
Time variations of the x component of the position of the electron center of mass in a blob, . The blue, green, and red circles represent the observations for , , and , respectively. Here, is the initial radial position of the center of a blob.
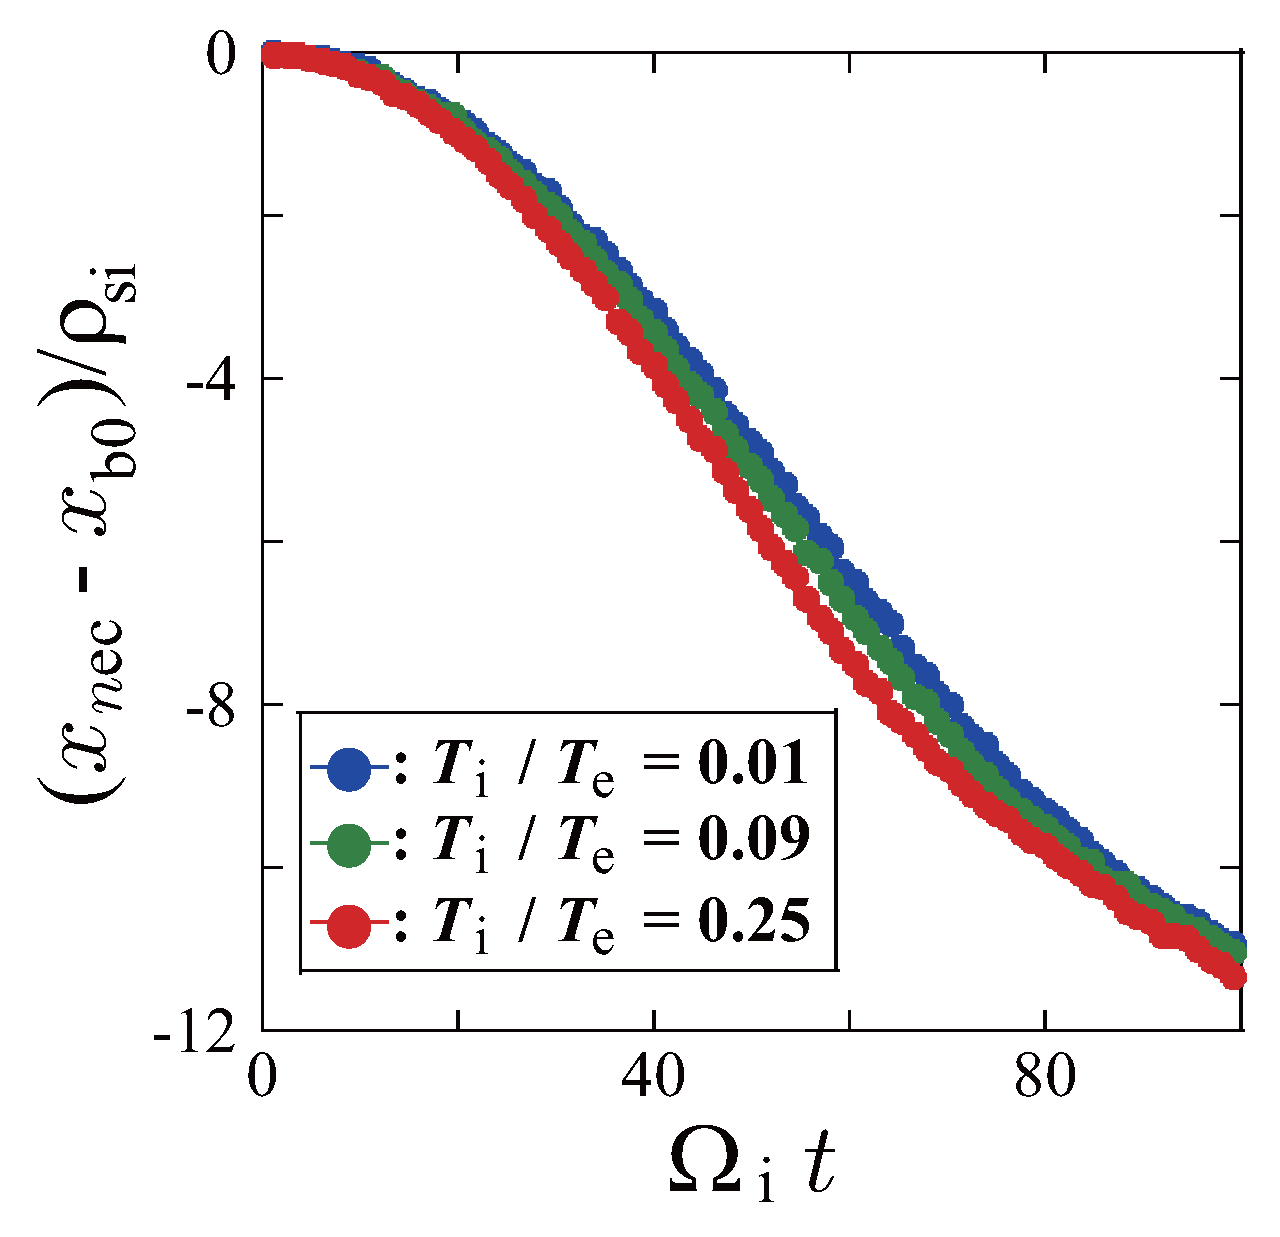
Figure 4.
Relation between and the radial propagation velocity . The circles and the broken line represent the observed velocities and the theoretical velocity .
Figure 4.
Relation between and the radial propagation velocity . The circles and the broken line represent the observed velocities and the theoretical velocity .
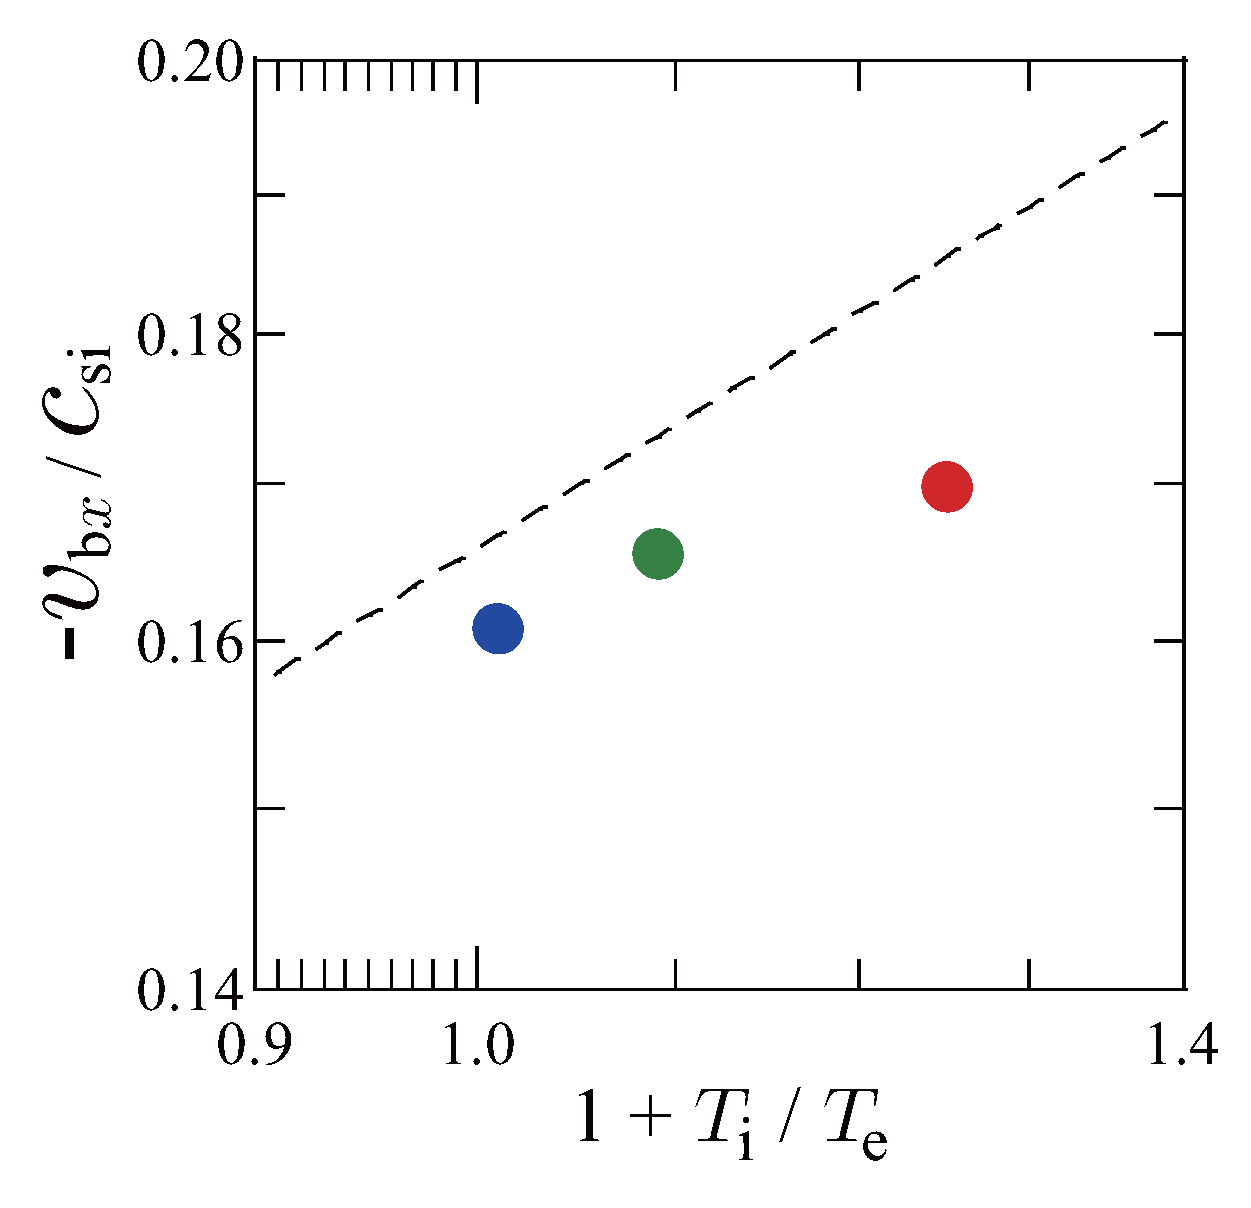
Figure 5.
Potential distributions for (a), (b), and (c) at . In each figure of (a), (b), and (c), the left panel shows the two-dimensional (2D) profile on the poloidal cross-section, while the right panel represents the one-dimensional (1D) profile along the red line in the 2D profile. The red line in each left panel designates the x position where the potential has minimum value and corresponds to (a), (b), or (c).

Figure 6.
Observed deviation of the radial propagation from the theoretical velocity by the unbalanced dipole potential structure in a blob. The panels (a) and (b) show the schematic diagram of the potential configuration in the simple estimation and the relation between and , respectively. The broken line drawn in panel (b) represents the linear approximation as .
© 2018 by the authors. Licensee MDPI, Basel, Switzerland. This article is an open access article distributed under the terms and conditions of the Creative Commons Attribution (CC BY) license (http://creativecommons.org/licenses/by/4.0/).
Share and Cite
MDPI and ACS Style
Hasegawa, H.; Ishiguro, S. Microscopic Effect on Filamentary Coherent Structure Dynamics in Boundary Layer Plasmas. Plasma 2018, 1, 61-67. https://doi.org/10.3390/plasma1010006
AMA Style
Hasegawa H, Ishiguro S. Microscopic Effect on Filamentary Coherent Structure Dynamics in Boundary Layer Plasmas. Plasma. 2018; 1(1):61-67. https://doi.org/10.3390/plasma1010006
Chicago/Turabian StyleHasegawa, Hiroki, and Seiji Ishiguro. 2018. "Microscopic Effect on Filamentary Coherent Structure Dynamics in Boundary Layer Plasmas" Plasma 1, no. 1: 61-67. https://doi.org/10.3390/plasma1010006