A Composite and Wearable Sensor Kit for Location-Aware Healthcare Monitoring and Real-Time Trauma Scoring for Survival Prediction


School of Computer Science and Electronic Engineering, University of Essex, Wivenhoe Park, Colchester CO4 3SQ, UK
Appl. Syst. Innov. 2018, 1(3), 35; https://doi.org/10.3390/asi1030035
Submission received: 27 June 2018
/
Revised: 9 August 2018
/
Accepted: 7 September 2018
/
Published: 12 September 2018
(This article belongs to the Special Issue Applications of Advanced Sensors on Applied System Innovation of IoT (Internet of Things))
Abstract
:With the advances in the microfabrication of analogue front-end devices, and embedded and signal processing technology, it has now become possible to devise miniaturized health monitoring kits for non-invasive real time monitoring at any location. The current commonly available kits only measure singleton physiological parameters, and a composite analysis that covers all vital signs and trauma scores seems to be missing with these kits. The research aims at using vital signs and other physiological parameters to calculate trauma scores National Early Warning Score (NEWS), Revised Trauma Score (RTS), Trauma Score - Injury Severity Score (TRISS) and Prediction of survival (Ps), and to log the trauma event to electronic health records using standard coding schemes. The signal processing algorithms were implemented in MATLAB and could be ported to TI AM335x using MATLAB/Embedded Coder. Motion artefacts were removed using a level ‘5’ stationary wavelet transform and a ‘sym4’ wavelet, which yielded a signal-to-noise ratio of 27.83 dB. To demonstrate the operation of the device, an existing Physionet, MIMIC II Numerics dataset was used to calculate NEWS and RTS scores, and to generate the correlation and regression models for a clinical class of patients with respiratory failure and admitted to Intensive Care Unit (ICU). Parameters such as age, heart rate, Systolic Blood Pressure (SysBP), respiratory rate, and Oxygen Saturation (SpO2) as predictors to Ps, showed significant positive regressions of 93% at p < 0.001. The NEWS and RTS scores showed no significant correlation (r = 0.25, p < 0.001) amongst themselves; however, the NEWS and RTS together showed significant correlations with Ps (blunt) (r = 0.70, p < 0.001). RTS and Ps (blunt) scores showed some correlations (r = 0.63, p < 0.001), and the NEWS score showed significant correlation (r = 0.79, p < 0.001) with Ps (blunt) scores. Global Positioning System (GPS) system was built into the kit to locate the individual and to calculate the shortest path to the nearest healthcare center using the Quantum Geographical Information System (QGIS) Network Analysis tool. The physiological parameters from the sensors, along with the calculated trauma scores, were encoded according to a standard Systematized Nomenclature of Medicine-Clinical Terms (SNOMED-CT) coding system, and the trauma information was logged to electronic health records using Fast Health Interoperability Resources (FHIR) servers. The FHIR servers provided interoperable web services to log the trauma event information in real time and to prepare for medical emergencies.
1. Introduction
This research begins with a literature review on various wearable monitoring equipment used in healthcare, emphasizing on the need for a composite sensor kit. Commonly available health monitoring kits focus on a single physiological parameter e.g., Electrocardiogram (ECG) or Photoplethysmogram (PPG), and a comprehensive analysis comprising of all of the physiological parameters seems to be missing with these kits. Multi-parameter health monitoring is available only in hospitalized or ambulatory settings. An individual sensor module, e.g., an ECG module, can only measure the biopotential, as a composite sensor; however, with additional modules such as the Pulse Oximeter sensor, other physiological parameters from a human subject can be measured simultaneously. These readings, collectively, can be used to calculate trauma scores in real-time and they can be used to estimate the prediction of survival in patients. They can also be used to study correlations and regressions amongst themselves, and they can be used to develop other statistical models for further analysis. Several wearable health monitoring kits currently exist in the market that focus on individual physiological parameter monitoring, such as the Electrocardiograph (ECG), Electromyography (EMG), the Galvanic Skin Response (GSR), with very common ones being the ‘AliveCor’ and ‘Shimmer’ sensing kits [1,2,3]. These kits focus on individual physiological parameters e.g., ECG, and they do not consider trauma scores that are associated with an emergency that is related to cardiac arrest. Moreover, the vital signs and triage information is collected, and preparations are made after the patient has been carried to the hospital, which in cases like cardiac arrest, could be too late. Other vital signs such as the blood pressure and respiratory rate are not measured by these kits, and they are measured after the patient is admitted to the ICU after the trauma episode has occurred, which could cause a delay in treating the patient. The composite devices in this research not only monitor individual physiological parameters, but they also calculates related physiological parameters and vital signs. The device uploads the trauma event information and triage information to the electronic health records (EHR) in real time, and it can raise alarms well in time. Moreover, location awareness is built into the device, which locates the nearest healthcare service provider and calculates the shortest path to reaching the healthcare provider.
Vital signs are useful in detecting or monitoring medical problems. Vital signs can be measured in a medical setting, at home, at the site of a medical emergency, or elsewhere [4]. With more and more wearable kits that have become easily available, manual intervention in healthcare monitoring has been reduced in many hospital and prehospital settings. With an increasing number of miniaturized Internet of things (IoT) devices, Analogue Front-End (AFE) modules and digital signal processing (DSP) devices that have surfaced recently, vital signs and other physiological parameters can be easily measured non-invasively; and the readings can be analyzed in a networked environment to provide a managed health monitoring system [4]. Increasing the use of machine learning algorithms and neural networks on vital sign data can determine the deterioration of health in a patient, and can help to predict the health status ahead of time, in order to prepare for an emergency [5]. Several hospitals and healthcare service providers use standard trauma scoring mechanisms to ascertain or at least estimate patient health, though these are restricted to hospital or ambulatory settings. Scoring measures such as the National Early Warning Score (NEWS), the Glasgow Coma Scale (GCS), the Injury Severity Score (ISS), the Trauma and Injury Severity Score (TRISS) and the Simplified Acute Physiologic Score (SAPS) II/III have been successfully used to identify high health risks and the extent of trauma in patient ICU settings [6,7]. These scores in turn can estimate the probability of survival (Ps) in a patient, and can help the critical care team to prepare for emergency procedures ahead of time, though due to limitations in the size of equipment, this has remained restricted to hospitalized settings. The research focuses on the development of a composite healthcare monitoring device that a patient can wear in case of emergency. The device would capture vital signs and other physiological information, and transmit this telemetry data to the electronic health records, and can raise alarms to prepare for medical emergency.
In the problems and challenges section, the problems related to measuring and filtering vital signs have been discussed, along with the solutions to calculate other vital signs such as blood pressure and respiratory rate, which are commonly measured only in hospitalized settings. The readings taken from the human subjects are in a time series format, and they have noise and motion artefacts. In order to perform an accurate waveform and statistical analysis, the data should be clean and accurate. In the Materials and Methods section, the research subsequently illustrates the use of data acquisition, filtering, smoothing, and quantization–error removal techniques to extract the portion of the signal that is error free. The MATLAB Digital Signal Processing toolbox was used to perform signal conditioning, and the MATLAB Coder tool was used to convert the MATLAB code to the corresponding C/C++ code, which could be compiled on the TI AM335x (Beaglebone Black, Texas Instruments-BeagleBoard, Arrow Electronics Inc., Centennial, CO, USA). The MATLAB environment and SPSS statistical tools are largely been used for waveform and statistical analyses. Since the parameters being measured were medical in nature, a software library that is widely accepted by the biomedical research community was used. Physionet provides all of the software tools and dataset from real patients for data analysis research that was related to physiological parameters [8,9]. The composite sensing device could measure vital signs in real time; however, in order to perform data analysis, to calculate trauma scores based on vital signs and physiological parameters, the device would have to be tested on real trauma patient. In the absence of patient availability, a database of vital signs and physiological parameters of patients admitted to ICU under trauma conditions had to be considered. The Physionet MIMIC II Numerics database was used to develop the correlation and regression models to a establish relationship between the trauma scores and the prediction of survival. The NEWS, RTS and TRISS scores were found to be quite useful in estimating the probability of survival in the patients. There is enough evidence in more recent studies that these trauma scores have a direct correlation with the prediction of survival of the patient [10,11,12,13]. Following the trauma scores calculations, adding location awareness features to the sensor kit was illustrated by using Quantum GIS and Global Positioning System (GPS) tools and techniques, in order to calculate the shortest route from the subject’s current position, to the nearest healthcare provider using GIS tools and techniques.
For a composite healthcare monitoring kit to be useful to patients, as well as the healthcare service providers, the readings and trauma scoring have to be transmitted to the healthcare service providers using a standard telemetry protocol. Furthermore, the readings and the trauma experience has to be encoded in a standard coding system that is widely acceptable within the medical community. Health Level 7 (HL7)-based Fast Health Interoperability Resources (FHIR) interoperable software components have been used to encode the events related to trauma as observations that can be logged to the electronic health record databases in real time. The research demonstrates the use of the FHIR servers [14], and the development and generation of the trauma event context and observation models for EHR interoperability. Due to the importance of trauma scoring in emergent situations and for the prediction of survival calculations, it became necessary to derive relationship between the trauma scores and physiological parameters [10,11]. In the discussion and results section, the correlation and regression relationship between the vital signs and trauma scores has been discussed.
There has been a focus on remote health monitoring systems based on the Internet of things (IoT) technology, and this concept is being accepted and adopted by private and public healthcare service providers. This has resulted in the reduction of healthcare costs, and at the same time an improvement in healthcare for aging patients and patients with chronic diseases. It also assists in reducing accommodation requirements in hospitals and private healthcare providers. This continuously monitored information, however, would have limitations in terms of diagnosis if there were no emergency-related trauma scores available to the critical care team ahead of time. The research endeavors to bridge this gap between the monitoring, diagnosis, and timely treatment in trauma-related events. The IoT-based healthcare system results in an architecture with sensing and analytical IoT devices, ubiquitous sensor networks, standard coded data distribution, FHIR servers, and incident response systems.
1.1. Literature Review
1.1.1. The Physiological Parameters for Health Status Determination
Vital signs have been widely used as performance indicators of a person’s health. The four main vital signs that are routinely monitored by health care providers are body temperature, pulse rate/heart rate, respiration rate (rate of breathing), blood pressure (non-invasive systolic) [15,16].
The normal body temperature of a person varies depending on the gender, any recent activities that the person has been engaged in, along with food and fluid consumption, the time of the day, and in women, the stage of the menstrual cycle. The pulse rate is a measure of the heart rate, or the heart beats per minute. As the heart pumps blood in and out of the body, this action puts pressure on the arteries, which could be felt as a pulse. Taking a pulse on the wrist measures the heart rate and can indicate heart rhythm and health. The normal pulse for healthy adults ranges from 60 to 100 beats per minute. The pulse rate can fluctuate, and it may increase with exercise, illness, injury, and emotions. The heart rate and pulse rate are technically different, though it is the heart beats that cause the pulse, so for analytical purposes, the heart rate can be used just as effectively as the pulse rate. Pulse rate, however, can use used in heart rate variability measurement [17]. The respiration rate is the number of breaths taken by a person per minute. It is usually measured when a person is at rest, sometimes in a supine position, and it simply involves counting the number of breaths for one minute. Respiration rates also vary, and can it increase with fever, sickness, and with other medical conditions that influence respiration. The normal respiration rates for an adult person in resting position range from 12 to 20 breaths per minute, and may depend on age. Traditionally, in intensive care units and ambulatory settings, a spirometer has been used to measure the respiration rate; however, there has been a range of modern respiration rate sensing devices that have emerged, even in the consumer market, which are non-invasive in nature [9]. This research uses the ECG signal to calculate the respiratory rate, also called the ECG-derived respiratory (EDR) rate. Thus, all of the sensors mentioned in this research are ubiquitous, wearable, and accurate, as compared to the traditionally used sensing devices and manual interventions [18]. Blood pressure is the force of the blood pressurizing the artery walls during the contraction and relaxation of the heart. Each time the heart beats, it pumps blood into the arteries, resulting in an increase and peak in blood pressure as the heart contracts, and when the heart relaxes, the blood pressure falls. Two measures have been traditionally recorded when measuring blood pressure using an instrument called sphygmomanometer. The higher measure, called the systolic pressure, refers to the arterial pressure when the heart contracts and pumps blood through the body. The lower measure, called the diastolic pressure, refers to the arterial pressure due to the heart when it comes to rest and is filled with blood. Both the systolic and diastolic pressures are recorded as “mm Hg” (millimeters of mercury). The research revolves around using modern state-of-the-art measuring methods, and this means that blood pressure is a vital sign [19]. High blood pressure (or hypertension) increases the risk of cardiac arrest, heart failure, and stroke, and its measurement is used as an important vital sign. Blood pressure can be categorized as normal, elevated, or stage 1 or stage 2 high blood pressure: Normal blood pressure is a systolic pressure of less than 120, and a diastolic pressure of less than 80, which is generally recorded as 120/80. Elevated blood pressure is systolic pressure with a range of 120 to 129, and diastolic pressure of less than 80. Stage I hypertension: Systolic blood pressure (BP) range 130–139 or diastolic BP range 80–89 mm Hg; Stage II hypertension: Systolic BP ≥ 140 or diastolic BP ≥ 90 mm Hg. Pulse oximetry, though not usually considered as a vital sign, can be a very important measure to ascertain an individual’s health status, and hence it is called the fifth vital sign [20].
Experiments to determine the use of pulse oximetry as a vital sign have been conducted in the past, for example, in an emergency in geriatric assessments using pulse oximetry to measure the oxygen saturation in geriatric patients, which has led to improved diagnosis and treatment [20]. Gas measurements in blood provide critical information regarding the oxygenation, ventilation, and acid–base concentration in blood; however, these measurements are not frequent. It is well known that oxygenation can change very quickly, and in the absence of continuous oxygenation measurements, these changes may go undetected until it is too late. Pulse oximeters measure the blood oxygen saturation continuously and noninvasively using SpO2 sensors. The blood-oxygen saturation indicates the hemoglobin concentration, due to the hemoglobin affinity to oxygen in the arterial blood, which becomes saturated with oxygen. In healthy adults, the saturation range can vary from 94% to 100%. The SpO2 sensor has a pair of light-emitting diodes (LEDs) and a photodiode on a probe element that is clipped to the patient’s body (usually a fingertip or an earlobe). The red LED has wavelength of 660 nm, the other is an infrared element with wavelength of 910 nm. Absorptions on each wavelength differs significantly with changes in oxygenated and deoxygenated concentrations of blood; therefore, from the differences in absorption due to red and infrared light, the oxy/deoxyhemoglobin ratio can be calculated. As the amount of blood in the capillaries depends on the actual blood pressure on the capillary wall (due to heartbeats), the heartbeat rate can be measured as well with the pulse oximeter.
1.1.2. Injury Severity and Trauma Scoring for Prediction of Survival Based on Physiological Parameters
The scoring measures, such as the NEWS, the GCS, the ISS, the TRISS, the SAPS II/III, and Ps have been successfully used to identify high health risks in patients that have suffered injury and trauma, and who have been admitted to ICU. The trauma scores used in this research, and the physiological parameters involved, have been presented in Table 1 for comparison. In the case of emergency, it would be a great advantage if the early warning scores could be calculated in time, and if the healthcare units could be made aware of these scores as soon as possible, to prepare for emergency, even before the patient arrives.
The NEWS score is based on an aggregate scoring system in which a score is calculated using physiological measurements, recorded in a routine check-up in a hospital or under prehospital settings. Six simple physiological parameters that are used for NEWS calculations are: the respiration rate, the oxygen saturation, the systolic blood pressure, the pulse rate, the level of consciousness or confusion, and the body temperature. In the case that the patient is in a confused state of mind or disoriented, where the patient may respond to the questions, but is confused, a score of 3 or 4 is assigned to the GCS scale. The normal GCS score equals 5 for a verbal response. NEWS scoring takes the GCS score into consideration, and in the case of trauma, the GCS scores can be very low, which can affect the NEWS scoring. A score is allocated to each measured parameter, with the magnitude reflecting how the parameter varies from the normal values. These act as weights for each measured parameter. Two additional points are added for people requiring supplemental oxygen to maintain oxygen saturation in blood. There is also an AVPU score (Alert, Voice, Pain, Unresponsive) that can be added to the calculation, depending on the alertness of the patient.
The interpretation of the NEWS score: A low score (NEWS 1–4) would ideally require assessment by a competent registered nurse who would further decide how often clinical monitoring would be required, and whether the case should be referred to the next level of diagnosis. A medium score (i.e., NEWS of 5–6 or a RED score) would prompt an urgent review by a clinician that was skilled with the relevant competencies for the assessment of the kind of illness that the patient is suffering from, which would usually be a ward-based doctor or an acute team nurse, who would further assess the patient’s health, and if required, would refer the patient to the critical care team. A RED score refers to an extreme condition in one of the physiological parameter (e.g., a score of 3 on the NEWS chart in any one physiological parameter). A high NEWS score (NEWS ≥ 7) should prompt an emergency assessment by a critical care staff with critical-care skills and competencies, and in such cases, the patient has to be transferred to higher critical care settings for diagnosis and treatment [6,7,10].
The use of physiologic scoring systems for identifying high-risk patients for mortality detection has been considered using the Acute Physiology and Chronic Health Evaluation II (APACHE II) and Simplified Acute Physiologic Score (SAPS II) models, and they are currently used in a large number of hospitals worldwide. Although these scores are not very exact or perfect, they do enable the estimation of the health status of a patient who has had a recent episode of trauma or a similar condition.
Patients brought to the accident and emergency wards may have suffered multiple injuries, in which case the Injury Severity Score (ISS) is used to assess the trauma levels. Such patients who have been injured may have one or multiple injuries, and the ISS is an anatomical scoring method that provides estimates and measures of the overall severity of injured patients. All injuries are assigned an Abbreviated Injury Scale (AIS) score, and the codes of injuries have been derived from an internationally recognized and accepted dictionary that describes over 2000 injuries, and ranges from 1 (minor injury) to 6 (an extreme life threatening injury). Patients with multiple injuries are scored by adding the squares of the three injuries with the highest AIS scores in predetermined regions of the body, and in the order of the severity of injuries. The ISS score can range from 1 to 75, and a score of 75 represents an extreme condition. The maximum score is 75 (25 + 25 + 25), as the maximum severity is 5 for each anatomical part. By convention, a patient with an AIS 6 in one body region is given an ISS of 75. The injury severity score is non-linear, and scores of 9 and 16 are common, while scores of 14 and 22 unusual. The AIS grades are 0—no injury, 1—minor, 2—moderate, 3—severe (not life-threatening), 4—severe (life-threatening, survival probable), 5—severe (critical, survival uncertain), 6—maximal, possibly fatal.
ISS > 15 has been associated with a mortality of 10%. The advantage of using ISS is that it uses anatomical areas of injury to help in formulating a prediction of survival, though at the same time it is difficult to calculate this during the initial evaluation when the patient arrives at the emergency ward, and during resuscitation. In addition, it is difficult to predict the outcomes for patients with a severe single body area injury, though the New Injury Severity Score (NISS), which takes the three highest scores regardless of anatomic area, overcomes this deficit [11,21]. The injury severity scoring can be classified as the following:
- (1)
- Physiologic: RTS, APACHE, Emergency Trauma Score
- (2)
- Anatomical: AIS, ISS, NISS
- (3)
- Combined: TRISS, A Severity Characterization of Trauma (ASCOT), the International Classification of Diseases Injury Severity Score (ICISS)
The composite device in this research can calculate the early warning scores and injury severity scores in real time, when the individual has had an episode of trauma. The NEWS, RTS, and TRISS models have been considered in this research presented in Table 1. In the Materials and Methods section, these scores have been calculated and discussed, along with the severity levels that are associated with these scores. The statistical scores associated with these scores have been compared, and the analytical results have been presented. The correlation and regression scores between the NEWS and RTS scores have been studied and are later discussed. The measurements of the physiological parameters associated with these trauma scores have been measured in real time, and the scores have been calculated and presented in real time.
In the calculation of injury severity, the TRISS score [22] remained the most commonly used tool for benchmarking trauma fatality outcome. The survival prediction power of TRISS could be substantially improved by re-classifying the measured physiological parameters and altering the coefficients for the environmental conditions, the demographics or the situations (e.g., combat). Despite some variations in the scoring mechanism in TRISS, due to the influence of demographics and environmental conditions on the patients, it remains a widely used model. Anatomic injury, age, injury mechanism, and pre-injury comorbidity are well-founded predictors of trauma outcome and for calculating the TRISS score. Statistical prediction models may have some inaccuracies, though these may be due to inaccurate calibration and inaccuracy due to applications of these models with influence on the environmental conditions [12].
Early warning scores have largely been used in cardiac emergencies, as these patients, along with other fatal injuries, require medical attention and lead to the emergent incident response [15]. Recognizing the early signs of clinical deterioration of patients is thought to improve patient treatment outcomes. The Early Warning System (EWS) scores and the impact of EWS outcomes were studied on the 48 hr mortality rate for respiratory failure and cardiac arrest patients. It was found that the early warning system scores performed well for predicting cardiac arrest and death within 48 hr. For ailments like cardiac arrests, early warning scoring mechanisms become relevant and applicable as these patients may enter trauma at any time, and healthcare service providers need to prepare ahead of time with readiness to attend to this trauma [23].
For patients admitted to ICU and facing deterioration of health, physiological parameters such as pulse rate, blood pressure, temperature, and respiratory rate could be used to assess mortality, and serious adverse events (SAEs) such as cardiac arrest could be prevented. The EWS is a scoring system which assists with the detection of physiological changes, and it may help to identify patients who are at risk of further deterioration [24]. In cardiac ailments, reduced heart rate (HR) is an established predictor of trauma and further mortality. However, the relationship between the predictors and trauma scoring is poorly understood, hence it becomes important to establish the relationship between heart rate variability and trauma scores [13,25,26].
The importance of using injury severity, comorbidity, and prediction-of-survival scores becomes paramount in military operations when troops who engaged in combat may require medical attention. The situation aggravates when the location of the troops is not known and a soldier requires medical attention, if the time frame of the arrival to the base camp is uncertain. In such cases, predicting survival and the measures related to injury severity scores become very important, and the wearable vital signs and physiological measurement kits that can calculate and perform further analysis become a very crucial instrument [13].
The TRISS) methodology has been used in both the UK and US Military trauma registries. The method relies on dividing the casualties according to their survival probability (penetrating (Ps_penetrating) or blunt (Ps_blunt)), though the use different weighing mechanisms based on experiences in combat-related environments. The UK Military Joint Theatre Trauma Registry (JTTR) and the US Military use the same scoring mechanism with some variations in coefficients for soldiers who have been injured in explosions. This study aimed to use the UK Military JTTR to calculate new TRISS coefficients for contemporary battlefield casualties who were injured by either gunshot or explosive mechanisms. The secondary aim of this study was to apply the revised TRISS coefficients to examine the survival trends of UK casualties from recent military conflicts. Such systems and early warning scoring kits can be very useful to forces who are deployed in combat zones where the scores can be calculated in real time in the event of an emergency [27,28] . The composite sensor kit in this research enables the measurement of physiological parameters that can determine the injury and trauma scores.
These studies emphasize the importance of using trauma scores in predicting the mortality and in calculating the probability of survival in injury and trauma situations.
1.1.3. Integration of Electronic Health Records with Injury and Trauma scores and Location Awareness
Injuries and disease can be classified according to the International Classification of Diseases (ICD) classification codes, and it can be used with clinical classification codes like the Systematized Nomenclature of Medicine-Clinical Terms (SNOMED-CT), and Logical Observation Identifiers Names and Codes (LOINC) [28,29]. Injury can be described in two ways using ICD-10: (1) the external cause of injury, and (2) the nature of the injury. As an example of ICD coding, if death and the causes of death for a particular patient have to be coded according to ICD-10, then the external cause of injury and the nature of Injury have to be determined. The External Cause codes describe the mechanism or the cause of the injury (e.g., motor vehicle crash), and the manner or intent of the injury (e.g., unintentional). The Nature of Injury codes describe the body region or the site of the injury (e.g., hip) and the diagnosis (e.g., fracture) [30,31]. The ICD injury matrices are frameworks that are designed to organize ICD-coded injury data into meaningful groupings that are agreed upon by the global medical community. The matrices were developed specifically to facilitate national and international comparability in the presentation of injury statistics [32].
Once the early warning and trauma scores have been calculated, the EHR with the public healthcare service provider can be updated using ICD and SNOMED/LOINC classification codes using Health Level 7 (HL7) standards. FHIR is an HL7 standard that provides interoperability specifications for web services and EHR databases [33].
A very important application for wearable IoT healthcare monitoring devices is the ability to locate the individual when the trauma-related events take place. With the availability of low-cost wearable GPS and Global System for Mobile Communication/General Packet Radio Service (GSM/GPRS) receivers, which can be embedded into the wearable kits, such a provision can made available. The GPS receiver can provide the location-specific information, and the composite sensor can provide the physiological information and trauma scores. This composite payload can be transmitted to the healthcare service provider and can enable them to get ready for an emergency. It can also help the ambulance critical care team can get ready for the emergency procedures while they are on their way to the incident location. Several GPS/GNSS systems already exist in mobile service vans tracking systems; e.g., an efficient vehicle tracking system has been implemented for tracking the movement of vehicles using a smartphone application with a microcontroller interfaced with GPS/GNSS technology to track the location in real time. The vehicle tracking system uses the GPS module to obtain geographic coordinates at regular time intervals. The system also uses Google Maps Application Programming Interface (API) to display the vehicle on the map in the smartphone application, and it can estimate the distance and time for the vehicle to arrive at a given destination [34].
1.2. Problems and Challenges
1.2.1. Obtaining Vital Signs from the Composite Sensor Kit
The most important aspect of any biomedical device is data acquisition and the techniques involved in signal filtering, smoothing, and signal processing whilst making sure that no information has been lost in acquiring the samples. In the Methods section, the hardware and the software used to obtain vital sign readings from the human subjects was discussed. The parameters such as sampling frequency and the filtering (pass bands) parameters, had to be set in order to ensure that the required amplitude peaks were captured, whilst making sure that the outliers were detected and eliminated. Another important aspect in biomedical instrumentation is the removal of motion artefacts and noise due to muscular movements, and the effect of environmental conditions on the sensors.
The BP and the respiratory rate (RR) can be calculated from the readings from the ECG and SpO2 sensors using the pulse transit time (PTT), the pulse arrival time (PAT), and the pulse delay time (PDT). [35] These are estimated blood pressure values, which can be used in the absence of proper digital blood pressure kits. The external BP sensor kits can provide accurate blood pressure readings, though it may not be possible to integrate and synchronize these readings with the ECG and SpO2 sensor readings. Since the readings from the individual sensors have to be sampled in a single sweep and timestamped, it is important that all the sensors be synchronized. The RR and BP calculated using the PTT can be accurate, and they may serve as a good starting point. The RR and BP can then be used as features that are extracted from the waveforms, and they can be used for further statistical analysis and for trauma value calculations [5,36].
1.2.2. Integrating Trauma and Injury Scores with Electronic Health Records.
The calculation of trauma and injury scores may not be adequate to address the emergency response, and the trauma information should be transmitted to the healthcare repository in real time, and the incident response should be generated by the sensor kit itself. The problem, however, is that the description of the injury has to conform to a standard coding system that is recognized by the healthcare service provider’s information systems; e.g., if the processed heart rate readings from the ECG sensors identify arrhythmia, then this event has to be logged into the EHR records according to a standard coding system. The Methods section describes the standard coding scheme and a sandbox server that conforms to the FHIR standards that are accepted worldwide. In the Methods section, a FHIR server implementation has been discussed and a sample observation of the RTS trauma score has been shown encapsulated in XML file format.
1.2.3. Location Awareness to Trigger a Real-Time Incident Response
In order to implement a prompt and real-time incident response, the use GPS/GNSS and Geographical Information Systems (GIS) tools were required to locate the nearest healthcare service provider. One such tool is the Quantum GIS (QGIS), which is an open source software that can align and map geographical maps to GPS coordinates. In the Methods section it was used to create layers of information covering a geographical area; e.g., an area with contours for plains at same altitude, or areas in a map that have the same demographic information about healthcare centers in vicinity. This information was modelled as layers, and it was overlaid over the GPS coordinates. The tool can be used to load road and rail route information into the environment, and it can be used to identify the shortest path between two points in a network based on either distance or time [37].
Various filtering mechanisms have been used to overcome the problems related to noise using stationary wavelet transforms, a Chebyshev second-order filter, and a Savitzky-Golay filter for signal conditioning. The algorithms were implemented in MATLAB, and could be ported to the embedded hardware. Comprehensive trauma scoring could be performed in real time, and the scores could be uploaded to the FHIR servers if required. The location awareness built into the kit using GPS modules could be used to locate the nearest healthcare center, and a shortest path could be calculated to reach the destination.
2. Materials and Methods
2.1. Composite Sensor Kit for Real-Time Multiparameter Physiological Data Acquisition
The composite hardware consisted of an ECG, PPG sensors, a GPS module and a 3-Axis accelerometer interfaced with a Texas Instruments AM335x based Beaglebone Black (BBB) small board computer running Debian Linux 7.9. MATLAB Embedded Coder Hardware Support packages support Debian Linux 7.9 to interact with BBB for General Purpose Input Output (GPIO) and serial communication. The Embedded Coder toolbox could generate C/C++ code for the corresponding MATLAB script targeting the AM355x Cortex-A processors. The block level diagram of the setup is shown in Figure 1. The raw ECG signals from human bodies had noise due to motion artefacts and baseline wandering. MATLAB Hardware Support packages were used to interact with the motion artefact so that it could be removed using the stationary wavelet transform level 5 decomposition and ‘sym4’ wavelet in the MATLAB Stationary Wavelet Transform tool. The signal was further smoothed using a Savitzky–Golay filter with order = 3 and frame length = 51. Alternatively, the baseline wandering [38], along with the motion artefacts, could be removed by using a Chebyshev Type II filter order = 2, sampling frequency = 1024, with a passband (Wp) of between 1 Hz and 100 Hz, and a stopband (Ws) of between 0.5 Hz to 100 Hz, according to code Expressions (1).
[n,Ws] = cheb2ord(Wp,Ws,1150); % Filter Order
[z,p,k] = cheby2(n,Rs,Ws); % Filter Design
[sosbp,gbp] = zp2sos(z,p,k);
filtered_signal = filtfilt(sosbp, gbp, ecgsig); % Filter Signal
%Source: matlabcentral/answers/364788-ecg-signal-artifact-removing
[z,p,k] = cheby2(n,Rs,Ws); % Filter Design
[sosbp,gbp] = zp2sos(z,p,k);
filtered_signal = filtfilt(sosbp, gbp, ecgsig); % Filter Signal
%Source: matlabcentral/answers/364788-ecg-signal-artifact-removing
The composite sensor kit captured signals in real time from the following sensor modules, as shown in Figure 2:
- (1)
- ECG Sensor module
- (2)
- PPG (SpO2) sensor module
- (3)
- GPS module
- (4)
- Respiratory rate and blood pressure calculations
(1) ECG sensor breakout board based on an Analog Devices AD8232 analog front end was used to measure the electrical biopotential activity of the heart through electrodes attached (glued/taped) to the skin. The ECG sensor board was interfaced with a Texas Instruments AM335x-based Beaglebone Black (BBB) through GPIO ports.
(2) The PPG (SpO2) sensor module hosted a MAX30101 high-sensitivity pulse oximeter from Maxim Integrated. It was designed to run on either 3.3 V or 5 V power supply, and it communicated with BBB over an Inter-Integrated Circuit (I2C) interface. The MAX30101-based board included internal LEDs, photodetectors, and optical elements, and it could remove noise by low ambient light rejection. The MAX30101 integrated red, green, and IR (infrared) LED drivers to modulate the LED pulses for SpO2 and heart rate measurements. As a principle, it is known that the oxygen-saturated blood absorbs light differently than unsaturated blood. Pulse oximeters measure the oxygen saturation, giving an indication of the percentage of hemoglobin concentration in blood that is saturated with oxygen. In a healthy adult, these readings can range from 94% to 100%. Since oxygen-saturated blood absorbs more infrared light than red light, and unsaturated blood absorbs the opposite, the SpO2 readings are calculated by the comparison of the amount of absorption of these two types of light, as quantified by the current generated by the photodetectors.
(3) The GPS breakout board hosts the u-blox NEO-6 series GPS module and interacts with the BBB through the serial interface.
(4) Respiratory Rate and Blood Pressure Calculations
The RR can also be calculated using the Physionet Waveform Database (WFDB) library using the EDR utility, and the derived value has a high correlation to the measured values, as found by the authors of the library [40]. Since the ECG waveforms are available, RR can be calculated from the ECG waveform itself. The EDR utility is a C program and it can be compiled on any GNU/Unix/Linux platforms.
BP is also an important vital sign used in trauma scoring, and in the absence of an integrated sensor, there are challenges due to the measured BP, and the removal of motion artefacts. Researchers have tried to overcome this challenge by analyzing oscillometric pulses after amplitude modulation and amplification of the ECG signal [41]. The PTT feature, which is calculated from ECG and PPG signal, could be used for BP estimation. A prototype was developed and tested, which achieved a mean absolute difference of less than ‘5’ mm Hg for estimating the BP with the reference Omron BP monitor. It could be hypothesized that in the absence of RR and BP sensors that can be readily integrated with the composite wearable sensor kit, the estimated values of RR and BP that are derived from ECG waveforms could be used to calculate the trauma and injury scores. PTT can be measured as the time interval between the R-peak in an ECG wave and a characteristic point at predetermined thresholds of the PPG signal in the same cardiac cycle [42]. By using PTT, the systolic blood pressure (SBP) can be calculated as follows:
SBP = 4.8008600358 × 10⁴ × PTT + 1.308532932
The steps for data acquisition and WFDB-compatible record generation are as follows:
- Read the samples from the ECG and PPG sensor using the Adafruit GPIO library for BBB with a sampling frequency of 1024 Hz. At least a 3-millisecond interval should be present between the two samples.
- Use the ‘wrsamp -F 360 -G 1000 -i’ command from WFDB to convert these samples to a WFDB-compatible record where ‘1000’ is the gain. The WFDB record conversion sampling frequency is 360 Hz, which is different from the data acquisition sampling frequency of 1024 Hz. ECG strips are analyzed in batches of 10 s intervals.
- Use the ‘gqrs -r ecg_samples_file -m 1’ command to obtain the QRS complexes from the samples. The threshold set is set to ‘1 mV’, and a qrs annotation file is generated.
- Use the ‘rdann -a qrs -r ecg_samples_file’ command, which uses the ‘qrs’ annotation file to find the R-peaks.
- Find the number of samples between the R-peak and the next available PPG peak, and calculate the time corresponding to the sampling interval, which would give the PTT value that is used to determine the systolic BP. At 360 Hz, the WFDB sampling frequency interval between two consecutive samples would be approximately 2.75 milliseconds.
- Use ‘edr -r edr_samples_file -i qrs_file -f 0 -t 0.16:0’ to generate the EDR samples for a value of ‘0.16’, corresponding to 10 s time frames and corresponding to the ‘qrs’ annotation file. This would give the average respiratory rate over a 10 s interval.
Thus, using the ECG and PPG sensor modules, all the vital signs could be measured from a human subject. However, for the purpose of calculation of trauma scores and the prediction of survival, and to study the relationship amongst these scores, readings from a patient who had undergone trauma were required. The Physionet MIMIC II Numerics (vital signs) dataset was used for this purpose. The statistical analysis and trauma scoring was performed on the dataset from MIMIC II in the absence of a real trauma patient. MIMIC II is also a vital signs dataset of patients who were admitted to ICU and who have undergone trauma.
2.2. Physionet MIMIC II Database for Statistical Analysis
The raw ECG signals after conditioning had to be converted a format that was recognized by the WFDB tool from Physionet for further analysis [8,43]. The WFDB library was installed on BBB, and software utilities from the library were used to convert the ECG waveforms to a WFDB format. The Multiparameter Intelligent Monitoring in Intensive Care (MIMIC II) Waveform Database is one of the two MIMIC II Databases. The waveform database contains several thousands of records of time series that have been digitized using physiological waveforms and simultaneously recorded Numerics (vital signs) signals of physiologic measurements. Some records also contain alarm annotations and signal quality indexes. The waveforms could be visualized online or by using a WAVE toolkit [44]. Physionet is a widely used resource for complex physiologic signals, which was created for the Research Resources of the National Institutes of Health (NIH), to instigate the study of cardiovascular and other complex biomedical signals. WFDB is a major component in the PhysioToolkit, and it has about 75 applications for signal processing and automated analysis [45]. For the current research experiment and data analysis, however the MIMIC II waveform and Numerics database was used. The database contains physiologic signals and vital signs in a time series format that have been captured from patient monitors for tens of thousands of ICU patients. Data were collected from a variety of ICU admissions varying from (medical, surgical, coronary care, and neonatal) related admissions. The MIMIC II Clinical Database contains clinical data from bedside monitors, and written notes taken by doctors and nurses. The MIMIC II Waveform Database includes records of high-resolution physiologic waveforms and minute-by-minute numeric (vital signs) time series (trends) of physiologic measurements. Waveform Database records are matched to the corresponding clinical database [44,46]. The recorded waveforms and Numerics (vital signs) include one or more ECG signals, and often include arterial blood pressure (ABP) waveforms, fingertip PPG signals, and respiration rate signals, with additional waveforms depending on the patient condition that is being monitored. Numerics (vital signs + physiological signals) typically include heart and respiration rates, SpO2, and systolic, mean, and diastolic blood pressures. The recording lengths also vary from a few days in, to several weeks long. Waveform signals in MIMIC II/III were captured at 125 samples/s and consisted of ECG, PPG, RESP, and BP signals [9,44,46], amongst others. For calculating the trauma and injury severity scores, HR, RR, SysBP, SpO2 scores were used along with age. The signals were read into the MATLAB environment and were sampled at a sampling interval of 1.024 s.
2.3. Trauma and Injury Severity Scoring for the Probability of Survival Prediction
In the absence of a real trauma patient, the MIMIC database was used to calculate the trauma scores and it was used to calculate the survival prediction. Since the trauma scores were calculated using the vital signs (Numerics) and physiological parameters, it could be hypothesized that there may be a relationship between the trauma scores, the related physiological parameters and the prediction of survival. Statistical analysis was performed to derive the significance values for this relationship [47].
Once the relationship between the trauma and physiological parameter variables was confirmed, the readings from composite sensors could be used to calculate trauma scores and the prediction of survival in real time. This is imperative for patients who are under continuous monitoring for chronic illnesses, as they may suffer from episodes of trauma at any time. In order to perform multiparameter analysis using parameters like heart rate, pulse rate, temperature, oxygen saturation, and respiratory rate sensor readings from multiple sensors were gathered, and trauma related scores were calculated. Initially, NEWS calculations were performed using the following variables:
- RR (breaths per minute) score
- PPG (%) score
- Any Supplemental Oxygen score (Yes/No)
- Temperature in °C (°F) scale
- Systolic BP score
- HR (beats per minute) score
- AVPU score
NEWS score = Respiratory Rate score + Oxygen Saturation (%) score + Supplemental Oxygen score + Systolic BP score + Temperature scale + Heart Rate score + AVPU score
In a real patient, the HR and RR would be derived from the ECG sensor, and the PPG sensor would provide an oxygen saturation reading. It was assumed that ‘No’ supplemental oxygen was provided, as the kit would be worn in non-hospitalized conditions. The AVPU score of ‘3’ was assumed as the patient may not be alert and not fully conscious. A GCS score of 4 has been assumed with E1V1M2 responses.
It can be noted that all the scores required to calculate the NEWS score could be obtained by the composite sensor kit. Following the NEWS score, the RTS was calculated using additional parameters. RTS, however, requires GCS scores. The Glasgow Coma Scale quantifies the severity of head injuries using motor/verbal responses, and uses following variables:
- Best Motor Response (values: None to maximum 6)
- 6—Obeys command
- 5—Localizes pain
- 4—Normal withdrawal (flexion)
- 3—Abnormal withdrawal (flexion): decorticate
- 2—Abnormal withdrawal (extension): de-cerebrate
- None (flaccid)
- Best Verbal Response (values: None to maximum 5)
- 5—Oriented
- 4—Confused conversation
- 3—Inappropriate words
- 2—Incomprehensible sounds
- None
- Eye Opening (values: None to maximum 4)
- 4—Spontaneous
- 3—To speech
- 2—To pain
- None
Calculation:
GCS = Eye opening + Verbal response + Motor response = 4 (E1V1M2)
The RTS is the most widely used prehospital field triage tool, and it was calculated using the following variables: The GCS score, the systolic blood pressure score, and the respiratory rate score.
Calculation:
RTS = Glasgow Coma Scale score + Systolic Blood Pressure score + Respiratory Rate score
Interpretation: A lower score indicates a higher severity. RTS < 4 was proposed for transfer to a critical trauma centre.
Following NEWS and RTS, the ISS had to be calculated. ISS is the first scoring system to be based on anatomic criteria, which defines the injury severity for comparative purposes. It was assumed that the ISS score was based on ICU-admitted patients’ readings, so that an AIS score of 4 (severe) was chosen, resulting in ISS = 48.
Trauma is measured using the TRISS scores. An important aspect of measuring trauma is to calculate the probability of survival. The Ps scores are measured as Ps blunt or Ps penetrating. Ps blunt indicates the probability of survival if the patient has suffered internal injuries. Ps penetrating scores indicate the patient has suffered injuries which has resulted in an outpour of blood; e.g. Ps penetrating would mean that a person has fallen and has bruises; for example, a soldier wounded in war. Ps scores, along with TRISS scores give an indication of how serious the injuries have been. A similar experiment has been performed in the past, with logistic regression analyses being performed using 412 cases with scores on all severity measures. A trauma injury severity score of more than 11.13 indicated more than a 95% probability of survival [27]
The TRISS determines the Ps score of a patient from the ISS and RTS using the following formulae:
Ps = 1 / (1 + e b), where, b = b0 + b1 (RTS) + b2 (ISS) + b3 (Age) and, the coefficients b0 = −0.4499, b1 = 0.8085, b2 = −0.0835, and b3 = −1.7430 (Source: trauma.org) for Ps (blunt), assuming that the patient has suffered no external injury.
This TRISS provides an estimate of Ps blunt and Ps penetrating trauma scores based on the patient’s age, RTS, and ISS results. It is possible to modify TRISS scores depending on the situation, the environmental conditions, and the sample population under consideration, by altering the TRISS coefficients. [48] There are severity levels associated with NEWS and the RTS scores, e.g., an RTS of less than 3 would mean that the probability of survival of the patient is almost nil, or that the patient is already dead. The RTS and NEWS scores, along with probability of survival scores can be transmitted to the healthcare service provider in real time using commonly available telemetry communication media, and the healthcare service providers can use these scores to ascertain the extent of injuries and/or trauma, and they can get ready with their emergency procedures. Such a mechanism can save valuable time whilst the patient is being taken to the emergency ward. If the Ps scores start falling below 4 or start approaching 0, alarms could be raised, indicating an emergency. These scores could also be transmitted wirelessly over the Internet to the healthcare service provider. In the absence of human subjects under trauma or severe injury, MIMIC II Numerics records were used to demonstrate the function of the composite sensor kit. Statistical analysis of the NEWS and RTS scores, along with the probability of the survival scores, showed that the NEWS and the RTS scores were correlated, as shown in the results section. In addition, the severity of injuries and the resulting health status using NEWS and the RTS scores were calculated using the vital signs as parameters. Vital signs were used as individual and independent variables, and NEWS and the RTS values were dependent variables, as were the Ps blunt and Ps penetrating scores.
2.4. Location Awareness Additions to the Wearable Sensor Kit Using the GIS Application and the GPS Module
The ‘u-blox’ NEO-6M GPS receiver and positioning engine was used to acquire position-specific information from GPS satellites. The power save mode (PSM) allows for a reduction in system power consumption by switching between acquisitions and tracking mechanisms. The GPS position is obtained using a mechanism called ‘triangulation’ [49]. The format of incoming data from the GPS satellite is specified by the National Marine Electronics Association (NMEA) definitions, and each complete line of transmission is called a ‘sentence’, and multiple sentence data is called a ‘transmit’. Some of the sentences are: GLL—latitude/longitude data, GSA—overall satellite data, ZDA—date and time, WPL—waypoint location information, XTE—measured cross track error, RMB—recommended navigation data for GPS, GSV—detailed satellite data amongst others. Each one of these abbreviated sentences has specific information related to the location. A Node.js-based GPS parser library was used to parse the location-specific information [50]. As characters (sentences) arrive from in the GPS receiver, these are buffered, and the parser will detect when a complete sentence has been provided, and the sentence gets broken down into its respective elements to retrieve the required values such as position coordinates. The kind of information that can be extracted from the parser depends on the GPS/GNSS receiver module. Almost all GPS/GNSS modules on the market support basic sentences, which are GGA (GPS Fix Data), RMC (Recommended Minimum Data), GSA (Overall Satellite data), GSV (Detailed Satellite data), GLL (Latitude/Longitude data), and VTG (Vector Track and Speed over the Ground). These are the standard structures that are commonly used in an application, and most of the information related to location, speed, direction, time, and navigation could be retrieved. It is also possible to use the GPS coordinates to gather all the terrestrial and demographic information using a third-party library like RTKLIB. The GPS information only provides the location coordinates, though these have to be mapped and aligned according to the geographical mapping system. RTKLIB OSM is an open source GNSS toolkit for performing precise positioning. It was possible to determine the position, using a GNSS receiver. The software supports all major satellite constellations (GPS, GLONASS, Galileo, and others) and it uses standard file exchange formats. The toolkit can be used on Windows and Linux platforms [51]. A number of GPS receivers provided raw measurements (carrier phase and code pseudo range), which were compatible with RTKLIB. The library was then used to calculate precise positioning to centimeter-level accuracy positioning. The most affordable were the single frequency receivers. The dual frequency receivers were more expensive, but they had higher accuracy, especially for baselines that were longer than about 50 km; the advantage was much less pronounced in sub-km baselines [51].
The GPS coordinate information, along with the GIS mapping tools, was used to locate the nearest healthcare service provider. The following steps were carried out to achieve this: The road graph plugin in QGIS was used for this task to load road layers for a geographical area in UK. Using the coordinates of the healthcare service providers in the nearby area, these were overlaid as layers. The start point layer became the current GPS coordinates and the end-point layers were the coordinates to the nearby healthcare service providers. Then, using the network analysis tool in QGIS, the shortest path to the nearest healthcare service provider was calculated, and the center information was retrieved. The shortest route to the center was traced according to the road graph-mapping layer.
The GIS data was provided by Geofabrik [52]. The GPS/GNSS-based current position location, and the network analysis tool were used to calculate the shortest path between the current location and an end-point, which could potentially be a healthcare center. For calculating the shortest path from within an application, the following steps were carried out:
- (1)
- To match geographical maps with GPS coordinates;
- (2)
- To generate a heatmap of the roads traveled, based on GPS track recordings;
- (3)
- To download road map data from an online repository of shapefiles and transform it into a network of roads;
- (4)
- To store the road network in a database;
- (5)
- To generate own records of journeys using a GPS tracking device log of the route traversed;
- (6)
- To implement a map-matching algorithm to match GPS track recordings to an existing road network using shapefiles.
Matching GPS data against a map: A GPS receiver/logger captures a series of latitude and longitude coordinates over time and traces the path of someone moving from place to place. The GPS coordinates are recorded and stored according to the person’s movements. Commonly available GPS devices enable the recording of a journey that is taken on foot or by a vehicle, by recording a series of coordinates. The GPS device does not know which roads on the route map were followed during the journey. Map matching is the process for taking a GPS recording of the coordinates that are followed during a journey, and matching it against a database of roads on road map to identify the set of roads that were used on a particular journey.
For the map-matching task, three artefacts were required:
- (1)
- An accurate GPS track recording of the journey containing a log of GPS coordinates which would identify the roads that were followed on the journey.
- (2)
- An accurate database of road maps mapped to global geographical coordinates.
- (3)
- A suitable algorithm to match the GPS coordinates against the road map database.
For the current task using GPS coordinates, a road map and a suitable algorithm, the heatmap of commonly used roads to reach a potential healthcare center, was generated.
A set of road map data in shapefile format was downloaded from OpenStreetMap (OSM) [53], and converted into a network of directed road segments. A collection of GPS traces for the journey from the start location to an end location was generated using OSM and GPS traces utility online, which could identify the commonly traveled roads. The traces are normally exported as GPS Exchange Format (GPX) file. A GPS heatmap based on commonly used roads from a start point to an end-point, and captured by GPS devices and available on OSM GPS traces was generated. OSM is a widely used source of GIS/GPS data, and for road map data, www.geofabrik.de was used to download the relevant files in ‘osm’ format. In order to calculate the shortest path between two points, the starting and ending points were to be selected, and the shortest available path between those two points would be automatically calculated and suggested in real time. The track data was made persistent in a SpatiaLite database, and the Basemap was a GeoTIFF raster image downloaded from OSM. Along with track data and Basemap layers, additional layers to display the temporary information on top of the map were created. The temporary information was: (1) the currently selected starting point obtained by current GPS coordinates from the GPS/GNSS receiver device. (2) The end-point selected, which was the location of the healthcare center. (3) The shortest available path between the two points traced using line geometry.
Obtaining the Basemap: The GeoTIFF raster image downloaded from OSM was passed through the GDAL utility in QGIS, which aligns the raster image and makes corrections according to GPS coordinates, to generate a basemap that can be used in an application. Alternatively, the GeoJSON utility could be used to obtain maps from GPS coordinates.
Defining the map layers: A separate map layer was created for each of the following: (1) Basemap, (2) Track, (3) Start Point, (4) End Point, (5) shortest path. The Basemap layer was overlaid with the track layer stored in the SpatiaLite database. The map layers could also display additional attribute information e.g., healthcare centre information stored in the database.
Defining the map renderers: Appropriate symbols and renderers from QGIS were used to draw the vector data onto the map. The Start Point and End Point actions allowed the user to set the start- and end-points in order to calculate the shortest path between these two points.
To calculate Find Shortest Path action: The QGIS network analysis library was used to perform the actual calculation to find the shortest path between the start- and the end-points. The shortest path algorithm was run on the tracklayer in the memory-based map layers (Start Point and End Point).
2.5. FHIR Application for the Composite Sensor Kit
Physiological parameters such as heart rate, oxygen saturation, and pulse rate can be modelled according to HL7 FHIR specifications as observations, and the events of trauma could be modelled as ‘assessment scales’. The assessment scales, scoring systems, or indexes are observations with specific characteristics [54]. They have severity-points calculations that can make a quantitative statement on the severity and prognosis of a disease or injury. The scores in FHIR context are used to convert ‘soft’ observations into ‘hard’ data and evidence. Typically, assessment scales combine the individual values into a total score, which can be calculated for a reference population. The assessment scale can either be a single value, it can consist of several dozen values, which can be calculated using a complex mathematical calculation or a statistical technique. According to the SNOMED-CT classification, TRISS is an assessment scale with SCTID: 273886002; and RTS has a SCTID: 273885003. [55]. The entire context of the patient, observations of physiological parameters, and assessment scales can be encapsulated as a resource bundle and can be uploaded to the FHIR sandbox server using RESTful Web-services, as shown in Table 2.
In order to demonstrate the real-time integration and interoperability of the sensor kit and EHR, a FHIR sandbox was developed, which hosted the EHR functionality and the trauma episodes were modelled as FHIR resources of ‘bundles’, ‘observations’ and ‘assessment scales’. The readings from the sensor kit were encapsulated as observations, and trauma scores were encapsulated as ‘assessment scales’ according to FHIR specifications. SMART on FHIR [14] is a well-known interoperability project with the distinctive goal of developing a platform to enable interoperability between the healthcare application and the FHIR servers, as shown in Figure 3 The project was called Substitutable Medical Applications and Reusable Technologies (SMART), and it adopted web standards application programming interface transport, authentication/authorization, user interface, and standard medically coded data. The system helped specify a clinical description of an ailment in a patient. SMART FHIR provides an interoperable interface to develop web services to integrate end user application with the FHIR servers.
3. Results and Discussion
3.1. Workflow from Data Acquisition to Location Tracking
3.1.1. Signal Processing of Physiological Parameters
As illustrated in the Methods section, the Adafruit Python library and the WFDB libraries were used on BBB to obtain the vital signs and physiological samples from the sensor modules. The signals acquired from the vital signs sensors were noisy, so they had to be filtered using signal processing utilities in the MATLAB signal processing toolbox. The BBB hardware support package enabled the execution of MATLAB scripts on the BBB hardware for some functions. Alternatively, the MATLAB Coder tool could emit C programs for the corresponding MATLAB scripts for the target processor (Texas Instruments Sitara ARM Cortex A8), hosted on BBB. The motion artefact were removed using the stationary wavelet transform ‘level 5’ decomposition and ‘sym4’ wavelet (code Expression (2)) with the MATLAB Stationary Wavelet Transform De-noising tool, as shown in Figure 4, which shows corrected waveform overlaying the noisy waveform. The signal–noise ratio observed was 27.83 dB. The maximal overlap discrete wavelet transform (MODWT) using the modwt function in MATLAB could enhance the R-peaks in the ECG waveform acquired from the ECG sensor, which helped to reconstruct a frequency-localized version of the waveform using only the wavelet coefficients. The coefficients correspond to the approximate frequency passbands, which could maximize QRS energy. The findpeaks function in MATLAB enabled in isolation of the R-peaks in the waveform for vital signs readings as seen in MATLAB code Expression (2):
wtrans = modwt(ecgsig,5);
wtrec = zeros(size(wtrans));
wtrec(4:5,:) = wtrans (4:5,:);
y = imodwt(wtrec,’sym4’);
y = abs(y).^2;
[qrspeaks, locs] = findpeaks(y, tm,’MinPeakHeight’, 0.1, ‘MinPeakDistance’,0.150);
wtrec = zeros(size(wtrans));
wtrec(4:5,:) = wtrans (4:5,:);
y = imodwt(wtrec,’sym4’);
y = abs(y).^2;
[qrspeaks, locs] = findpeaks(y, tm,’MinPeakHeight’, 0.1, ‘MinPeakDistance’,0.150);
In order to demonstrate the filtering mechanism, samples from MIMIC II Numerics (Record 033n) database were read into MATLAB. These samples could have very well been gathered, using the composite sensor kit, from a real human subject undergoing traumatic experience and/or injury. The samples were filtered using parameters set in MATLAB code Expressions (3) using a fourth-order Kaiser Window:
%E.g. ecg033array(:,2) contained the Physiological samples for MIMIC II record 033n
Hd = designfilt(‘lowpassfir’,’FilterOrder’,20,’CutoffFrequency’,150,
‘DesignMethod’,’window’,’Window’,{@kaiser,4},’SampleRate’,1024);
y1 = filter(Hd,ecg033array(:,2));
Hd = designfilt(‘lowpassfir’,’FilterOrder’,20,’CutoffFrequency’,150,
‘DesignMethod’,’window’,’Window’,{@kaiser,4},’SampleRate’,1024);
y1 = filter(Hd,ecg033array(:,2));
The filtering mechanism induces phase lag, and in order to eliminate the lag, group delay had to be introduced according to Expression (4). A Savitzky-Golay filter (sgolay) was used as a smoothing algorithm with order = 3 and frame length = 51, as in Expression (4):
fvtool(Hd,’Analysis’,’grpdelay’);
sgf = sgolayfilt(ecg033array(:,2),3,51);
y1 = filtfilt(Hd,ecg033array(:,2));
sgf = sgolayfilt(ecg033array(:,2),3,51);
y1 = filtfilt(Hd,ecg033array(:,2));
The respiration rate and systolic blood Pressure could be calculated for real human subjects from the composite sensor kit using the ECG and PPG waveforms and the PTT. Since the objective was to calculate the trauma measures for trauma patients, vital signs samples from the MIMIC II Numerics database (e.g., MIMIC Numerics record = 033n) were used for statistical analysis. The spectral image, Figure 5, of the respiratory rate signal for the patient (MIMIC Numerics Record = 033n) admitted to ICU clearly showed two episodes of ‘significant drop in respiratory rate’, which agrees with the patient condition of respiratory rate failure.
3.1.2. Correlation and Regression of Trauma Scores and their Predictors
In order to validate the hypothesis that there is a correlation between RTS, NEWS, and the Ps blunt or Ps penetrating scores, the statistical analysis had to be performed with an existing dataset. The MIMIC 2 Numerics dataset hosted by Physionet was used to perform the statistical analysis. The dataset was cleaned to extract features relevant to the NEWS and the RTS calculations according to patients admitted to the ICU and belonging to a clinical class category “RESPIRATORY FAILURE”. Once the vital signs samples of all the patients belonging to a clinical category was extracted, columns for each of the vital signs were used for statistical analysis. The analysis was performed on 368,721 samples from eight patients admitted to ICU for the clinical class ‘Respiratory Failure’. The samples were known to be taken at the interval of 1.024 s. It was observed that since the patients were admitted into ICU wards, the NEWS and the RTS scores agreed with their health status. The NEWS and the RTS severity scores less than 4 indicated the patients were under severe trauma, and this helped to accept the hypothesis. The MIMIC II database is widely accepted, and some experiments of similar nature have been performed on the dataset, so that it can be used for trauma score calculations.
The vital signs and physiological parameters from Physionet and the MIMIC II Numerics (mimicdb/numerics) database were used to calculate NEWS and RTS, and to generate correlation and regression models using the vital signs/physiological parameters for a clinical class of patients with “respiratory failure” and admitted to ICU.
NEWS and RTS scores showed no significant correlation (r = 0.25, p < 0.001) amongst themselves; however together, NEWS and RTS showed significant correlations with Ps (blunt) (r = 0.70, p < 0.001). RTS and Ps (blunt) scores showed some correlation (r = 0.63, p < 0.001) and the NEWS score showed significant correlation (r = 0.79, p < 0.001) with Ps (blunt) scores, as shown in Table 3.
Regression: Considering the age, heart rate, systolic BP, respiratory rate and SpO2 as predictors to PsBlunt, the predictors showed significant positive R for regression at F (5,368715) = 1098725, p < 0.001, total R2 = 93%, as shown in Table 4.
Both RTS and NEWS that were considered as variables to predict Ps had significant positive relationship with R for regression that was significant at F (2, 368,718) = 442,679.9, p < 0.001, total R2 = 70%.
There was no significant correlation between NEWS and RTS (r = 0.25, p < 0.001), which was due to the limitations of the sample space belonging to a particular clinical class. An extensive regression analysis over the entire ‘Numerics’ dataset would be necessary to establish an affirmative correlation between NEWS and RTS scores. There may not be a higher degree of correlation between NEWS and RTS scores themselves, which was due to the sample space considered from a single ‘clinical class’ for analysis. If the most recent MIMIC II/III Numerics dataset, which has more than 68,000 records where each record covers more than 72 hr, an affirmative and significant relationship between RTS and NEWS could potentially be observed.
There was, however, a significant positive relationship between NEWS and PsBlunt (r = 0.79, p = 0.01) and a moderate positive relationship between the RTS and PsBlunt (r = 0.63, p = 0.01).
Correlation and regression between Age, HeartRate, SpO2, SysBP and PsBlunt: There were positive significant relationships between Age (r = 0.91, p = 0.01), HeartRate (r = 0.87, p = 0.01), and SpO2 (r = 0.94, p = 0.01) with PsBlunt. There were weak positive relationships between SysBP (r = 0.47, p = 0.01) and Respiratory Rate (r = 0.33, p = 0.01) with PsBlunt.
Only eight patients belonging to a particular clinical class were considered for analysis; with additional samples, the correlation scores may improve. Also, with additional information related to blood chemistry using portable blood chemistry analysis kits, it would be possible to predict mortality and probability of survival using Simplified Acute Physiology Score (SAPS II) scores, which is the more precise score, as it also considers blood chemistry and urine samples. In addition, further research may consider the activity monitoring of the human subject using the accelerometer module, which could give more insights into the effect of activity on the ECG and PPG readings. The use of machines learning models can enhance the prediction accuracy, as has been found in quite a few data analysis experiments that have used the MIMIC II Numerics database, as it contains the physiological parameters for NEWS and RTS calculations. The MIMIC database has been used in several machine learning data analysis tasks, and it is quite a widely used database. The Numerics records contain the time series of vital signs that are sampled once per second, or once per minute, containing measurements of the systolic and diastolic blood pressures, or the heart rate. The Numerics records are stored in a format that are similar to the waveform records, but since the sampling rates are far lower, the Numerics records are much smaller. The Numerics data also contain annotations that are related to the patient alerts and monitoring device-related alerts with other non-periodic data; e.g., electrodes being misplaced or devices being disconnected, etc. Information is available for some of the ICU monitor alerts, in some cases with additional observations that are collected from other equipment sources. The format of the additional observations is similar to the annotation logs of the MIMIC II Clinical Database, and each annotation links with a specific time interval in a waveform or Numerics record, and it may optionally also link to a specific waveform signal or time series. The copies of the alarm annotation files containing information about these alerts are linked to both the waveform and the Numerics records. Since MIMIC II database is combination of the waveform and clinical database, a QueryBuilder can be used to link the waveform, the Numerics (vital signs), and the clinical information and using a Structured Query Language (SQL) the database can be queried and resulting data can be presented. MIMIC-II has also provided data for annual PhysioNet/Computing in Cardiology Challenges, including the 2012 Challenge, “Predicting mortality of ICU Patients” [44]. Since the relationship between the risk of mortality in the ICU and the physiological variables depends on the sample space of the dataset, the prediction can be improved by using automated neural networks or data-mining approaches, to predict hospital mortality in ICU patients. [47]. The SMART FHIR server sandbox (Figure 3) could host all the trauma event-specific information according to SNOMED-CT coding scheme and be queried for future reference.
3.1.3. Shortest Route Calculation Using GNSS/GIS Algorithms
Calculating the shortest distance between two points is a very common spatial problem, which was solved using the Network Analysis tool in QGIS. The Road Graph plugin of QGIS with network analysis algorithms was used to calculate the shortest path distance or time, by calculating the cumulative cost between two points in a network. The plugin provides a measure of the cumulative cost based on the length between two nodes of a network. The measurements took into consideration the first case, when the speed limit was the same for all the roads (the edges of our network) or the second case, when the speed limit differs for some selected roads. The “Roads” and “Routes” information was downloaded from Geofabrik [52] repository in the form of shapefiles. The shortest path algorithm in Figure 6 showed that a distance of 4.15 km could be covered in 0.6 hr at 40 km/hr.
4. Conclusions
The research began with the questions and the hypothesis of being able to calculate trauma scores for patients under trauma, using wearable sensor kits, non-invasively in real time and importantly, under no ambulatory or hospitalization settings. It was also hypothesized that given the vital signs plus physiological information about the patient and the corresponding trauma scores, the prediction of survival scores could be estimated, which, could help the critical care team at a remote location to prepare for the emergency procedures. To enable such a system to function without key infrastructural changes, location information had to be garnered, and the information payload had to be transmitted in real time and using standard telemetry protocols and clinical coding standards. The four main vital signs like temperature, pulse rate/heart rate, respiration rate (rate of breathing), blood pressure (non-invasive systolic) and oxygen saturation were adequate to calculate the trauma scores and prediction of survival [15,16].
From the results obtained, stationary wavelet transform, along with the passband Chebyshev Type II order 2 filter, turned out to be effective in removing signal noise, motion artefacts, and baseline wandering in ECG waveforms, and yielding a better signal-to-noise ratio.
The respiration rate and blood pressure as vital signs were important physiological parameters, and in the absence of a sensor that can directly and non-invasively measures these parameters, it was found that the ECG-derived measures could be used. Respiratory rate was calculated using the Physionet WFDB library using the EDR utility, and the derived value has a high correlation to the measured values, as found by the authors of the library. [40] The EDR utility is a C program and it can be compiled on any GNU/Unix/Linux platforms.
BP is also an important vital sign that is used in trauma scoring, and in the absence of an integrated sensor; there were challenges in measuring the BP and in removing motion artefacts [41]. The PTT, which requires the synchronization of ECG and SpO2 sensor measurements, could have been used, though the synchronization in the two sensor readings may lead to inaccuracies. Besides, the BP samples are not required as frequently as the SpO2 or ECG samples, so an external BP monitor can be used.
Pulse oximetry, as the fifth vital sign [20] was also used in calculating trauma scores, and it was required in trauma calculations and in the prediction of survival assessment. The pulse oximetry sensor can capture SpO2 readings non-invasively.
The correlation and regression scores between NEWS, RTS, and Ps scores were studied, and a high degree of regression was observed between the NEWS and RTS, taken together with the Ps. There may not be a higher degree of correlation between the NEWS and RTS themselves, though this may have been due to the sample space, as considered from a single ‘clinical class’ for analysis. If the most recent MIMIC II/III Numerics dataset, which has more than 68,000 records where each record covers more than 72 hr, an affirmative and significant relationship between RTS and NEWS could potentially be observed. This however, would require resources with higher computing power and storage.
In the calculations for injury severity scores, TRISS [22] remains the most commonly used tool for benchmarking trauma fatality outcome. The predictive power of TRISS could be substantially improved by re-classifying the measured parameters, and by altering the coefficients for the sample space belonging to a particular clinical class. The TRISS scores form the basis for calculation of prediction of survival scores, and for predicting mortality and estimating mortality rate.
Once the early warning and trauma scores were calculated, the EHR with the public health care service provider could be updated using the ICD and SNOMED/LOINC classification coding system using HL7 standards. Fast Health Interoperability Resources FHIR is a HL7 standard that provides interoperability specifications for web services and EHR databases, and by modelling the trauma scores into FHIR ‘Observations’ and ‘Bundles’ of information payload the trauma-specific information could be logged into EHR databases for future decision support, and to prepare for emergency procedures ahead of time [33].
It was observed that since the analysis was performed on datasets of patients that were admitted to the ICU wards, the NEWS score, the RTS scores, and the prediction of survival scores agreed with their health status. The NEWS and the RTS severity scores of less than 4 indicated the patients were under severe trauma, and this helped to accept the hypothesis. The MIMIC II Numerics database is a widely accepted database, and the trauma scoring hypothesis could be effectively tested with the datasets in the database as it contained all the vital signs required for calculating trauma scores.
A very important application for any wearable IoT healthcare monitoring kit is to be able to locate the individual when the trauma related events take place. With the availability of low cost wearable GPS/GNSS, or the GSM/GPRS receivers, the location awareness could be embedded in the kit itself. The GPS receiver could provide location-specific information, and the composite sensor could provide physiological information and trauma scores. This composite payload could be transmitted to the healthcare service provider, which could enable them to get ready for emergency. With the preloaded GIS information, related to the rail and road routes and the traffic conditions, the shortest path/route between current location and the nearest healthcare centre could be calculated using QGIS network analysis tools [37].
By putting the data acquisition, signal processing tools and techniques along with the trauma scoring and standard clinical coding practices together and by embedding location awareness into the composite healthcare monitoring kit, it could be concluded that a real-time incident response system for trauma related events could be implemented. Such a system would prepare the critical care team in healthcare units to prepare for emergencies well ahead of time, and can reduce the mortality rates for severe injuries and trauma.
Funding
This research was funded by the “Knowledge Transfer Partnership, Innovate UK”, grant number “KTP9562” Year 2016, Innovate UK (formerly Technology Strategy Board) RCUK. https://info.ktponline.org.uk/action/details/partnership.aspx?id=9562.
Acknowledgments
We thank PhysioBank and PhysioNet for providing access to MIMIC II datasets after passing the “Protecting Rights for Human Subjects” certification.
Conflicts of Interest
The authors declare no conflict of interest. The funders had no role in the design of the study; in the collection, analyses, or interpretation of data; in the writing of the manuscript, and in the decision to publish the results.
References
- Nguyen, H.H.; Mirza, F.; Naeem, M.A.; Nguyen, M. (2017) A review on IoT healthcare monitoring applications and a vision for transforming sensor data into real-time clinical feedback. In Proceedings of the 2017 IEEE 21st International Conference on Computer Supported Cooperative Work in Design (CSCWD 2017), Wellington, New Zealand, 26–28 April 2017. [Google Scholar]
- Tu, H.T.; Chen, Z.; Swift, C.; Churilov, L.; Guo, R.; Liu, X.; Yan, B. Smartphone electrographic monitoring for atrial fibrillation in acute ischemic stroke and transient ischemic attack. Int. J. Stroke 2017, 12, 786–789. [Google Scholar] [CrossRef] [PubMed]
- Richer, R.; Blank, P.; Schuldhaus, D.; Eskofier, B.M. Real-Time ECG and EMG Analysis for Biking Using Android-Based Mobile Devices. In Proceedings of the 2014 11th International Conference on Wearable and Implantable Body Sensor Networks, Zurich, Switzerland, 16–19 June 2014; pp. 104–108. [Google Scholar] [CrossRef]
- Holcomb, J.B.; Salinas, J.; McManus, J.M.; Miller, C.C.; Cooke, W.H.; Convertino, V.A. Manual vital signs reliably predict need for life-saving interventions in trauma patients. J. Trauma 2005, 59, 821–828; discussion 828–829. [Google Scholar] [CrossRef] [PubMed]
- Charlton, P.; Birrenkott, D.A.; Bonnici, T.; Pimentel, M.A.F.; Johnson, A.E.W.; Alastruey, J.; Tarassenko, L.; Watkinson, P.J.; Beale, R.; Clifton, D.A. Breathing Rate Estimation from the Electrocardiogram and Photoplethysmogram: A Review. IEEE Rev. Biomed. Eng. 2018, 11, 2–20. [Google Scholar] [CrossRef] [PubMed]
- Sbiti-Rohr, D.; Kutz, A.; Christ-Crain, M.; Thomann, R.; Zimmerli, W.; Hoess, C.; Henzen, C.; Mueller, B.; Schuetz, P. The National Early Warning Score (NEWS) for outcome prediction in emergency department patients with community-acquired pneumonia: results from a 6-year prospective cohort study. BMJ Open 2016, 6, e011021. [Google Scholar] [CrossRef] [PubMed]
- Long, W.B.; Bachulis, B.L.; Hynes, G.D. Accuracy and relationship of mechanisms of injury, trauma score, and injury severity score in identifying major trauma. Am. J. Surg. 1986, 151, 581–584. [Google Scholar] [CrossRef]
- Silva, I.; Moody, G. An Open-source Toolbox for Analysing and Processing PhysioNet Databases in MATLAB and Octave. J. Open Res. Softw. 2014, 2, e27. [Google Scholar] [CrossRef] [PubMed]
- Goldberger, A.L.; Amaral, L.A.N.; Glass, L.; Hausdorff, J.M.; Ivanov, P.C.; Mark, R.G.; Mietus, J.E.; Moody, G.B.; Peng, C.-K.; Stanley, H.E. PhysioBank, PhysioToolkit, and PhysioNet. Compon. New Res. Resour. Complex Physiol. Signals 2000, 101, e215–e220. [Google Scholar]
- Aminiahidashti, H.; Bozorgi, F.; Montazer, S.H.; Baboli, M.; Firouzian, A. Comparison of APACHE II and SAPS II Scoring Systems in Prediction of Critically Ill Patients’ Outcome. Emergency 2017, 5, e4. [Google Scholar] [PubMed]
- Linn, S. The injury severity score—Importance and uses. Ann. Epidemiol. 1995, 5, 440–446. [Google Scholar] [CrossRef]
- Skaga, N.O.; Eken, T.; Søvik, S. Validating performance of TRISS, TARN and NORMIT survival prediction models in a Norwegian trauma population. Acta Anaesthesiol. Scand. 2018, 62, 253–266. [Google Scholar] [CrossRef] [PubMed]
- Penn-Barwell, J.G.; Bishop, J.R.B.; Midwinter, M.J. Refining the Trauma and Injury Severity Score (TRISS) to Measure the Performance of the UK Combat Casualty Care System. Mil. Med. 2018, 183, e442–e447. [Google Scholar] [CrossRef] [PubMed] [Green Version]
- Mandel, J.C.; Kreda, D.A.; Mandl, K.D.; Kohane, I.S.; Ramoni, R.B. SMART on FHIR: a standards-based, interoperable apps platform for electronic health records. J. Am. Med. Inform. Assoc. 2016, 23, 899–908. [Google Scholar] [CrossRef] [PubMed]
- Lockwood, C.; Conroy-Hiller, T.; Page, T. Vital signs. JBI Libr. Syst. Rev. 2004, 2, 1–38. [Google Scholar] [PubMed]
- Hart, J. Association between heart rate variability and manual pulse rate. J. Can. Chiropract. Assoc. 2013, 57, 243–250. [Google Scholar]
- Healey, J.A.; Picard, R.W. Detecting stress during real-world driving tasks using physiological sensors. IEEE Trans. Intell. Transport. Syst. 2005, 6, 156–166. [Google Scholar] [CrossRef]
- Staessen, J.; O’Brien, E.; Thijs, L.; Fagard, R. Modern approaches to blood pressure measurement. Occup. Environ. Med. 2000, 57, 510–520. [Google Scholar] [CrossRef] [PubMed] [Green Version]
- Mower, W.R.; Myers, G.; Nicklin, E.L.; Kearin, K.T.; Baraff, L.J.; Sachs, C. Pulse oximetry as a fifth vital sign in emergency geriatric assessment. Acad. Emerg. Med. 1998, 5, 858–865. [Google Scholar] [CrossRef] [PubMed]
- Garthe, E.; States, J.D.; Mango, N.K. Abbreviated injury scale unification: The case for a unified injury system for global use. J. Trauma 1999, 47, 309–323. [Google Scholar] [CrossRef] [PubMed]
- Schluter, P.J. The Trauma and Injury Severity Score (TRISS) revised. Injury 2011, 42, 90–96. [Google Scholar] [CrossRef] [PubMed]
- Alam, N.; Hobbelink, E.L.; van Tienhoven, A.J.; van de Ven, P.M.; Jansma, E.P.; Nanayakkara, P.W.B. The impact of the use of the Early Warning Score (EWS) on patient outcomes: A systematic review. Resuscitation 2014, 85, 587–594. [Google Scholar] [CrossRef] [PubMed]
- Riordan, W.P., Jr.; Norris, P.R.; Jenkins, J.M.; Morris, J.A., Jr. Early Loss of Heart Rate Complexity Predicts Mortality Regardless of Mechanism, Anatomic Location, or Severity of Injury in 2178 Trauma Patients. J. Surg. Res. 2009, 156, 283–289. [Google Scholar] [CrossRef] [PubMed]
- Cooke, W.H.; Salinas, J.; McManus, J.G.; Ryan, K.L.; Rickards, C.A.; Holcomb, J.B.; Convertino, V.A. Heart period variability in trauma patients may predict mortality and allow remote triage. Aviat. Space Environ. Med. 2006, 77, 1107–1112. [Google Scholar] [PubMed]
- Domingues, C.D.A.; Coimbra, R.; Poggetti, R.S.; Nogueira, L.D.S.; de Sousa, R.M.C. New Trauma and Injury Severity Score (TRISS) adjustments for survival prediction. World J. Emerg. Surg. 2018, 13, 12. [Google Scholar] [CrossRef] [PubMed] [Green Version]
- Barnard, E.B.G.; Hunt, P.A.F.; Lewis, P.E.H.; Smith, J.E. The outcome of patients in traumatic cardiac arrest presenting to deployed military medical treatment facilities: Data from the UK Joint Theatre Trauma Registry. J. R. Army Med. Corps 2017, 164, 150–154. [Google Scholar] [CrossRef] [PubMed]
- Mackenzie, R.; Sutcliffe, R. Pre-hospital Care: The Trapped Patient. J. R. Army Med. Corps 2000, 146, 39–46. [Google Scholar] [CrossRef] [PubMed] [Green Version]
- Richesson, R.L.; Andrews, J.E.; Krischer, J.P. Use of SNOMED CT to Represent Clinical Research Data: A Semantic Characterization of Data Items on Case Report Forms in Vasculitis Research. J. Am. Med. Inform. Assoc. JAMIA 2006, 13, 536–546. [Google Scholar] [CrossRef] [PubMed] [Green Version]
- Fingerhut, L.A.; Warner, M. The ICD-10 injury mortality diagnosis matrix. Injury Prev. 2006, 12, 24–29. [Google Scholar] [CrossRef] [PubMed] [Green Version]
- ICD-NCHS. ICD Injury Matrices ICD-10. 2006. Available online: https://www.cdc.gov/nchs/injury/injury_matrices.htm (accessed on 25 May 2018).
- ICD–9–CM. Recommended Framework for Presenting Injury Mortality Data. MMWR 46 (RR-14), 1997. Available online: https://www.cdc.gov/mmwr/preview/mmwrhtml/00049162.htm (accessed on 25 May 2018).
- Walinjkar, A.; Woods, J. Personalized wearable systems for real-time ECG classification and healthcare interoperability: Real-time ECG classification and FHIR interoperability. In Proceedings of the 2017 Internet Technologies and Applications (ITA), Wrexham, UK, 12–15 September 2017. [Google Scholar]
- Lee, S.; Tewolde, G.; Kwon, J. Design and implementation of vehicle tracking system using GPS/GSM/GPRS technology and smartphone application. In Proceedings of the 2014 IEEE World Forum on Internet of Things (WF-IoT), Seoul, Korea, 6–8 March 2014. [Google Scholar]
- Heartisans. Measure Your Blood Pressure. Anywhere. Anytime. 2017. Available online: https://www.heartisans.com/ (accessed on 10 September 2018).
- Rodríguez, R.; Mexicano, A.; Bila, J.; Cervantes, S.; Ponce, R. Feature Extraction of Electrocardiogram Signals by Applying Adaptive Threshold and Principal Component Analysis. J. Appl. Res. Technol. 2015, 13, 261–269. [Google Scholar] [CrossRef]
- Jochen, A. Key Concepts and Techniques in GIS; SAGE Publications: London, UK, 2007. [Google Scholar]
- Taouli, S.A.; Bereksi-Reguig, F. Noise and baseline wandering suppression of ECG signals by morphological filter. J. Med. Eng. Technol. 2010, 34, 87–96. [Google Scholar] [CrossRef] [PubMed]
- Kumar, S.; Ayub, S. Estimation of Blood Pressure by Using Electrocardiogram (ECG) and Photo-Plethysmogram (PPG). In Proceedings of the 2015 Fifth International Conference on Communication Systems and Network Technologies, Gwalior, India, 4–6 April 2015. [Google Scholar]
- George, B.; Moody, R.G.M.; Zoccola, A.; Mantero, S. Derivation of Respiratory Signals from Multi-lead ECGs. Comput. Cardiol. 1985, 12, 113–116. [Google Scholar]
- Ahmad, S.; Chen, S.; Soueidan, K.; Batkin, I.; Bolic, M.; Dajani, H.; Groza, V. Electrocardiogram-Assisted Blood Pressure Estimation. IEEE Trans. Biomed. Eng. 2012, 59, 608–618. [Google Scholar] [CrossRef] [PubMed]
- Dinh, A.; Luu, L.; Cao, T. Blood Pressure Measurement Using Finger ECG and Photoplethysmogram for IoT; Springer: Singapore, 2018. [Google Scholar]
- Goldberger, A.L.; Amaral, L.A.N.; Glass, L.; Hausdorff, J.M.; Ivanov, P.C.; Mark, R.G.; Mietus, J.E.; Moody, G.B.; Peng, C.K.; Stanley, H.E. PhysioBank, PhysioToolkit, and PhysioNet: Components of a new research resource for complex physiologic signals. Circulation 2000, 101, E215–E220. [Google Scholar] [CrossRef] [PubMed]
- Scott, D.J.; Lee, J.; Silva, I.; Park, S.; Moody, G.B.; Celi, L.A.; Mark, R.G. Accessing the public MIMIC-II intensive care relational database for clinical research. BMC Med. Inform. Decis. Mak. 2013, 13, 9. [Google Scholar] [CrossRef] [PubMed]
- Da Poian, Q.G.; Schwabedal, J. PhysioNet-Cardiovascular-Signal-Toolbox, Version 1.0.0; Zenodo: Geneva, Switzerland, 2018. [Google Scholar]
- Saeed, M.; Villarroel, M.; Reisner, A.T.; Clifford, G.; Lehman, L.-W.; Moody, G.; Heldt, T.; Kyaw, T.H.; Moody, B.; Mark, R.G. Multiparameter Intelligent Monitoring in Intensive Care II (MIMIC-II): A public-access intensive care unit database. Crit. Care Med. 2011, 39, 952–960. [Google Scholar] [CrossRef] [PubMed]
- Pirracchio, R. Mortality Prediction in the ICU Based on MIMIC-II Results from the Super ICU Learner Algorithm (SICULA) Project. Secondary Analysis of Electronic Health Records; Springer International Publishing: Cham, Switzerland, 2016; pp. 295–313. [Google Scholar]
- Domingues, C.D.A.; Nogueira, L.D.S.; Settervall, C.H.C.; Sousa, R.M.C.D. Performance of Trauma and Injury Severity Score(TRISS) adjustments: An integrative review. Revista da Escola de Enfermagem da USP 2015, 49, 138–146. [Google Scholar] [CrossRef] [PubMed]
- Gleason, S.; Gebre-Egziabher, D. GNSS Applications and Methods; Artech House: Norwood, MA, USA, 2009. [Google Scholar]
- GPS.js. 2018. Available online: https://www.npmjs.com/package/gps (accessed on 28 July 2018).
- RTKLIB. Wiki Page. Last Modified on 4 March 2018. Available online: http://wiki.openstreetmap.org/w/index.php?title=RTKLIB&oldid=1580925 (accessed on 5 June 2018).
- RTKLIB-Compatible GPS Devices. Wiki Page. Last Modified on 20 March 2018. Available online: http://wiki.openstreetmap.org/w/index.php?title=RTKLIB-compatible_GPS_devices&oldid=1591413 (accessed on 5 June 2018).
- Download OpenStreetMap Data for This Region: Essex. 2018. Available online: http://download.geofabrik.de/europe/great-britain/england/essex.html (accessed on 18 June 2018).
- OpenStreetMap Main Page. Last Modified 10 July 2014. Available online: https://wiki.openstreetmap.org/wiki/Main_Page (accessed on 10 September 2018).
- Assessment Scales. Wiki Page. Last Modified on 27 December 2012. Available online: http://wiki.hl7.org/index.php?title=Assessment_Scales (accessed on 21 June 2018).
- SNOWMED-International. SNOMED International SNOMED CT Browser. 2018. Available online: http://browser.ihtsdotools.org/ (accessed on 10 September 2018).
Figure 1.
Composite sensor kit architecture showing all the data acquisition, signal processing, and computing components
Figure 1.
Composite sensor kit architecture showing all the data acquisition, signal processing, and computing components

Figure 2.
The signal waveforms (a) for the vital signs of heart rate, respiratory rate, SpO2 (pulse oximeter) and systolic blood pressure for Record 033n of the MIMIC Numerics database. The power spectrum also shows a cutoff at a frequency of 0.25 (normalized in radians/sample). The composite sensor kit (b) showing the ECG sensor, SpO2, and the GPS/GNSS (positioning) sensor boards, to capture vital signs from human subjects. Breathing rate (BR) or the respiratory rate (RR) are key physiological parameters that are used in calculating trauma scores, and they are still widely measured by counting the breaths manually. Quite a few algorithms have been proposed to estimate the RR from the electrocardiogram (ECG) and pulse oximetry (Photoplethysmogram, PPG) signals. These RR non-invasive methods of RR estimation are applicable in both healthcare and fitness monitoring [39].
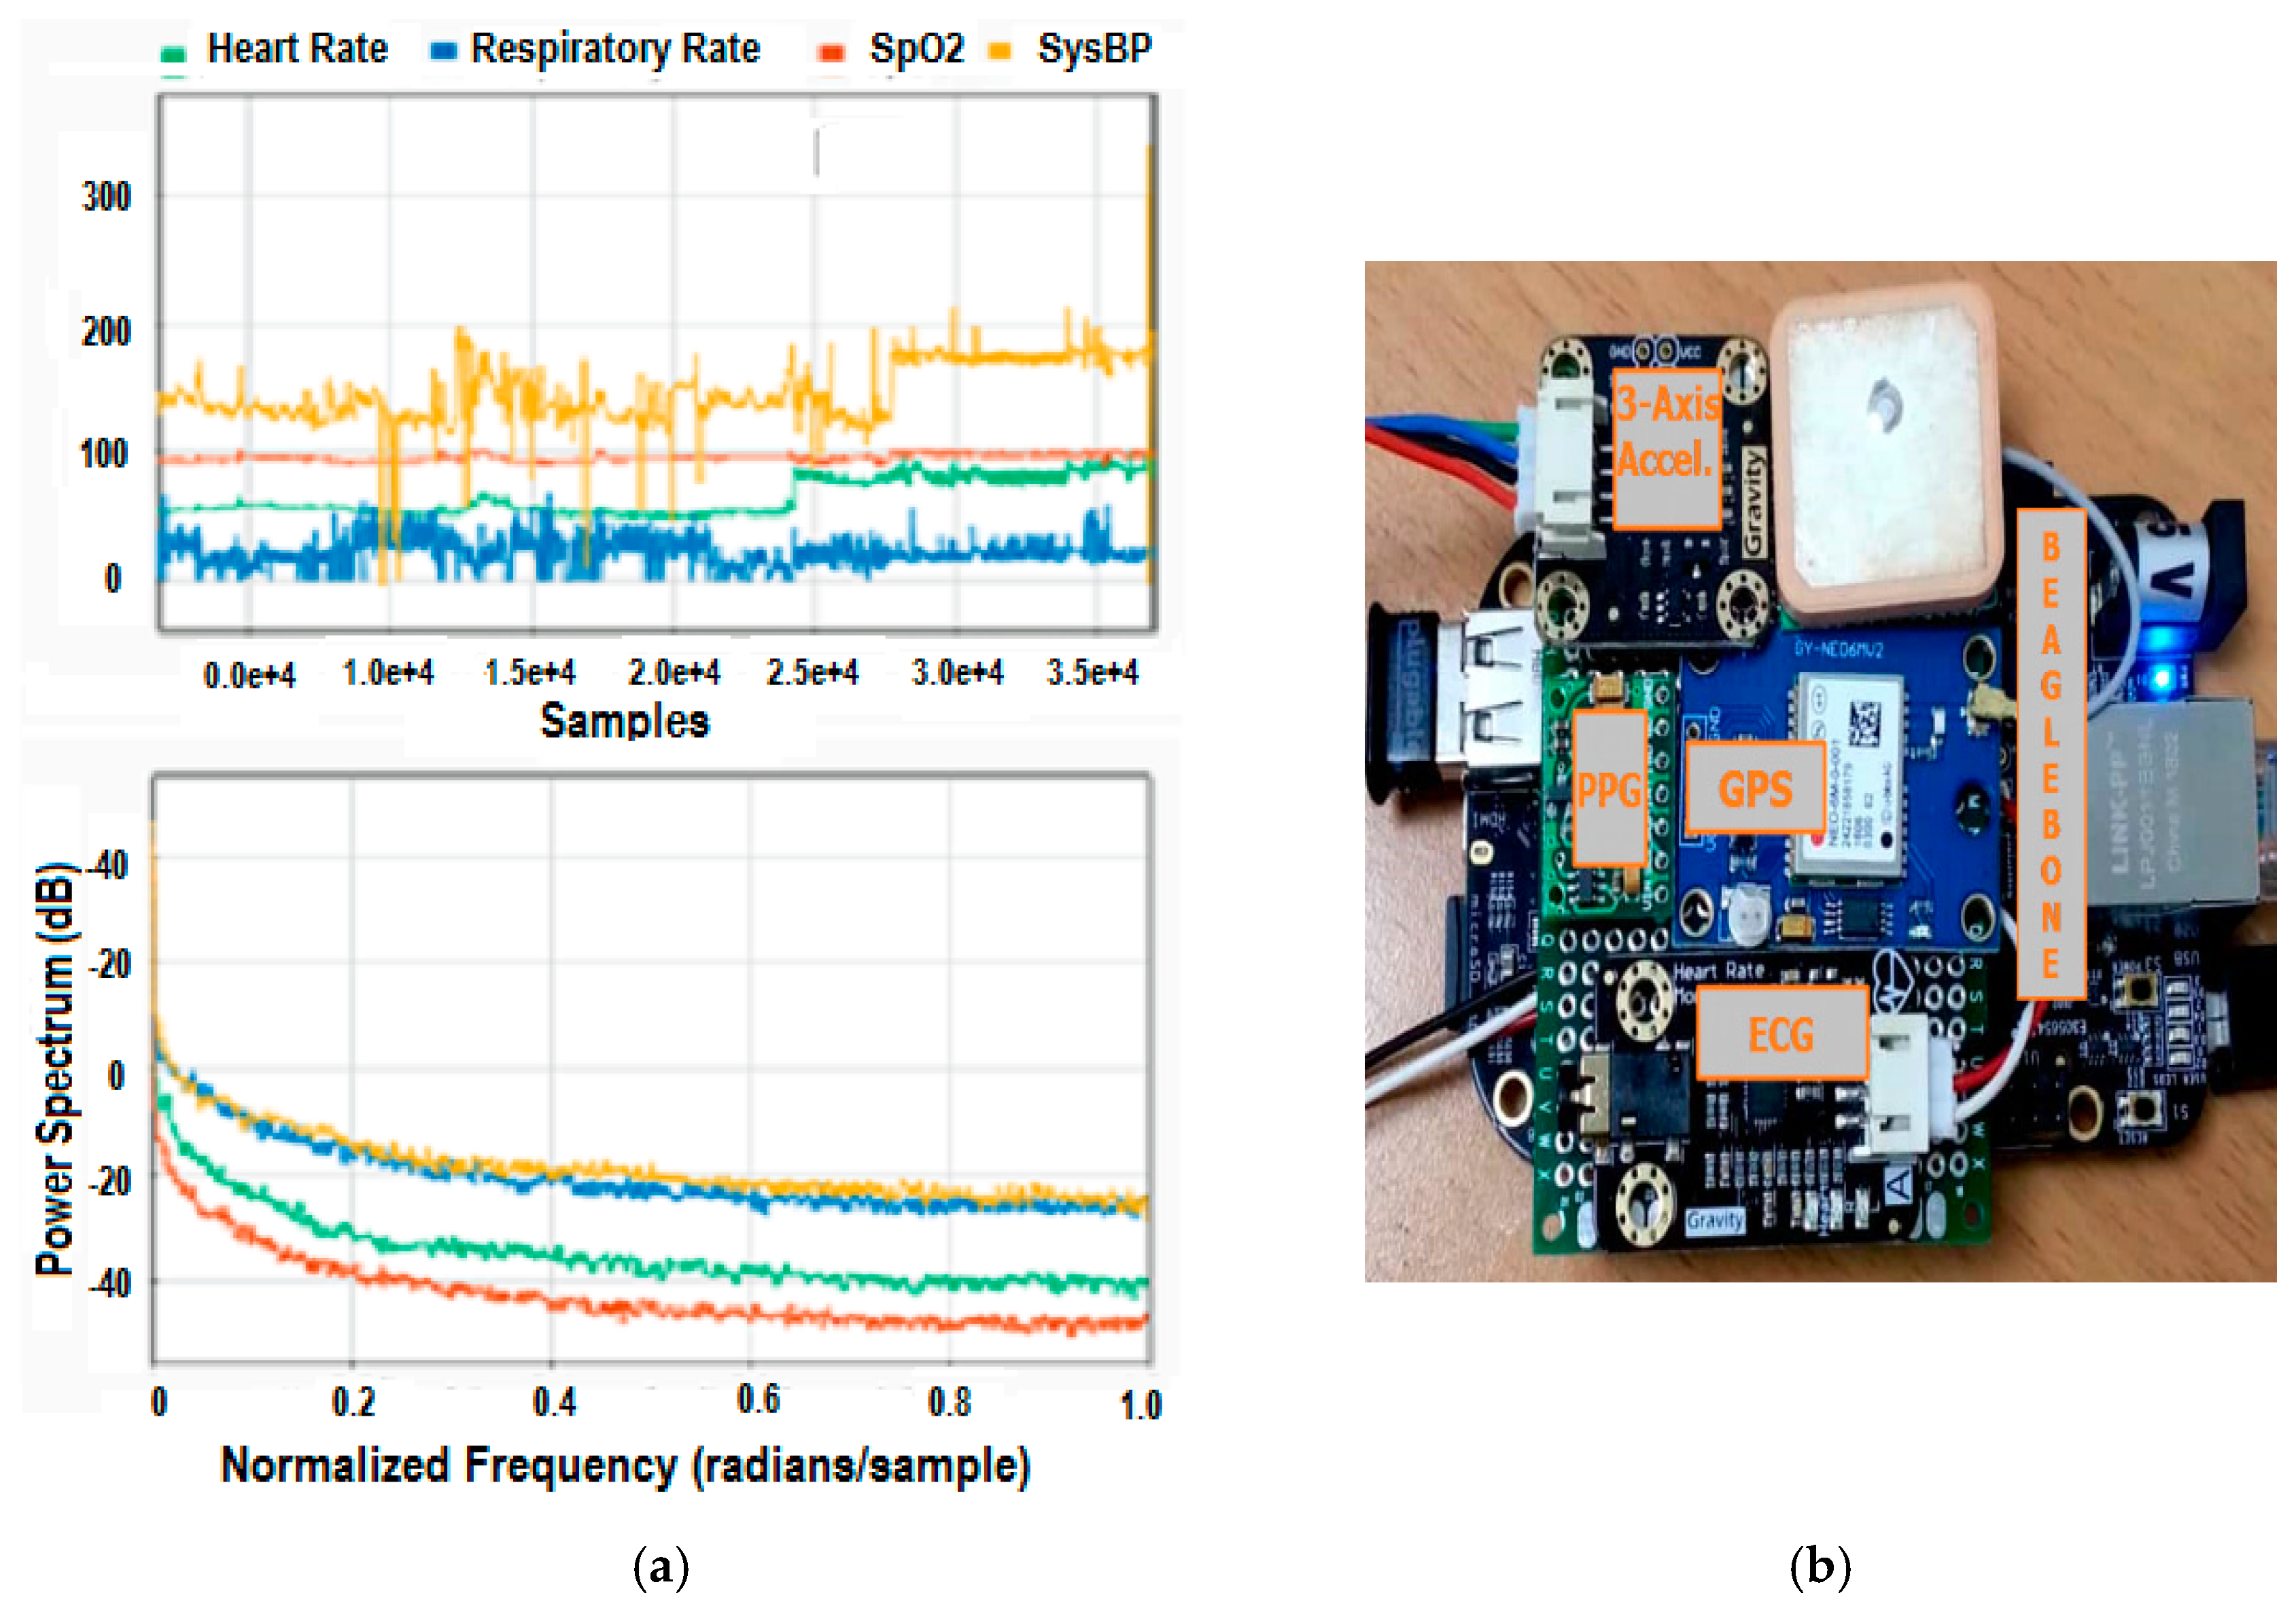
Figure 3.
SMART FHIR server architecture showing the RESTful Web services that could be accessed from an embedded system hardware (Beaglebone Black).
Figure 3.
SMART FHIR server architecture showing the RESTful Web services that could be accessed from an embedded system hardware (Beaglebone Black).
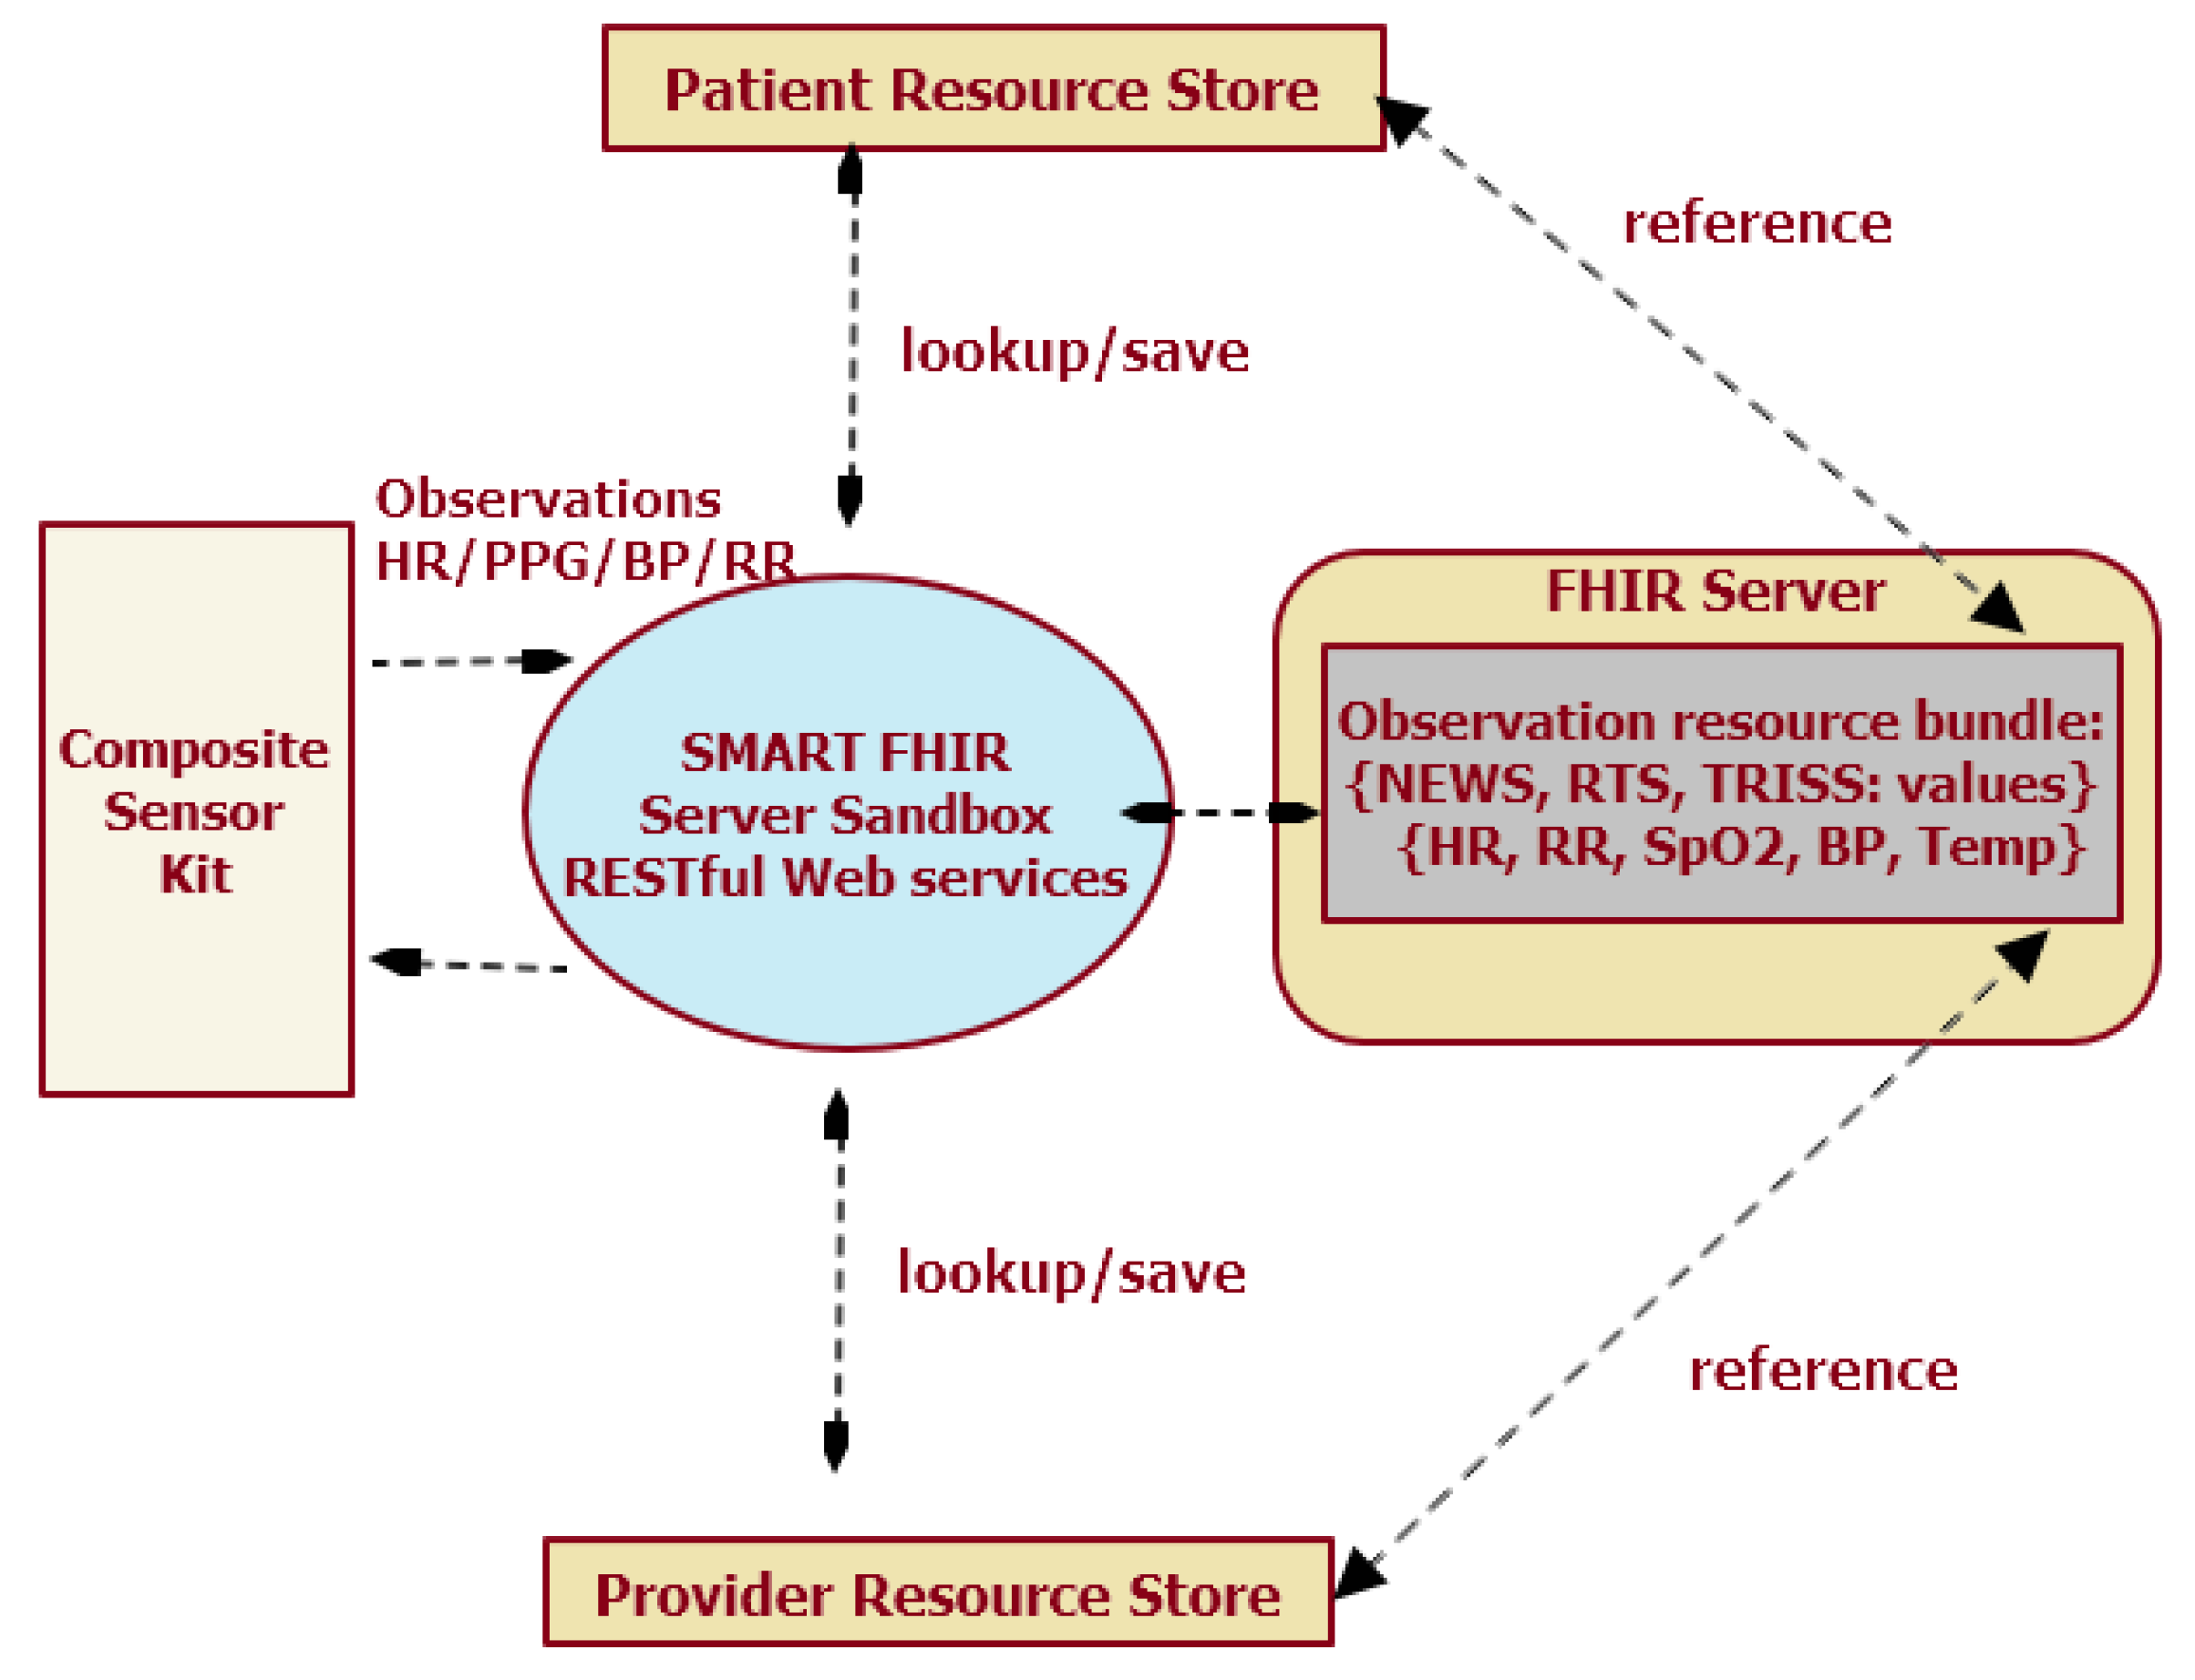
Figure 4.
Noise removal in the ECG signal using stationary wavelet transforms 1-D (MATLAB) using ‘sym4’ wavelet and level ‘5’ decomposition. The de-noised, corrected signal shown overlaying the noisy signal. The ECG signal was used to derive the heart rate and arterial blood pressure using Physionet WFDB library.
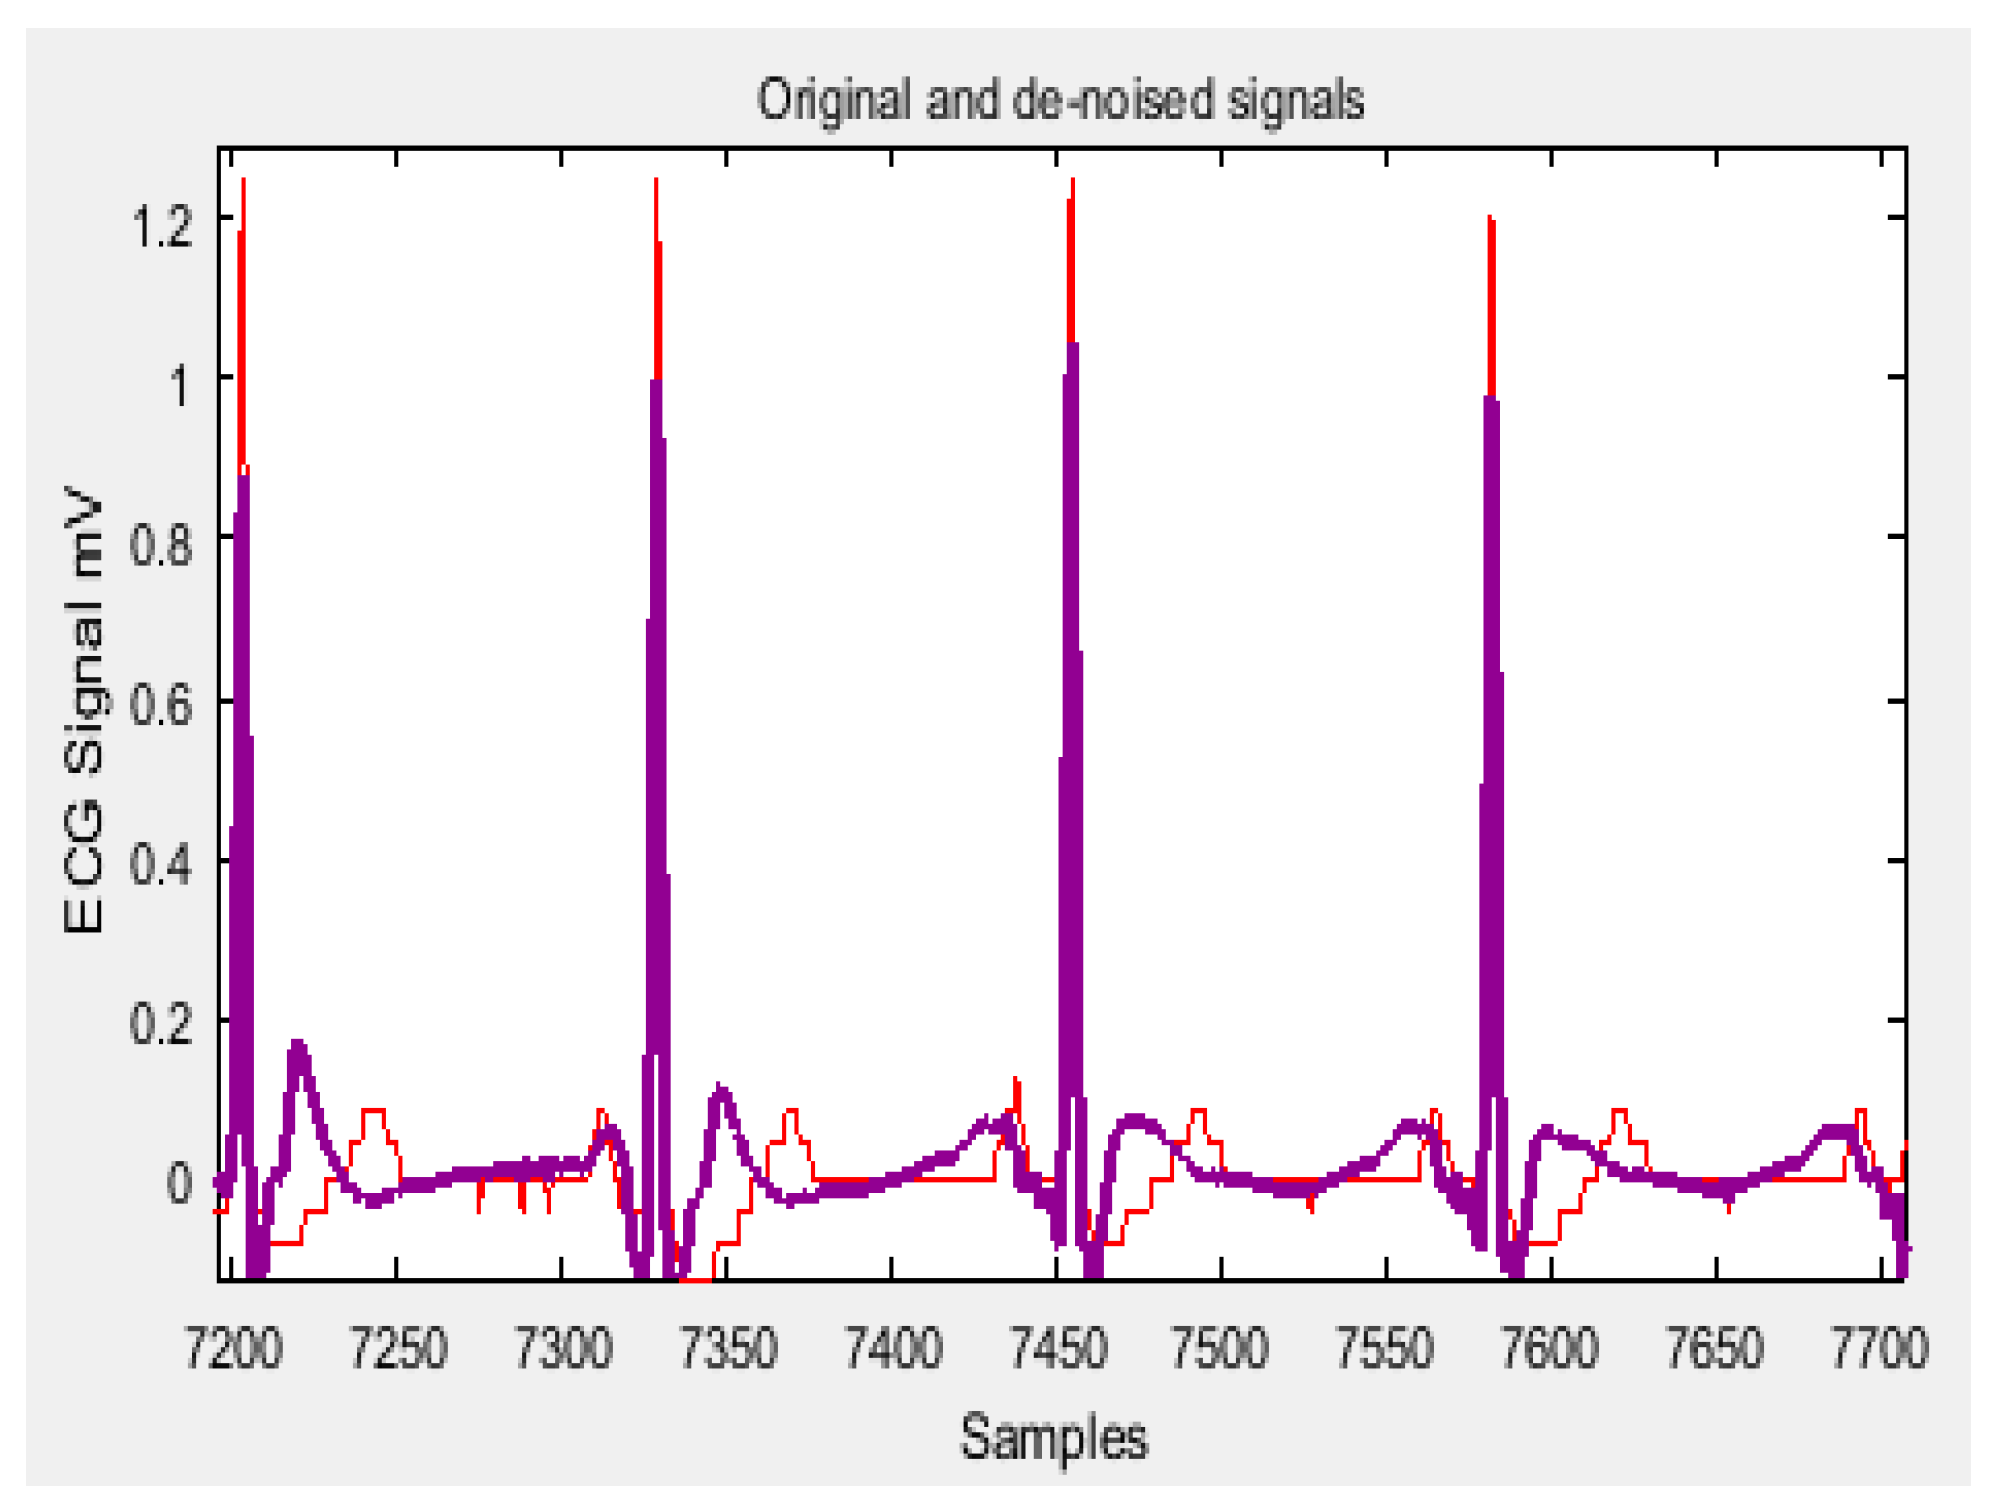
Figure 5.
Spectral image of the respiratory rate (RR) waveform clearly showing two episodes of respiratory rate failure for Record 033n in the MIMIC Numerics database.
Figure 5.
Spectral image of the respiratory rate (RR) waveform clearly showing two episodes of respiratory rate failure for Record 033n in the MIMIC Numerics database.
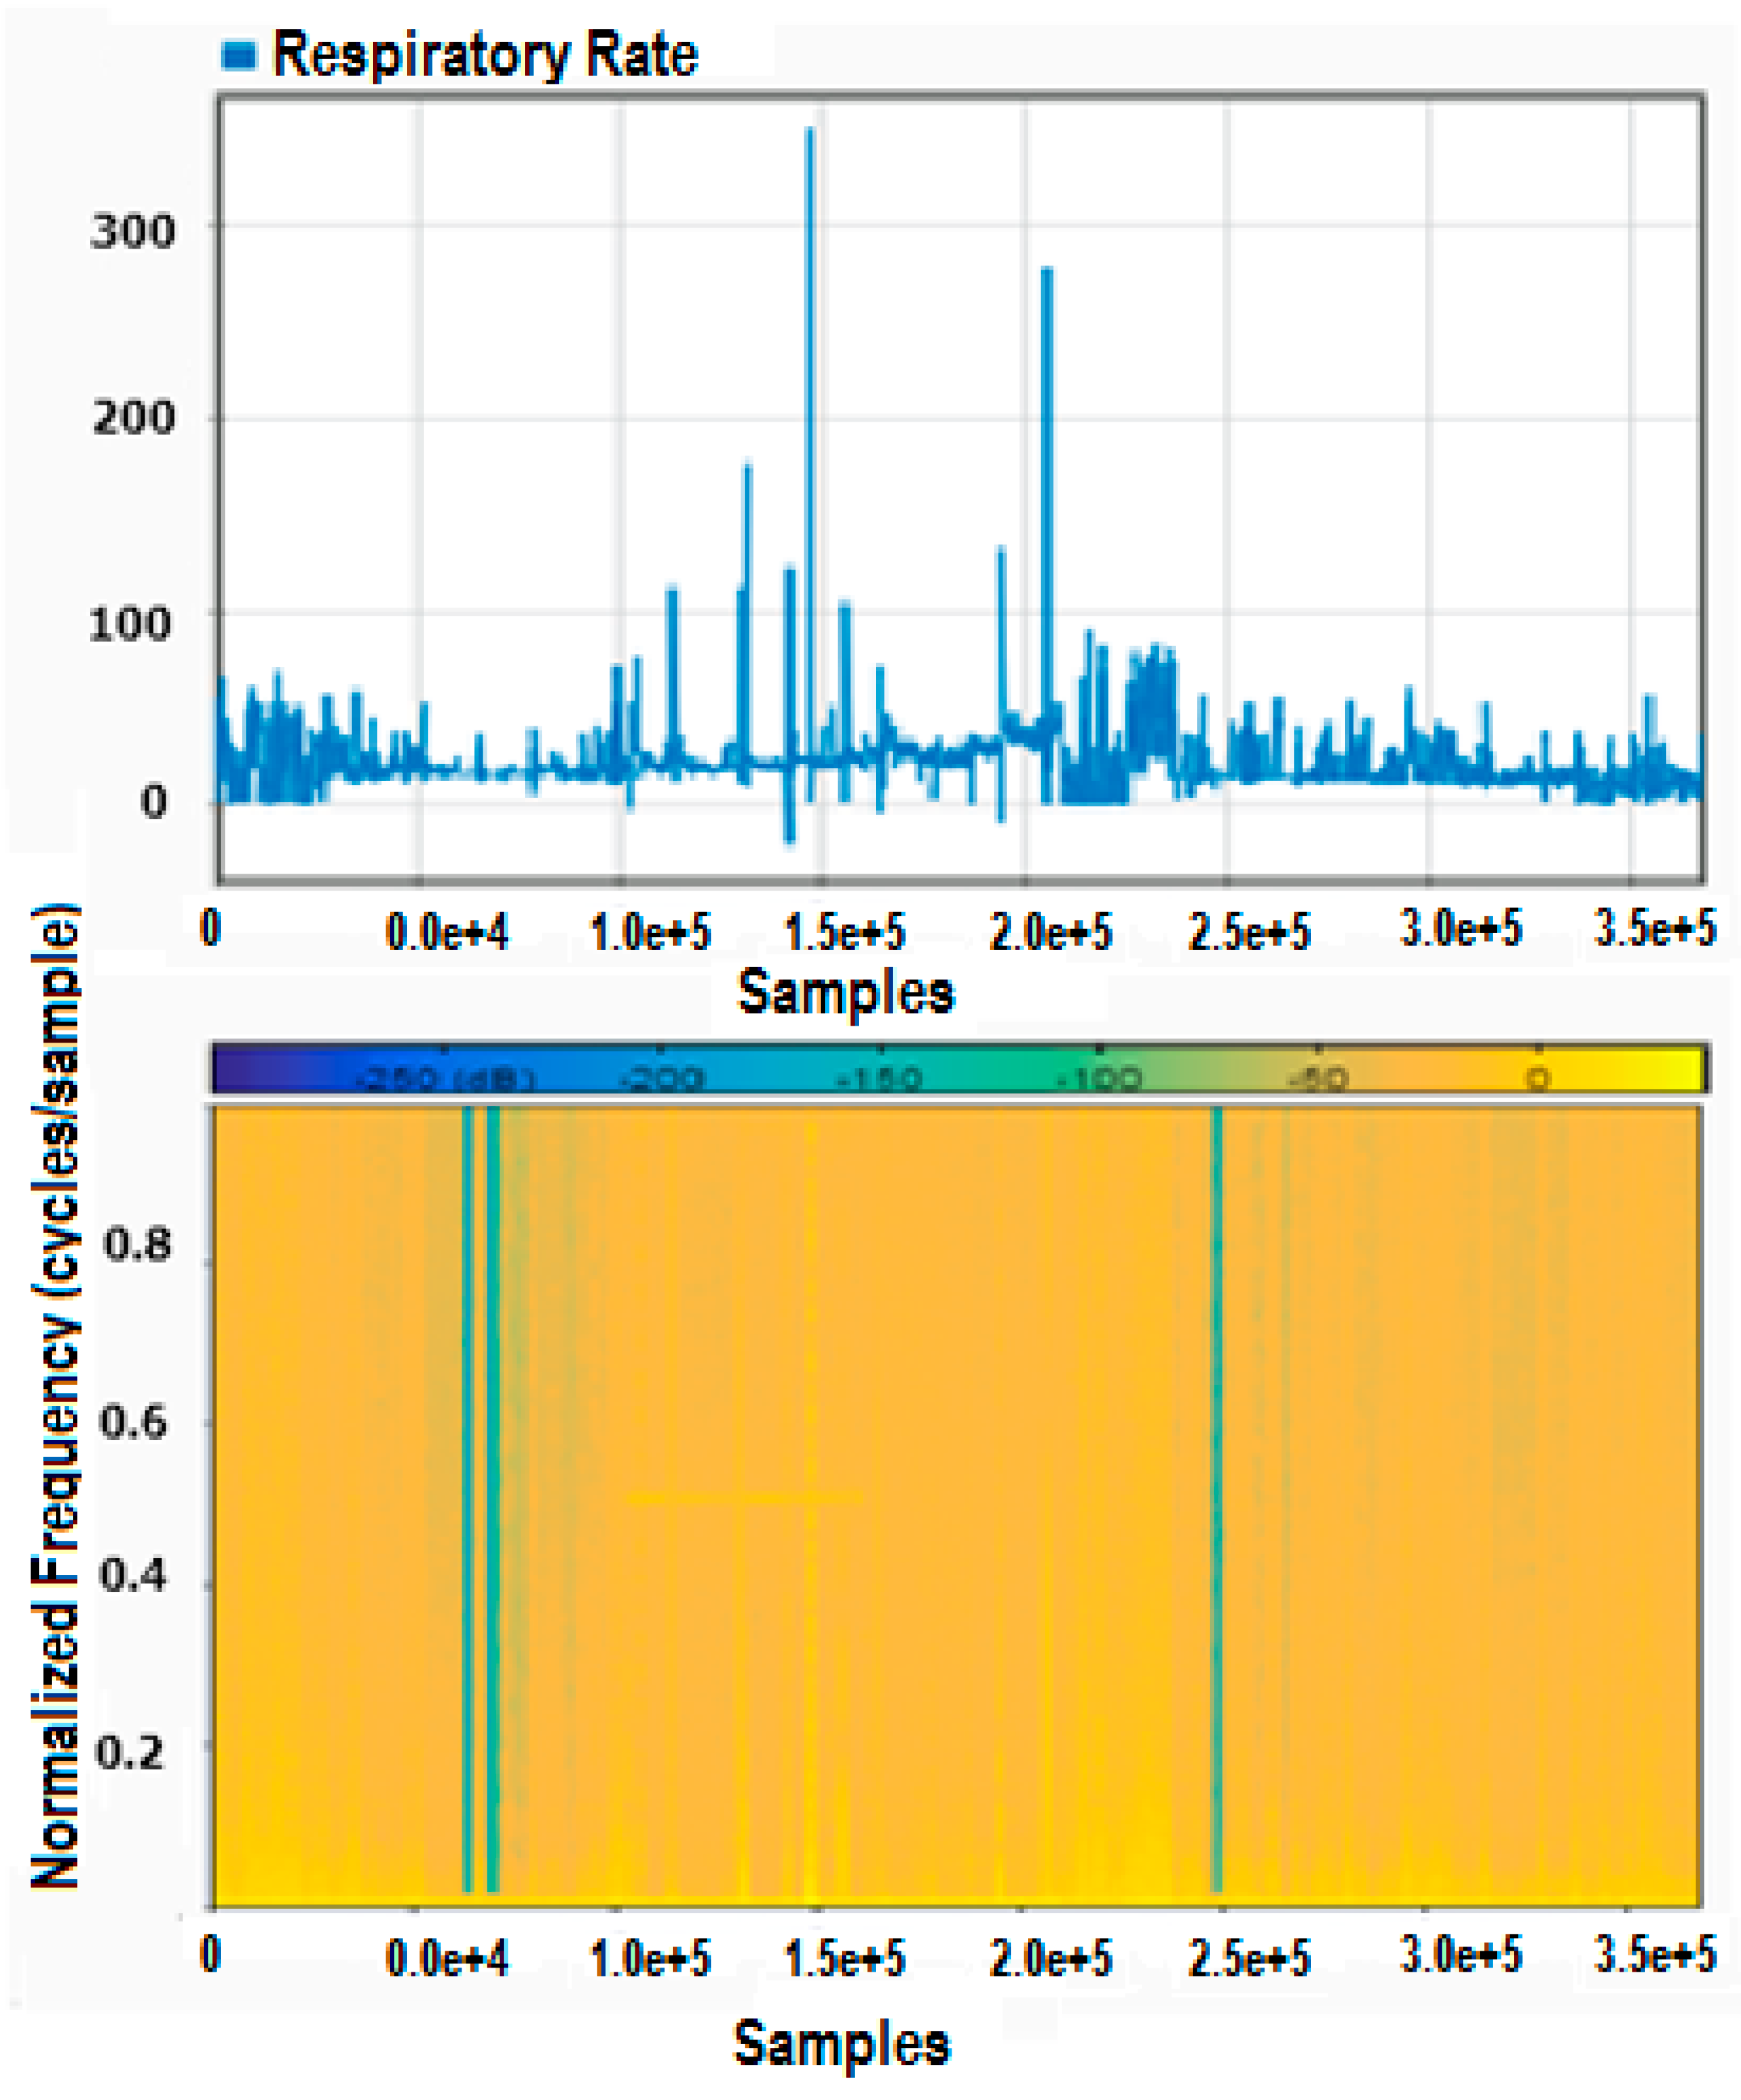
Figure 6.
The shortest route algorithm using the QGIS Network Analysis tool indicating the shortest route between the start- and the end-points. In the figure, (a) shows the start and the end point latitude and longitude and the distance and time it would take to reach the end point; (b) shows the rendered map layer with the track between the two end points.
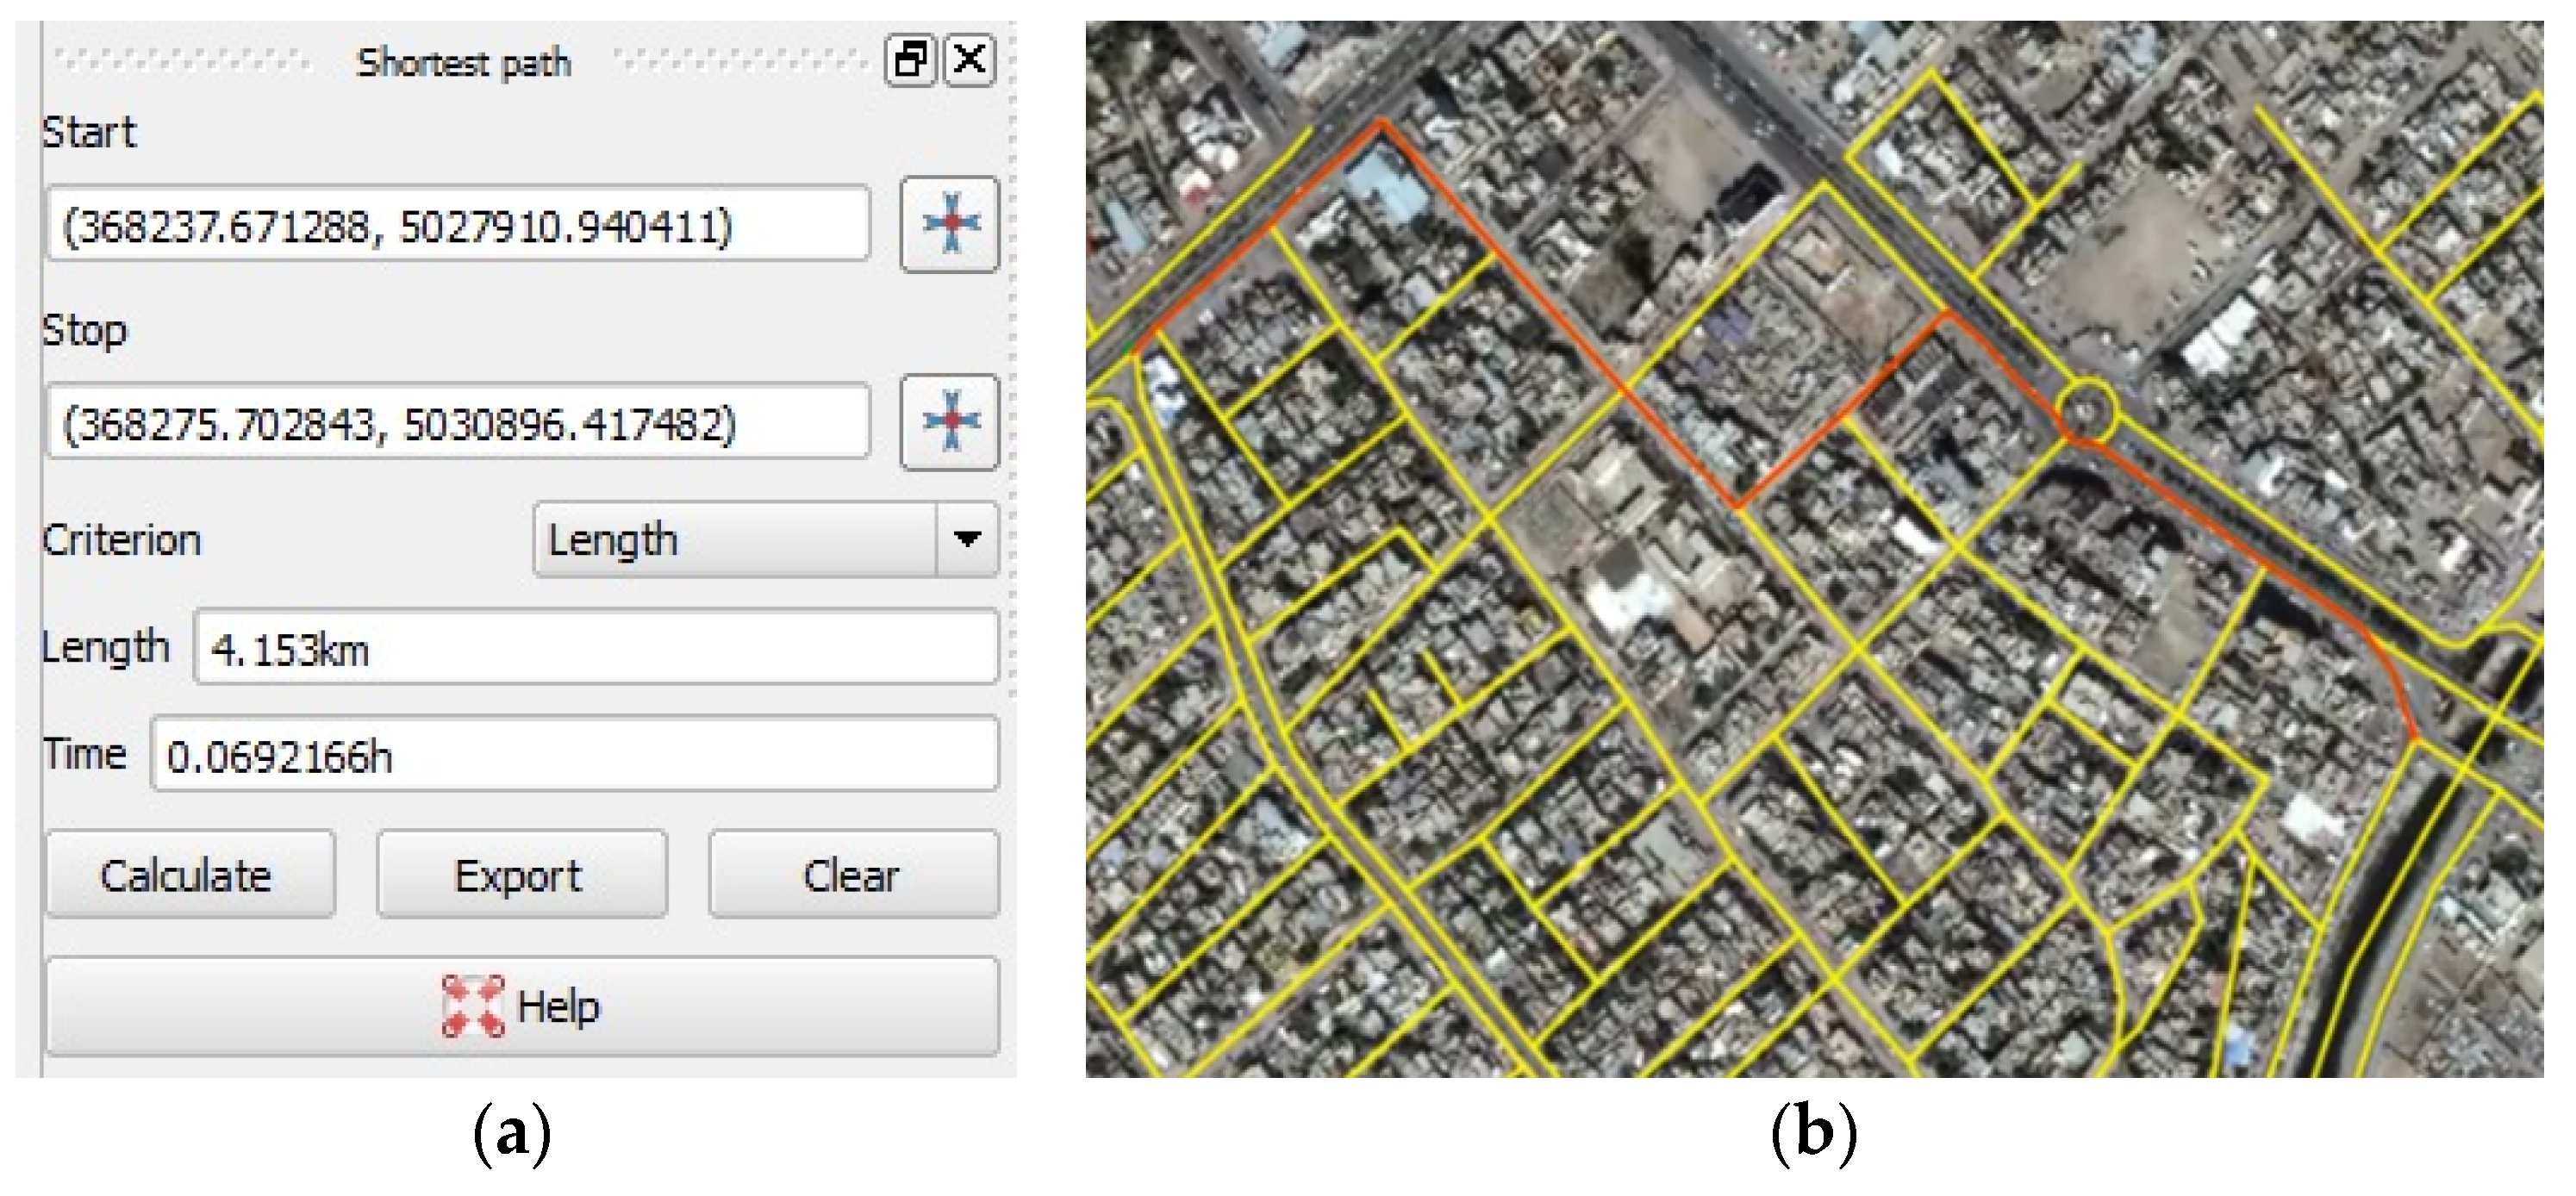

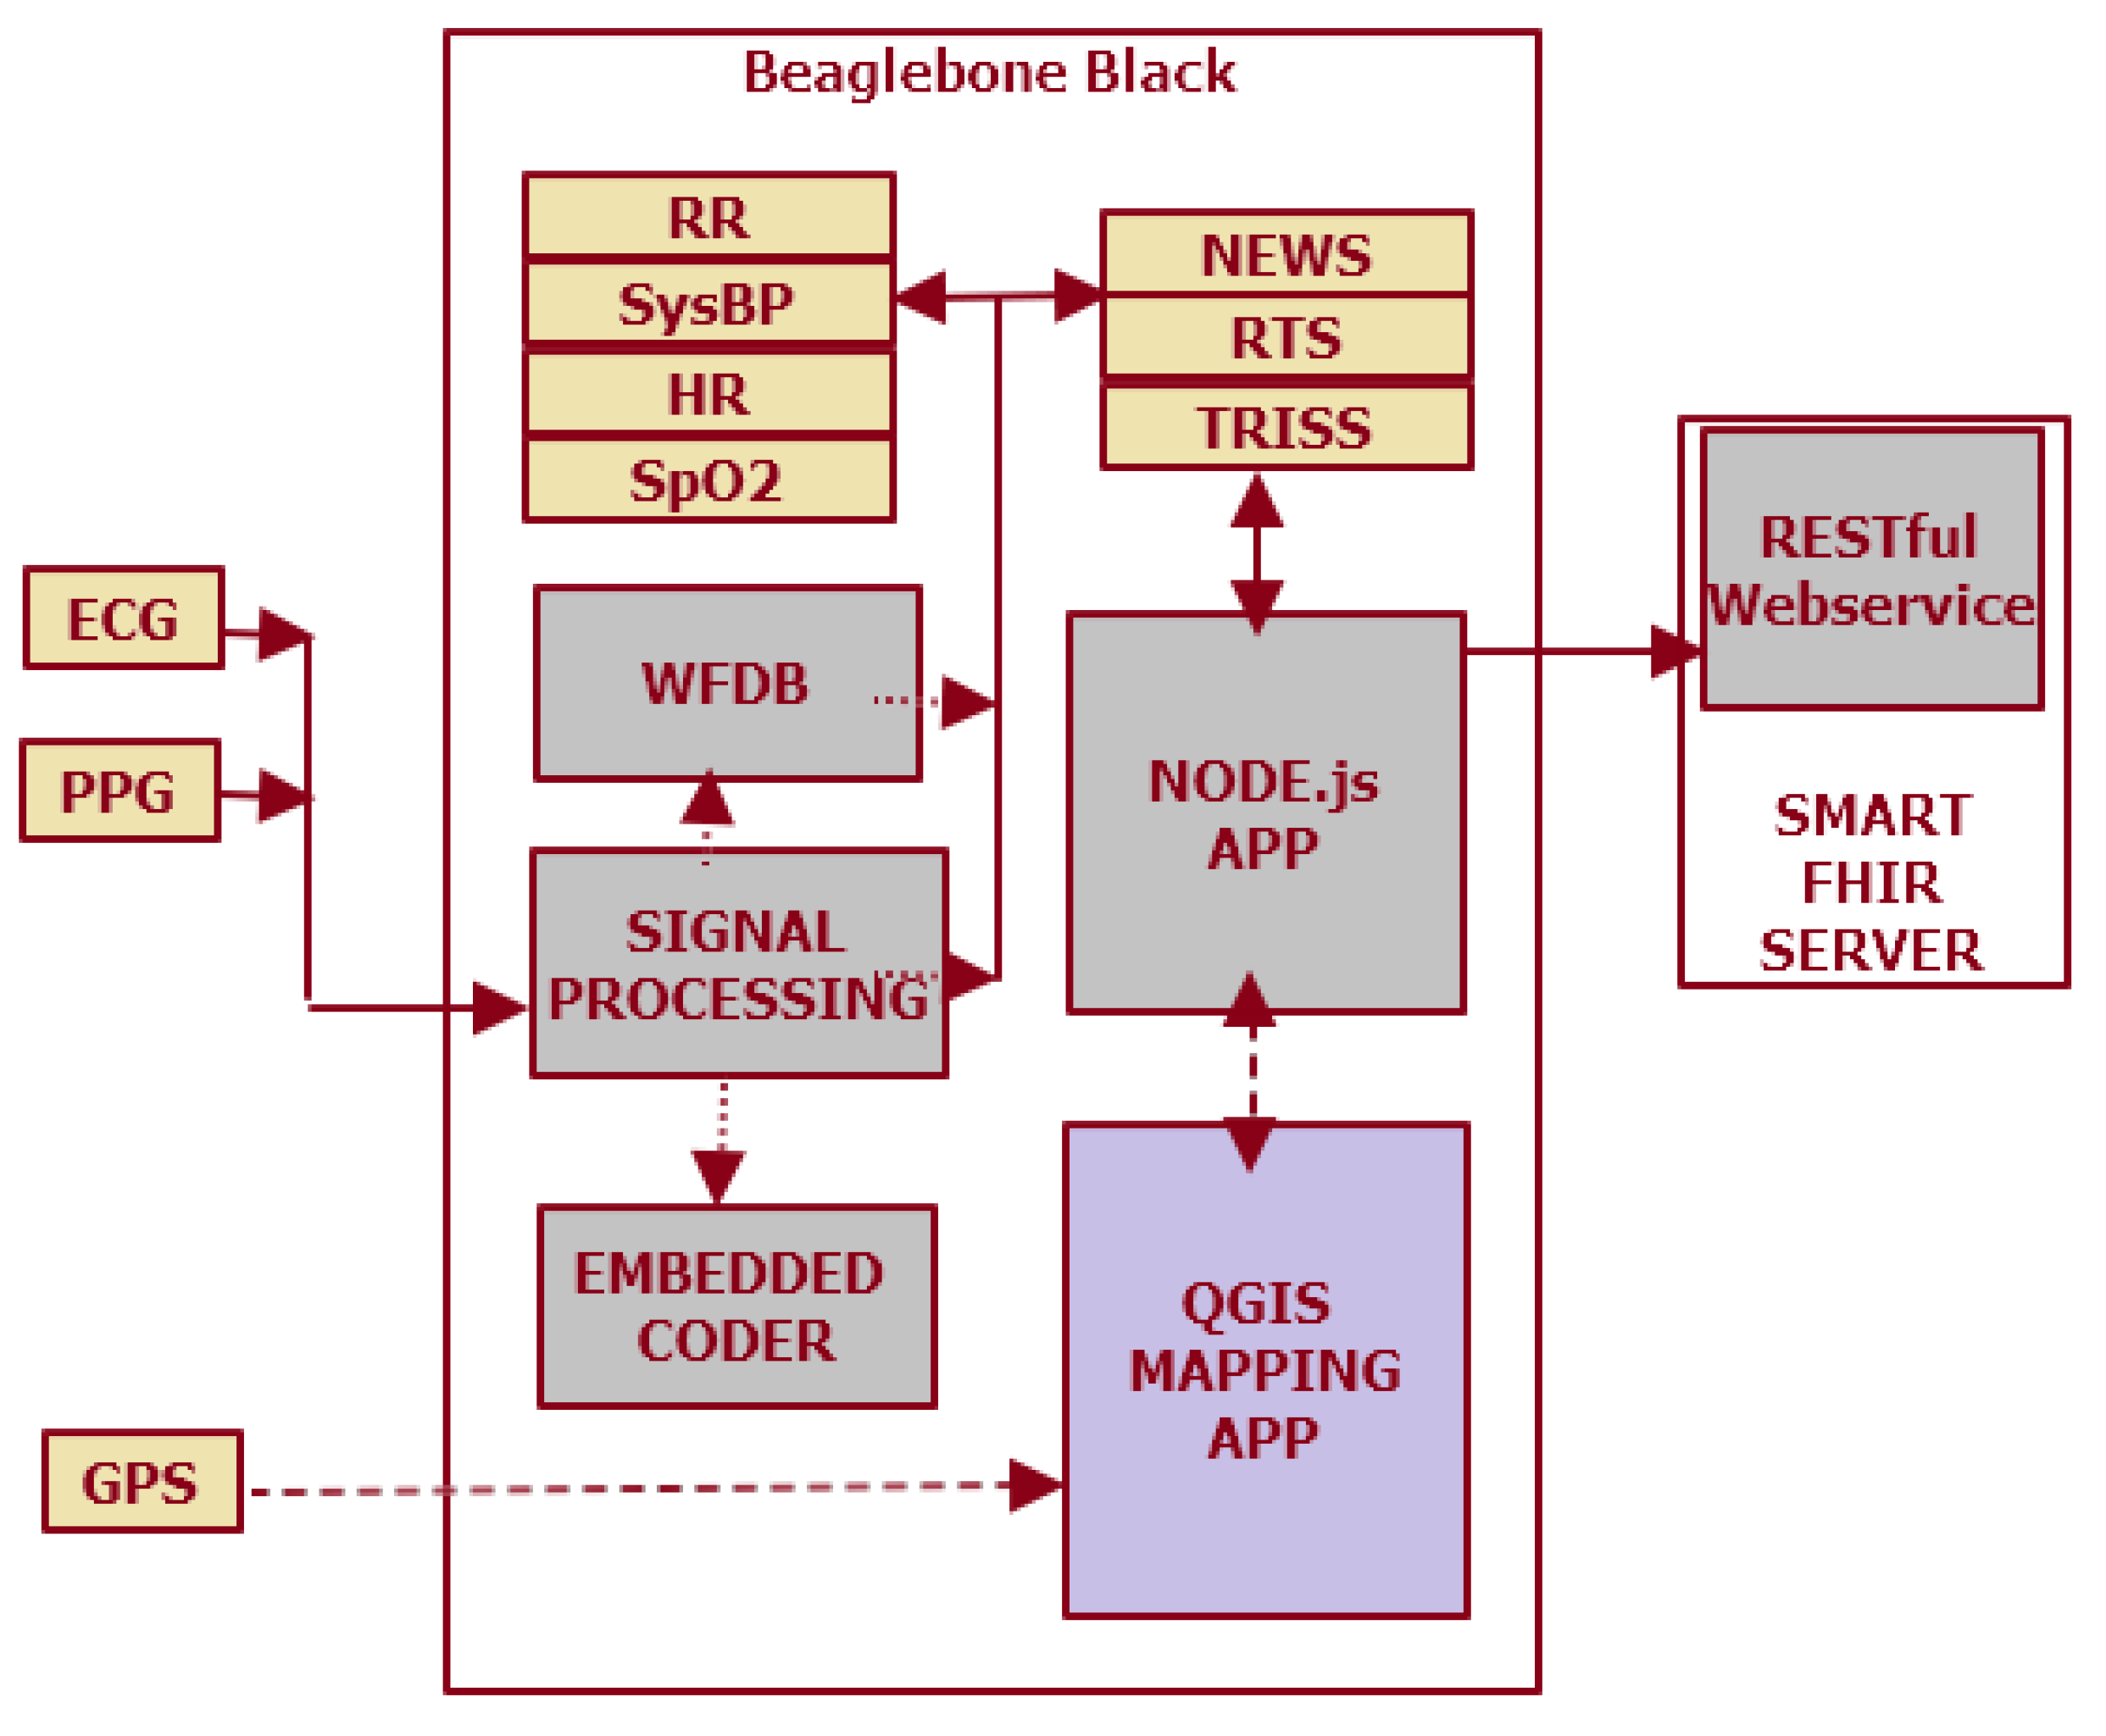
Table 1.
Trauma scores and physiological parameters.
| NEWS | RTS | TRISS | |
|---|---|---|---|
| Parameters used | Respiratory Rate Oxygen Saturations Supplemental Oxygen (Y/N) Temperature Systolic Blood Pressure Heart Rate AVPU Score | Glasgow Coma Scale (GCS): Eye + Verbal + Motor response score Systolic BP Respiratory Rate | Uses RTS and ISS ISS: (Anatomical injury scores for Head + Face + Chest + Abdomen injury) Severity of injury |
| Interpretation | NEWS 1–4: escalation of clinical care NEWS of 5–6 or a RED score: escalation to critical care NEWS ≥ 7: escalation to critical care with maximum competency | GCS of <15 warrants close attention GCS of <8 is of clinical concern RTS <= 2: critical care situation with less than 15% chance of survival | ISS of 75 and higher is critical with less chance of survival. Ps (blunt/penetrating) values (0 to 1): Values less than 0.15: less chance of survival |
NEWS, RTS, and TRISS scoring schemes used in the research.
Table 2.
FHIR-specific code to encapsulate an observation of RTS trauma score that can be uploaded as a Resource Bundle in XML or JSON format to the FHIR Server sandbox.
Table 2.
FHIR-specific code to encapsulate an observation of RTS trauma score that can be uploaded as a Resource Bundle in XML or JSON format to the FHIR Server sandbox.
| // Create a FHIR Observation object. |
| Observation observ= new Observation (); |
| // Assign a randomly generated Universal ID (UUID). |
| observ.setId(uuid) |
| // Set the Observation code according to a Coding System |
| // Coding System refers to RTS trauma score in SNOMED CT |
| observ.getCode() |
| .addCoding() |
| .setSystem(“http://snomed.info/sct”) |
| .setCode(“273885003”) |
| .setDisplay(“RTS Trauma Assessment”) |
| observ.setValue( |
| new QuantityDt() |
| .setValue(3) |
| // Set the Date and Time stamp for the observation |
| observ.setIssued( |
| new InstantDt(“2017-05-05T15:30:10+01:00”)) |
| // The Observation upload request above generated the following |
| // response in XML or JSON format after observation is logged to |
| // FHIR Servers. |
| <Bundle xmlns=“http://hl7.org/fhir”> |
| <id value=“ddde128-e4e2-481ee-9acb3-c5eebc2ec5e0”/> |
| <type value=“transaction-response”/> |
| <entry> |
| <response> |
| <status value=“201 Created”/> |
| <location value=“Observation/96728/_history/1”/> |
| <etag value=“1”/> |
| <lastModified value=“2017-05-05T15:30:10+01:00”/> |
| </response> |
| </entry> |
| </Bundle> |
Table 3.
Correlation between Ps, NEWS, and RTS scores.
| Scores and Correlation Measure | PsBlunt | NEWS | RTS | |
|---|---|---|---|---|
| PsBlunt | Pearson Correlation | 1 | 0.7950 ** | 0.0630 ** |
| Sig. (2-tailed) | 0.000 | 0.000 | ||
| N | 368721 | 368721 | 368721 | |
| NEWS | Pearson Correlation | 0.795 ** | 1 | −0.252 ** |
| Sig. (2-tailed) | 0.000 | 0.000 | ||
| N | 368721 | 368721 | 368721 | |
| RTS | Pearson Correlation | 0.063 ** | −0.252 ** | 1 |
| Sig. (2-tailed) | 0.000 | 0.000 | ||
| N | 368721 | 368721 | 368721 | |
**Correlation is significant at the 0.01 level (2-tailed).
Table 4.
Regression for Ps (Blunt) prediction.
| Model | R | R Square | Adjusted R Square | Std. Error of the Estimate |
|---|---|---|---|---|
| 1 | 0.968 a | 0.937 | 0.937 | 0.033065132300000 |
a Predictors: (Constant), SpO2, RespiratoryRate, SysBP, HeartRate, Age.
© 2018 by the author. Licensee MDPI, Basel, Switzerland. This article is an open access article distributed under the terms and conditions of the Creative Commons Attribution (CC BY) license (http://creativecommons.org/licenses/by/4.0/).
Share and Cite
MDPI and ACS Style
Walinjkar, A. A Composite and Wearable Sensor Kit for Location-Aware Healthcare Monitoring and Real-Time Trauma Scoring for Survival Prediction. Appl. Syst. Innov. 2018, 1, 35. https://doi.org/10.3390/asi1030035
AMA Style
Walinjkar A. A Composite and Wearable Sensor Kit for Location-Aware Healthcare Monitoring and Real-Time Trauma Scoring for Survival Prediction. Applied System Innovation. 2018; 1(3):35. https://doi.org/10.3390/asi1030035
Chicago/Turabian StyleWalinjkar, Amit. 2018. "A Composite and Wearable Sensor Kit for Location-Aware Healthcare Monitoring and Real-Time Trauma Scoring for Survival Prediction" Applied System Innovation 1, no. 3: 35. https://doi.org/10.3390/asi1030035