Spray-Dried Cellulose Nanofibril-Reinforced Polypropylene Composites for Extrusion-Based Additive Manufacturing: Nonisothermal Crystallization Kinetics and Thermal Expansion

 ,
,
Abstract
:1. Introduction
2. Materials and Methods
2.1. Materials
2.2. Composite Manufacturing
2.3. Nonisothermal Crystallization Study
2.4. Microscopy Study
2.5. Coefficient of Thermal Expansion (CTE)
3. Results and Discussion
3.1. Nonisothermal Crystallization Kinetics
3.2. Nonisothermal Crystallization Kinetics Modeling
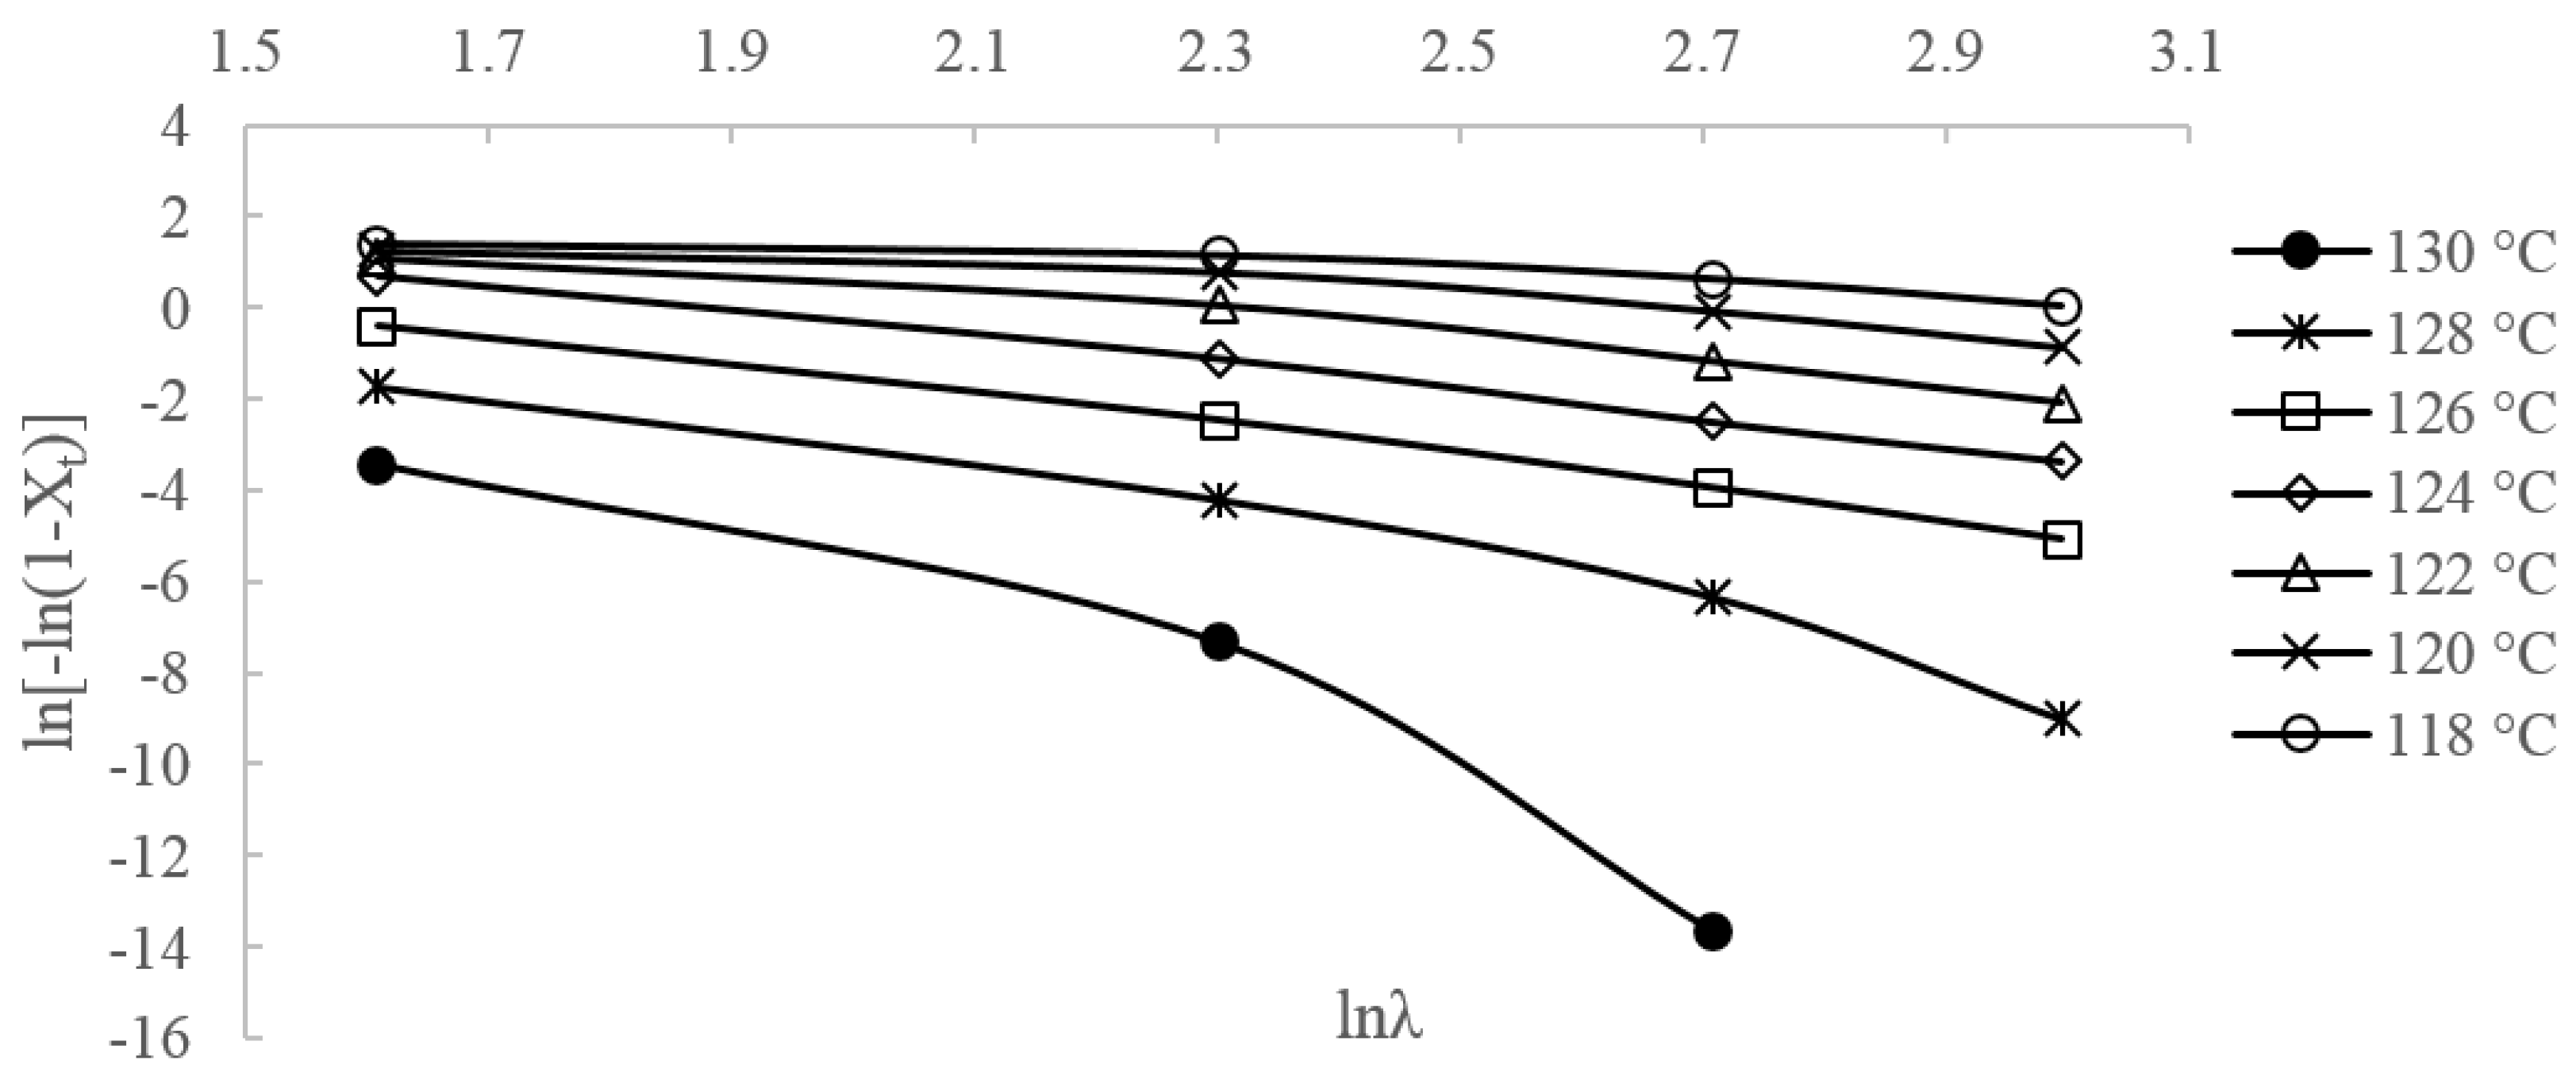
3.2.1. Jeziorny Method
3.2.2. Ozawa Method
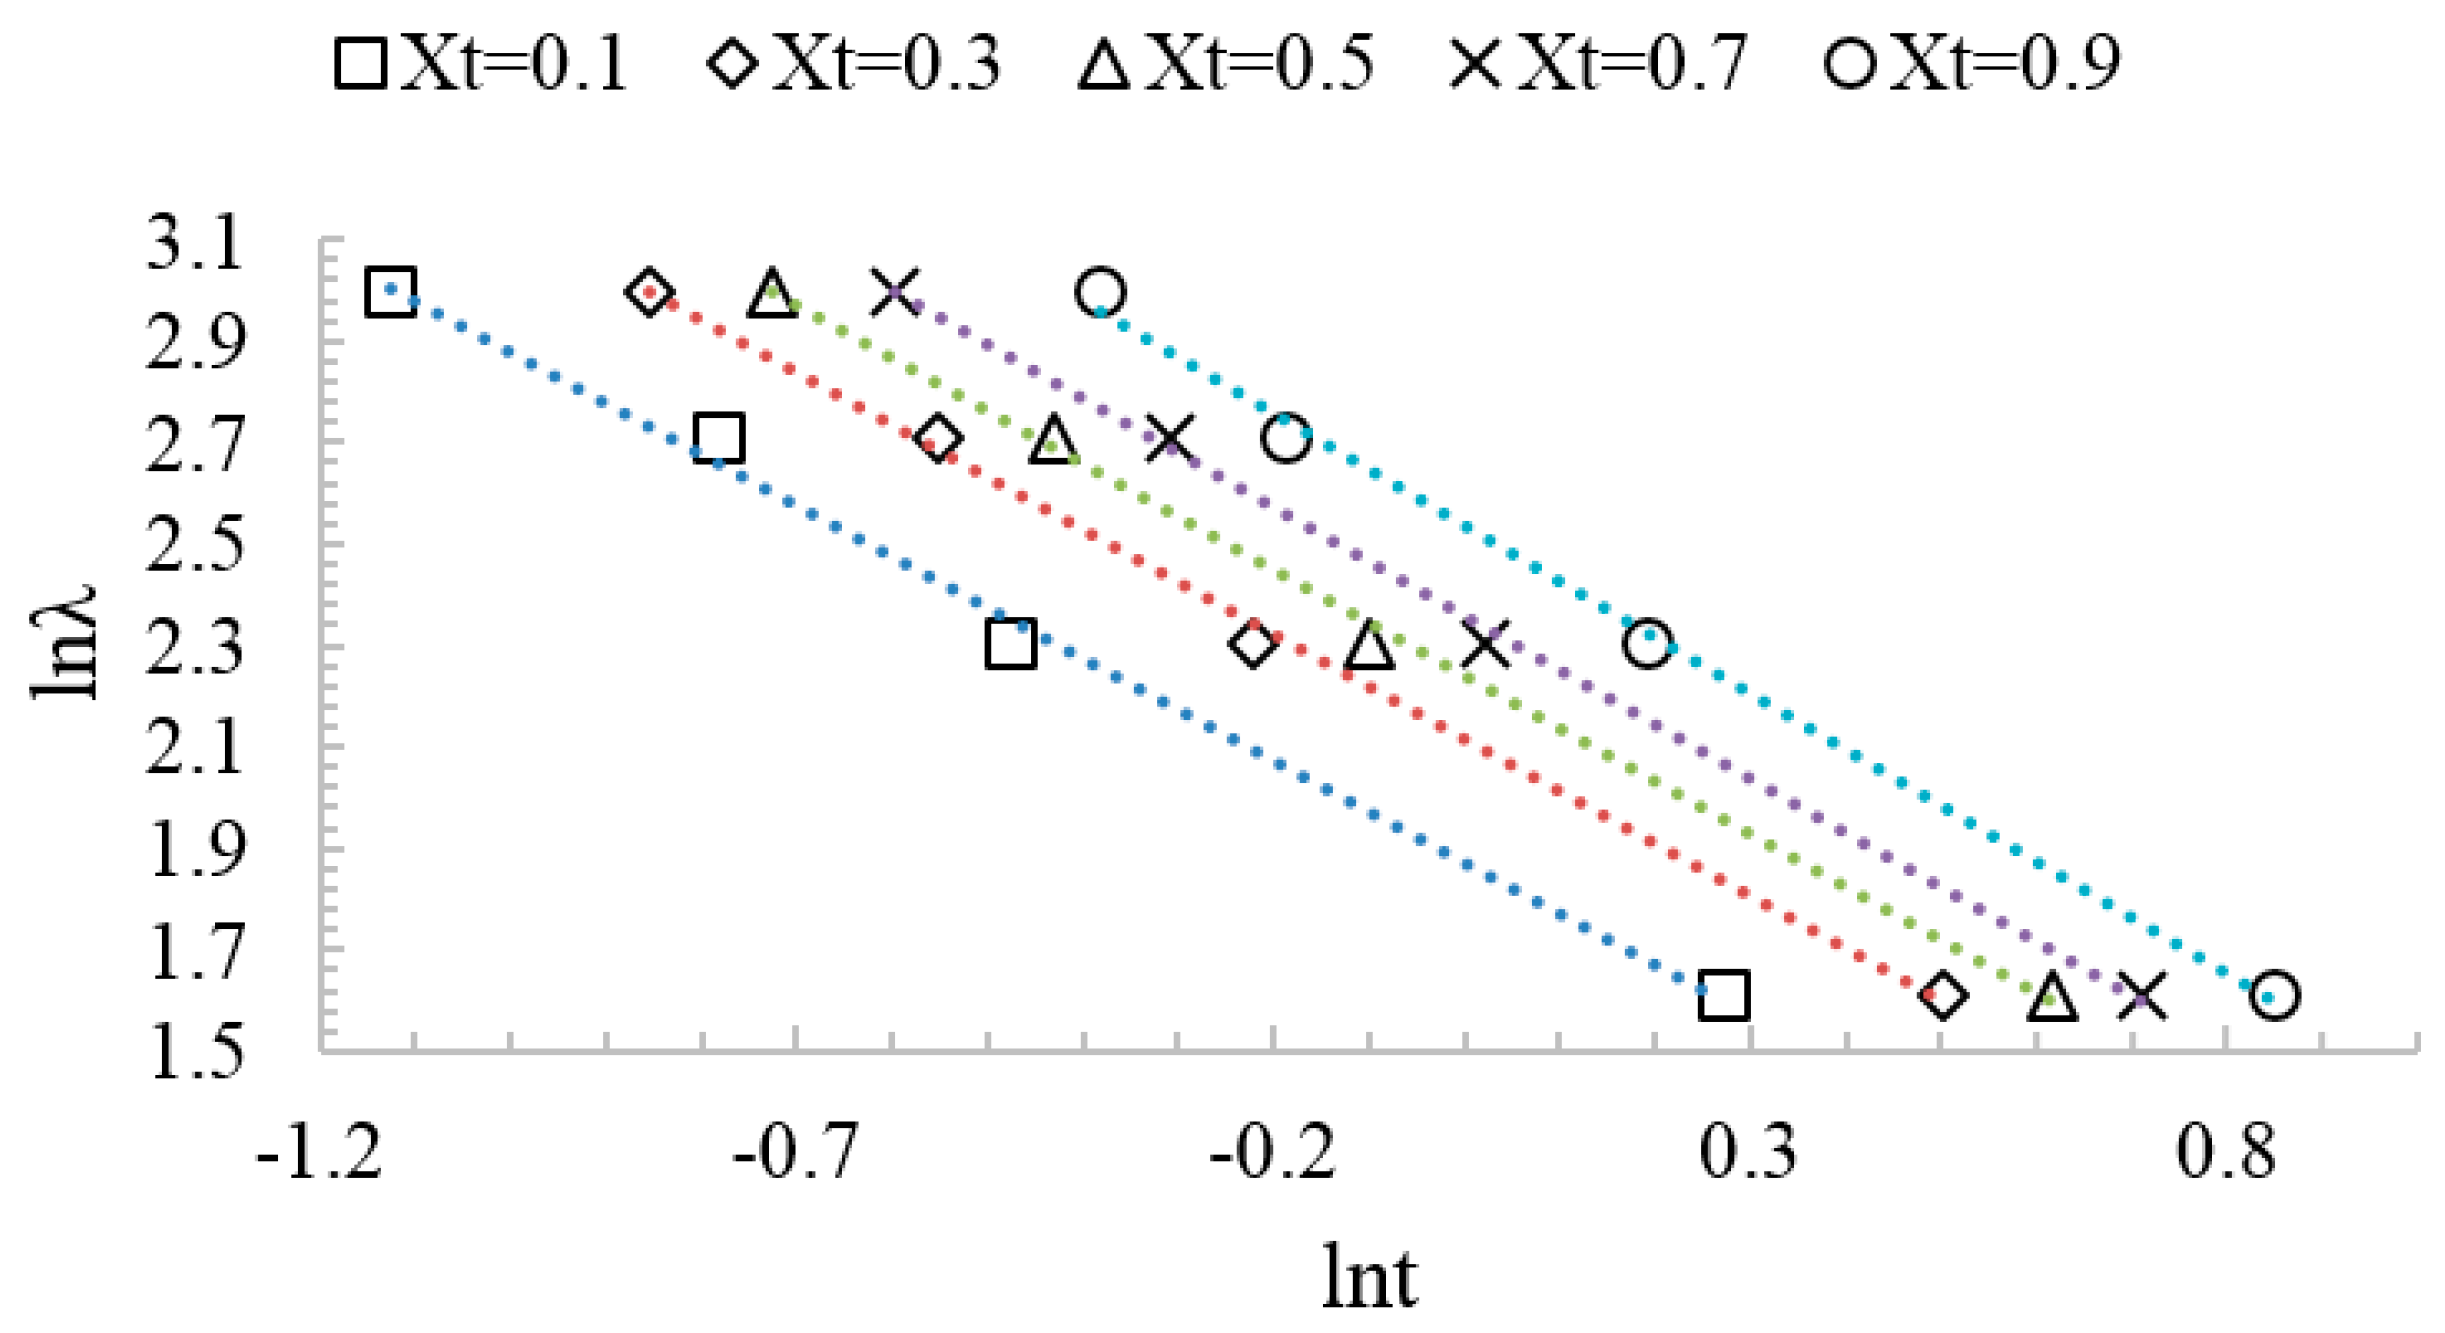
3.2.3. Liu Method
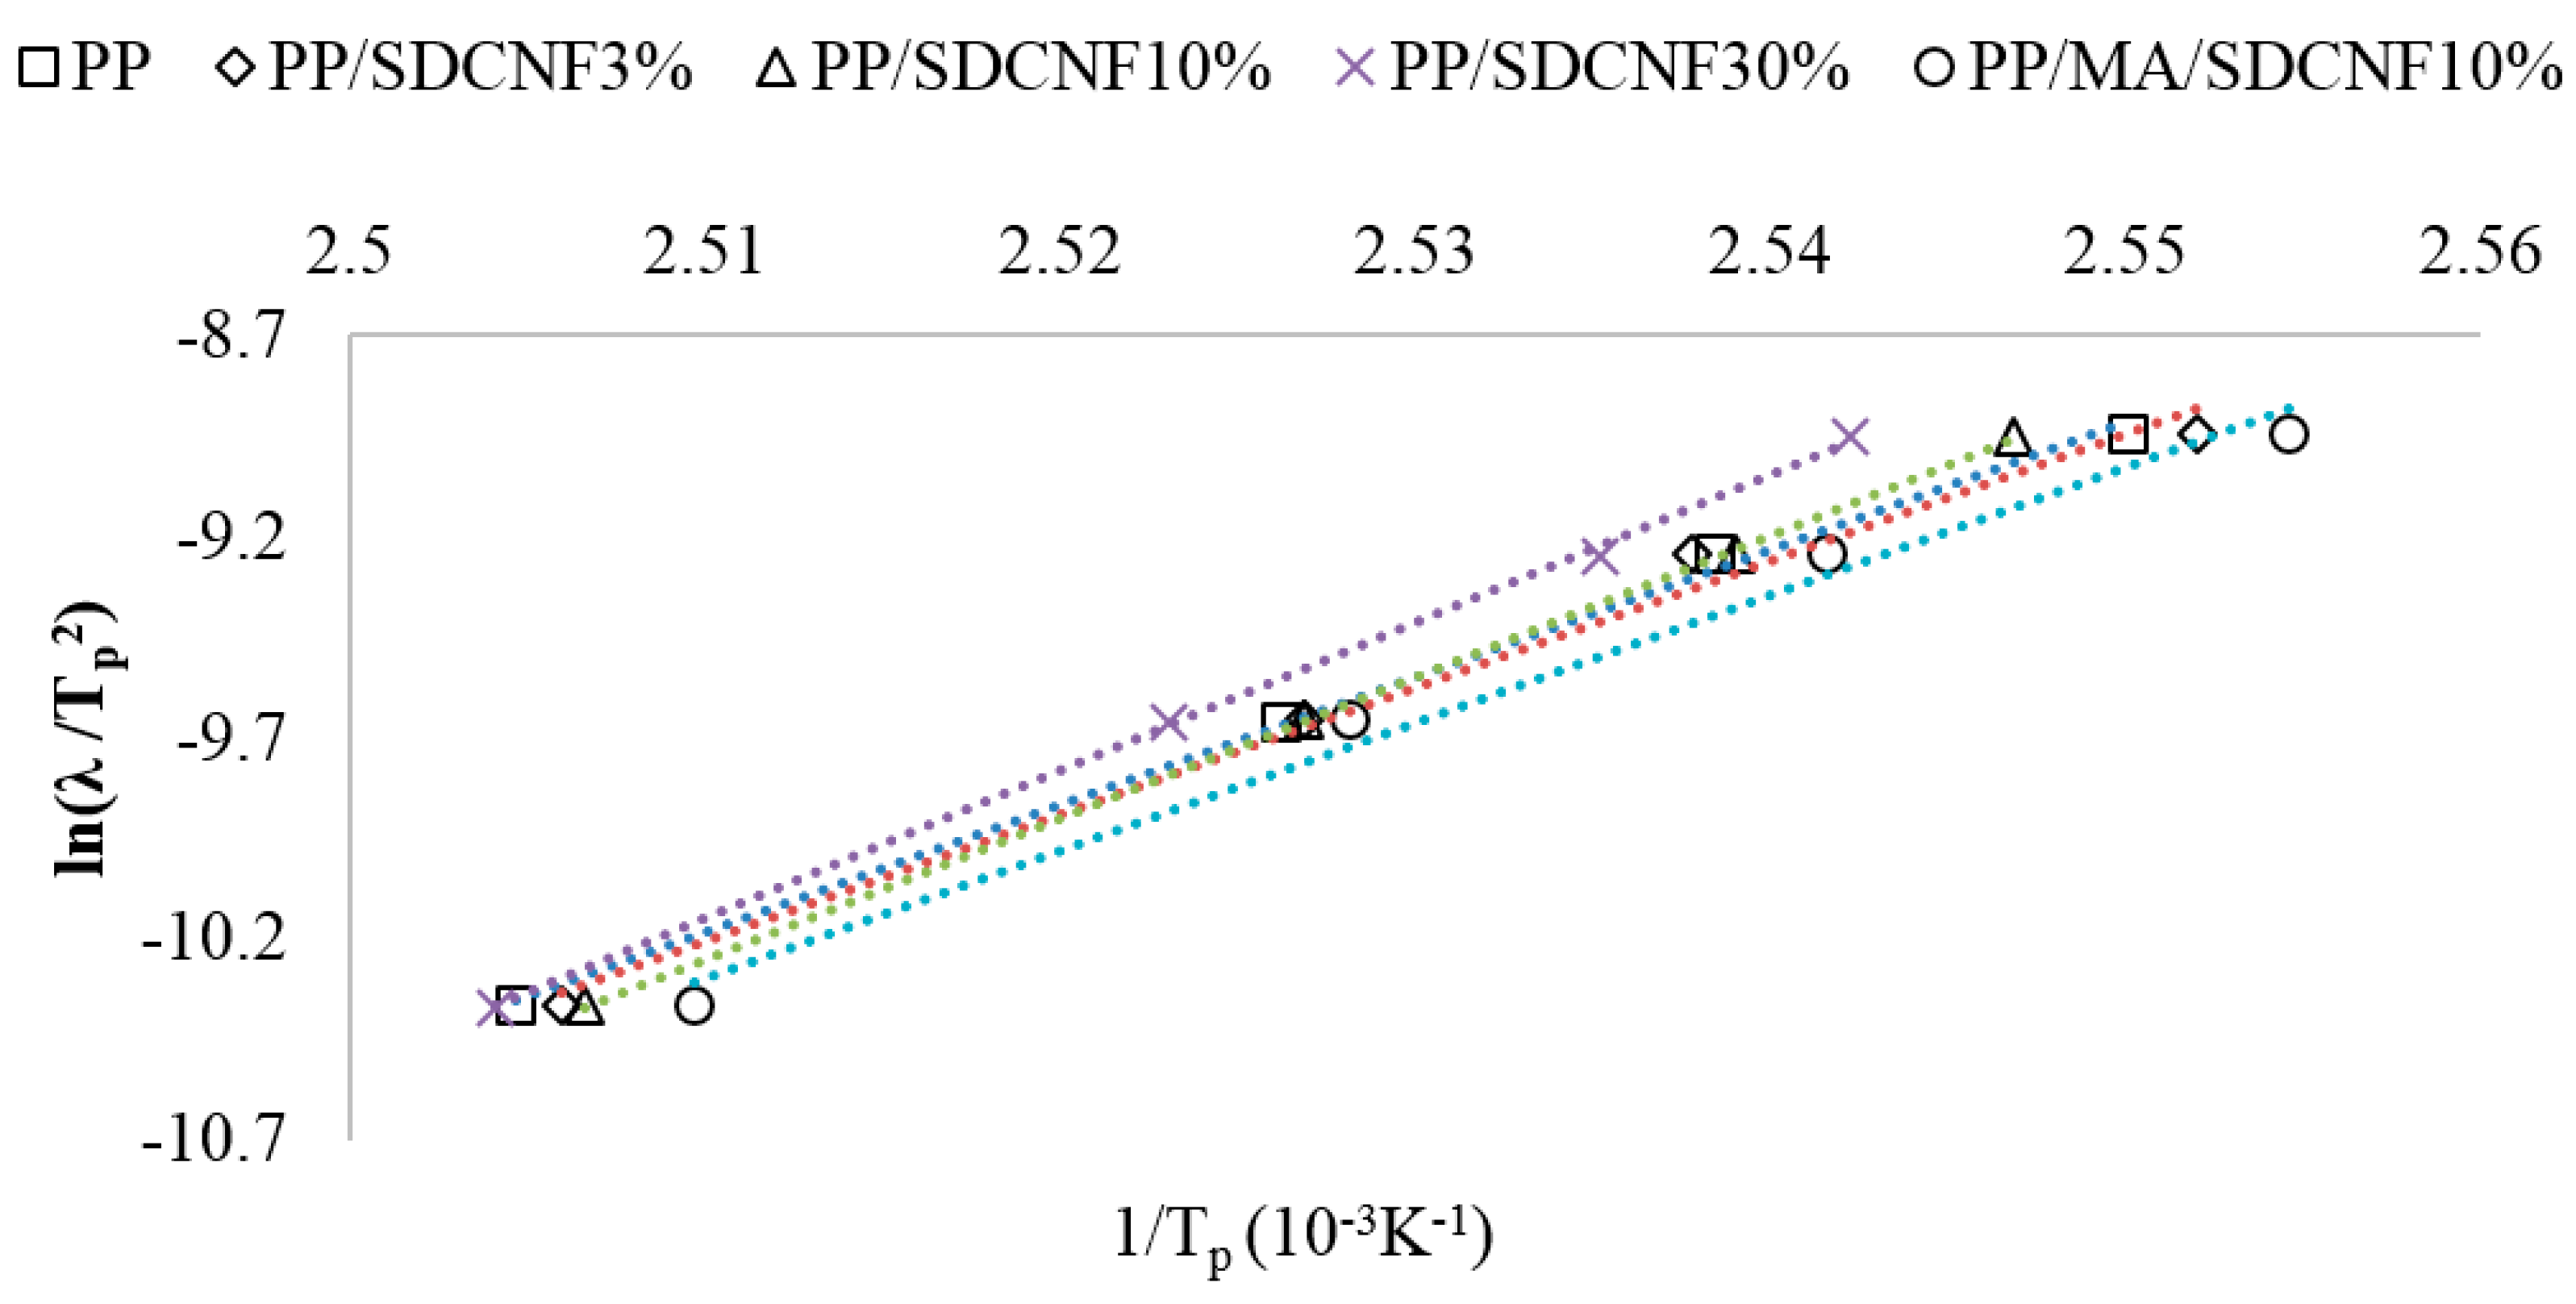
3.2.4. Effective Activation Energy
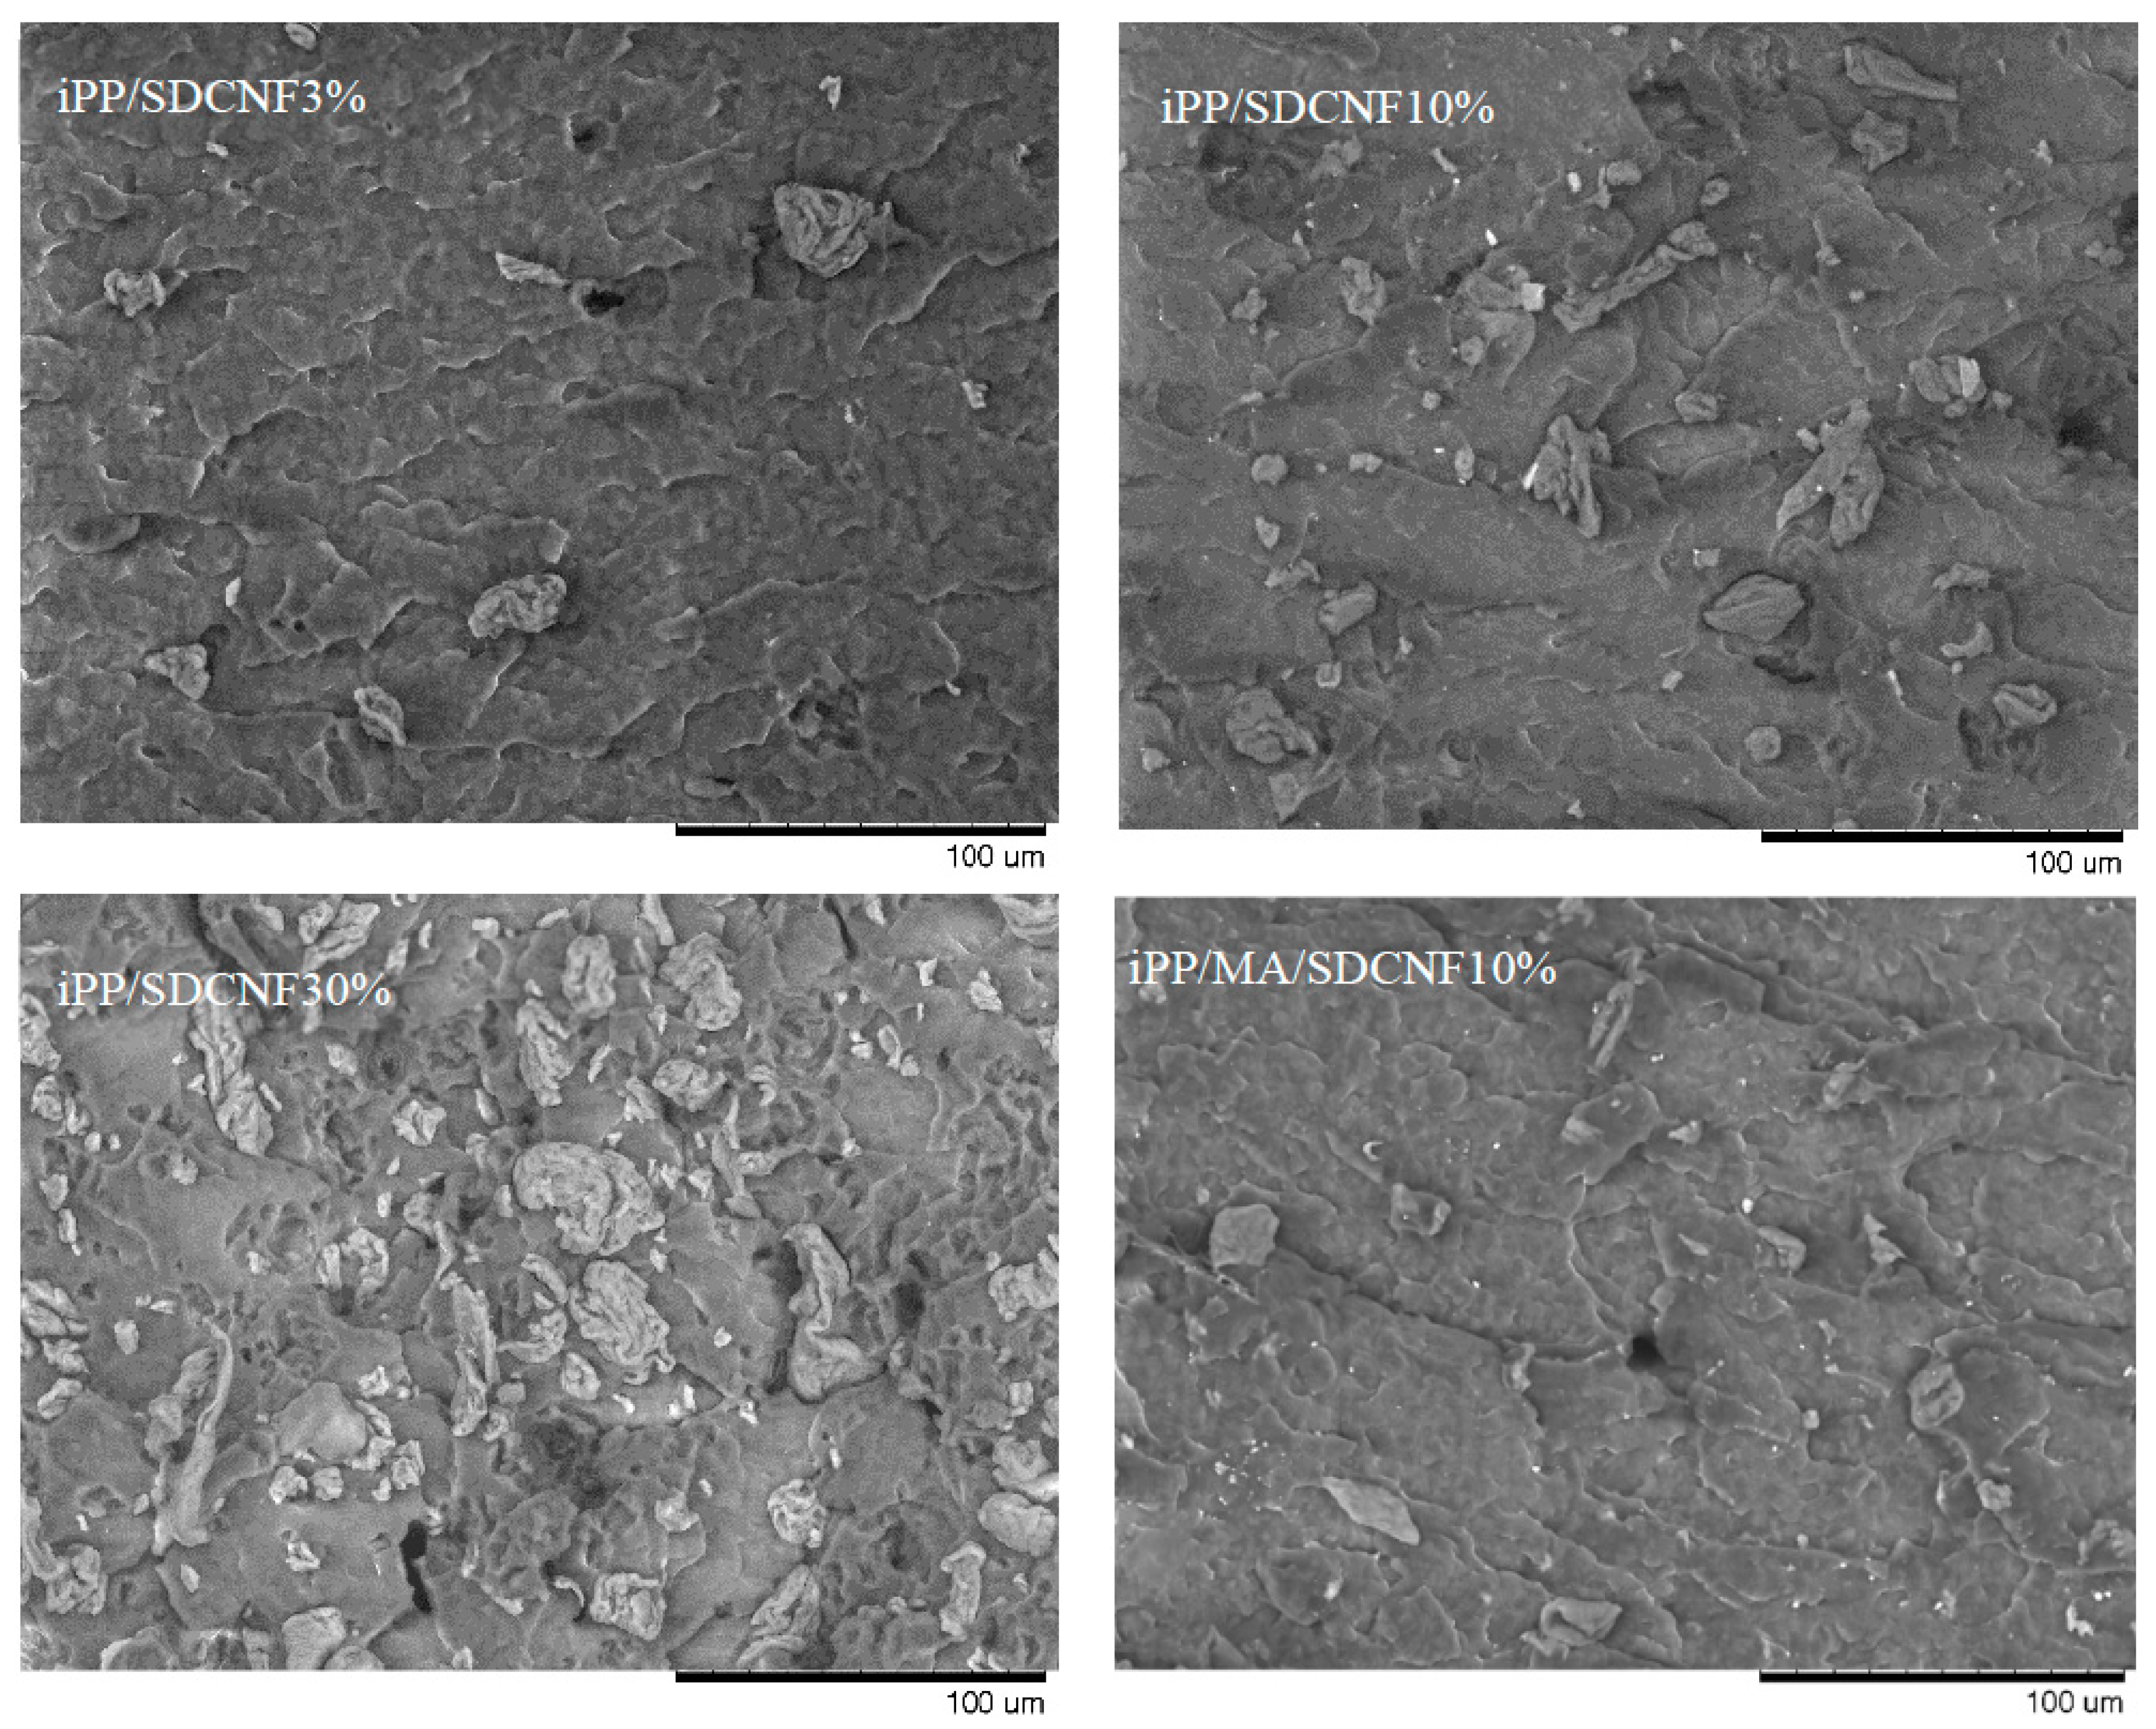
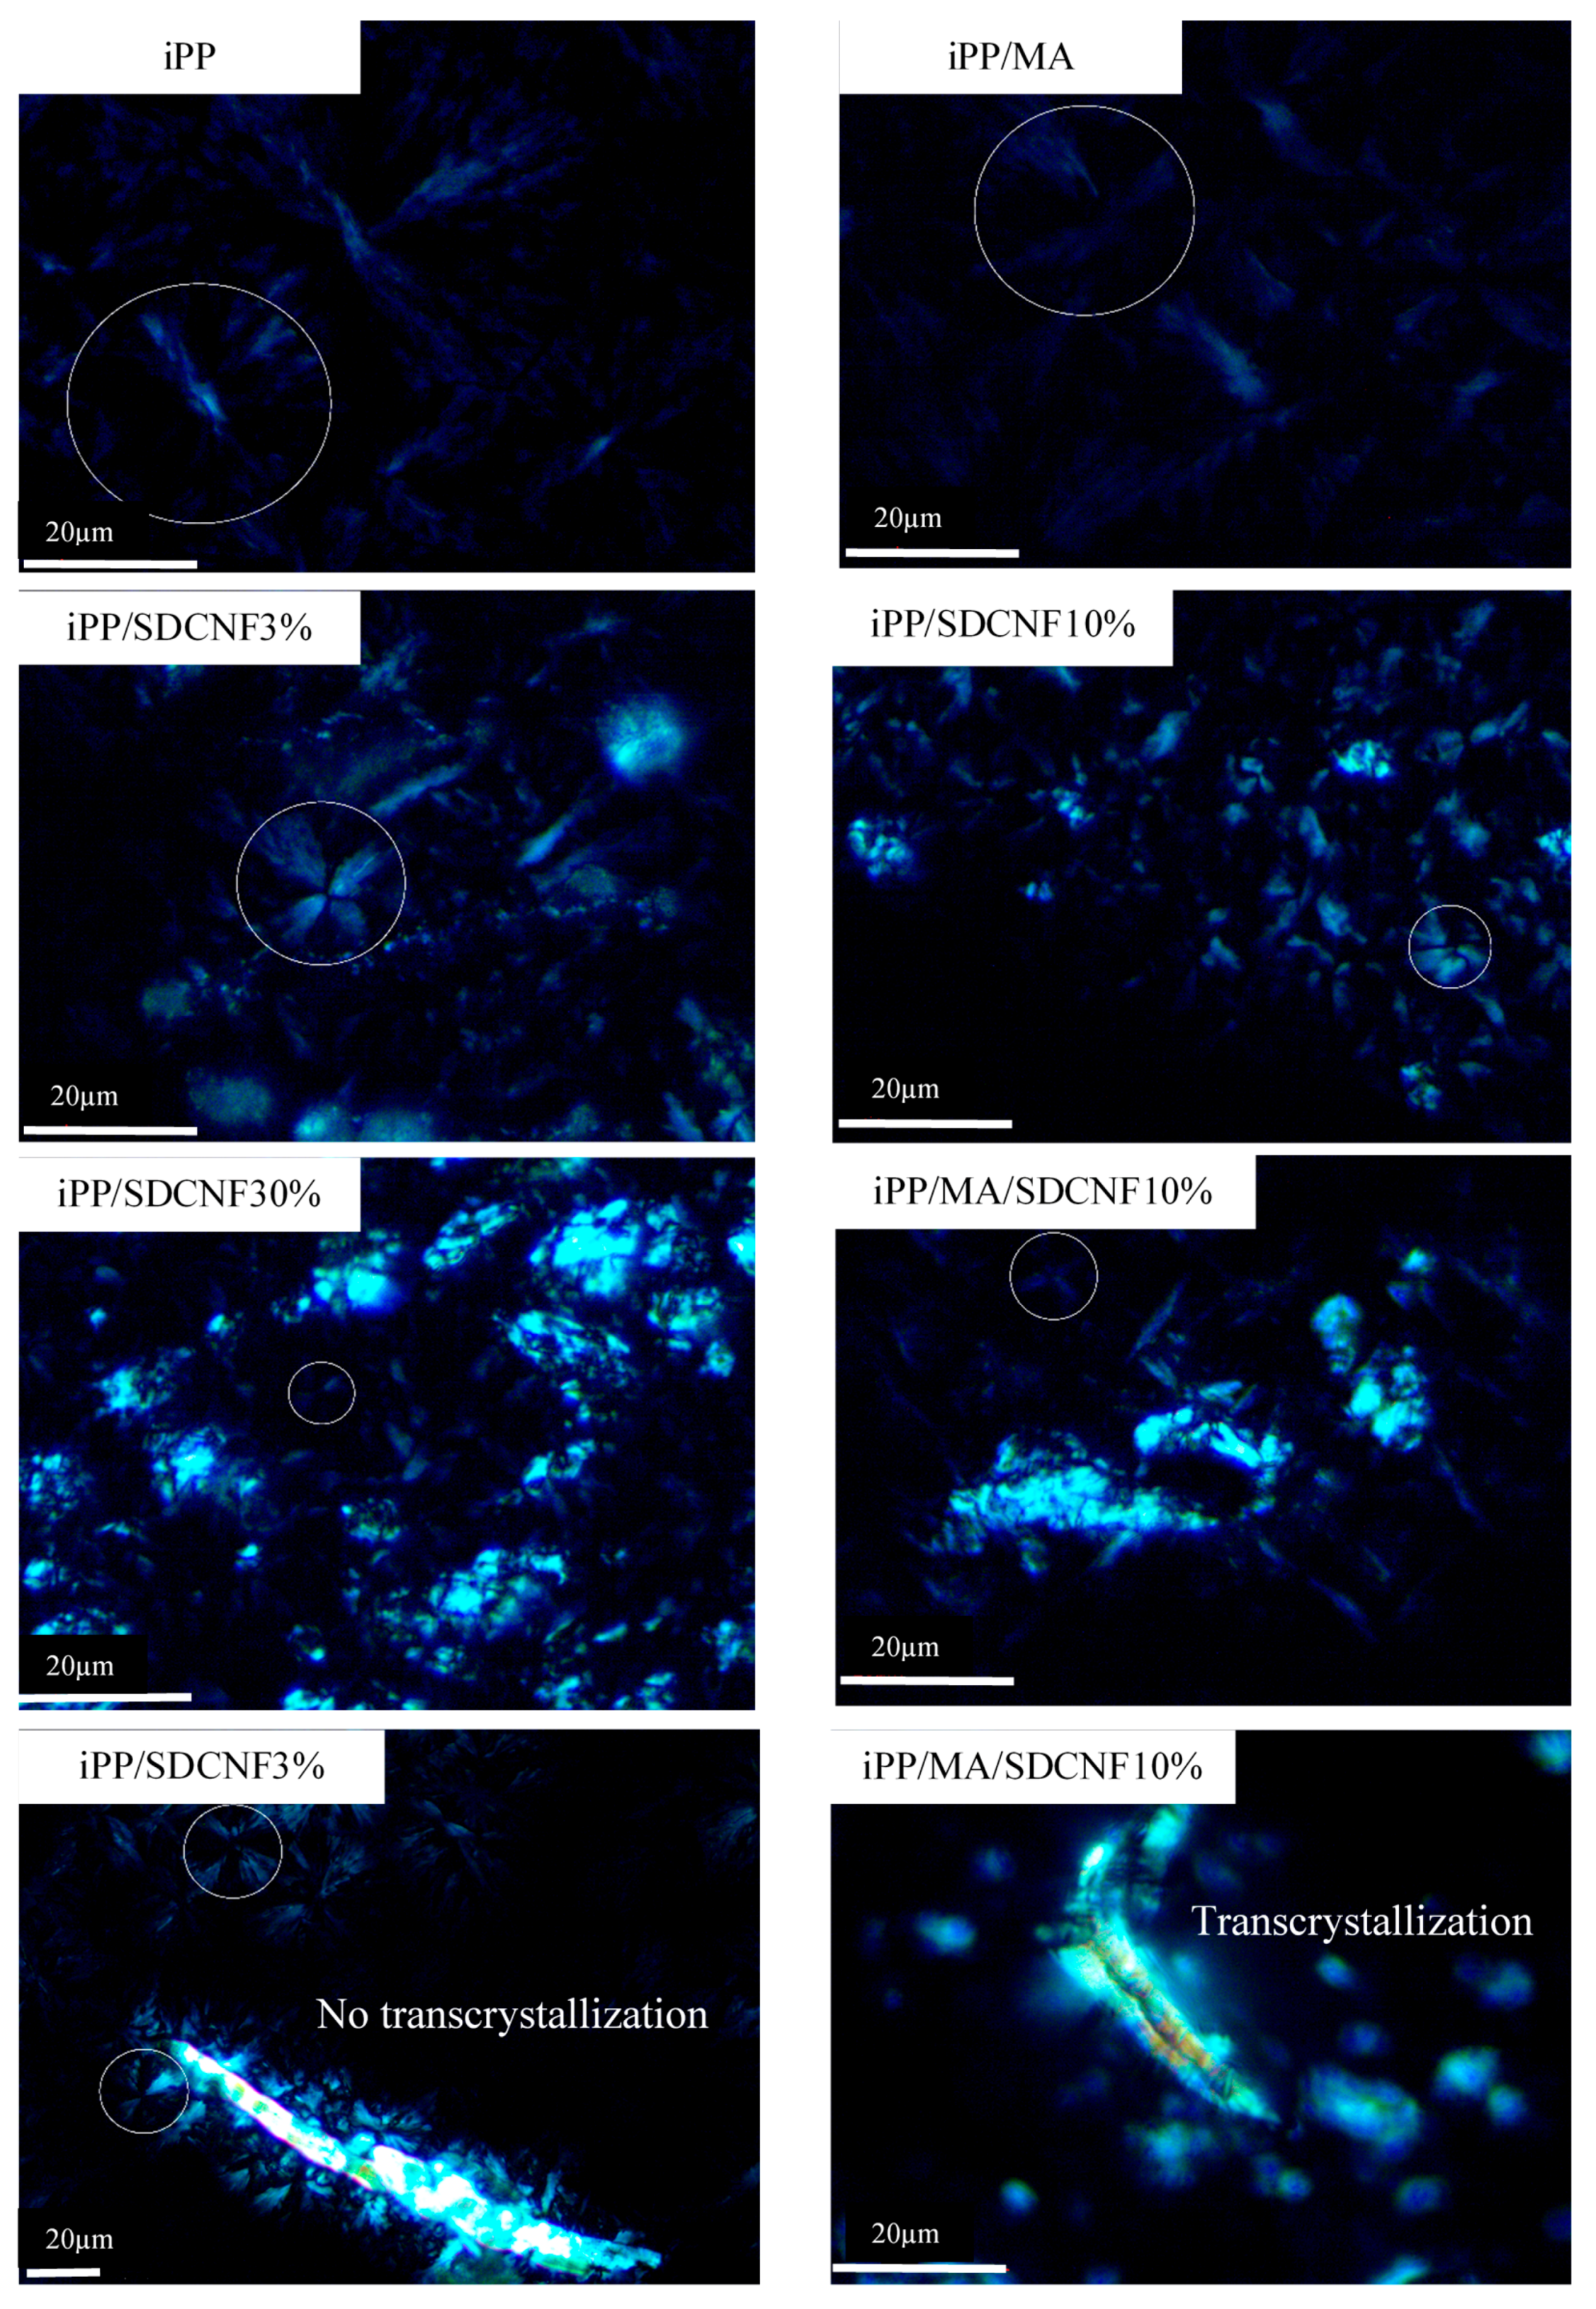
3.3. Microscopy Study
3.4. Thermal Expansion
4. Conclusions
Acknowledgments
Author Contributions
Conflicts of Interest
References
- Wang, L.; Sanders, J.E.; Gardner, D.G.; Han, Y. In-situ modification of cellulose nanofibrils by organosilanes during spray drying. Ind. Crops Prod. 2016, 93, 129–135. [Google Scholar] [CrossRef]
- Siqueira, G.; Bras, J.; Dufresne, A. Cellulose whiskers versus microfibrils: Influence of the nature of the nanoparticle and its surface functionalization on the thermal and mechanical properties of nanocomposites. Biomacromolecules 2008, 10, 425–432. [Google Scholar] [CrossRef] [PubMed]
- Peng, Y.; Gardner, D.J.; Han, Y. Drying cellulose nanofibrils: In search of a suitable method. Cellulose 2012, 19, 91–102. [Google Scholar] [CrossRef]
- Wang, L.; Gardner, D.J. Effect of fused layer modeling (FLM) processing parameters on impact strength of cellular polypropylene. Polymer 2017, 113, 74–80. [Google Scholar] [CrossRef]
- Seo, Y.; Kim, J.; Kim, K.U.; Kim, Y.C. Study of the crystallization behaviors of polypropylene and maleic anhydride grafted polypropylene. Polymer 2000, 41, 2639–2646. [Google Scholar] [CrossRef]
- Fujisawa, S.; Zhang, J.; Saito, T.; Iwata, T.; Isogai, A. Cellulose nanofibrils as templates for the design of poly(l-lactide)-nucleating surfaces. Polymer 2014, 55, 2937–2942. [Google Scholar] [CrossRef]
- Sun, Q.; Rizvi, G.M.; Bellehumeur, C.T.; Gu, P. Effect of processing conditions on the bonding quality of FDM polymer filaments. Rapid Prototyp. J. 2008, 14, 72–80. [Google Scholar] [CrossRef]
- Le Bozec, Y.; Kaang, S.; Hine, P.J.; Ward, I.M. The thermal-expansion behavior of hot-compacted polypropylene and polyethylene composites. Compos. Sci. Technol. 2000, 60, 333–344. [Google Scholar] [CrossRef]
- Ratajski, E.; Janeschitz-Kriegl, H. Flow-induced crystallization in polymer melts: On the correlation between nucleation and specific work. Polym. Bull. 2012, 68, 1723–1730. [Google Scholar] [CrossRef]
- Spina, R.; Spekowius, M.; Hopmann, C. Multiphysics simulation of thermoplastic polymer crystallization. Mater. Des. 2016, 95, 455–469. [Google Scholar] [CrossRef]
- Fornes, T.D.; Paul, D.R. Crystallization behavior of nylon 6 nanocomposites. Polymer 2003, 44, 3945–3961. [Google Scholar] [CrossRef]
- Li, L.; Li, C.Y.; Ni, C.; Rong, L.; Hsiao, B. Structure and crystallization behavior of Nylon 66/multi-walled carbon nanotube nanocomposites at low carbon nanotube contents. Polymer 2007, 48, 3452–3460. [Google Scholar] [CrossRef]
- Deshmukh, G.S.; Peshwe, D.R.; Pathak, S.U.; Ekhe, J.D. Nonisothermal crystallization kinetics and melting behavior of poly (butylene terephthalate) and calcium carbonate nanocomposites. Thermochim. Acta 2015, 606, 66–76. [Google Scholar] [CrossRef]
- Wang, L.; Roach, A.W.; Gardner, D.J.; Han, Y. Mechanisms contributing to mechanical property changes in composites of polypropylene reinforced with spray-dried cellulose nanofibrils. Cellulose 2018, 25, 439–448. [Google Scholar] [CrossRef]
- Wang, L.; Gardner, D.J.; Bousfield, D.W. Cellulose nanofibril-reinforced polypropylene composites for material extrusion: Rheological properties. Polym. Eng. Sci. 2017. [Google Scholar] [CrossRef]
- Grozdanov, A.; Buzarovska, A.; Bogoeva-Gaceva, G.; Avella, M.; Errico, M.E.; Gentile, G. Nonisothermal crystallization kinetics of kenaf fiber/polypropylene composites. Polym. Eng. Sci. 2007, 47, 745–749. [Google Scholar] [CrossRef]
- Zhu, X.L.; Wang, C.S.; Wang, B.; Wang, H.P. Non-isothermal crystallization kinetics and nucleation activity of filler in polypropylene/microcrystalline cellulose composites. Iran. Polym. J. 2008, 17, 297–309. [Google Scholar]
- Phuong, N.T.; Gilbert, V. Non-isothermal crystallization kinetics of short bamboo fiber-reinforced recycled polypropylene composites. J. Reinf. Plast. Compos. 2010, 29, 2576–2591. [Google Scholar] [CrossRef]
- Xu, N.; Xue, F.; Ding, E. Nonisothermal crystallization kinetics in isotactic polypropylene/microcrystalline cellulose (II) composites. Polym. Compos. 2016. [Google Scholar] [CrossRef]
- Quillin, D.T.; Yin, M.; Koutsky, J.A.; Caulfield, D.F. Crystallinity in the polypropylene/cellulose system. II. Crystallization kinetics. J. Appl. Polym. Sci. 1994, 52, 605–615. [Google Scholar] [CrossRef]
- Janicek, M.; Polaskova, M.; Holubar, R.; Cermak, R. Surface-esterified cellulose fiber in a polypropylene matrix: Impact of esterification on crystallization kinetics and dispersion. Cellulose 2014, 21, 4039–4048. [Google Scholar] [CrossRef]
- Ito, H.; Hattori, H.; Okamoto, T.; Takatani, M. Thermal expansion of high filler content cellulose-plastic composites. J. Wood Chem. Technol. 2010, 30, 360–372. [Google Scholar] [CrossRef]
- Huang, R.; Zhang, Y.; Xu, X.; Zhou, D.; Wu, Q. Effect of hybrid mineral and bamboo fillers on thermal expansion behavior of bamboo fiber and recycled polypropylene–polyethylene composites. BioResources 2012, 7, 4563–4574. [Google Scholar] [CrossRef]
- Wang, P.; Liu, J.; Yu, W.; Zhou, C. Isothermal crystallization kinetics of highly filled wood plastic composites: Effect of wood particles content and compatibilizer. J. Macromol. Sci. B 2011, 50, 2271–2289. [Google Scholar] [CrossRef]
- Herrero, C.R.; Acosta, J.L. Effect of poly (epichlorhydrin) on the crystallization and compatibility behavior of poly (ethylene oxide)/polyphosphazene blends. Polym. J. 1994, 26, 786–796. [Google Scholar] [CrossRef]
- Ou, R.; Guo, C.; Xie, Y.; Wang, Q. Non-isothermal crystallization kinetics of Kevlar fiber-reinforced wood flour/HDPE composites. BioResources 2011, 6, 4547–4565. [Google Scholar]
- Hiemenz, P.C.; Lodge, T.P. Linear Viscosity. In Polymer Chemistry, 2nd ed.; CRC Press: Boca Raton, FL, USA, 2007; pp. 419–464. [Google Scholar]
- Gopakumar, T.G.; Lee, J.A.; Kontopoulou, M.; Parent, J.S. Influence of clay exfoliation on the physical properties of montmorillonite/polyethylene composites. Polymer 2002, 43, 5483–5491. [Google Scholar] [CrossRef]
- Khoshkava, V.; Ghasemi, H.; Kamal, M.R. Effect of cellulose nanocrystals (CNC) on isothermal crystallization kinetics of polypropylene. Thermochim. Acta 2015, 608, 30–39. [Google Scholar] [CrossRef]
- Jeziorny, A. Parameters characterizing the kinetics of the non-isothermal crystallization of poly (ethylene terephthalate) determined by DSC. Polymer 1978, 19, 1142–1144. [Google Scholar] [CrossRef]
- Ozawa, T. Kinetics of non-isothermal crystallization. Polymer 1971, 12, 150–158. [Google Scholar] [CrossRef]
- Liu, T.; Mo, Z.; Wang, S.; Zhang, H. Nonisothermal melt and cold crystallization kinetics of poly (aryl ether ether ketone ketone). Polym. Eng. Sci. 1997, 37, 568–575. [Google Scholar] [CrossRef]
- Kissinger, H.E. Variation of peak temperature with heating rate in differential thermal analysis. J. Res. Natl. Bur. Stand. 1956, 57, 217–221. [Google Scholar] [CrossRef]
- Yin, S.; Rials, T.G.; Wolcott, M.P. Crystallization behavior of polypropylene and its effect on woodfiber composite properties. In Proceedings of the Fifth International Conference on Wood Fiber-Plastic Composites, Madison, WI, USA, 26–27 May 1999; pp. 139–146. [Google Scholar]
- Yang, H.S.; Wolcott, M.P.; Kim, H.S.; Kim, H.J. Thermal properties of lignocellulosic filler-thermoplastic polymer bio-composites. J. Therm. Anal. Calorim. 2005, 82, 157–160. [Google Scholar] [CrossRef]
- Kalaitzidou, K.; Fukushima, H.; Drzal, L.T. Multifunctional polypropylene composites produced by incorporation of exfoliated graphite nanoplatelets. Carbon 2007, 45, 1446–1452. [Google Scholar] [CrossRef]


| Materials | Mn a (g/mol) | Tc b (°C) | t1/2 c (min) |
|---|---|---|---|
| iPP | 4.18 × 10⁴ | 120 | 2.93 |
| PLLA | 4.5 × 10⁴ | 120 | 21.5 |
| Samples | Labels | iPP (wt %) | SDCNF (wt %) | MAPP (wt %) |
|---|---|---|---|---|
| iPP | iPP | 100 | 0 | 0 |
| iPP + MAPP | iPP/MA | 98 | 0 | 2 |
| iPP + 3% SDCNF | iPP/SDCNF3% | 97 | 3 | 0 |
| iPP + MAPP + 3% SDCNF | iPP/MA/SDCNF3% | 95 | 3 | 2 |
| iPP + 10% SDCNF | iPP/SDCNF10% | 90 | 10 | 0 |
| iPP + MAPP + 10% SDCNF | iPP/MA/SDCNF10% | 88 | 10 | 2 |
| iPP + 30% SDCNF | iPP/SDCNF30% | 70 | 30 | 0 |
| iPP + MAPP + 30% SDCNF | iPP/MA/SDCNF30% | 68 | 30 | 2 |
| Samples | λ a (K/min) | To b (°C) | Tp c (°C) | Xc d (%) | t1/2 e (min) |
|---|---|---|---|---|---|
| iPP | 5 | 134.8 | 126.1 | 49.0 | 1.75 |
| 10 | 131.2 | 122.7 | 49.6 | 0.88 | |
| 15 | 129.2 | 120.8 | 48.4 | 0.59 | |
| 20 | 127.2 | 119.0 | 46.1 | 0.46 | |
| iPP/SDCNF3% | 5 | 134.0 | 125.9 | 50.0 | 1.59 |
| 10 | 131.8 | 122.6 | 48.4 | 0.85 | |
| 15 | 129.7 | 120.9 | 45.9 | 0.60 | |
| 20 | 127.5 | 118.7 | 47.8 | 0.47 | |
| iPP/SDCNF10% | 5 | 135.2 | 125.8 | 51.6 | 1.85 |
| 10 | 131.8 | 122.6 | 48.2 | 0.95 | |
| 15 | 130.4 | 120.7 | 49.3 | 0.66 | |
| 20 | 128.9 | 119.5 | 49.1 | 0.49 | |
| iPP/SDCNF30% | 5 | 134.3 | 126.2 | 56.4 | 1.56 |
| 10 | 132.3 | 123.2 | 54 | 0.88 | |
| 15 | 130.3 | 121.3 | 57.6 | 0.58 | |
| 20 | 128.7 | 120.2 | 47.7 | 0.42 | |
| iPP/MA | 5 | 133.4 | 125.8 | 53.4 | 1.51 |
| 10 | 130.9 | 122.8 | 51.9 | 0.81 | |
| 15 | 129.4 | 121.0 | 49.3 | 0.56 | |
| 20 | 127.2 | 119.3 | 47.1 | 0.41 | |
| iPP/MA/SDCNF10% | 5 | 133.0 | 125.3 | 52.1 | 1.51 |
| 10 | 130.8 | 122.4 | 50.1 | 0.83 | |
| 15 | 128.6 | 120.3 | 49.2 | 0.55 | |
| 20 | 127.1 | 118.3 | 49.3 | 0.46 |
| Samples | λ a | n | KJ | R2 |
|---|---|---|---|---|
| iPP | 5 | 5.33 | 0.49 | 0.991 |
| 10 | 4.89 | 0.99 | 0.998 | |
| 15 | 4.60 | 1.11 | 0.999 | |
| 20 | 4.57 | 1.13 | 0.997 | |
| iPP/SDCNF3% | 5 | 4.33 | 0.58 | 0.983 |
| 10 | 5.07 | 1.02 | 0.999 | |
| 15 | 4.30 | 1.10 | 0.998 | |
| 20 | 3.66 | 1.10 | 0.995 | |
| iPP/SDCNF10% | 5 | 5.19 | 0.48 | 0.997 |
| 10 | 3.98 | 0.98 | 0.999 | |
| 15 | 4.23 | 1.08 | 0.999 | |
| 20 | 3.65 | 1.10 | 0.997 | |
| iPP/SDCNF30% | 5 | 4.26 | 0.62 | 0.995 |
| 10 | 4.41 | 1.00 | 0.999 | |
| 15 | 3.75 | 1.09 | 0.999 | |
| 20 | 3.16 | 1.11 | 0.997 | |
| iPP/MA/SDCNF10% | 5 | 4.23 | 0.61 | 0.984 |
| 10 | 4.69 | 1.03 | 0.999 | |
| 15 | 3.98 | 1.11 | 0.998 | |
| 20 | 3.90 | 1.12 | 0.999 |
| Sample | Xt a (%) | α | F(T) | R2 |
|---|---|---|---|---|
| iPP | 10 | 0.95 | 6.50 | 0.999 |
| 30 | 1.00 | 7.86 | 0.999 | |
| 50 | 1.03 | 8.85 | 0.999 | |
| 70 | 1.07 | 9.95 | 0.999 | |
| 90 | 1.16 | 12.38 | 0.998 | |
| iPP/SDCNF3% | 10 | 1.10 | 5.80 | 0.999 |
| 30 | 1.11 | 7.47 | 0.999 | |
| 50 | 1.14 | 8.46 | 1.000 | |
| 70 | 1.20 | 9.65 | 0.999 | |
| 90 | 1.29 | 11.97 | 0.994 | |
| iPP/SDCNF10% | 10 | 1.01 | 6.51 | 0.996 |
| 30 | 1.03 | 8.28 | 0.998 | |
| 50 | 1.04 | 9.38 | 0.998 | |
| 70 | 1.07 | 10.57 | 0.999 | |
| 90 | 1.11 | 12.62 | 0.997 | |
| iPP/SDCNF30% | 10 | 1.00 | 5.52 | 0.988 |
| 30 | 1.05 | 7.22 | 0.995 | |
| 50 | 1.07 | 8.33 | 0.995 | |
| 70 | 1.10 | 9.45 | 0.997 | |
| 90 | 1.14 | 11.53 | 0.997 | |
| iPP/MA/SDCNF10% | 10 | 1.08 | 5.45 | 0.996 |
| 30 | 1.12 | 7.00 | 0.999 | |
| 50 | 1.15 | 8.05 | 0.996 | |
| 70 | 1.18 | 9.13 | 0.993 | |
| 90 | 1.27 | 11.35 | 0.994 |
| Samples | iPP | iPPSDCNF3% | iPPSDCNF10% | iPPSDCNF30% | iPP/MA/SDCNF10% |
|---|---|---|---|---|---|
| ΔE (kJ/mol) | 264.1 | 262.5 | 291.6 | 305.5 | 265.2 |
| R2 | 0.997 | 0.989 | 0.999 | 0.999 | 0.988 |
| Samples | α a (10−6/°C) | Significance |
|---|---|---|
| iPP | 80.1 (3.1) b | A c |
| iPP/SDCNF10% | 70.7 (2.4) | B |
© 2018 by the authors. Licensee MDPI, Basel, Switzerland. This article is an open access article distributed under the terms and conditions of the Creative Commons Attribution (CC BY) license (http://creativecommons.org/licenses/by/4.0/).
Share and Cite
Wang, L.; Gramlich, W.M.; Gardner, D.J.; Han, Y.; Tajvidi, M. Spray-Dried Cellulose Nanofibril-Reinforced Polypropylene Composites for Extrusion-Based Additive Manufacturing: Nonisothermal Crystallization Kinetics and Thermal Expansion. J. Compos. Sci. 2018, 2, 7. https://doi.org/10.3390/jcs2010007
Wang L, Gramlich WM, Gardner DJ, Han Y, Tajvidi M. Spray-Dried Cellulose Nanofibril-Reinforced Polypropylene Composites for Extrusion-Based Additive Manufacturing: Nonisothermal Crystallization Kinetics and Thermal Expansion. Journal of Composites Science. 2018; 2(1):7. https://doi.org/10.3390/jcs2010007
Chicago/Turabian StyleWang, Lu, William M. Gramlich, Douglas J. Gardner, Yousoo Han, and Mehdi Tajvidi. 2018. "Spray-Dried Cellulose Nanofibril-Reinforced Polypropylene Composites for Extrusion-Based Additive Manufacturing: Nonisothermal Crystallization Kinetics and Thermal Expansion" Journal of Composites Science 2, no. 1: 7. https://doi.org/10.3390/jcs2010007