Insights into the Performance of Magnetoelectric Ceramic Layered Composites


1
Departamento de Electrónica, Universidad de Alcalá, 28871 Alcalá de Henares, Spain
2
Instituto de Ciencia de Materiales de Madrid, CSIC, Cantoblanco, 28049 Madrid, Spain
*
Author to whom correspondence should be addressed.
J. Compos. Sci. 2017, 1(2), 14; https://doi.org/10.3390/jcs1020014
Submission received: 2 October 2017
/
Revised: 26 October 2017
/
Accepted: 30 October 2017
/
Published: 3 November 2017
Abstract
:Finite element analysis is used to simulate the magnetoelectric response of magnetostrictive-piezoelectric NiFe2O4-Bi0.36Pb0.64Sc0.36Ti0.64O3 ceramic two-layer, three-layer, and multilayer structures considering finite geometry and introducing the conductivity of the magnetic component. Results are compared with those obtained with existing approximate analytical solutions, and with the experimental data available for high-quality layered composites. Limitations of the widely used analytical solution for a bilayer are revealed, and the reported good agreement with experimental coefficients is shown to be coincidental. Magnetoelectric coefficients obtained by simulation using realistic material parameters are systematically above the experimental values for three-layer and multilayer composites. Possible mechanisms for the reduction in response are analyzed. Strain relaxation across the piezoelectric layer, strongly associated with its mechanical performance, is shown to be the most feasible cause.
1. Introduction
Magnetoelectric composites are key enabling materials for a range of novel related technologies that exploit their ability of developing a linear electrical polarization in response to a magnetic field (direct magnetoelectric effect), and of a magnetization in response of an electric one (converse effect). Examples of these magnetoelectric technologies are electrically-tunable magnetic devices for microwave communications [1], high-sensitivity magnetic field sensors with room temperature operation [2], and wireless, remotely- or self-rechargeable powering technologies with magnetic fields, like the parasitic ones existing around high-voltage power lines [3,4].
These composite materials consist of two elastically-coupled magnetostrictive and piezoelectric components. When a magnetic (electric) field H (E) is applied, the magnetostrictive (piezoelectric) phase deforms. Strain (S) is transmitted to the piezoelectric (magnetostrictive) phase that develops an electric polarization (magnetization) P (M). Magnetoelectricity is, thus, obtained as a product property of the two piezoresponses. Formally:
where αd and αc are the effective direct and converse magnetoelectric coefficients, respectively.
When characterizing the magnetoelectric response of a composite, one usually measures the field magnetoelectric coefficient αE, defined as:
As shown, αE is just the direct coefficient αd times the reciprocal permittivity εT.
Extensive research is being carried out on these materials, and different piezoresponsive phases and types of connectivity are under consideration. Ferroic materials are the preferred option, as ferromagnets and ferroelectrics can show very high magnetostriction and piezoelectricity, respectively. Metal alloys and oxides have been tested for magnetic components, while oxides and polymers have been the choice for dielectrics. All 0-3, 1-3, and 2-2 connectivity assemblages are being tried for different applications, and good quality particulate, fiber-type, and laminate composites have been reported. In all cases, adequate mechanical coupling between phases is acknowledged to be key to obtaining high magnetoelectric response, for it determines the strain transmission [5,6,7].
A major issue when composites are designed, processed, and characterized is assessing how good they are. This does not mean obtaining magnetoelectric coefficients as high as possible, although this is obviously searched for, and very high functional responses have been demonstrated [8,9], but coefficients as close as possible to those expected from the material properties of the two phases and the composite configuration, assuming ideal mechanical coupling between the phases (that is, perfect strain transmission across the interface). This requires, in turn, to have analytical expressions for the effective magnetoelectric coefficient of the composite as a function of material coefficients for each specific configuration or, alternatively, to carry out simulations by finite element analysis (FEA).
Approximate analytical expressions were firstly derived in 1994 for the effective magnetoelectric coefficient αzz of transversally-isotropic, fiber-type composites [10]. The same year, exact analytical expressions were reported for the effective magnetoelectric coefficient αzz of laminate composites with axial symmetry distinguishing the cases of mechanically free and clamped boundaries [11]. Analytical expressions for the corresponding effective coefficient αρz were later obtained, and compared with experimental values of α31 for a number of ceramic systems [12]. A phenomenological interface coupling parameter was introduced in the formalism to account for the possible partial disruption of strain transmission across the interface. This parameter has been widely used as a measurement of the quality of the mechanical coupling between the two phases. Indeed, interface quality has been assessed in several cases through the comparison between the experimental and the expected magnetoelectric coefficients, calculated with the analytical expressions using different interface coupling parameter values [12,13].
Although very good agreement has been found between experimental and calculated values for ceramic laminate composites of specific systems like NiFe2O4-Pb(Zr,Ti)O3 [14,15], based on which near-ideal mechanical coupling was concluded, the validity of these expressions is restricted to the specific configuration assumed and the different hypothesis made in their derivation. For instance, solutions for the α31 coefficient of laminate composites in [12] are strictly valid for two-layer structures with in-plane dimensions much larger than the thickness, and negligible resistivity of the magnetostrictive component. Addressing the role of geometry, i.e., the shape and dimensions, requires the use of numerical methods like finite element analysis [16,17]. We report here a FEA simulation of the magnetoelectric response of three-layer and multilayer composite discs with finite diameter to thickness ratio, also considering the actual conductivity of the magnetic component. The NiFe2O4-Bi0.36Pb0.64Sc0.36Ti0.64O3 system was chosen as a case study because experimental magnetoelectric coefficients are readily available for ceramic co-fired high-quality laminate composites [18].
2. Materials and Methods
Comsol Multiphysics (version 4.2a, Comsol Inc., Burlington, MA, USA) was used to simulate the laminate composites. This is a powerful computer assisted design (CAD) tool for finite element analysis, which has implemented piezoelectric and magnetic moduli, and it is capable of providing all physical quantities of a system of a given geometry under fixed boundary conditions. Disc-shaped ceramic magnetostrictive-piezoelectric layered structures were simulated. Thickness poling, that is, along the stacking direction referred to as the 3 direction, was assumed for the piezoelectric ceramic layer, whose material properties have transversal isotropy around this axis. Magnetic fields were applied perpendicularly to the poling along a specific direction within the disc plane, which is referred to as 1. Simultaneous static (to magnetize the structure) and alternate (the stimulus) magnetic fields were imposed. Disc surfaces were defined to be equipotential to simulate the presence of metallic electrodes, as it is the case in experiments, and the voltage difference developed between the two surfaces under the applied magnetic field was obtained (the response). This configuration is the L-T magnetoelectric mode, for which the α31E transverse field coefficient is readily derived as the ratio between the voltage difference and magnetic field amplitudes, normalized to the total thickness of the structure, for varying magnetizing fields. Unless specified, an alternate magnetic field of 10 Oe amplitude and 10 kHz frequency was used, while the magnetizing field was changed in steps between 1 and −1 kOe, which were the measuring conditions in [18]. Unclamped (stress-free) and open-circuit (zero current) mechanical and electrical boundary conditions were selected, respectively, while continuity of in-plane strain, of normal electrical displacement, and of normal magnetic field was imposed across the magnetostrictive-piezoelectric interfaces to couple the two components. Both three- and two-dimensional models were tested. Four-node linear piezoelectric tetrahedron type elements were used by Comsol in the 3D case, while three-node linear piezoelectric triangular type elements were used for the 2D model. A fine mesh was employed across the composite thickness, which was checked for output accuracy.
Input material coefficients for the simulations are given in Table 1 for the magnetostrictive ceramic material and in Table 2 and Table 3 for the piezoelectric one. Actual composites, whose magnetoelectric response is being compared with simulations are high-quality NiFe2O4-Bi0.36Pb0.64Sc0.36Ti0.64O3 ones with crack-free, fully-functional interfaces that have been processed by spark plasma sintering (SPS) of nanocrystalline powders at temperatures between 1000 °C and 800 °C to minimize chemical reactions at, and interdiffusion across, the interface [18]. The selected advanced processing has a distinctive effect on the microstructure of the two ceramic components, and material coefficients for coarse-grained materials cannot blissfully be used for the simulations.
Relating NiFe2O4, this is a magnetic soft spinel oxide with significant magnetostriction, which has been widely used as magnetic component in co-fired ceramic magnetoelectric particulate and laminate composites, usually in combination with high-sensitivity piezoelectric Pb(Zr,Ti)O3 [13,14,15,19,20]. Magnetostrictive strain is proportional to the squared magnetization:
where Q111 is the magnetostriction coefficient. Composites operate under a bias magnetic field to generate a specific magnetization, for which the effective piezomagnetic coefficient q111 is maximum. This is the input parameter for the simulation that is defined from Equation (3) as:
where M(H) and / are the magnetization curve and its derivative.
Curves of strain as a function of magnetic field have been reported for coarse-grained ceramics [14], from which the magnetic field dependence of the effective piezomagnetic coefficient can be readily obtained as the derivative. However, magnetization curves are known to be very sensitive to microstructure with a direct effect on the effective piezomagnetic coefficients. Experimental magnetization curves for the actual composites to be simulated can be found in [18]. Indeed, a distinctive evolution of the curves with processing temperature and thus, with microstructure was found. Therefore, q (H) was evaluated from these experimental curves, and a Q111 value of 1 × 10⁻⁸ g2·emu−2 that was calculated from the saturation strain and magnetization of coarse-grained ceramics: ~25 × 10−6 [14] and ~50 emu·g−1 [21]. There is a good agreement between the latter value and the saturation magnetization for the NiFe2O4-Bi0.36Pb0.64Sc0.36Ti0.64O3 composite processed by SPS at 1000 °C [18]. The rest of the parameters were directly taken from [12,22,23].
(1 − x) BiScO3-x PbTiO3 is a perovskite solid solution with enhanced electromechanical response at a ferroelectric morphotropic phase boundary (MPB) located at x ≈ 0.64, which also has a high Curie temperature TC of ≈450 °C [24]. It is being extensively investigated as an alternative to state-of-the-art Pb(Zr,Ti)O3 (PZT) for operation beyond 200 °C up to 400 °C [25,26]. Additionally, its properties present very good down-scaling behavior with grain size through the submicron scale [27], and even maintain functionality at the nanoscale [28]. The full set of material coefficients for Bi0.36Pb0.64Sc0.36Ti0.64O3 coarse grained ceramics is available in the literature [29]. However, an analogous set does not exist for materials spark plasma sintered at low temperatures, yet d33 values can be found in [18]. Figures of 440, 400, and 285 pC·N−1 were obtained for the materials SPS at 1000, 900, and 800 °C that had average grain sizes of 1.9, 0.9, and 0.35 μm, respectively. The value for the first material is comparable to those of ceramics sintered by conventional means from the same powder that have an average grain size of 2.4 μm, and from which all the ε33σ permittivity, the s11E and s12E compliances, and the d31 piezoelectric coefficients have been reported [25]. Therefore, these permittivity and compliance values were assumed. The ε11σ permittivity and the rest of compliances, that is, s33E, s13E, and s55E, were calculated from these values, and the ε11σ/ε33σ, s33E/s11E, s13E/s11E, and s55E/s11E ratios reported in [29], under the assumption that they basically hold for poled ceramics of a given material. Similarly, the d31 and d15 piezoelectric coefficients were calculated from the d33 values and the d31/d33 and d15/d33 ratios of [25,29], respectively. It is obvious that errors are being introduced by doing this, yet it is assumed that they are smaller than those associated with directly accepting the full set of material coefficients for the coarse-grained materials of [29], which also included MnO2 as an additive to increase resistivity.
3. Results and Discussion
Simulation results are presented and discussed in two sections, where they are separately compared with those obtained with existing analytical solutions and with experimental data.
3.1. Simulations against Analytical Solutions
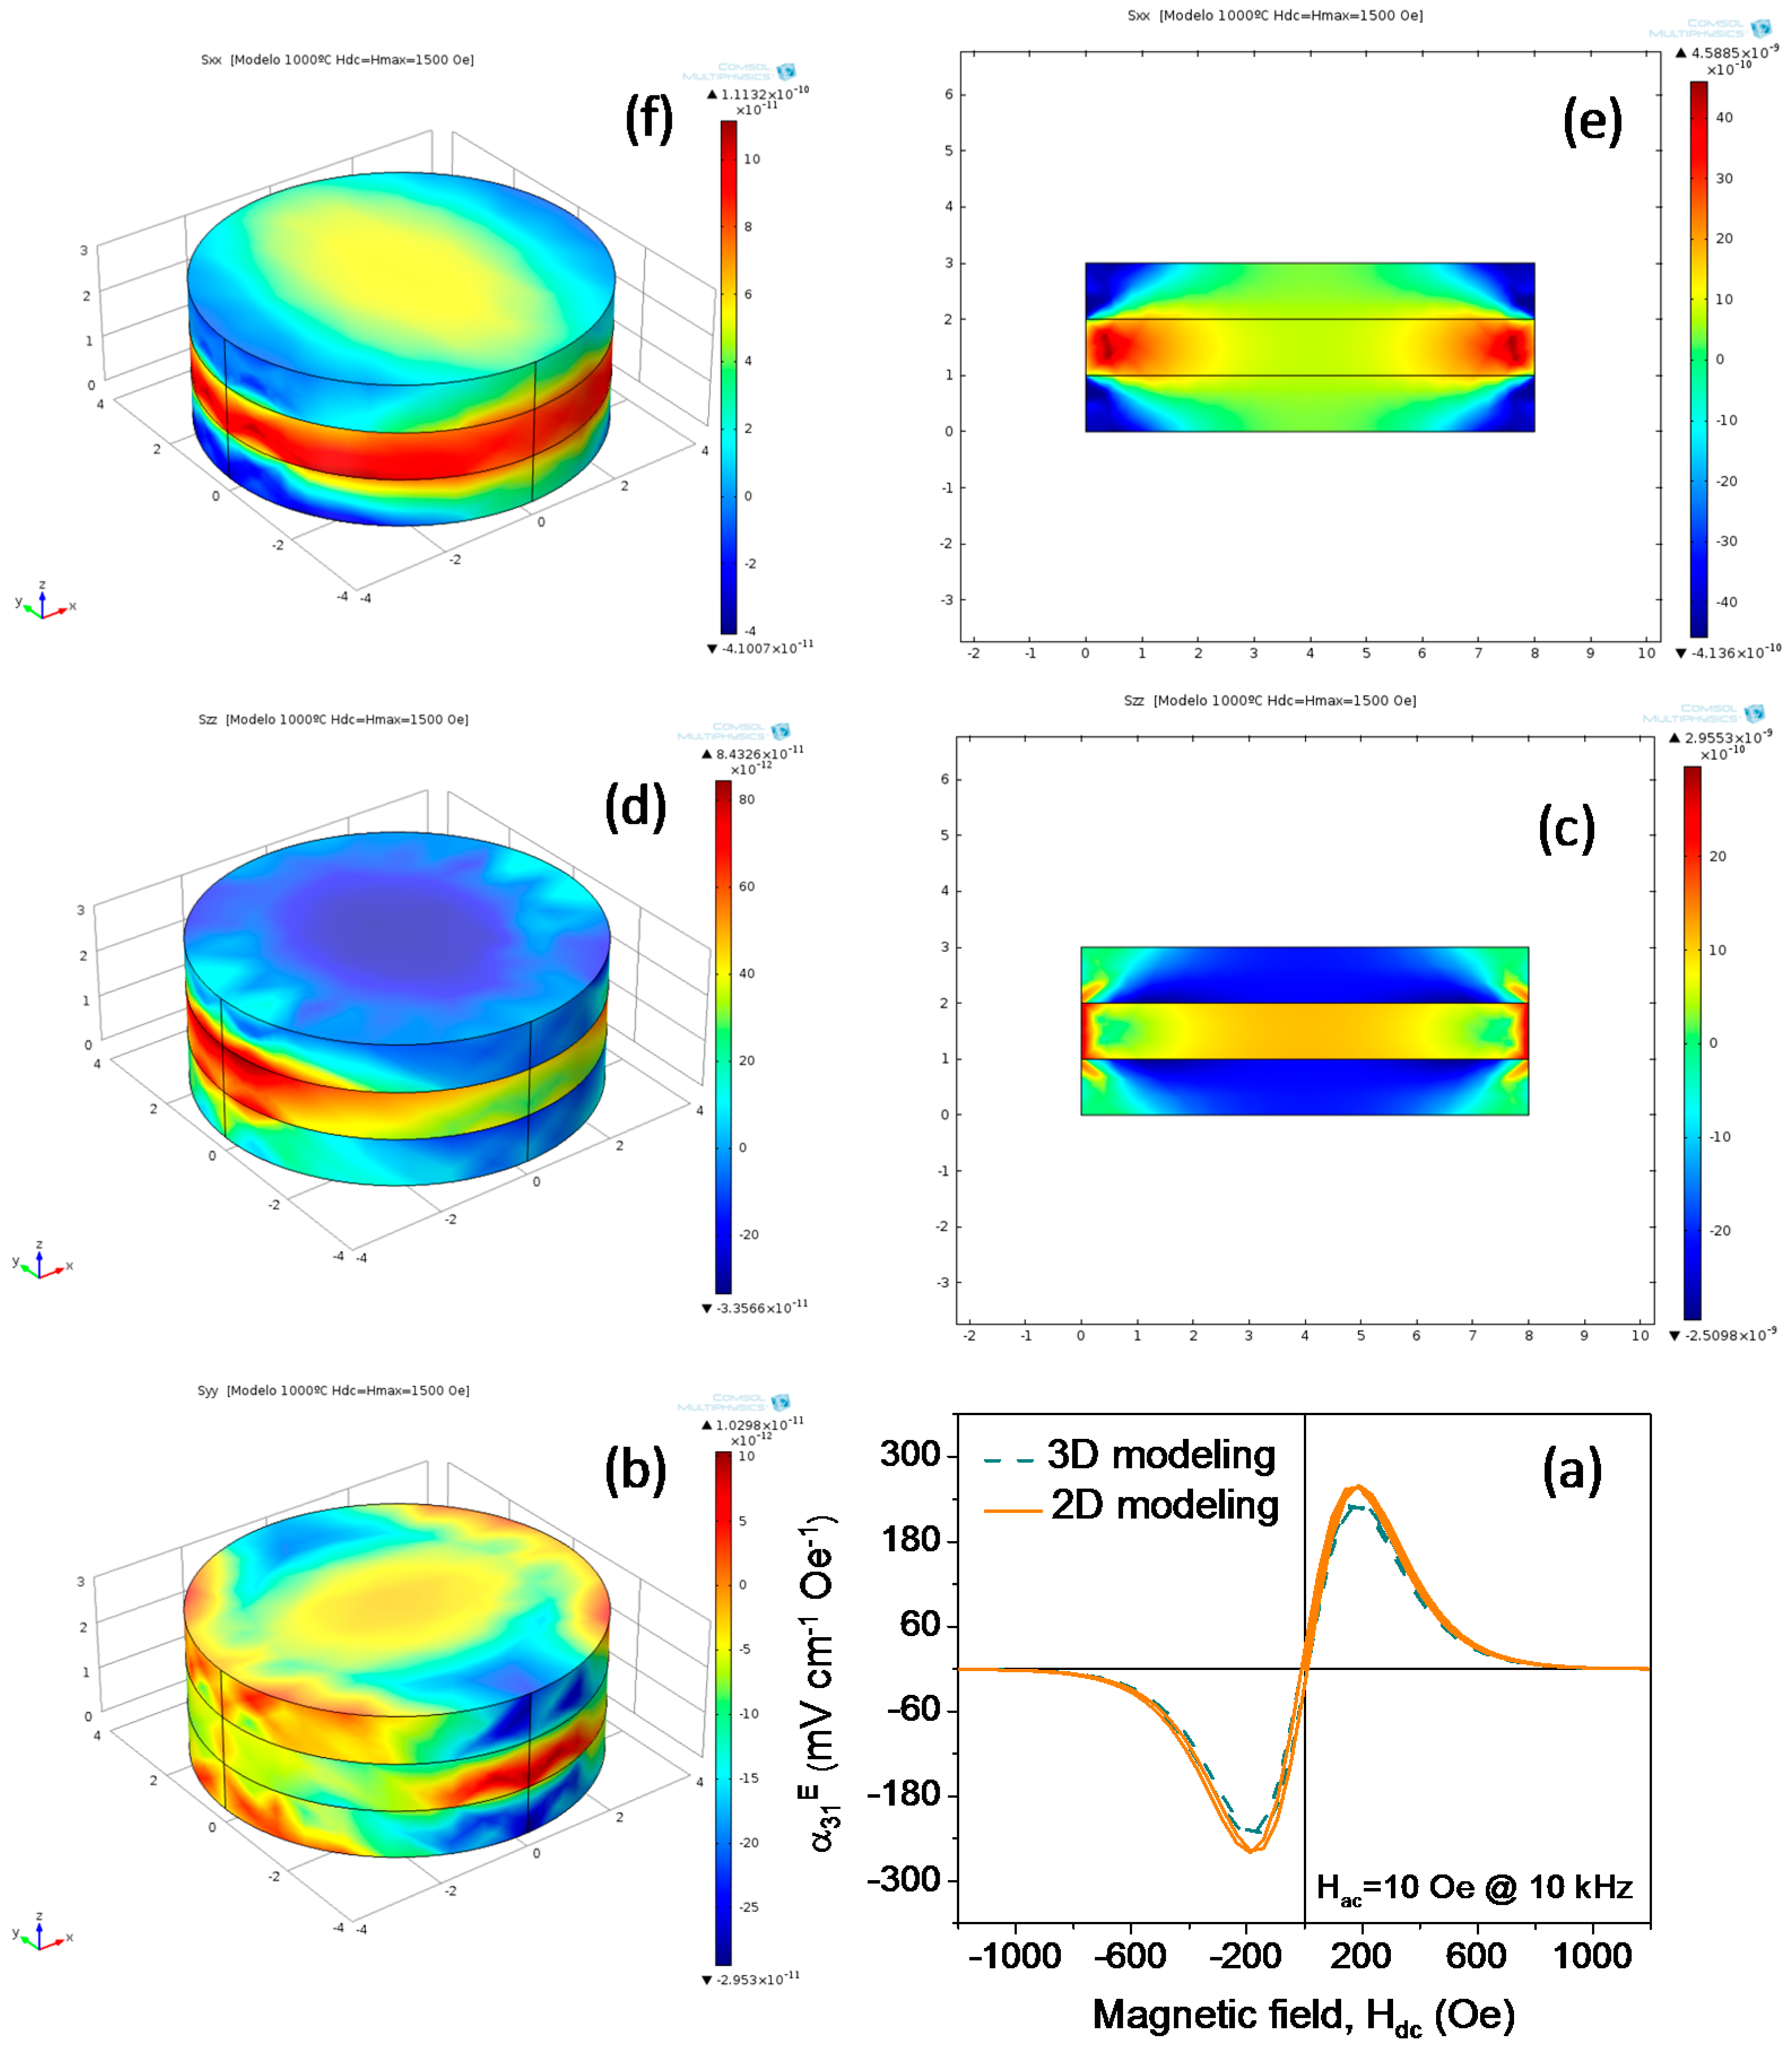
Both 3D and 2D models were initially tested, even though the 2D case is known to be an approximation to the 3D one because of the anisotropy of the composite material properties. However, very similar α31E magnetoelectric coefficients were obtained with the two models. An example is provided in Figure 1, where the coefficients obtained by simulation of 3D and 2D Bi0.36Pb0.64Sc0.36Ti0.64O3/NiFe2O4/Bi0.36Pb0.64Sc0.36Ti0.64O3 three-layer structures with 8 mm in-plane dimension, either diameter or length, and 3 mm thickness with all layers 1 mm thick are given. Material coefficients corresponding to processing at 1000 °C were used. A magnetoelectric coefficient of 235 mV·cm−1·Oe−1 was obtained in the case of the 3D modeling that slightly increased up to 260 mV·cm−1·Oe−1 for the 2D model. Equal bias magnetic fields for maximum response were found. Therefore, the only shortcoming of using 2D modeling seems to be a slight overestimation of the coefficients by about ~10% and, thus, this was extensively used hereinafter, for 2D modeling spares a large amount of calculation time.
The S11, S33 and S22 (this, only in the 3D case) strain fields resulting from the simulations are also given in the figure. Note they are not homogenous. Homogeneous fields are a key assumption in the derivation of the analytical expressions reported in [10,11,12]. The relevance of this hypothesis was assessed by comparing the results anticipated by the analytical expression of [12] for a bilayer, and simulations of the same system. The analytical solution for the α31E of such a two-layer structure is given by:
where k is the interface coupling parameter that takes a value of 1 for ideal mechanical coupling and 0 for no strain transmission, and ν is the piezoelectric phase volumetric fraction. qij and sij are the effective piezomagnetic coefficients and elastic compliances of the magnetostrictive component, while dij, sijE and εijσ are the piezoelectric charge coefficients, the elastic compliances at constant electric field, and the dielectric permittivity at constant stress of the piezoelectric component. Reduced matrix notation is used (11→1, 22→2, 33→3). The same values from Table 1, Table 2 and Table 3 were used as input parameters of Equation (5) and for the simulations. Note that the in-plane magnetostrictive deformation perpendicular to the applied magnetic field was neglected, for values of q21 for NiFe2O4 were not found. Though this must introduce an error—actually an overestimation—it will similarly affect the results anticipated by Equation (5) and those resulting from the simulations.
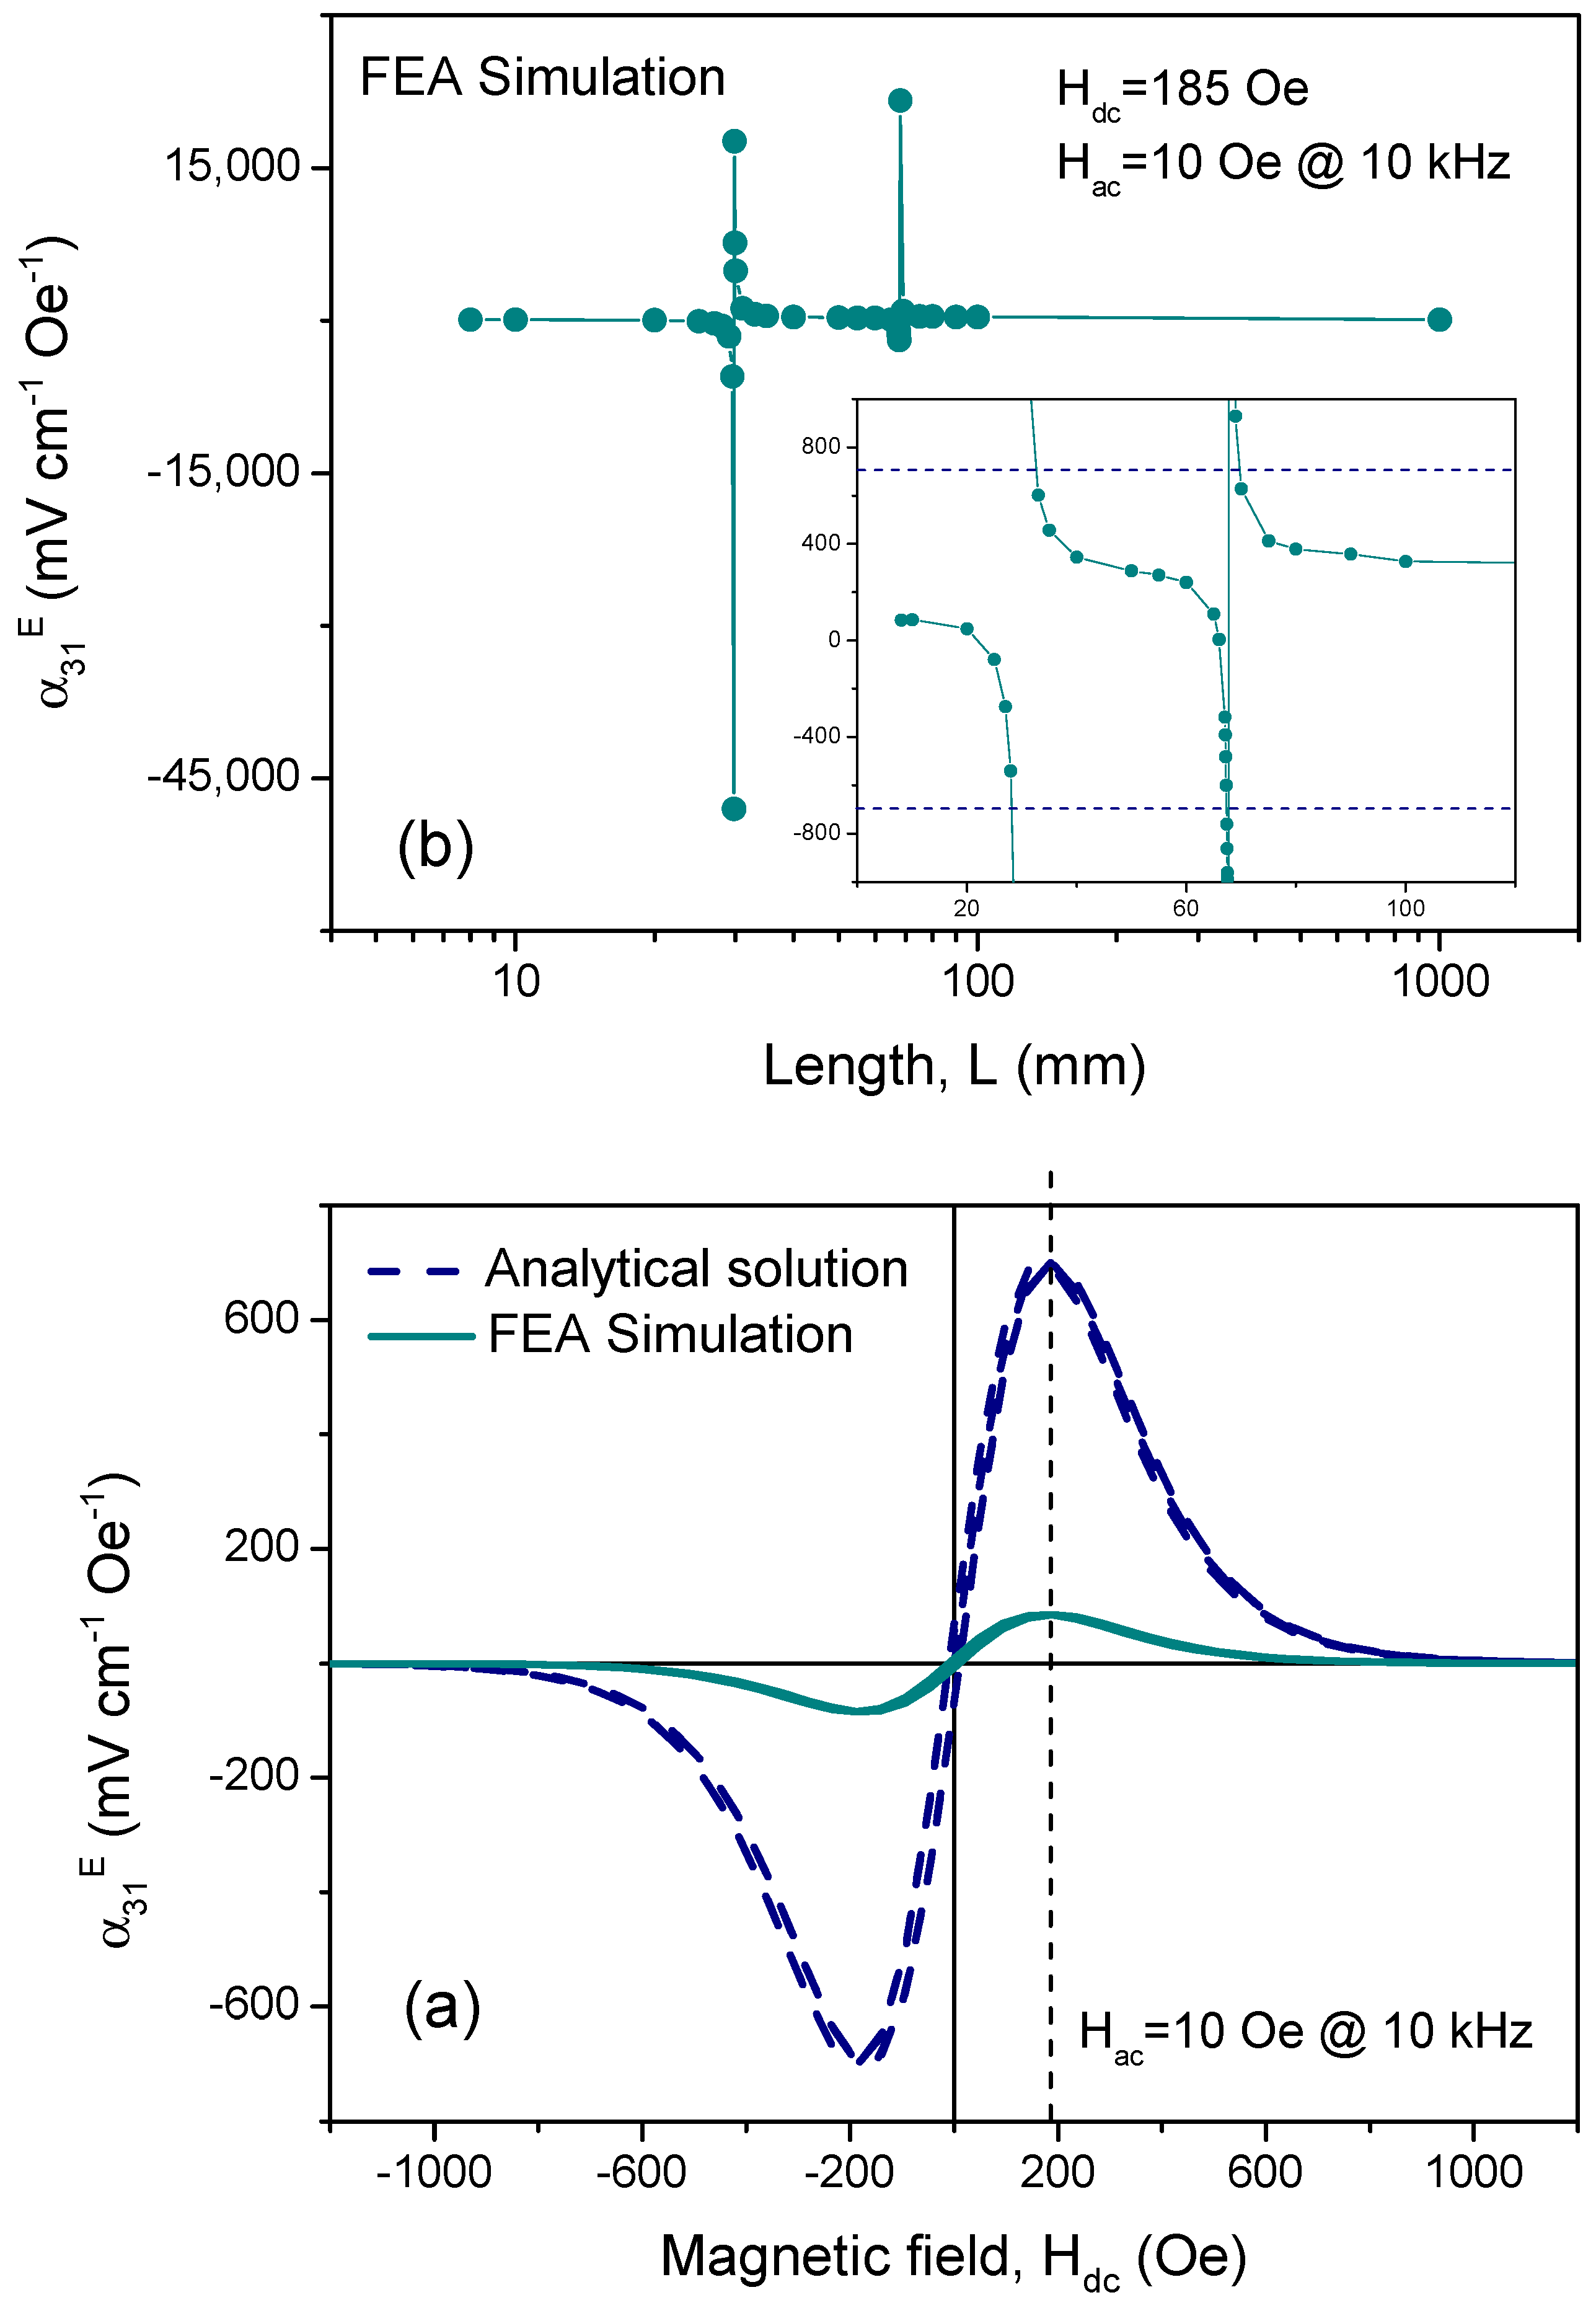
Magnetoelectric coefficients obtained with the equation for a piezoelectric fraction of 0.5, and those resulting from the simulation of a two-layer structure with 8 mm in-plane dimension, and 2 mm thickness with both layers 1 mm thick (same 0.5 piezoelectric fraction) are compared in Figure 2. Agreement is surprisingly poor, as the simulation resulted in values much lower than those anticipated from Equation (5). Indeed, a maximum value of ~700 mV·cm−1·Oe−1 is obtained with the analytical solution, while a value of ~85 mV·cm−1·Oe−1 results from simulation. No significant change of the coefficients was found by simulation when the conductivity of the spinel oxide was decreased from 0.1 S/m down to 1 × 10⁻¹⁰ S/m. Therefore, the difference must be associated with the actual inhomogeneous strain fields present in the structure that are neglected by the analytical solution. This underlines limitations of using Equation (5).
One might expect that equation values should be recovered by simulating composites with increasing length at constant thickness. However, results of the simulations for two-layer structures indicate this not to be the case. This is illustrated in Figure 2b, where the magnetoelectric coefficient of 2 mm thick two-layer structures with increasing length is shown. Indeed coefficients did not increase with length, but they maintained constant values until a length of around 30 mm, at which a typical resonant behavior existed. This must be related to the in-plane structure mechanical resonance that is excited with the magnetic field, in the same way resonances of piezoelectric structures are excited with the electric field [30]. Indeed, overtones are also found, like the second-order resonance for a length of around 68 mm. It is worth noting that Equation (5) cannot account for resonant phenomena, for frequency does not appear.
This has clear implications in previous reports of very good agreement between the analytical solution for the bilayer, and experimental results for different layered structures. Unfortunately, geometry and dimensions are not always specified, but simulation results reported here strongly suggest that agreement is rather a fortunate coincidence associated with a favorable geometry (close to the element fundamental mechanical resonance or to an overtone) than a true indication of ideal mechanical coupling between the components. Indeed, coefficients of several hundreds of mV·cm−1·Oe−1 are obtained for two-layer structures with length intermediate between the fundamental resonance and the first overtone. Additionally, one has to keep in mind that resonances in actual materials are likely broadened and partially smeared out in comparison with simulated ones. Therefore, values comparable with the analytical solution can be obtained for specific geometry ranges, as is illustrated in the inset of Figure 2b by the dashed lines that mark the result of the analytical solution. Note also that different magnetoelectric coefficients can be obtained by varying the measuring frequency depending on the geometry, for resonance position (or length) shifts with this parameter. For instance, the resonance moves from a length of 30 mm up to 95 mm when the frequency is reduced from 10 kHz down to 1 kHz.
Specifically, several previous works reported a good agreement between the analytical solution for the bilayer and experimental results for three-layer structures [15]. However, simulations show that such structures do not have the same response for a given geometry, as it is illustrated in Figure 3, where 8 mm long, 2 mm thick structures with a piezoelectric fraction of 0.5 are compared. It is found that the three-layer structure shows a significantly higher maximum α31E than the two-layer one: ~260 mV·cm−1·Oe−1 against ~85 mV·cm−1·Oe−1. This further corroborates the reported agreements to be basically coincidental.
A result of the analytical solution that has concentrated a lot of attention is the anticipation of a piezoelectric fraction for maximum magnetoelectric response. This is illustrated in Figure 3b for the system under analysis. Large variation of coefficients with piezoelectric fraction is found with a maximum for ν ≈ 0.5–0.6. A very different result is obtained by simulation of 8 mm long, 2 mm thick two-layer structures, for which small variations of around 10% (average of 92 mV·cm−1·Oe−1 with typical deviation of ±10 mV·cm−1·Oe−1) resulted for ν values between 0.1 and 0.9 with a maximum response of ≈108 mV·cm−1·Oe−1 for ν ≈ 0.2–0.3. This is a consequence of the developing inhomogeneous strain fields, as is confirmed by the fact that a result much closer to that of the analytical solution is found when structures with large aspect ratios, while avoiding mechanical resonances, are simulated. An example corresponding to a structure 100 mm long is included in the figure, for which a maximum response of ~330 mV·cm−1·Oe−1 is obtained for a piezoelectric fraction of 0.6.
3.2. Simulations against Experimental Results
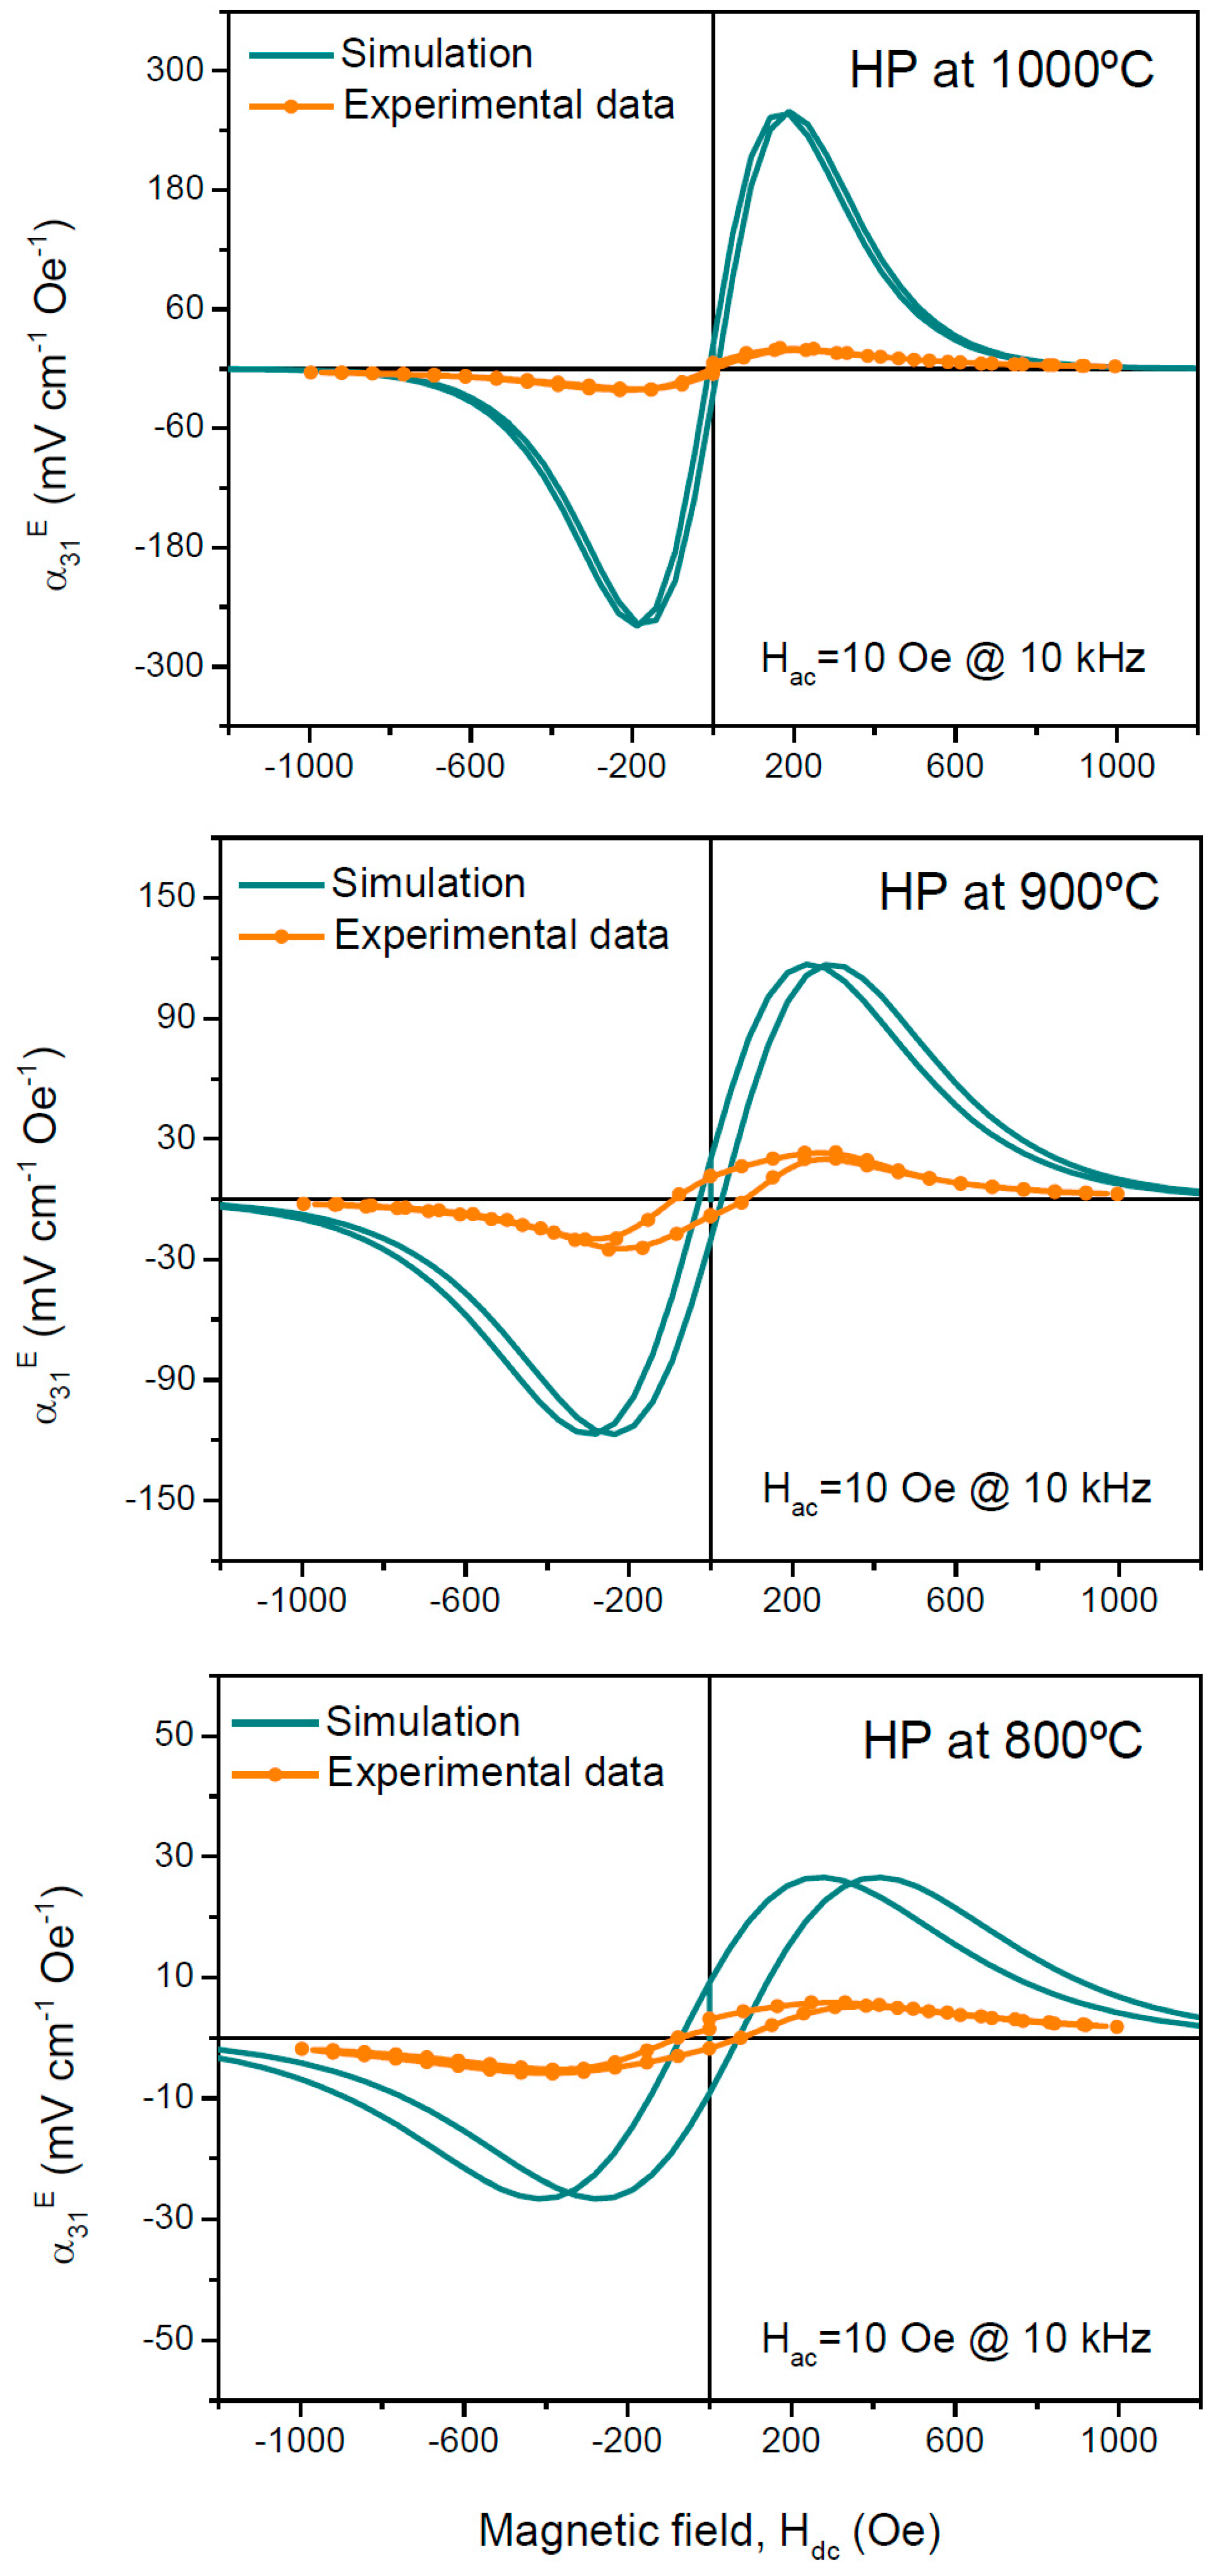
Results of the simulations with the material coefficients corresponding to processing at 1000 °C, 900 °C, and 800 °C for three-layer Bi0.36Pb0.64Sc0.36Ti0.64O3/NiFe2O4/Bi0.36Pb0.64Sc0.36Ti0.64O3 structures with 8 mm length and 3 mm thickness, with all layers 1 mm thick, are compared in Figure 4 with reported experimental data for analogous 8 mm diameter disc samples. Maximum α31E values of 21, 24, and 8 mV·cm−1·Oe−1 were obtained in the ceramic composites spark plasma sintered at these temperatures [18]. Note that figures do not coincide with those reported in [18], for the piezoelectric thickness was used in that case to normalize the magnetoelectric response. It is surprising that a higher coefficient was achieved for the material processed at 900 °C than in that processed at 1000 °C, in spite of the piezoelectric layer presenting lower piezoelectric coefficients. Indeed, simulations indicate that the magnetoelectric coefficients are expected to diminish with decreasing processing temperature, following the piezoelectric coefficients. This result was already noted in [18], and associated with the triggering of microstructural degradation in the magnetic layer at 1000 °C.
When comparing the simulation results with the experimental data, consistently larger values were obtained by simulation, yet difference reduces with decreasing processing temperature, so that figures 92%, 80%, and 70% lower than the expected (simulated) ones were found for the ceramics spark plasma sintered at 1000 °C, 900 °C, and 800 °C, respectively.
Two mechanisms were investigated as possible origins of this reduction in response: (1) the presence of a layer of reduced piezoelectricity next to the interface due to interdiffusion across or chemical reactions at the interface; and (2) the occurrence of strain relaxation across a distance shorter than the total thickness of piezoelectric layers. In relation to the first mechanism, localized exaggerated grain growth phenomena has been described for both Pb(Zr,Ti)O3 and BiScO3-PbTiO3 next to NiFe2O4 layers [19,27], which suggest interdiffusion of some species across the interface that might promote liquid phase formation. Indeed, Pb diffusion into the magnetostrictive layer was clearly shown to occur in the latter case, which resulted in a compositional deviation of (1 − x) BiScO3-x PbTiO3 towards lower x values, and in a layer of largely coarsened piezoelectrically-inactive grains. It must be noted that this phenomenon was observed for composites processed by hot pressing from NiFe2O4 powder obtained by mechanochemical activation, and it has been related to the presence of W traces from the milling media [27]. Experimental coefficients compared here with simulations are for composites processed by SPS from a different NiFe2O4 powder source free of W contamination, which showed no apparent interdiffusion phenomena across interfaces [18].
The relevance of this first potential effect was studied by simulating five-layer structures that incorporated intermediate layers of varying thickness between the magnetostrictive and piezoelectric ones. The same material coefficients of Bi0.36Pb0.64Sc0.36Ti0.64O3 were assumed for the additional layers, but for the piezoelectric coefficients that were set to zero. This is obviously an extreme case far beyond experimental observation, but suitable for a qualitative discussion. Results are shown in Figure 5 for the material coefficients corresponding to processing at 900 °C, which resulted in the highest experimental magnetoelectric response. A nearly linear decrease of the magnetoelectric coefficient with the thickness of the intermediate piezoelectrically-inactive layers was found, so that the experimental value of 24 mV·cm−1·Oe−1 was obtained for a thickness of ≈0.77 mm. This is quite a thick modified layer that one would hardly expect going unnoticed. Actually piezoresponse force microscopy (PFM) studies of this specific interface have shown that grains attached to the NIFe2O4 layers are piezoelectrically active as it is illustrated in the inset. Moreover, an in-depth recent study has demonstrated fully-functional interfaces [31]. Therefore, this mechanism is not responsible for the reduction of the response in the specific case under study.
In relation to the second mechanism, that is, the occurrence of strain relaxation across a distance shorter than the total thickness of piezoelectric layers, this was also studied by simulation of five-layer structures incorporating outward, fully-relaxed piezoelectric layers of varying thickness. Basically, the initial three-layer structure was maintained inward, and two outer piezoelectric layers were added with the same material coefficients of Bi0.36Pb0.64Sc0.36Ti0.64O3 but, for the elastic compliance, were increased by three orders of magnitude. This causes negligible stresses to develop in the external additional layers under the magnetically-generated strains. Results are shown in Figure 5b for the material coefficients corresponding to processing at 900 °C. Magnetoelectric coefficients decrease as the thickness of the relaxed outer layers increases, so that the experimental value is obtained for a thickness of ≈0.9 mm. This would mean that strain relaxation takes place across a thickness of ≈100 μm, which is far larger than the grain size of ~1 μm [18].
The same exercise was accomplished for the materials processed at 1000 °C and 800 °C, and the experimental values of 21 and 8 mV·cm−1·Oe−1 were obtained for a relaxed thickness of ≈0.96 and 0.85 mm, respectively. There is, thus, a distinctive decrease of the relaxation length with increasing temperature, from ≈150 μm for 800 °C down to ≈40 μm for 1000 °C. This is likely a grain size effect that is 0.35 μm for the material spark plasma sintered at 800 °C, and 1.9 μm in that sintered at 1000 °C. The obtained trend of the relaxation length with average grain size is given in the inset of Figure 5b. Plastic deformation and/or microcracking could be responsible of the strain relaxation. Relating the first mechanism, ferroelectric/ferroelastic domain reorientation is the main mechanism for plastic deformation in piezoelectric ceramics [32,33]. Indeed, ferroelectric/ferroelastic domain configurations and their dynamics are known to evolve with grain size, so that they simplify and become increasingly immobile as size decreases across the submicron range, until their disappearance [34]. As a consequence, their contribution to non-linear deformation decreases with the size decrease. This is consistent with the increase of the relaxation length with microstructure refinement discussed for the composites. However, fracture strength of ceramics is also known to increase with the grain size decrease [35]. Therefore, both mechanisms could, and most probably do, contribute to the observed strain relaxation across a distance shorter than the total thickness of piezoelectric layers.
3.3. Final Considerations and Analysis of the Multilayer Geometry
Overall, the results shown here clearly indicate that the actual geometry of the magnetoelectric composites must be considered when deriving the expected response in order to assess their quality, namely, how close one is to the designed properties. Additionally, finite element analysis is shown to be a powerful means of simulating this response, capable of capturing phenomena like magnetically-induced mechanical resonances.
Results also show that interfaces cannot be systematically blamed of any poor response, as is often done, and that strain relaxation across the piezoelectric layer, directly related to its mechanical properties, can have a similarly detrimental effect. They also indicate, at least in the case of the NiFe2O4-Bi0.36Pb0.64Sc0.36Ti0.64O3 layered composites, yet it is likely a general result, that a trade-off exists between the mechanical and piezoelectric properties, so that one cannot continuously decrease the grain size until a relaxation length above the piezoelectric thickness is attained, but there is a certain grain size for maximum magnetoelectric response as a result of the degradation of piezoelectric properties. It must be noted that BiScO3-PbTiO3 is revealed as a very interesting system for composites, for their functional properties present very good down-scaling behavior across the submicron range. Moreover, its coercive field is significantly higher than that of Pb(Zr,Ti)O3 and, thus, it most probably has a higher threshold stress for non-linear deformation, yet this has not been reported as far as the authors know.
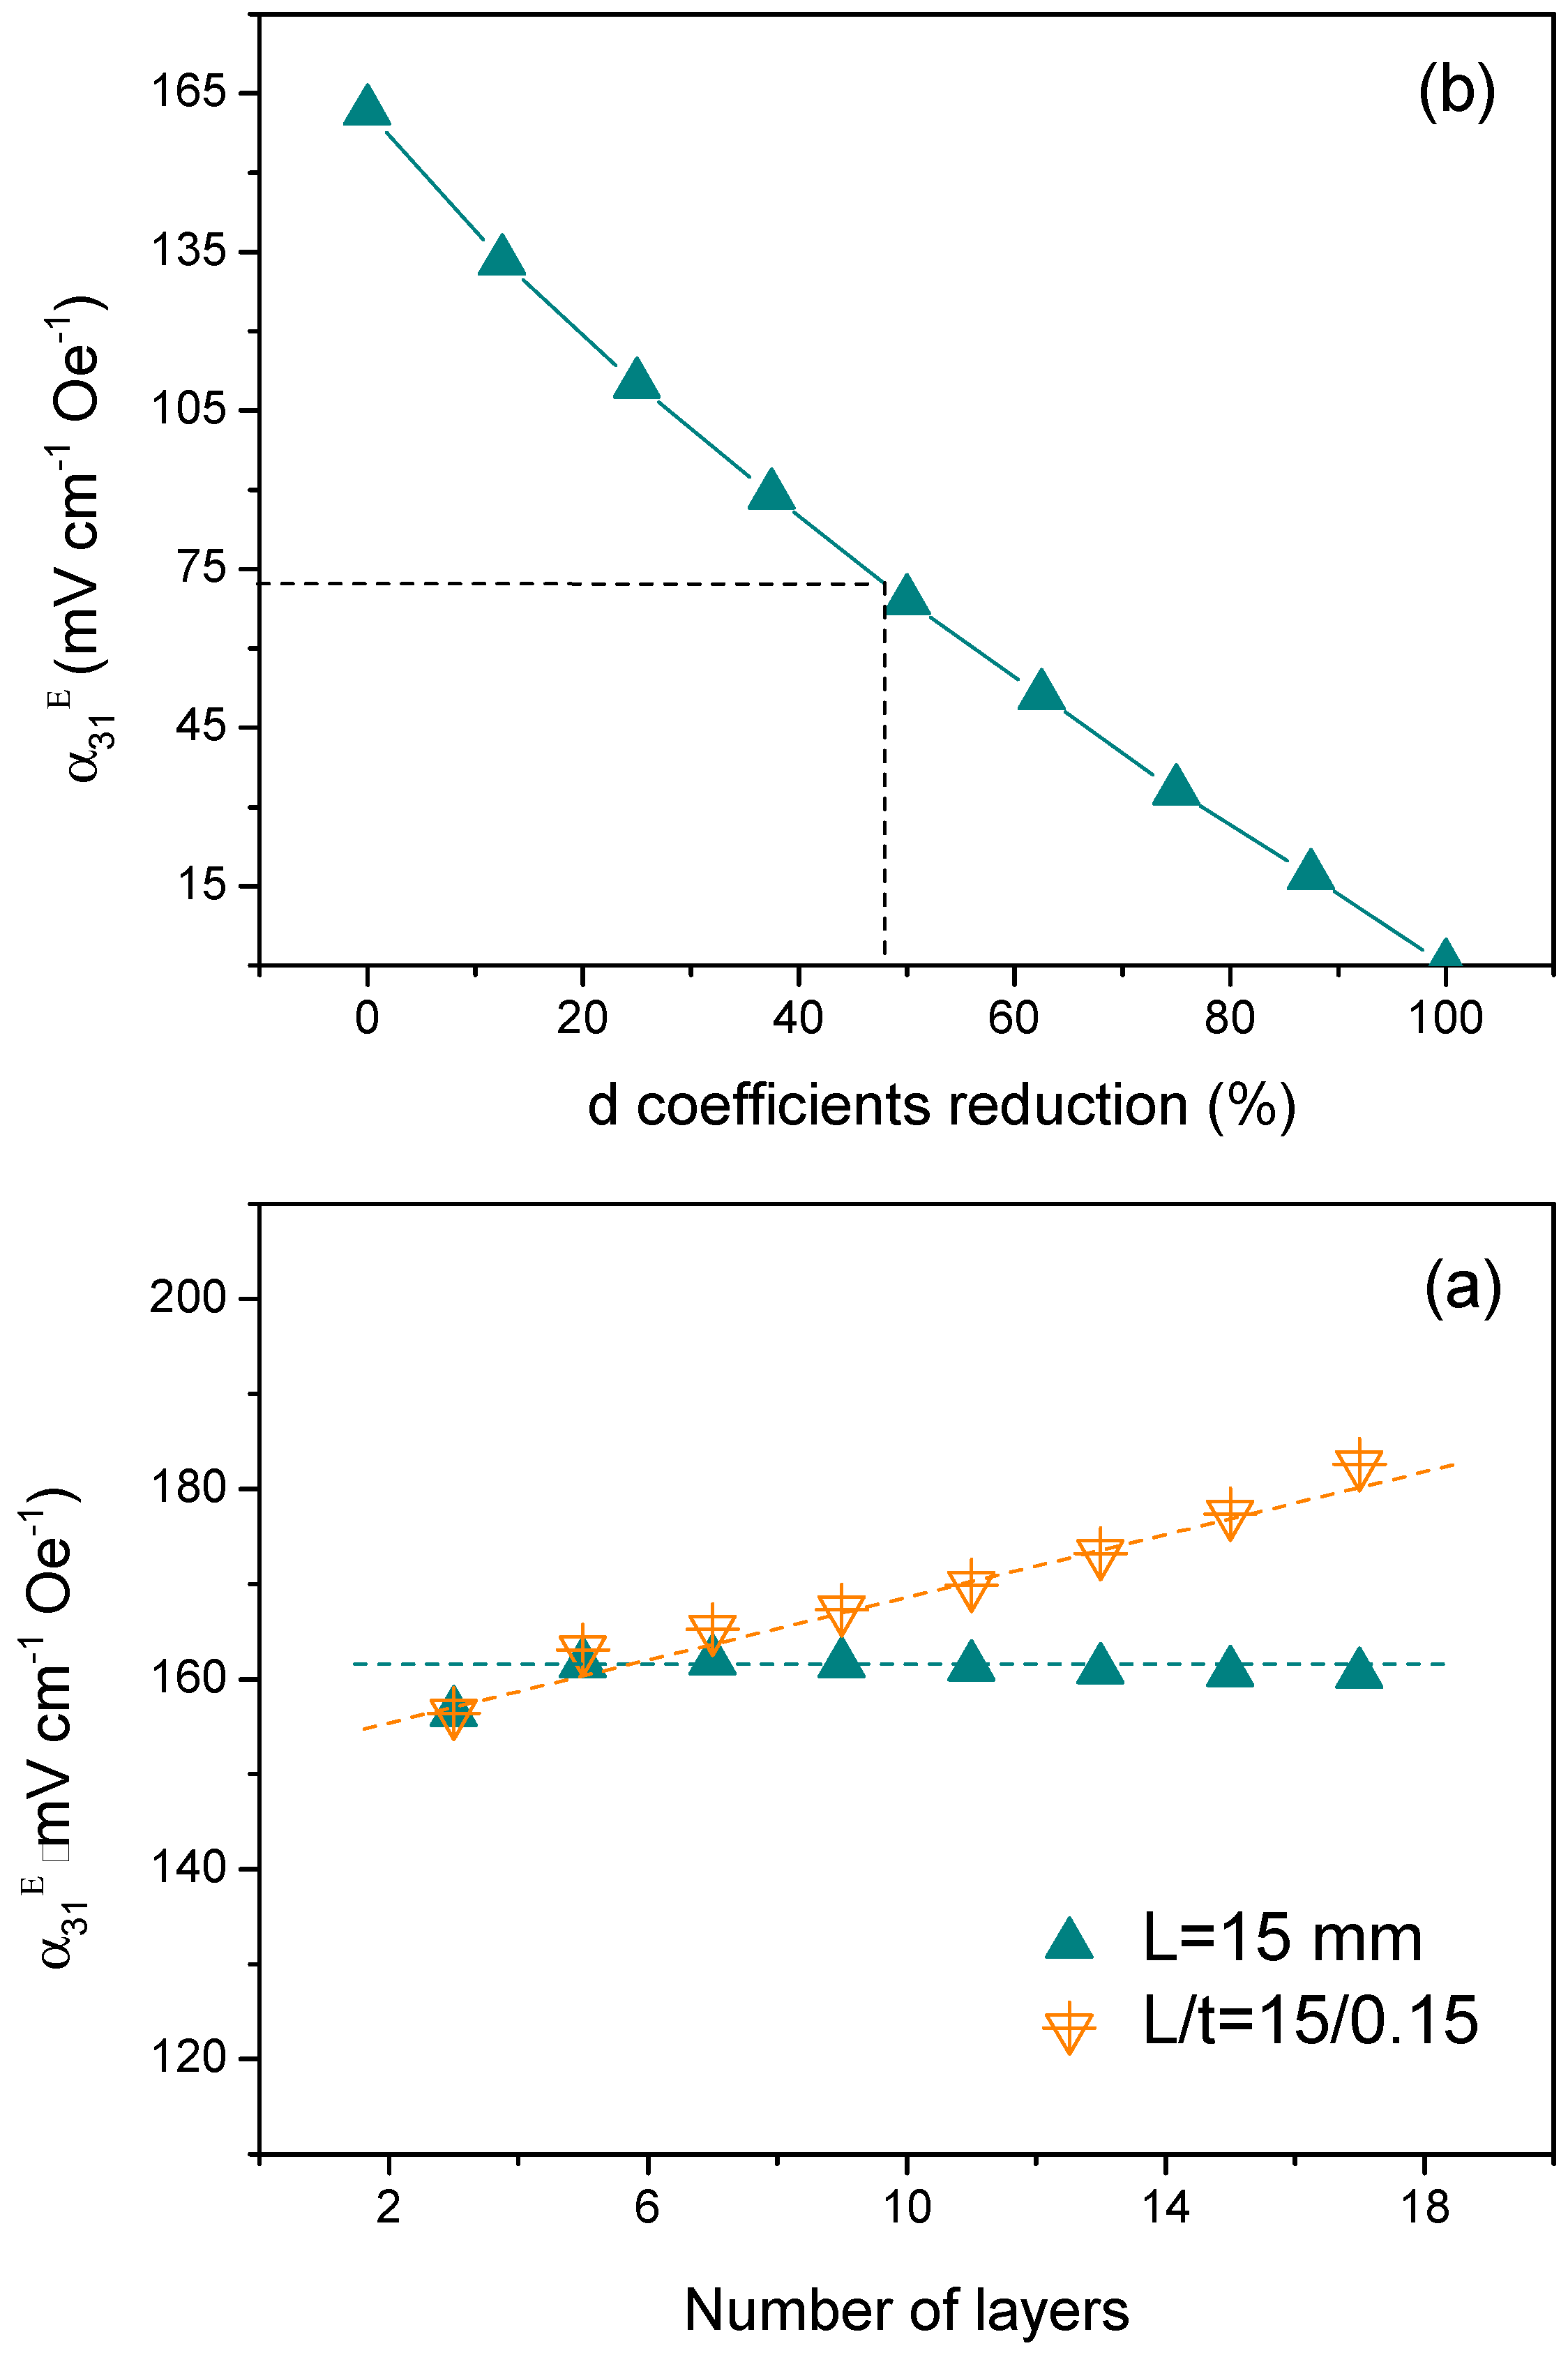
A direct consequence of the previous discussion is that response should increase by decreasing the piezoelectric thickness at a constant grain size. Indeed, also in [18], a magnetoelectric coefficient of 72 mV·cm−1·Oe−1 was obtained for multilayer structures with layer thickness of ~50 μm, analogously processed to the three-layer composites here discussed. Tape casting technology was used to obtain such thin ceramic layers. The expected response of these multilayer structures was also simulated by FEA and the results are shown in Figure 6. Three-layer structures with a length of 15 mm and an individual thickness of 50 μm was initially simulated, to which bilayers were successively added. A coefficient of 156 mV·cm−1·Oe−1 was obtained for the three-layer structure, which slightly increased up to 161 mV·cm−1·Oe−1 for the five-layer one. No further increase was found when successive layers were added. Therefore, the experimental value for the multilayer is only a 55% below the simulated one, which has to be compared with a reduction of 80% for the analogous three-layer structure with 1 mm thick layers. This confirms the role of strain relaxation.
However, there is then still a disagreement between the experimental value for the multilayer and the simulation, in spite of the piezoelectric layer being much thinner than the strain relaxation length for the specific microstructure. Among the possible causes, the level of poling clearly stands out, for in the simulation it is assumed that poling achieved in the composite is similar to that for a piezoelectric ceramic, which might not be true. This effect was also studied by simulation for a nine-layer structure, and the decrease of the magnetoelectric coefficient as a result of an increasingly poor poling, expressed as relative reduction of piezoelectric coefficients, is shown in Figure 6b. Note that the experimental value of 72 mV·cm−1·Oe−1 is reached when the piezoelectric coeffficients are reduced down to ≈48%.
Nevertheless, and notwithstanding poling issues, thickness reduction below the characteristic strain relaxation length has been shown to be an effective means of enhancing the magnetoelectric response of composites. Additionally, simulations also showed that further enhancement can be obtained in multilayer structures if the length is increased at the same time bilayers are added in order to maintain a constant length to thickness ratio of 15/0.15 A continuous increase is found in this case up to 182 mV·cm−1·Oe−1 for a 17-layer structure, as is illustrated in Figure 6a.
4. Conclusions
Finite element analysis is a suitable method to simulate the magnetoelectric response of magnetostrictive-piezoelectric layered composites, taking into account their actual geometry, and allowing the study of relevant mechanical resonant phenomena. Results of the simulation of two-layer structures with finite geometry show that magnetoelectric coefficients are significantly lower than those obtained with available analytical solutions for a bilayer. This is associated with the assumption of homogenous strain fields in the latter, which is not necessarily true in real composites. Results of the simulation of three-layer structures with realistic material coefficients show that magnetoelectric coefficients are above the experimental values for Bi0.36Pb0.64Sc0.36Ti0.64O3/NiFe2O4/Bi0.36Pb0.64Sc0.36Ti0.64O3 ceramic composite discs with analogous geometry. The presence of a layer of reduced piezoelectricity next to the interface resulting from interdiffusion across, or chemical reactions at, the interface is ruled out as responsible of the reduction in response. Instead, the occurrence of strain relaxation across a distance shorter than the total thickness of piezoelectric layers is proposed to cause this reduction. The characteristic relaxation length has been estimated and shown to increase when grain size decreases, so that it is above 100 μm when grain size decreases down to the submicron range. Piezoelectric thickness reduction below this value, which can be experimentally achieved by processing multilayer structures by tape casting, is shown to be an effective means of avoiding strain relaxation, and thus enhancing the magnetoelectric response.
Acknowledgments
This work was funded by Spanish MINECO through grant MAT2014-58816-R.
Author Contributions
M.A. and P.R., with the input of H.A., conceived and designed the simulation studies; P.R. performed the simulation studies; H.A., J.R., and A.C. contributed experimental results for analysis; M.A., P.R., H.A., and A.C. analyzed the data; and M.A. wrote the paper.
Conflicts of Interest
The authors declare no conflict of interest. The founding sponsor had no role in the design of the study; in the collection, analyses, or interpretation of data; in the writing of the manuscript; and in the decision to publish the results.
References
- Liu, M.; Obi, O.; Lou, J.; Chen, Y.J.; Cai, Z.H.; Stoute, S.; Espanol, M.; Lew, M.; Situ, X.; Ziemer, K.S.; et al. Giant electric field tuning of magnetic properties in multiferroic ferrite/ferroelectric heterostructures. Adv. Funct. Mater. 2009, 19, 1826–1831. [Google Scholar] [CrossRef]
- Wang, Y.; Gray, D.; Berry, D.; Gao, J.; Li, M.; Li, J.; Viehland, D. An extremely low equivalent magnetic noise magnetoelectric sensor. Adv. Mater. 2011, 23, 4111–4114. [Google Scholar] [CrossRef] [PubMed]
- O’Handley, R.C.; Huang, J.K.; Bono, D.C.; Simon, J. Improved wireless, transcutaneous power transmission for in vivo applications. IEEE Sens. J. 2008, 8, 57–62. [Google Scholar] [CrossRef]
- Han, J.; Hu, J.; Yang, Y.; Wang, Z.; Wang, S.X.; He, J. A nonintrusive power supply design for self-powered sensor networks in the smart grid by scavenging energy from AC power line. IEEE Trans. Ind. Electron. 2015, 62, 4398–4407. [Google Scholar] [CrossRef]
- Nan, C.W.; Bichurin, M.I.; Dong, S.; Viehland, D.; Srinivasan, G. Multiferroic magnetoelectric composites: Historical perspective, status, and future directions. J. Appl. Phys. 2008, 103, 031101. [Google Scholar] [CrossRef]
- Ma, J.; Hu, J.; Li, Z.; Nan, C.W. Recent progress in multiferroic magnetoelectric composites: From bulk to thin films. Adv. Mater. 2011, 23, 1062–1087. [Google Scholar] [CrossRef] [PubMed]
- Ortega, N.; Kumar, A.; Scott, J.F.; Katiyar, R.S. Multifunctional magnetoelectric materials for device applications. J. Phys. Condens. Matter 2015, 27, 504402. [Google Scholar] [CrossRef] [PubMed]
- Dong, S.; Zhai, J.; Li, J.; Viehland, D. Near-ideal magnetoelectricity in high permeability magnetostrictive/piezofiber laminates with (2-1) connectivity. Appl. Phys. Lett. 2006, 89, 252904. [Google Scholar] [CrossRef]
- Jin, J.; Zhao, F.; Han, K.; Haque, M.A.; Dong, L.; Wang, Q. Multiferroic polymer lamínate composites exhibiting high magnetoelectric response induced by hydrogen-bonding interactions. Adv. Funct. Mater. 2014, 24, 1067–1073. [Google Scholar] [CrossRef]
- Nan, C.W. Magnetoelectric effect in composites of piezoelectric and piezomagnetic phases. Phys. Rev. B 1994, 50, 6082–6088. [Google Scholar] [CrossRef]
- Avellaneda, M.; Harshe, G. Magnetoelectric effect in piezoelectric/magnetostrictive multilayer (2-2) composites. J. Intell. Mater. Syst. Struct. 1994, 5, 501–513. [Google Scholar] [CrossRef]
- Bichurin, M.I.; Petrov, V.M.; Srinivasan, G. Theory of low-frequency magnetoelectric coupling in magnetostrictive-piezoelectric bilayers. Phys. Rev. B 2003, 68, 054402. [Google Scholar] [CrossRef]
- Zhai, J.; Cai, N.; Shi, Z.; Lin, Y.; Nan, C.W. Coupled magnetodielectric properties of laminated PbZr0.53Ti0.47O3/NiFe2O4 ceramics. J. Appl. Phys. 2004, 95, 5685–5690. [Google Scholar] [CrossRef]
- Srinivasan, G.; Rasmussen, E.T.; Gallegos, J.; Srinivasan, R.; Bokham, Y.I.; Laletin, V.M. Magnetoelectric bilayer and multilayer structures of magnetostrictive and piezoelectric oxides. Phys. Rev. B 2001, 64, 214408. [Google Scholar] [CrossRef]
- Islam, R.A.; Ni, Y.; Khachaturyan, A.G.; Priya, S. Giant magnetoelectric effect in sintered multilayered composite structures. J. Appl. Phys. 2008, 104, 044103. [Google Scholar] [CrossRef]
- Huang, B.; Kim, H.S.; Wang, J.; Du, J. Interlaminar stress analysis of magneto-electro-elastic composite layered laminates using a stress function based iterative approach. Compos. Part B-Eng. 2016, 90, 406–415. [Google Scholar] [CrossRef]
- Fernandez, C.S.L.; Pereira, N.; Lanceros-Mendez, S.; Martins, P. Evaluation and optimization of the magnetoelectric response of CoFe2O4/poly(vinylidene fluoride) composite spheres by computer simulation. Compos. Sci. Technol. 2017, 146, 119–130. [Google Scholar] [CrossRef]
- Amorin, H.; Alguero, M.; Del Campo, R.; Vila, E.; Ramos, P.; Dolle, M.; Romaguera-Barcelay, Y.; Perez-De La Cruz, J.; Castro, A. High-sensitivity piezoelectric perovskite for magnetoelectric composites. Sci. Technol. Adv. Mater. 2015, 16, 016001. [Google Scholar] [CrossRef] [PubMed]
- Park, C.S.; Priya, S. Cofired magnetoelectric laminate composites. J. Am. Ceram. Soc. 2011, 94, 1087–1095. [Google Scholar] [CrossRef]
- Zhou, Y.; Yan, Y.; Priya, S. Co-fired magnetoelectric transformer. Appl. Phys. Lett. 2014, 104, 232906. [Google Scholar] [CrossRef]
- Chauhan, L.; Shukla, A.K.; Sreenivas, K. Properties of NiFe2O4 ceramics from powders obtained by auto-combustion synthesis with different fuels. Ceram. Int. 2016, 42, 12136–12147. [Google Scholar] [CrossRef]
- Pierre, V. Inorganic Solid Phases; Springer: Heidelberg, Germany, Springer Materials; Available online: http://materials.springer.com/isp/crystallographic/docs/sd_1218275 (accessed on 2 October 2017).
- McCurrie, R.A. Ferromagnetic Materials: Structure and Properties; Academic Press: New York, NY, USA, 1994; ISBN 0124824951. [Google Scholar]
- Eitel, R.E.; Randall, C.A.; Shrout, T.R.; Park, S.E. Preparation and characterization of high temperature perovskite ferroelectrics in the solid-solution (1-x)BiScO3-xPbTiO3. Jpn. J. Appl. Phys. 2002, 41, 2099–2104. [Google Scholar] [CrossRef]
- Berganza, E.; Pascual-Gonzalez, C.; Amorin, H.; Castro, A.; Alguero, M. Point defect engineering of high temperature piezoelectric BiScO3-PbTiO3 for high power operation. J. Eur. Ceram. Soc. 2016, 36, 4039–4048. [Google Scholar] [CrossRef]
- Pascual-Gonzalez, C.; Berganza, E.; Amorin, H.; Castro, A.; Alguero, M. Point defect engineering of high temperature piezoelectric BiScO3-PbTiO3 for enhanced voltage response. Mater. Des. 2016, 108, 501–509. [Google Scholar] [CrossRef]
- Amorin, H.; Hungria, T.; Landa-Canovas, A.R.; Torres, M.; Dolle, M.; Alguero, M.; Castro, A. Nanopowders of ferroic oxides for magnetoelectric composites. J. Nanopart. Res. 2011, 13, 4189–41200. [Google Scholar] [CrossRef]
- Alguero, M.; Amorin, H.; Hungria, T.; Galy, J.; Castro, A. Macroscopic ferroelectricity and piezoelectricity in nanostructured BiScO3-PbTiO3 ceramics. Appl. Phys. Lett. 2009, 94, 012902. [Google Scholar] [CrossRef] [Green Version]
- Zhang, S.; Alberta, E.F.; Eitel, R.E.; Randall, C.A.; Shrout, T.R. Elastic, piezoelectric and dielectric characterization of modified BiScO3-PbTiO3 ceramics. IEEE Trans. Ultrason. Ferroelectr. Freq. Control 2006, 52, 2131–2139. [Google Scholar] [CrossRef]
- Srinivasan, G.; DeVreugh, P.; Flattery, C.S.; Laletsin, V.M.; Paddubnaya, N. Magnetoelectric interactions in hot pressed nickel zinc ferrite and lead zirconate titanate composites. Appl. Phys. Lett. 2004, 85, 2550–2552. [Google Scholar] [CrossRef]
- Amorin, H.; Ricote, J.; San-Felipe, I.; Salazar, N.; Del Campo, R.; Romaguera-Barcelay, Y.; Pérez de la Cruz, J.; Ramos, P.; Vila, V.; Castro, A.; et al. Multilayer ceramic magnetoelectric composites with tailored interfaces for enhanced response. ACS Appl. Mater. Interfaces 2017, in press. [Google Scholar] [CrossRef]
- Fan, J.; Stoll, W.A.; Lynch, C.S. Nonlinear constitutive behavior of soft and hard PZT: Experiments and modeling. Acta Mater. 1999, 47, 4415–4425. [Google Scholar] [CrossRef]
- Webber, K.G.; Aulbach, E.; Key, T.; Marsilius, M.; Granzow, T.; Rodel, J. Temperature-dependent ferroelastic switching of soft lead zirconate titanate. Acta Mater. 2009, 57, 4614–4623. [Google Scholar] [CrossRef]
- Arlt, G. Twinning in ferroelectric and ferroelastic ceramics: Stress relief. J. Mater. Sci. 1990, 25, 2655–2666. [Google Scholar] [CrossRef]
- Rice, R.W. Ceramic tensile strength-grain size relations: Grain sizes, slopes, and branch intersections. J. Mater. Sci. 1997, 32, 1673–1692. [Google Scholar] [CrossRef]
Figure 1.
(a) Comparison of the magnetoelectric coefficient α31E obtained by simulation of a Bi0.36Pb0.64Sc0.36Ti0.64O3/NiFe2O4/Bi0.36Pb0.64Sc0.36Ti0.64O3 1 mm/1 mm/1 mm three-layer structure with 8 mm in-plane dimension using 3D and 2D models. Strain fields for both cases are given: (b) S22 3D; (c) S33 2D; (d) S33 3D; (e) S11 2D; and (f) S11 3D. Material coefficients corresponding to processing at 1000 °C have been used.

Figure 2.
(a) Comparison of the magnetoelectric coefficient α31E obtained with the analytical solution of [12] for a bilayer with a piezoelectric fraction of 0.5, and those resulting from the simulation of a 1 mm/1 mm two-layer structure with 8 mm in-plane dimension; and (b) α31E coefficients from the simulation of 1 mm/1 mm two-layer structures with increasing in-plane dimension. Material coefficients corresponding to processing at 1000 °C have been used.

Figure 3.
Comparison of (a) the magnetoelectric coefficient α31E resulting from the simulation of 8 mm long, 2 mm thick two-layer and three-layer structures with a piezoelectric fraction of 0.5; and (b) the piezoelectric fraction dependence of α31E anticipated by the analytical solution of [12] for a bilayer, and those resulting from the simulation of 1 mm/1 mm two-layer structures with 8 mm and 100 mm in-plane dimensions. Materials coefficients corresponding to processing at 1000 °C have been used.
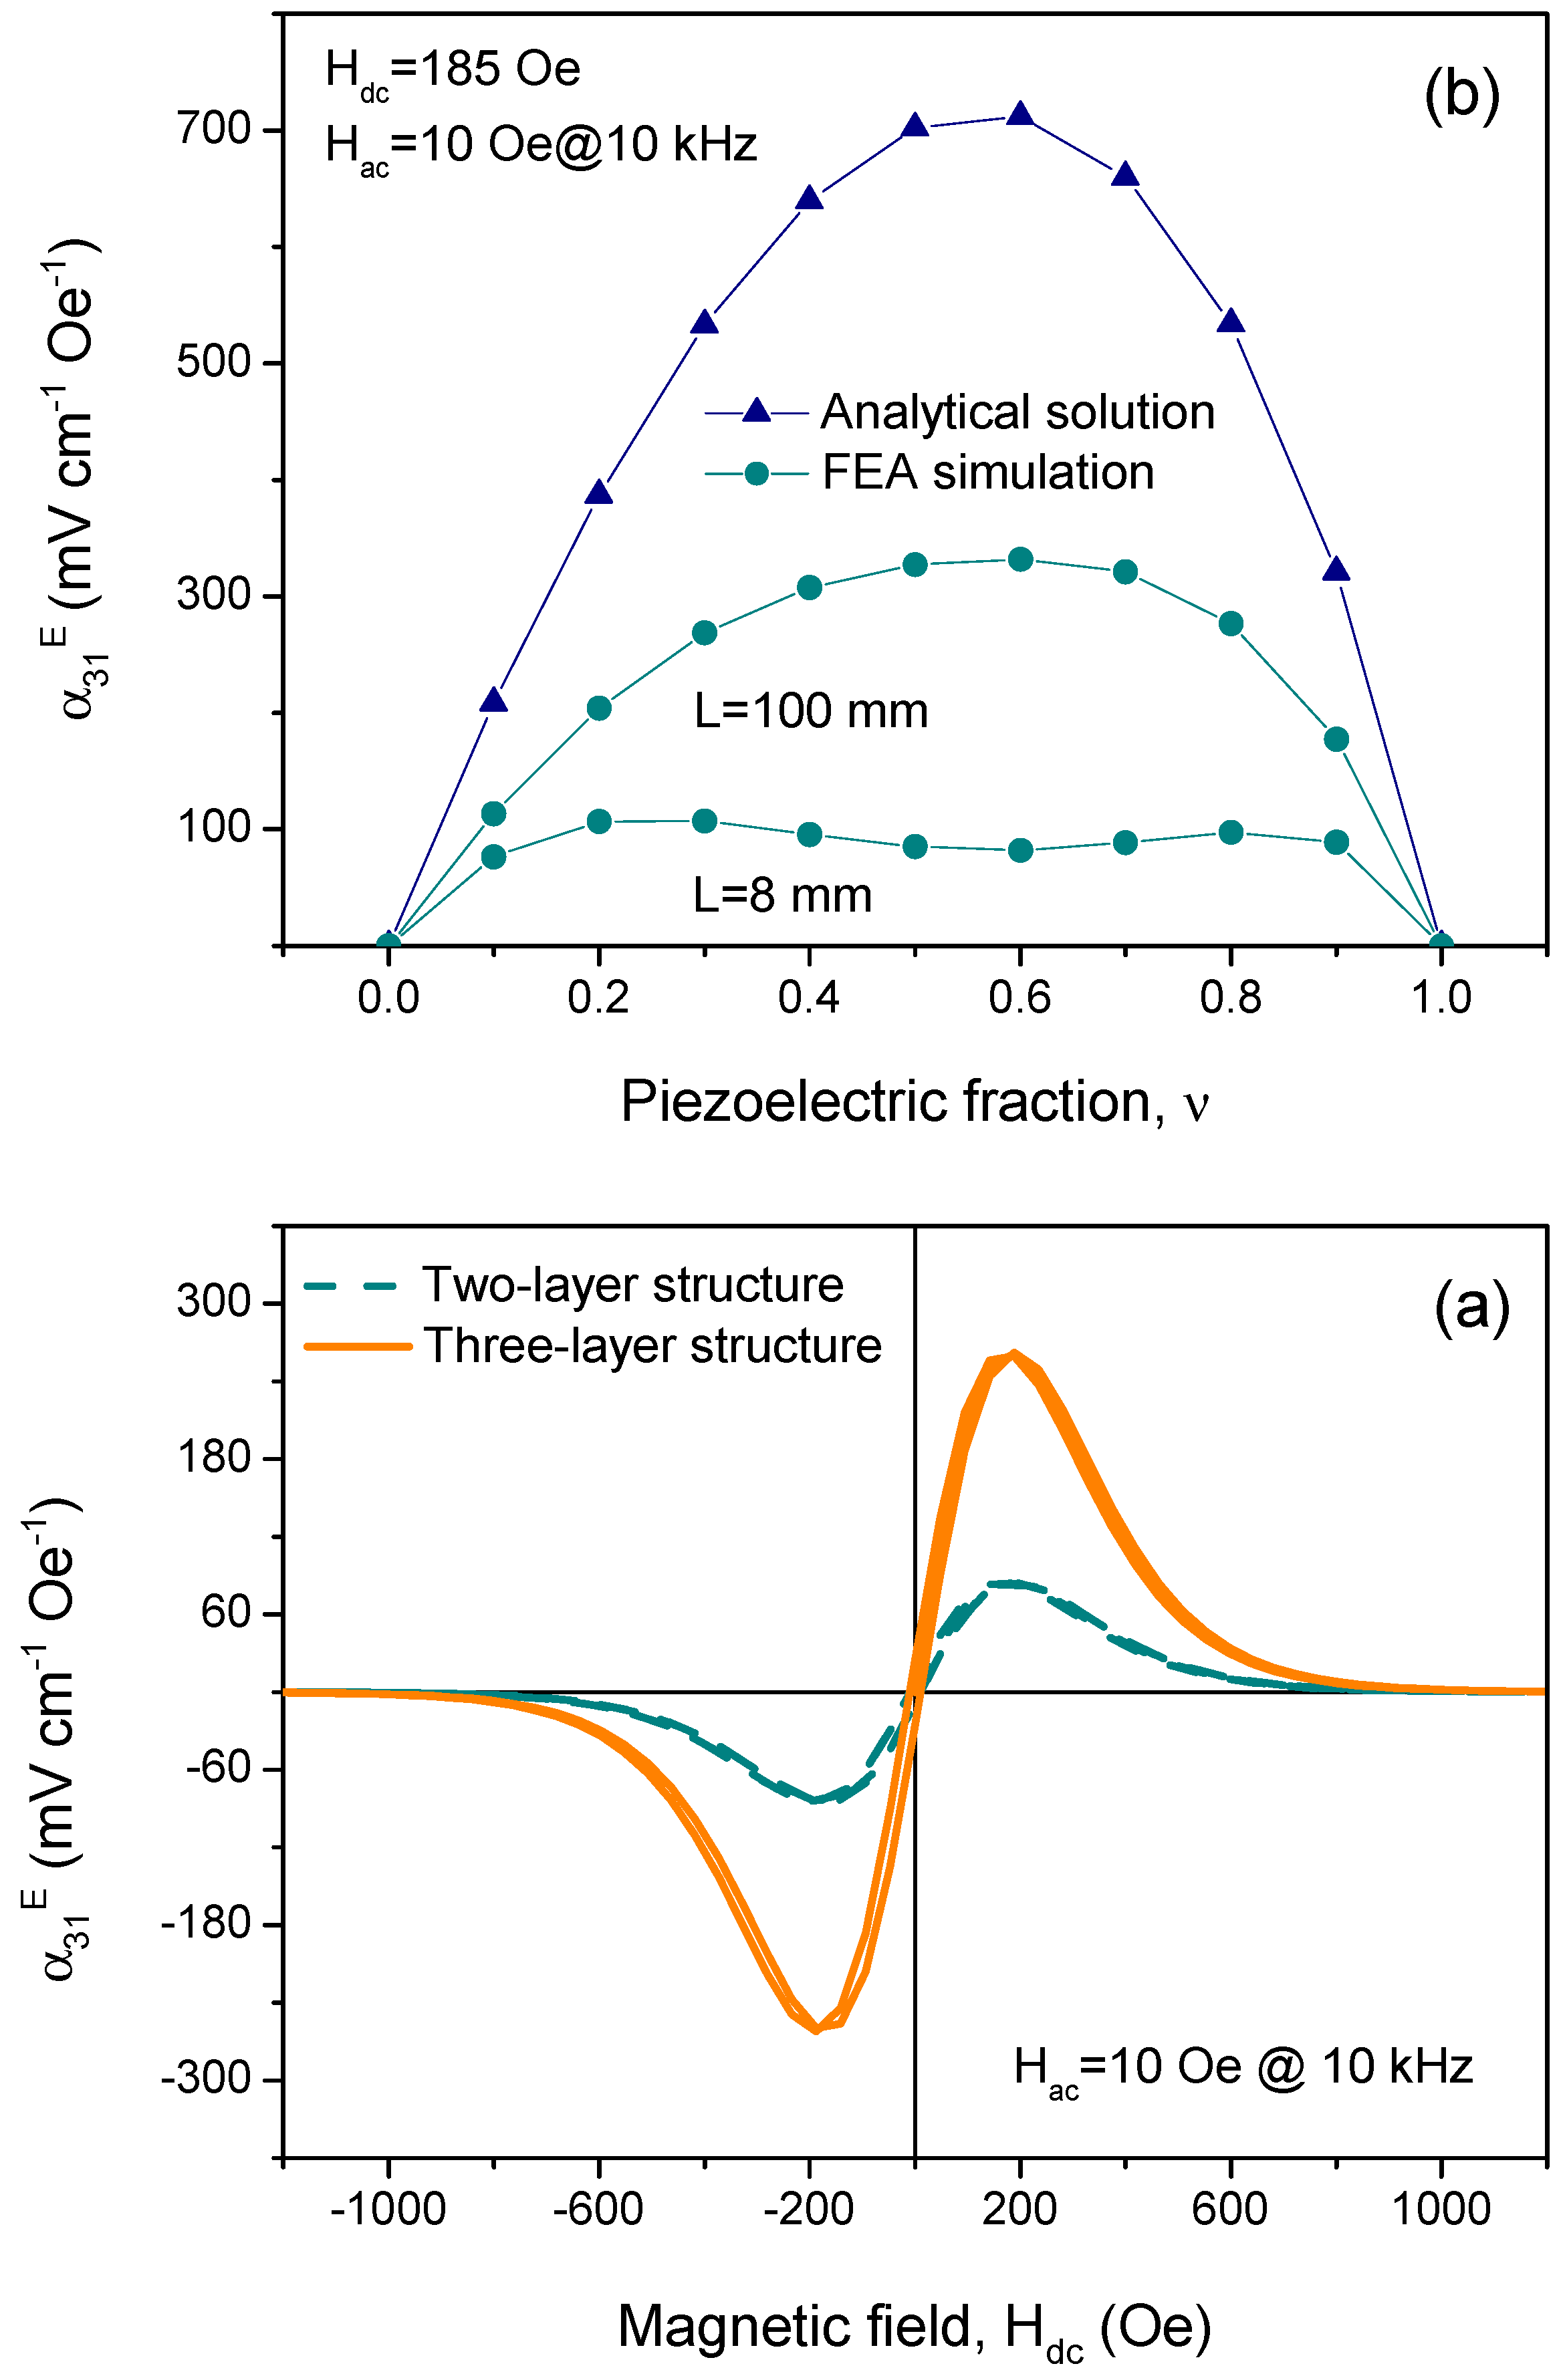
Figure 4.
Comparison of experimental results for Bi0.36Pb0.64Sc0.36Ti0.64O3/NiFe2O4/Bi0.36Pb0.64Sc0.36Ti0.64O3 1 mm/1 mm/1 mm three-layer composite discs with 8 mm diameter, processed by SPS at decreasing temperature, with results obtained by the simulation of three-layer structures.
Figure 4.
Comparison of experimental results for Bi0.36Pb0.64Sc0.36Ti0.64O3/NiFe2O4/Bi0.36Pb0.64Sc0.36Ti0.64O3 1 mm/1 mm/1 mm three-layer composite discs with 8 mm diameter, processed by SPS at decreasing temperature, with results obtained by the simulation of three-layer structures.

Figure 5.
Comparison of experimental results for Bi0.36Pb0.64Sc0.36Ti0.64O3/NiFe2O4/Bi0.36Pb0.64Sc0.36Ti0.64O3 1 mm/1 mm/1 mm three-layer composite discs with 8 mm diameter, processed by SPS at 900 °C, with results obtained by simulation of five-layer structures introducing (a) intermediate Bi0.36Pb0.64Sc0.36Ti0.64O3 layers with no piezoelectricity; and (b) external Bi0.36Pb0.64Sc0.36Ti0.64O3 layers with ultrahigh mechanical compliance. The inset in (a) is a PFM image of the interface demonstrating it to be piezoelectrically active, and the inset in (b) is the dependence of the strain relaxation length with grain size. Materials coefficients corresponding to processing at 900 °C have been used.
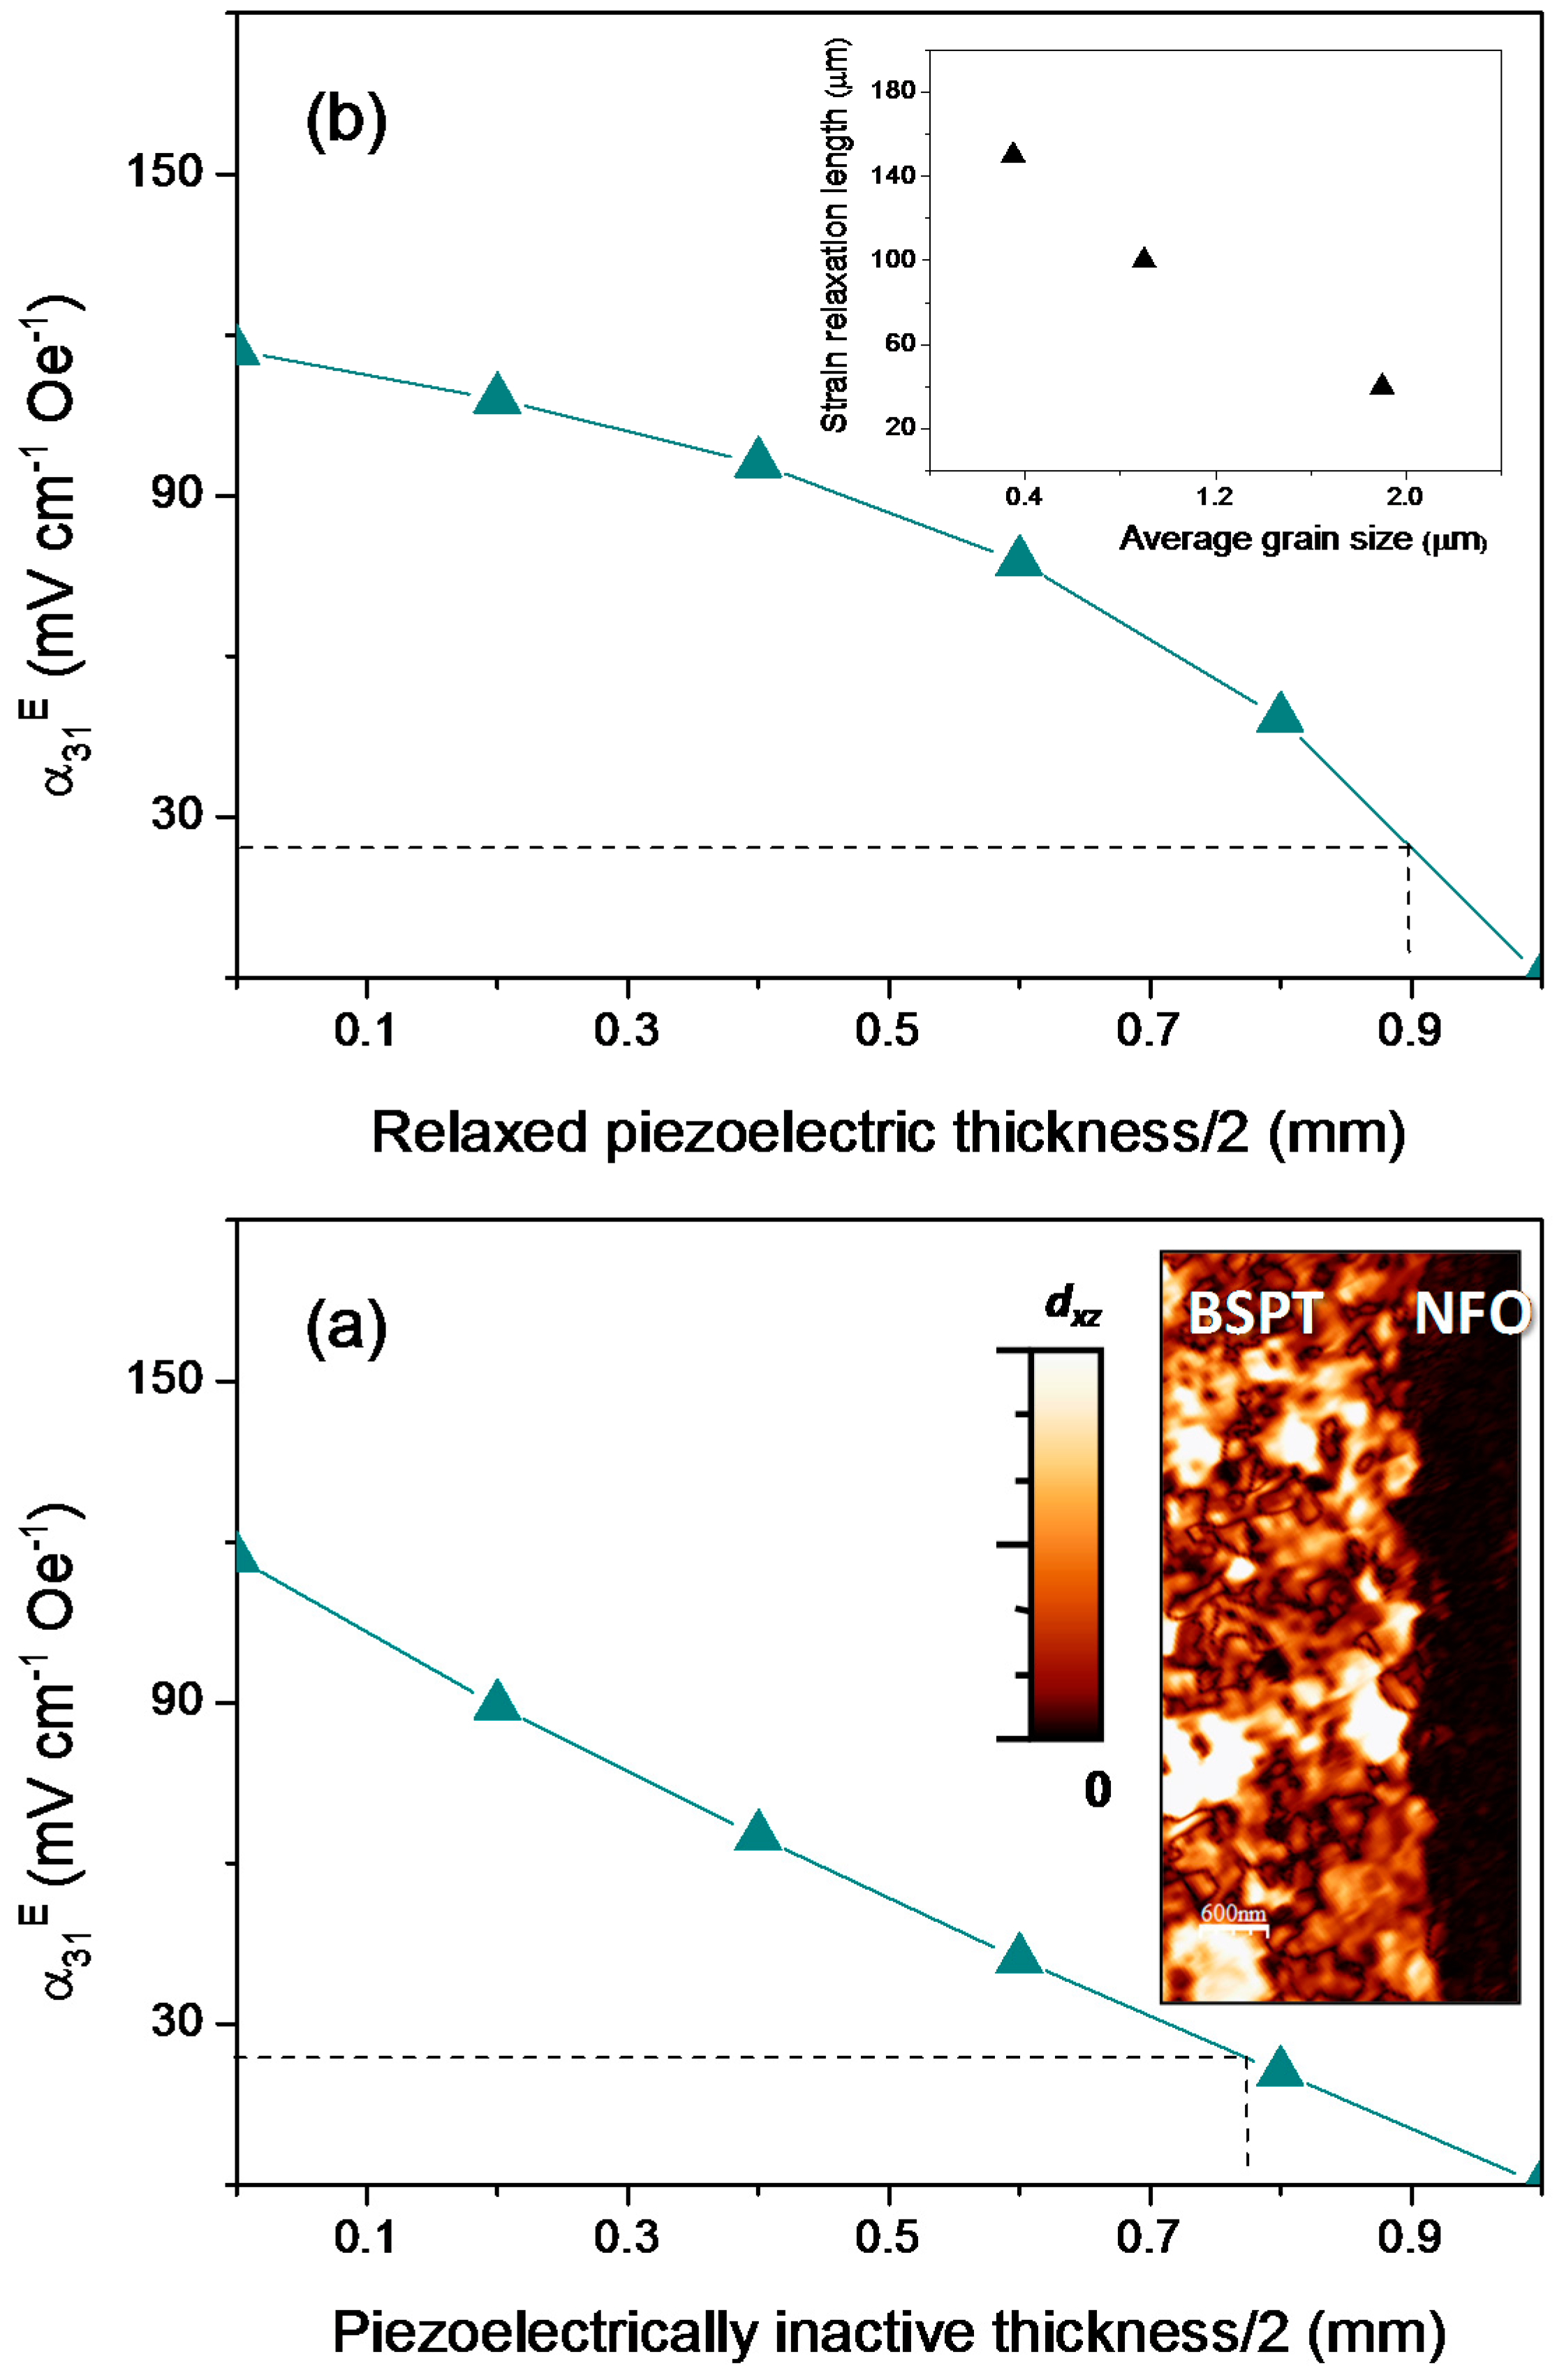
Figure 6.
Magnetoelectric coefficient α31E resulting from simulation of 15 mm long, (a) multilayer structures with a layer thickness of 50 μm, starting from a Bi0.36Pb0.64Sc0.36Ti0.64O3/NiFe2O4/Bi0.36Pb0.64Sc0.36Ti0.64O3 three-layer structure to which bilayers are successively added (results corresponding to the simultaneous increase of length to maintain aspect ratio constant are also given); and (b) nine-layer structures of decreasing piezoelectric coefficients as a result of poor poling. The experimental value for an analogous composite disc is included in (b).


Table 1.
Material coefficients for NiFe2O4 spark plasma sintered at decreasing temperatures: density ρ, elastic compliances sij, magnetic permeability μ11, maximum piezomagnetic coefficient q111Max (the magnetization field for maximum response is also indicated), dielectric permittivity ε11 and conductivity σ.
| Temperature (°C) | ρ (g·cm−3) | s11 (m2·N−1) | s12 (m2·N−1) | μ11 (xμo) | q111Max (Oe−1) | ε11 (xεo) | σ (Ω−1·m−1) |
|---|---|---|---|---|---|---|---|
| 1000 | 5.4 | 6.5 × 10⁻¹² | −2.4 × 10⁻¹² | 3 | 90.5 × 10⁻¹¹ @ 188 Oe | 10 | 0.1 |
| 900 | 5.4 | 6.5 × 10⁻¹² | −2.4 × 10⁻¹² | 3 | 46.8 × 10⁻¹¹ @ 281 Oe | 10 | 0.1 |
| 800 | 5.4 | 6.5 × 10⁻¹² | −2.4 × 10⁻¹² | 3 | 16.4 × 10⁻¹¹ @ 420 Oe | 10 | 0.1 |
Table 2.
Material coefficients for Bi0.36Pb0.64Sc0.36Ti0.64O3 spark plasma sintered at decreasing temperatures: density ρ, elastic compliances sijE, and magnetic permeability μ11.
Table 2.
Material coefficients for Bi0.36Pb0.64Sc0.36Ti0.64O3 spark plasma sintered at decreasing temperatures: density ρ, elastic compliances sijE, and magnetic permeability μ11.
| Temperature (°C) | ρ (g·cm−3) | s11E (m2·N−1) | s33E (m2·N−1) | s12E (m2·N−1) | s13E (m2·N−1) | s55E (m2·N−1) | μ11 (xμo) |
|---|---|---|---|---|---|---|---|
| 1000 | 7.7 | 13.8 × 10⁻¹² | 23.4 × 10⁻¹² | −3.6 × 10⁻¹² | −8.3 × 10⁻¹² | 46.6 × 10⁻¹² | 1 |
| 900 | 7.7 | 13.8 × 10⁻¹² | 23.4 × 10⁻¹² | −3.6 × 10⁻¹² | −8.3 × 10⁻¹² | 46.6 × 10⁻¹² | 1 |
| 800 | 7.7 | 13.8 × 10⁻¹² | 23.4 × 10⁻¹² | −3.6 × 10⁻¹² | −8.3 × 10⁻¹² | 46.6 × 10⁻¹² | 1 |
Table 3.
Material coefficients for Bi0.36Pb0.64Sc0.36Ti0.64O3 spark plasma sintered at decreasing temperatures: piezoelectric coefficients dij, dielectric permittivities εijσ and conductivity σ.
Table 3.
Material coefficients for Bi0.36Pb0.64Sc0.36Ti0.64O3 spark plasma sintered at decreasing temperatures: piezoelectric coefficients dij, dielectric permittivities εijσ and conductivity σ.
| Temperature (°C) | d33 (pC·N−1) | d31 (pC·N−1) | d15 (pC·N−1) | ε33σ (xεo) | ε11σ (xεo) | σ (Ω−1·m−1) |
|---|---|---|---|---|---|---|
| 1000 | 440 | −144 | 634 | 1493 | 1586 | 1 × 10⁻¹⁰ |
| 900 | 400 | −131 | 576 | 1493 | 1586 | 1 × 10⁻¹⁰ |
| 800 | 285 | −93 | 411 | 1493 | 1596 | 1 × 10⁻¹⁰ |
© 2017 by the authors. Licensee MDPI, Basel, Switzerland. This article is an open access article distributed under the terms and conditions of the Creative Commons Attribution (CC BY) license (http://creativecommons.org/licenses/by/4.0/).
Share and Cite
MDPI and ACS Style
Ramos, P.; Amorin, H.; Ricote, J.; Castro, A.; Alguero, M. Insights into the Performance of Magnetoelectric Ceramic Layered Composites. J. Compos. Sci. 2017, 1, 14. https://doi.org/10.3390/jcs1020014
AMA Style
Ramos P, Amorin H, Ricote J, Castro A, Alguero M. Insights into the Performance of Magnetoelectric Ceramic Layered Composites. Journal of Composites Science. 2017; 1(2):14. https://doi.org/10.3390/jcs1020014
Chicago/Turabian StyleRamos, Pablo, Harvey Amorin, Jesus Ricote, Alicia Castro, and Miguel Alguero. 2017. "Insights into the Performance of Magnetoelectric Ceramic Layered Composites" Journal of Composites Science 1, no. 2: 14. https://doi.org/10.3390/jcs1020014