Tuning Electrical and Thermal Properties in Epoxy/Glass Composites by Graphene-Based Interphase


1
Department of Industrial Engineering, University of Trento, via Sommarive, 9-38123 Trento, Italy
2
Unit for Material Technology, University of Innsbruck, Technikerstraβe 13, 6020 Innsbruck, Austria
3
Christian Doppler Laboratory for Cement and Concrete Technology, Technikerstraße 13, 6020 Innsbruck, Austria
*
Author to whom correspondence should be addressed.
J. Compos. Sci. 2017, 1(2), 12; https://doi.org/10.3390/jcs1020012
Submission received: 3 October 2017
/
Revised: 21 October 2017
/
Accepted: 25 October 2017
/
Published: 28 October 2017
Abstract
:Multiscale epoxy/glass composites were fabricated by using E-glass fibers (GF) coated with different types of graphene nanosheets deposited by electrophoretic deposition. Graphene oxide (GO) was first synthesized using modified Hummer’s method and its subsequent ultrasonication in de-ionized water created a stable suspension of GO. GF were immersed in the water/GO suspension near a copper anode. The electrical potential applied between the electrodes caused GO to migrate towards the anode. Moreover, the GO coated yarns were exposed to hydrazine hydrate at 100 °C to obtain reduced graphene oxide (rGO) coated yarns. Both GO and rGO coated GF yarns were used to create unidirectional epoxy-based multiscale composites by hand lay-up. The presence of a conductive rGO coating on GF improved both the electrical and thermal conductivities of composites. Moreover, enhanced permittivity was obtained by rGO based epoxy/glass composites, thus giving the option of using such structures for electromagnetic interference shielding.

1. Introduction
Due to their excellent mechanical properties and thermal and chemical stability, fiber reinforced polymer composites play an important role for high-end applications in various industrial sectors. Due to their prominent tensile mechanical properties and relatively low cost as compared to carbon fibers, E-glass fibers (GF) are often used to reinforce polymer matrices [1,2,3]. However, such composites have limitations for some applications due to a higher density and low electrical and thermal conductivities.
Graphene has been in the spotlight of research since its discovery [4]. In fact, the extraordinary properties of this two-dimensional (2D) material, such as remarkably high electron mobility at room temperature (250,000 cm2/V), high thermal conductivity (5000 Wm−1·K−1), and mechanical stiffness and strength (Young’s modulus = 1 TPa, strength 130 GPa) [5,6,7], make it an ideal candidate for the preparation of nanocomposites. Previous studies have confirmed that the dispersion of graphene in polymeric matrices resulted in not only improving mechanical properties [8], but also providing functional properties like electrical conductivity [9,10,11], thermal conductivity [12], dielectric properties [13,14,15], and electromagnetic interference shielding [15,16,17]. Moreover, recent studies have also indicated that an optimized amount of graphene nanoparticles dispersed in the polymer matrix can play a positive role in enhancing the fiber/matrix interfacial adhesion between both thermoplastic and thermosetting polymer matrices and glass fibers [18,19,20].
A substantial improvement of the properties of composites has been obtained by a very low nanofiller content, which has been attributed to the large surface area of the nanofiller and also to their high aspect ratio. Currently, the scale up to industrially relevant processes of improvement in polymer properties by nanofillers dispersion is still a big challenge since (i) achieving uniform dispersion of nanofiller in polymers is not easy; (ii) an adequate interfacial adhesion between matrix and nanofiller is a big challenge and most importantly; and, (iii) alignment of nanofillers cannot be achieved easily [21]. Both computational simulations and theoretical modelling have revealed significant advantages that could be realized by nano-scale fillers oriented in polymer matrices. Much work has been conducted to develop methods for aligning carbon nanofillers in polymer matrices. Looking mainly on carbon nanotubes (CNTs) and graphene nanosheets, remarkable improvements in mechanical and functional properties have been reported as compared to randomly-dispersed nanofillers. Various methods have been proposed to align fillers in polymer matrices like mechanical shearing [22], manufacturing under applied electric [23,24,25], and magnetic fields [25,26,27]. Alignment of nanofillers in an electrical field is considered as an effective method but the restraint of this technique is that it can only be applied to materials with very low electrical conductivity, since the field strength is usually restricted to avoid the dielectric breakdown of the polymer [28]. On the other hand, low magnetic susceptibility of fillers means that strong magnetic field (25 T or more) is required to align nanofillers like CNT and graphene, thus restricting the practical application of such methods [28]. Simultaneous dispersion and alignment can be obtained by using mixing equipment able to apply high shear forces. Unfortunately, these forces are often not large enough to break the nanofiller aggregates and disperse the nanofillers in the polymer matrix. Instead, high shear has the drawback to degrade both polymers and nanofillers [29].
The aim of this work is hence to create new multifunctional epoxy/glass hierarchical composites containing GO and rGO nanosheets. In particular, a method of utilizing GO and rGO is proposed in which electrophoretic deposition (EPD) technique is used to deposit GO nanosheets on E-glass fibers (GF); while, for rGO, the same GO coated GF were subjected to a thermochemical reduction process, hence yielding rGO coated GF. The mechanical properties of the composites obtained by using both GO and rGO coated GF fibers aligned in an epoxy matrix were extensively investigated in our previous works both from the micromechanical [30] and macromechanical [31] points of view. The peculiar electrical (resistivity and permittivity) and thermal (stability and conductivity) behaviour induced in the epoxy/glass composites by the presence of GO/rGO interphases are experimentally investigated in this manuscript.
2. Materials and Methods
Graphite powder, potassium permanganate, sodium nitrate, sulfuric acid, and hydrogen peroxide were purchased from Sigma Aldrich (St. Louis, MO, USA) while hydrochloric acid was from Codec Chemical Co. Ltd. (Tokyo, Japan). All of the chemicals were of analytical grade and used without further purification. A bi-component epoxy resin, provided by Elantas Italia S.r.l. (Collecchio, Italy), consisting of an epoxy base (EC 252) and an aminic hardner (W 241), was selected as polymer matrix. E-glass fibers, with the trade name XG 2089, were kindly supplied by PPG Fiber Glass© (Pittsburgh, PA, USA), and were used as received. The fibers, with an average fiber diameter was 16.0 ± 0.1 μm, were supplied with an epoxy compatible silane-based sizing.
GO was synthesized according to a modified Hummer’s method. In particular, 1 g of graphite powder was mixed in 46 mL of H2SO4 cooled in an ice bath, followed by the addition of 1 g of NaNO3 and the mixture was stirred for 15 min. In the next step, 6 g of KMnO4 were gradually added, while keeping the temperature of the mixture under 20 °C in order to avoid exothermic reactions. The mixture was stirred for at least 24 h at 35 °C. Then, a surplus of deionized water was added while the temperature was kept between 60 °C and 80 °C. At the end, a solution of 30% H2O2 with deionized water was added to the mixture to stop the reaction. The resulting suspension was thoroughly washed using an HCl solution and distilled water to remove Mn ions and acid respectively. The obtained brown solution was dried in a vacuum oven at 50 °C for at least 36 h. The brown cake obtained was then used to create GO suspension (1 mg/mL) by adding a quantity of it in deionized water and subjecting it to ultrasonication to create a stable suspension.
A schematic description of the EPD process used to deposit GO nanosheets on GFs is illustrated in Figure 1. The electrodes were copper sheets of 1 mm thickness and GF were placed in front of an electrode using a metallic window. This approach is needed due to the non-conducting nature of GF. Therefore, in order to deposit the nanoparticles on the GF, the anode was placed behind the fibers during the deposition process. The electrodes along with a metallic frame holding GF bundles were immersed in a GO dispersion in deionized water with a concentration of 1 mg/mL. When voltage is applied between the electrodes, GO nanosheets move toward the anode, hit GFs and deposit on their surface. The deposition on one side of the fibers was carried out at 10 V/cm for 5 min, and the same was repeated while reversing the metallic frame to expose the uncoated portion towards cathode while coated side of the fibers towards the anode. After the whole coating process, the fibers were dried under vacuum at 50 °C for at least 12 h.
Fibers coated were placed in a glass container and the reduction of the GO coating was carried out by placing a tissue paper soaked with hydrazine hydrate (N2H4) in the container. The container was covered and then heated at 100 °C for 24 h.
Composites were produced by a conventional hand lay-up method. Uncoated GF, GO coated GF, and rGO coated GF bundles were wetted with the uncured epoxy resin by using a roller and stacked in a metal mold. After laminating a number of laminas enough to reach the desired laminate thickness (which in turns depends on the type of test performed), a constant pressure of approximately 1 kPa was applied on the mold, and curing was performed by pre-curing at room temperature for at least 3 h and then for 15 h at 60 °C. The obtained composites were termed as Ep-GF, Ep-GO-GF, and EprGO-GF, respectively.
X-ray diffraction (XRD) measurements were performed with a X-ray diffractometer (Rigaku III Dmax, Tokyo, Japan) with a monochromatic radiation source (Cu-Kα, wavelength around 51.54056 Å). The measurements were carried out in a 2θ range of 5°–80° with a step size of 0.04°.
Field emission scanning electron microscopy (FESEM) microscopic observations were performed by a Zeiss Supra 40 microscope (Carl Zeiss AG, Oberkochen, Germany). Before observations, the specimens were coated by a platinum/palladium alloy (80:20) layer of about 5 nm in thickness.
The cross-section of multiscale composites was observed by optical microscopy technique (using a Zeiss Axiophot optical microscope (Carl Zeiss AG, Oberkochen, Germany), connected to a Leica DC300 digital camera (Leica microsystems, Wetzlar, Germany) and by FESEM. The specimens were prepared by polishing the cross-sectional surface using abrasive grinding papers with grit size 800, 1200, and 4000, sequentially.
Two different resistivity measurement methods were utilized based on the electrical behavior of the fabricated composite materials. For specimens having resistivity levels more than 106 Ω·cm, the electrical resistivity was evaluated using a Keithley 8009 resistivity test chamber connected to a Keithley 6517A high-resistance meter. However, for more conductive samples, a 6-1/2-digit electrometer/high resistance system (Keithley model 6517A) was used and a 2-points electrical measurement was chosen as test configuration. Electrical resistivity was measured along three orthogonal directions as defined in Figure 2.
The measurement of relative permittivity and dielectric loss of the composites (uncoated and graphene reinforced composites) were performed by an Agilent 4284A impedance analyzer (Agilent Technologies, Santa Clara, CA, USA) in the frequency range from 20 up to 106 Hz. The dimensions of the specimens were around 10 mm × 10 mm × 1.5 mm, and an aluminum foil was used as conductive electrode plate placed on the top and below of the specimen to create the parallel plate testing configuration.
The thermal stability of the multiscale composites were investigated using thermogravimetric analysis (TGA) using a Mettler TG50 thermobalance (Mettler-Toledo, Columbus, OH, USA). Around 40 mg of the specimens were selected of epoxy and composites, respectively. The tests were conducted between 25 °C and 700 °C using a heating rate of 10 °C where the onset temperature (associated to a mass loss of 5%) and the residual mass at 700 °C were determined. The maximum degradation temperature was evaluated from the main peak of mass loss rate curves.
Thermal conductivity measurements were hence performed by a Netzsch Laser Flash Analysis LFA 447 (Netzch, Selb, Germany). It consists of exposing an energy pulse from a light source (laser or xenon flash lamp) on one side of a specimen (10 mm × 10 mm × 2 mm) [32] and measuring the temperature history on the other side using a liquid nitrogen cooled infrared detector. The thermal conductivity of the specimens was measured along three orthogonal directions (x-axis, y-axis and z-axis of Figure 2) and at three different temperatures i.e., 25 °C, 50 °C and 75 °C by performing three shots, respectively. The data were analyzed using the software Proteus (Netzch, Selb, Germany) whereas Cowan method was used to calculate thermal diffusivity (α) with pulse correction. A standard Pyrex 7740 reference material prepared according to ASTM-E 1461 was used to determine the heat capacity (cp) and then was matched with the samples. Sample density (ρ) was determined by measuring the mass and volume of the specimen. Finally, the thermal conductivity (λ) was calculated using the following equation:
λ = α × ρ × cp
3. Results and Discussion
3.1. Graphene Oxide Synthesis and Its Reduction
Figure 3 shows the characterization results of synthesized graphene nanosheets. The X-ray diffractograms of precursor graphite, synthesized GO and rGO products are exhibited in Figure 3a, where graphite exhibits an intense peak (0 0 2) at 26.4° which is typical of the crystalline nature of graphite powder. During the chemical reaction, the oxidation process of graphite powder causes a replacement of the (0 0 2) peak with a (0 0 1) diffraction peak of GO. This is due to the insertion of oxygen based functional groups in GO and water molecules, which increases the interlayer spacing in the graphite layers including water molecules [33]. On the other hand, the rGO diffractogram reveals a peak relocated back to the position of pristine graphite peak due to the removal of most of the oxygen groups of GO, thus decreasing the interlayer spacing. It is interesting to note that both GO and rGO peaks are broader and less intense hence confirming the exfoliation process.
Figure 3b,c shows the exfoliation of GO sheets as observed from FESEM analysis. GO nanosheets were several micrometers large in lateral size but with different layered thickness. In addition, the characteristic wrinkling of nanosheets can be observed as commonly encountered in thin films and membranes.
3.2. Electrophoretic Deposition of GO and Composite Fabrication
Figure 4a shows the GF pasted on a metallic frames, whereas Figure 4b shows the GF that was obtained after the EPD of GO nanosheets. The slight color change of GF from white to beige suggests the coating of GO on GF. In order to reduce the GO coating on GF laminate obtained in previous step, the same was subjected to thermochemical reduction, the resultant fibers appeared to be dark grey in color which visually confirms the reduction of GO coating to rGO (Figure 4c).
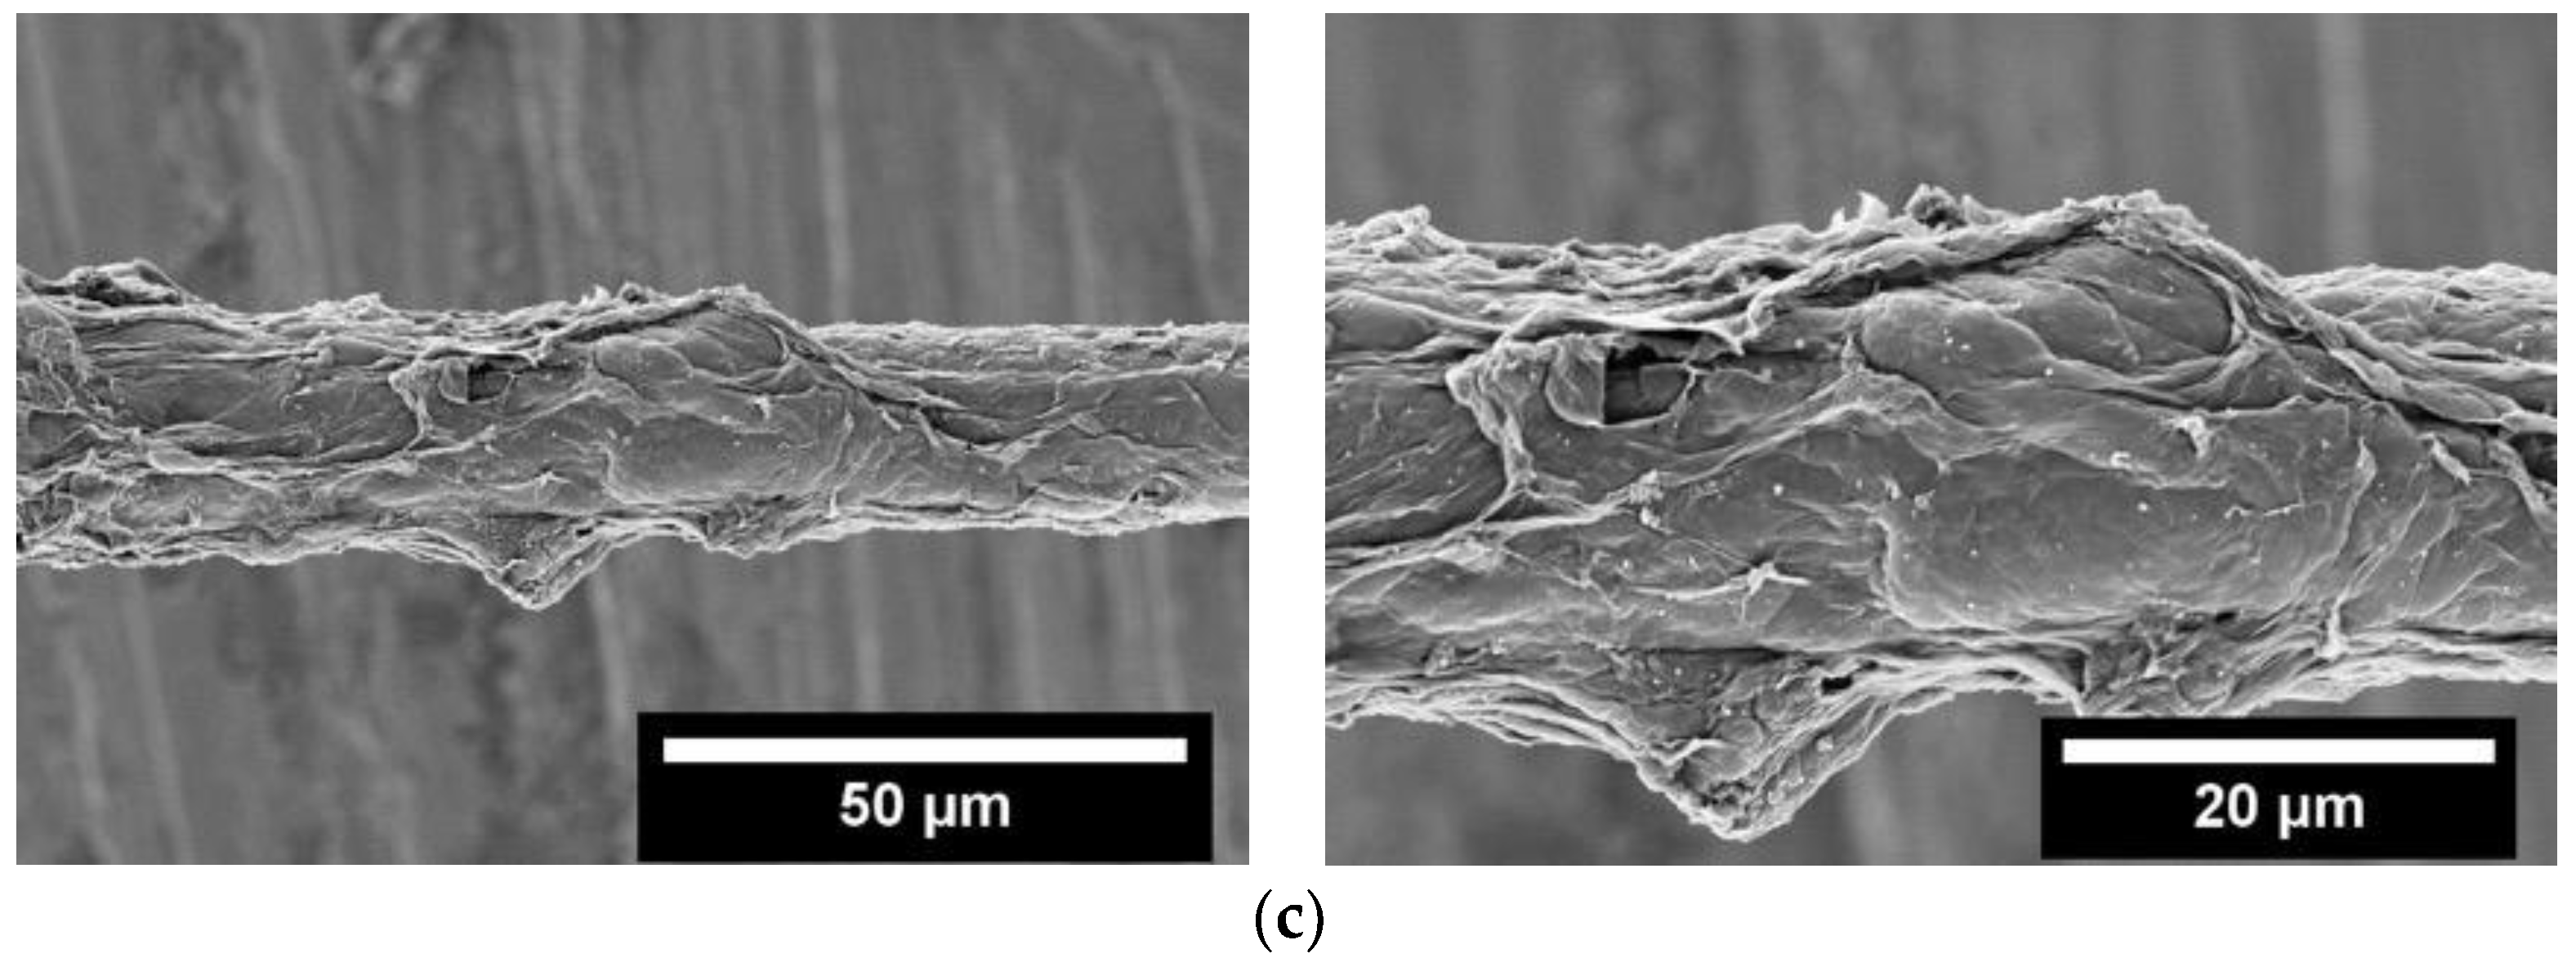
The appearance of the electrophoretically deposited GO and rGO coatings on GF can be visualized with FESEM observations. In Figure 5, a comparison of the FESEM pictures of uncoated, GO and rGO coated GF surfaces is presented. The coating of both GO and rGO appears to be quite compact and uniform in thickness for a certain length.
The quantitative analysis of the depositions of GO and rGO interphase was evaluated, in which the fibers before and after deposition were weighed. Four fiber laminates (100 mm × 100 mm) were weighed first and then the deposition of GO was carried out as described in this work previously. After drying of the fibers under vacuum at 50 °C, the fibers were again weighed to find the difference of the weight due to deposition. Afterwards, epoxy resin was infused and cured, and the final weight of the composite was measured. By taking the ratio of deposition and composite weight, the GO deposition weight content in Ep-GO-GF composites was calculated to be around 0.31% ± 0.03% over the total weight of the composite. However, to evaluate the deposition content of rGO in the composite, the GO coated fibers were weighed first and were then subjected to reduction process. rGO weight was evaluated with respect to the percentage decrease in weight from GO due to reduction which was 0.11%, hence the final weight content of rGO in Ep-rGO-GF was practically the same.
The fiber volume fraction of the composites was determined quantitatively by considering the weight of the fibers before composite fabrication and then measuring the weight of the whole composite after curing. The weight of the matrix was then calculated by subtracting the weight of the composite by the weight of the fiber and by considering the densities of the fiber and the matrix, the volume of fiber used and volume of the composite was calculated. In this way, the fiber volume fraction of the composite was estimated to be around 50% by volume.
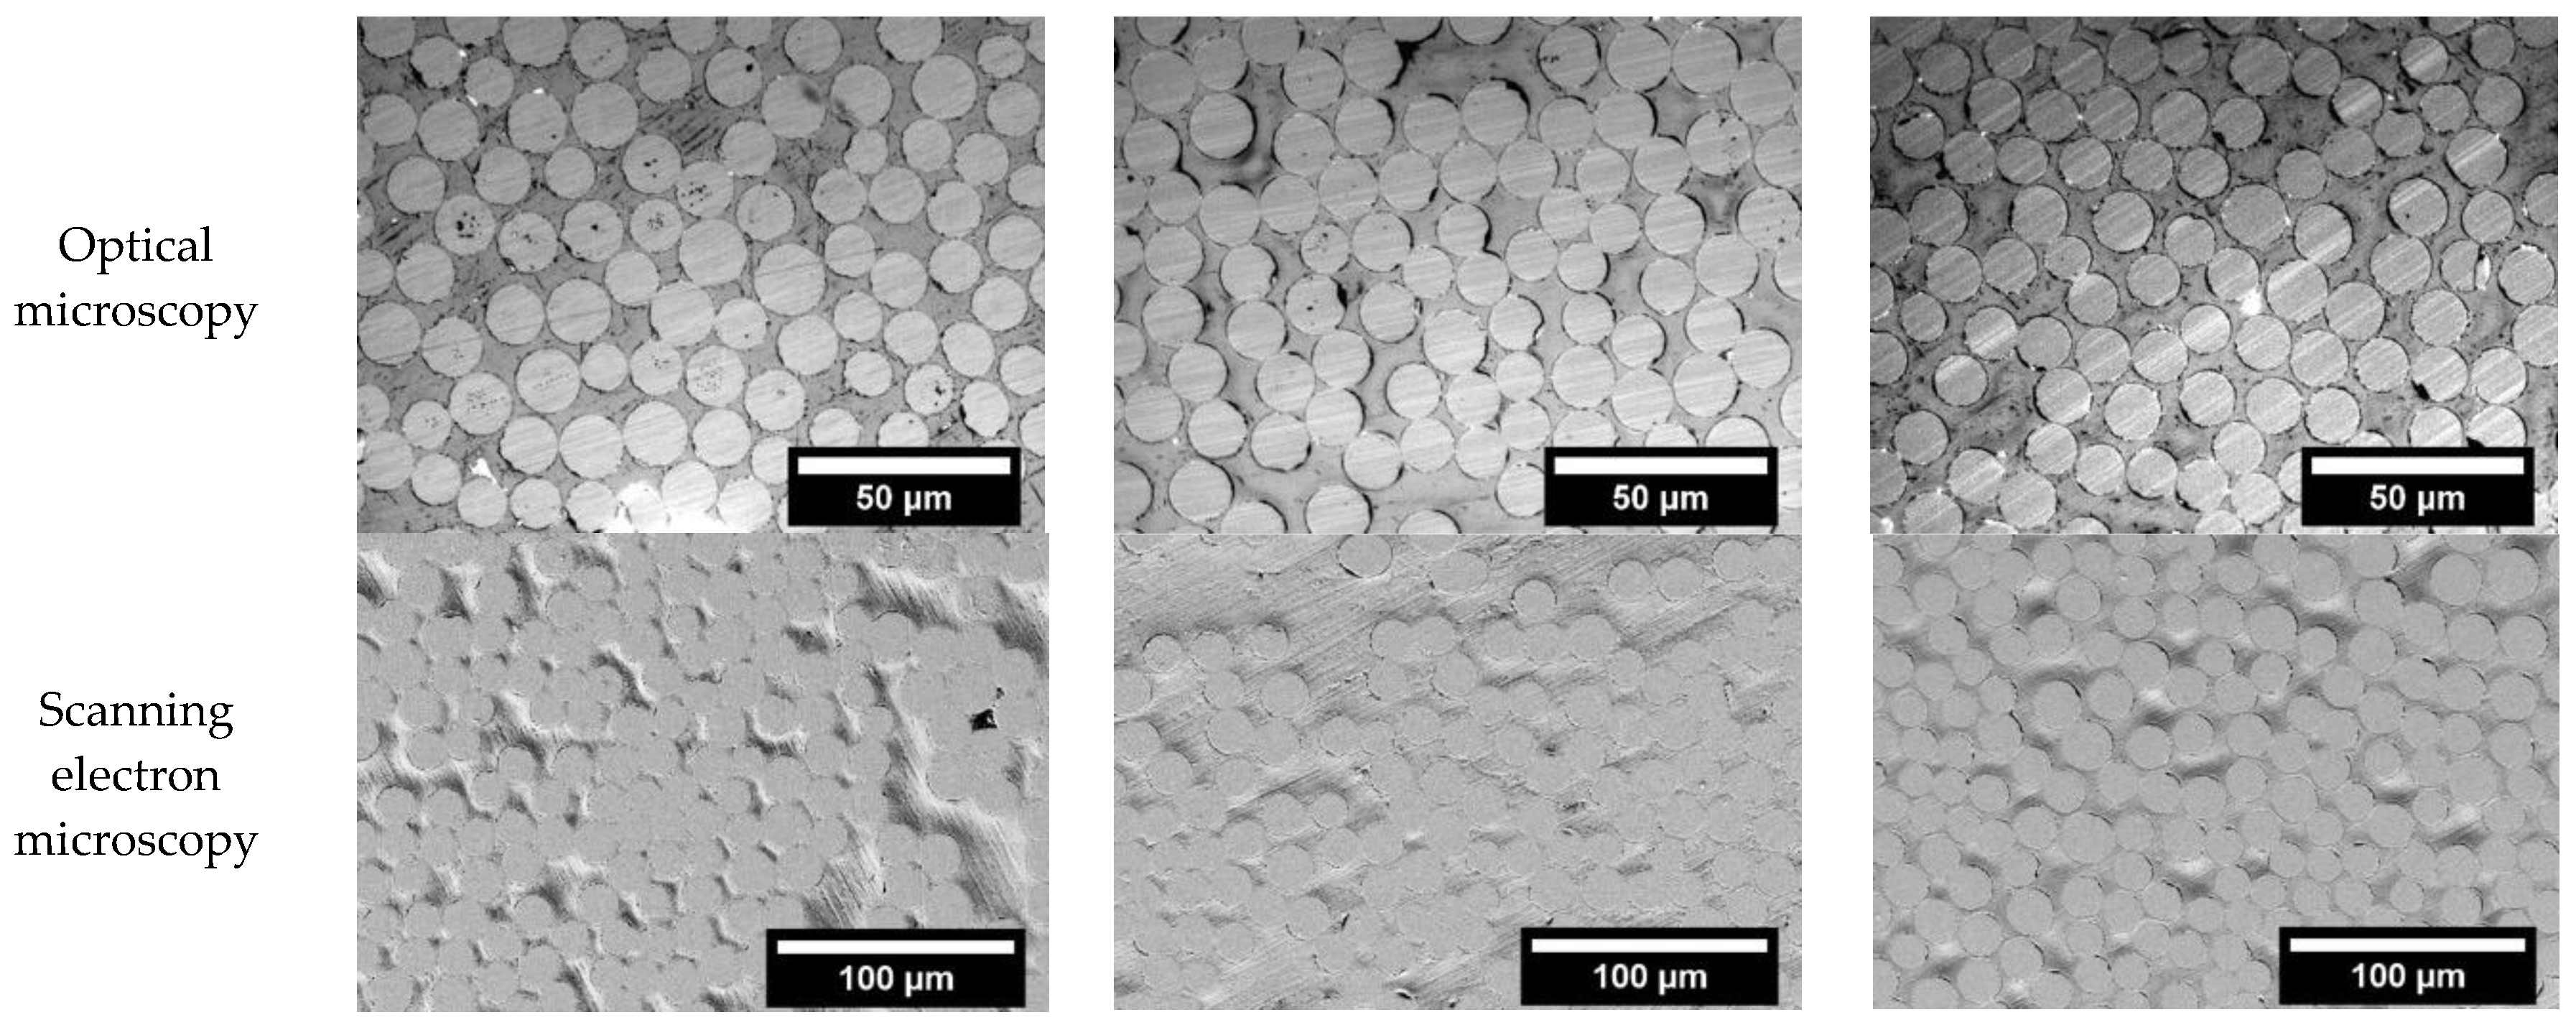
The cross-sectional views of the composites observed through OM and FESEM are shown in Figure 6. The images reveal a highly compact fiber arrangement embedded in epoxy matrix along with some resin rich areas and voids which is typical of composites fabricated by hand lay-up method.
Optical microscopy
Scanning electron microscopy
Scanning electron microscopy (High magnifcation)
Ep-GF
Ep-GO-GF
Ep-rGO-GF
3.3. Electrical Resistivity
The effect of GO and rGO coatings on the volume electrical resistivity values along the x axis of the glass-epoxy composites is summarized in Table 1. As expected, the electrical resistivity of epoxy-glass composites is not modified by the presence of insulating GO coating. On the other hand, the presence of a rGO coating on the glass fibers lead to a drop of the electrical resistivity by 12 orders of magnitude thus yielding an electrical conductive behaviour.
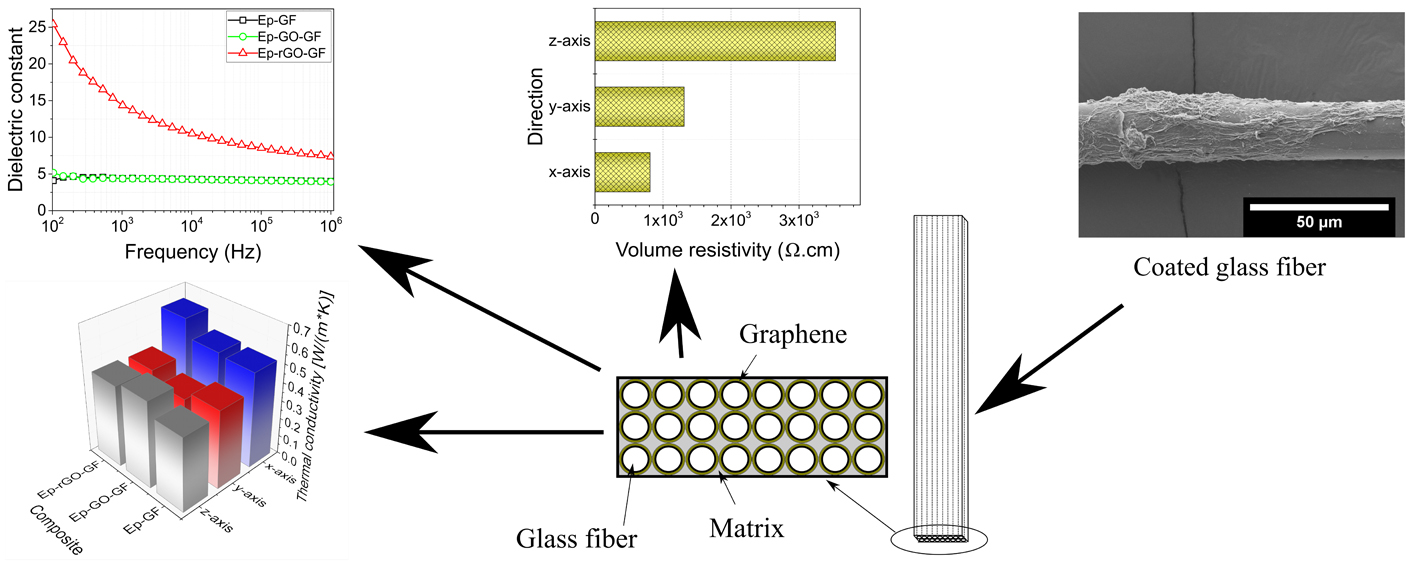
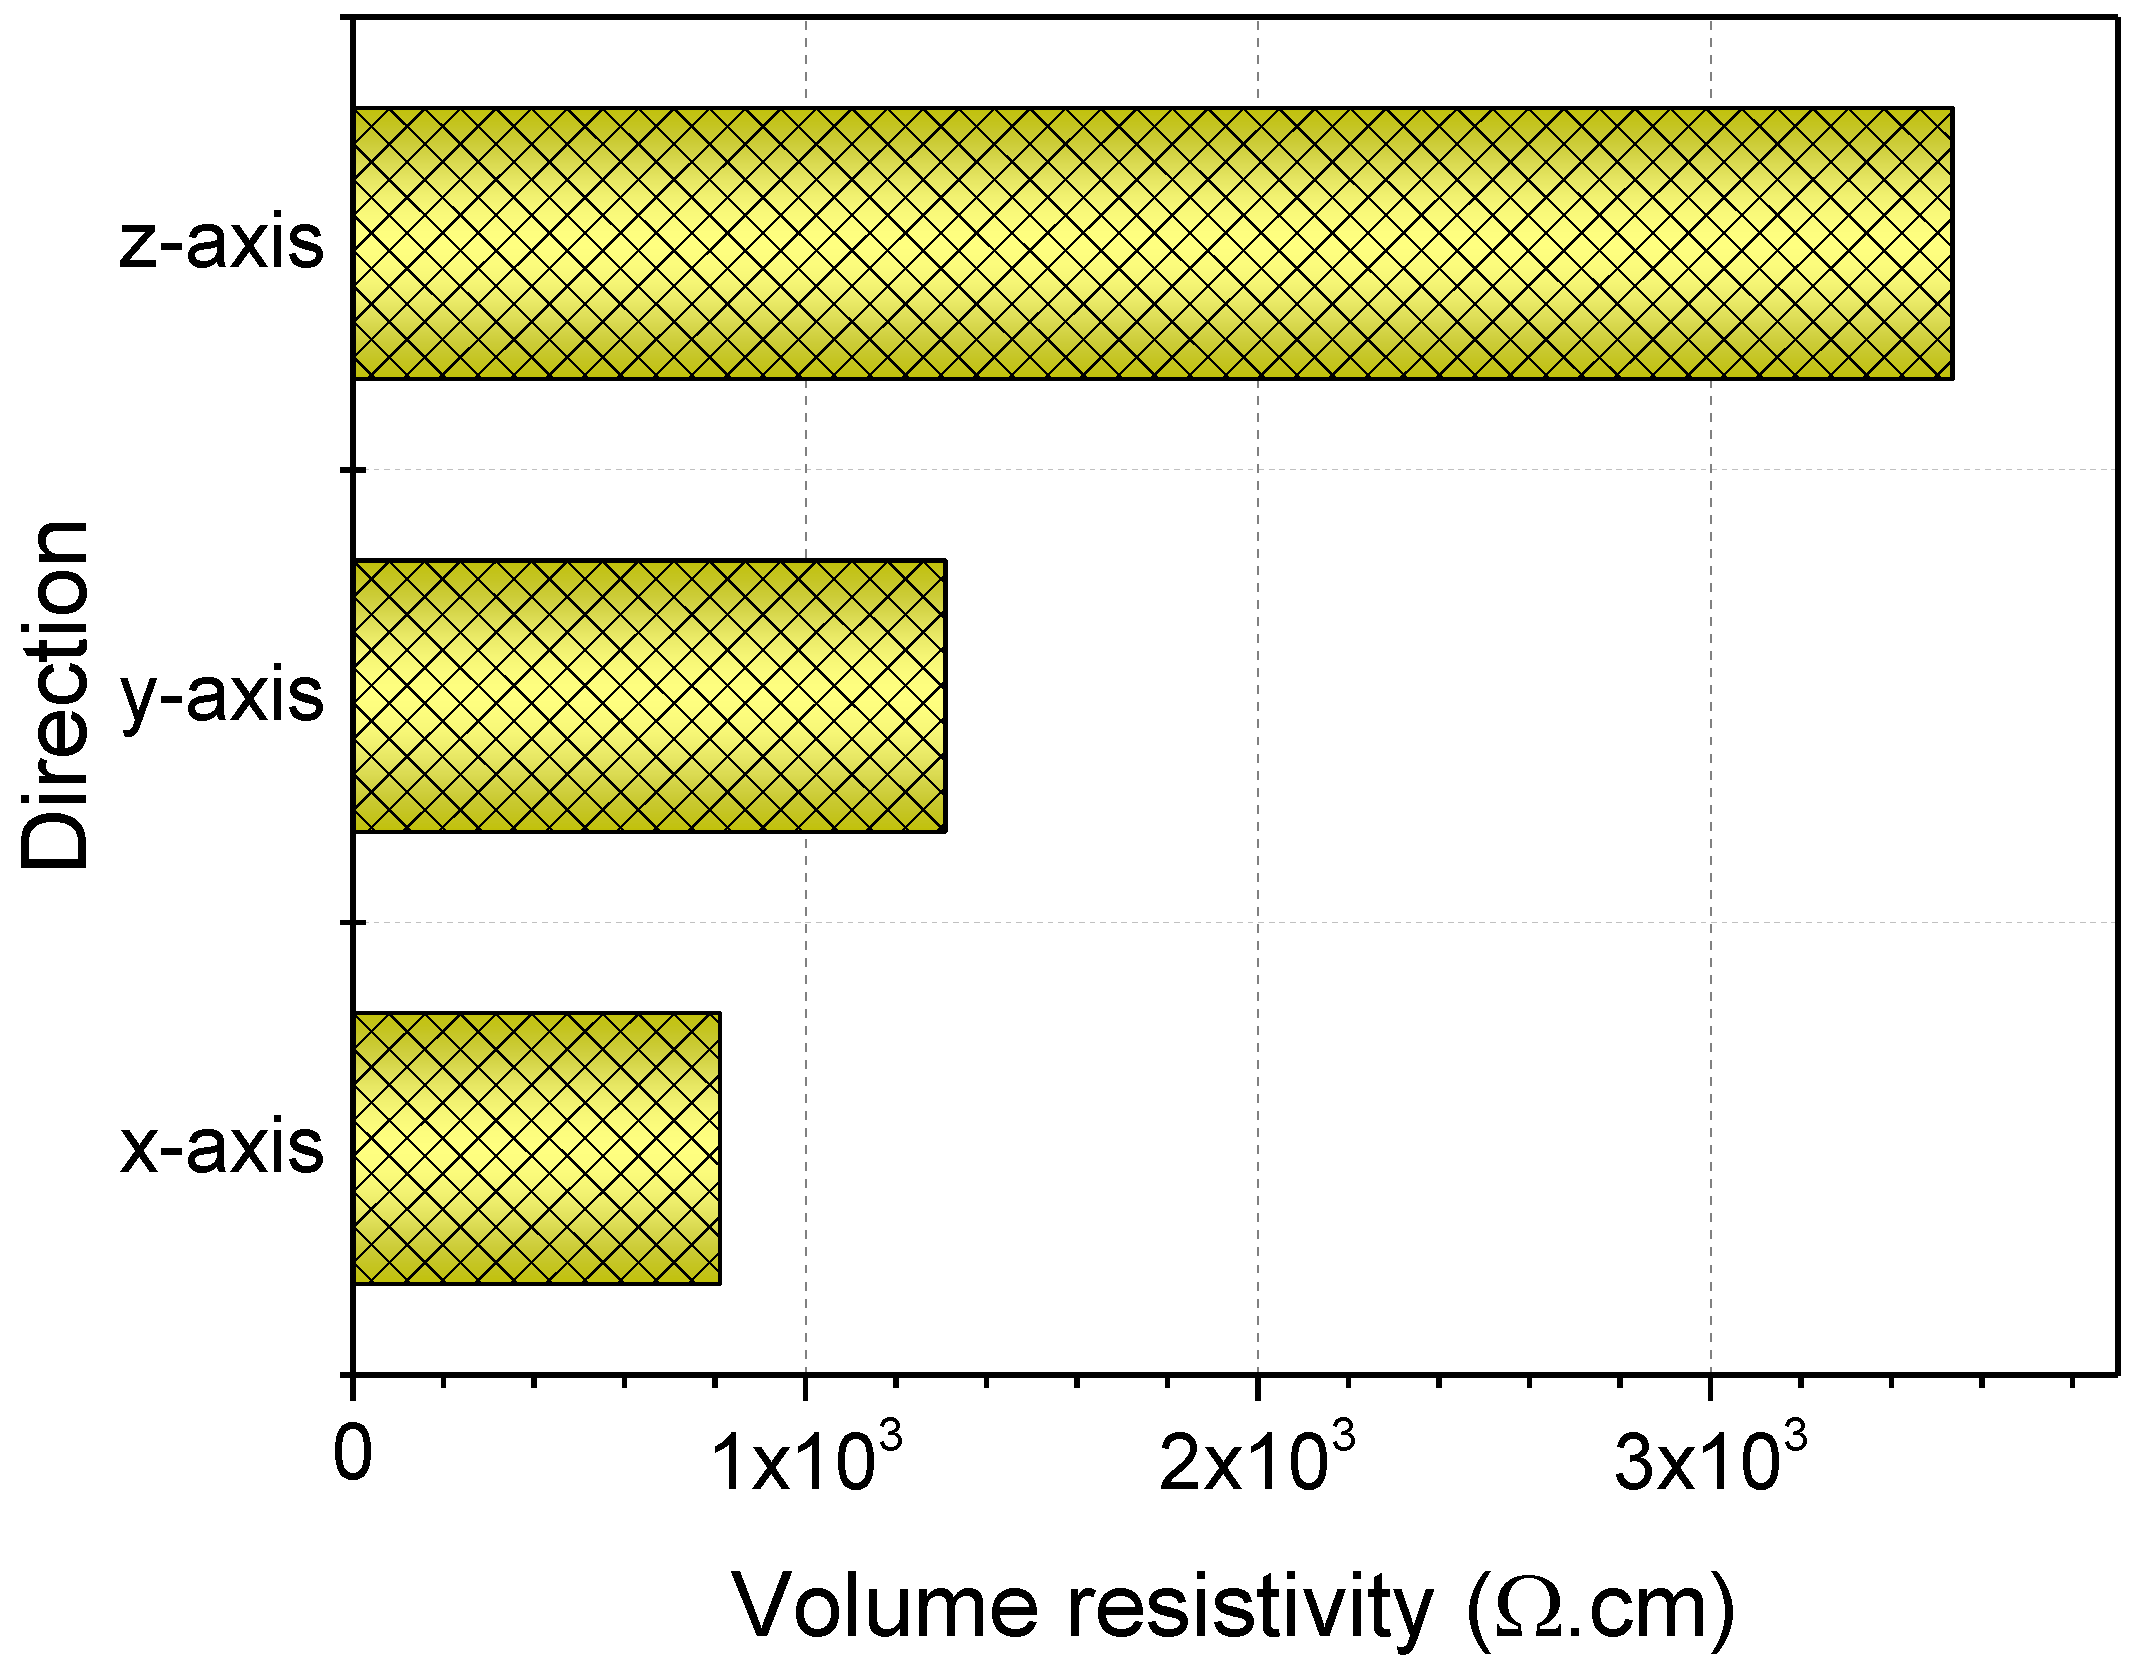
In order to investigate the effect of having a continuous rGO interphase oriented along the fibers direction, the electrical resistivity of the composites was tested along three mutually orthogonal directions i.e., x-axis, y-axis and z-axis. In Figure 7, the volume resistivity values along the three directions of rGO coated composite are compared. The composites showed a very low resistivity along the x-axis which contains the continuous path for electrons to travel through the structure. On the other hand, the y-axis and z-axis showed a higher resistivity because of the alternating conductive (graphene) and non-conductive (epoxy) layers. Between these, y-axis had less resistivity as compared to z-axis as the load was applied on this direction during the composite manufacturing hence compressing the fibers and providing better tunneling effect or possibly direct contact between the fibers.
3.4. Dielectric Properties
As a control test, the permittivity of uncoated fiber composite was measured at room temperature. As it can be seen in Figure 8a, the permittivity level did not change as the applied frequency increased, which is in accordance with the behavior commonly observed for insulating materials such as epoxy and GF [34]. Due to the insulating nature of GO, coating of GF with GO did not provide any capacitive properties to Ep-GO-GF composite. In the case of rGO coated fibers, however, the composite showed an improvement over the entire frequency range. At 100 Hz, the permittivity value increased by a factor of 3.6 when compared to the value measured on the composite with uncoated fibers. The induction of permittivity in glass/epoxy composites was due to the presence of rGO interphase, which possesses a higher electrical conductive. A similar trend was also obtained in the case of dissipation factor of the composites, while being tested for their capacitive properties, as shown in Figure 8b.
3.5. Thermal Stability
Figure 9 shows the TGA curves of the composites containing uncoated, GO and rGO coated fibers, and a summary of the obtained results is given in Table 2. The thermal stability of epoxy/glass fiber composites increases for both GO and rGO coated glass fibers where rGO interphase impart a better thermal stability (onset temperature for thermal degradation of 354.4 °C) as compared to composites containing GO interphase (340.3 °C). In the case of composites containing GO coated fibers, the relatively low thermal stability could be attributed to the decomposition of the oxygen functional moieties such as epoxy and hydroxyl which takes place around 250 °C. However, composites containing rGO coated fibers offer better thermal stability than others due to difficult path effect of graphene nanosheets (non-oxidized) which delays the escape of volatile degradation products thus favoring the char formation process. Similar trend was also observed in the residual mass of the composites at 700 °C after the test, which supports the above results.
3.6. Thermal Conductivity
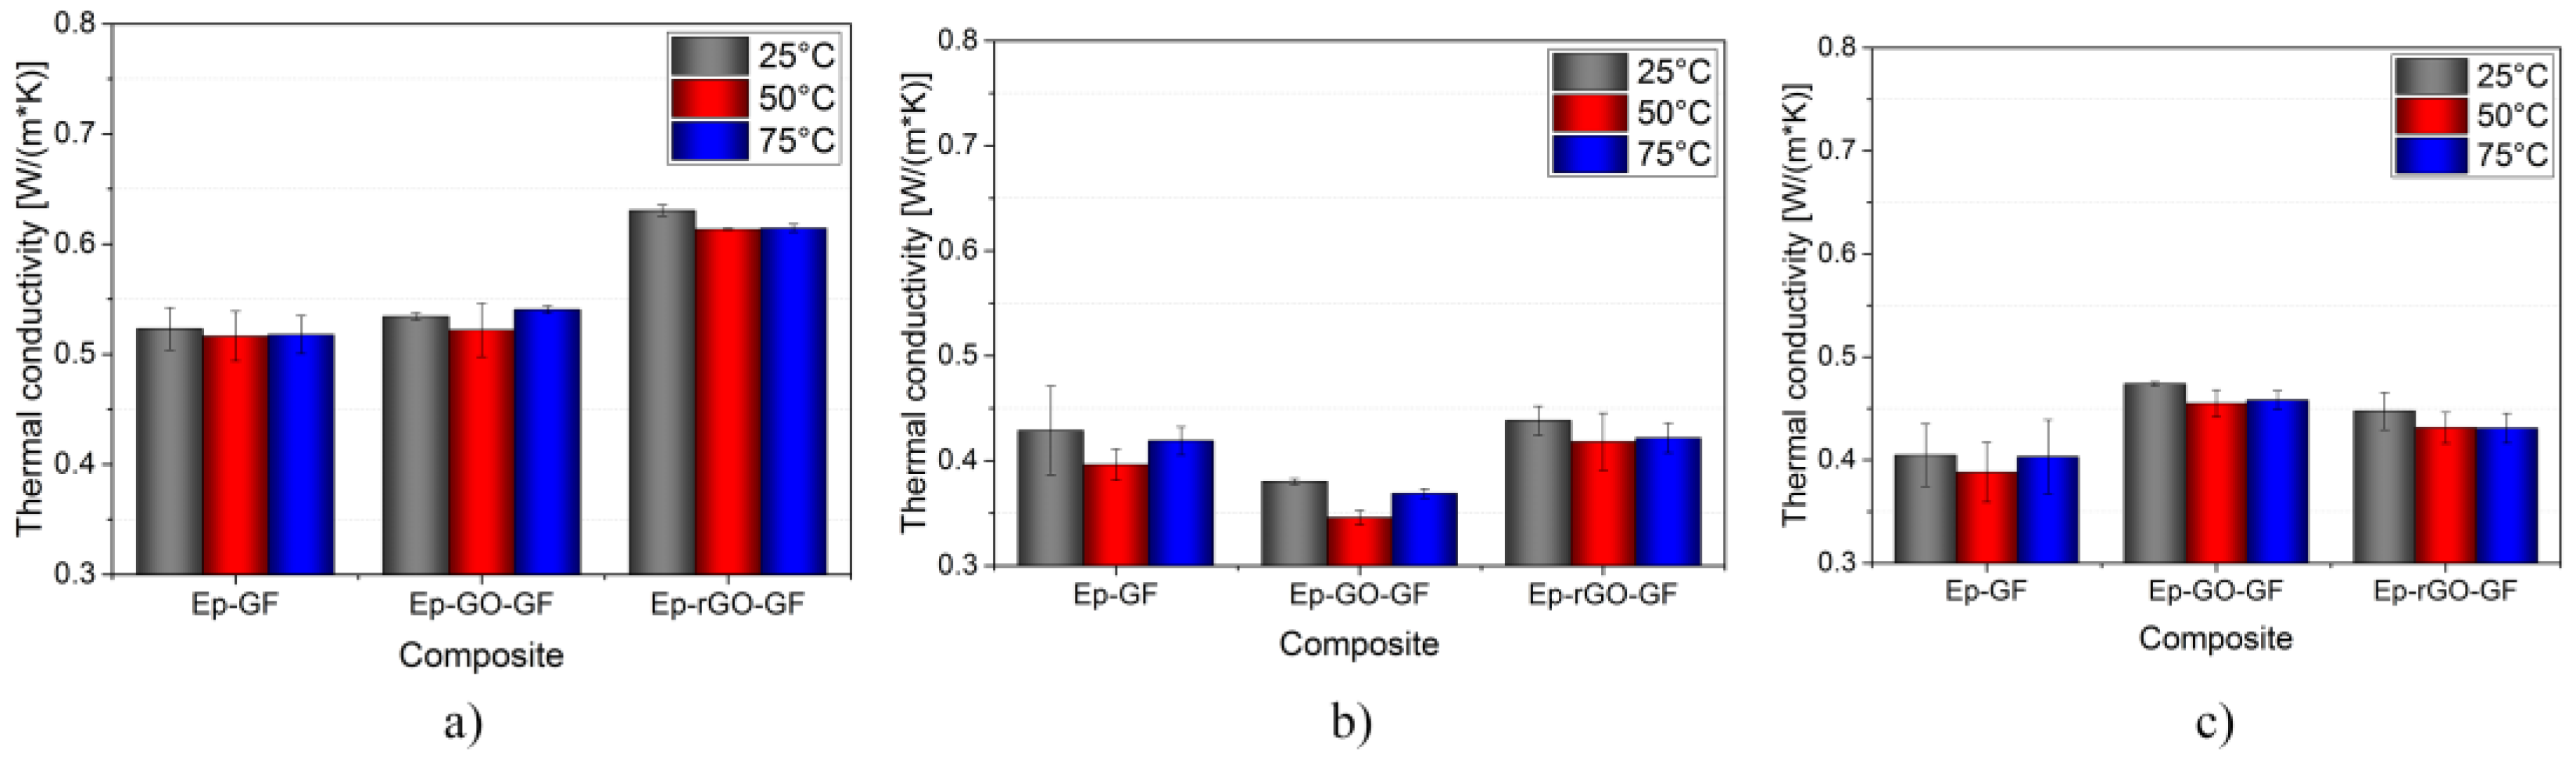
The influence of GO and rGO interphase on the thermal conductivity of samples was evaluated by testing the composite samples without and with graphene interphase (GO and rGO). Thermal conductivity was tested along three different mutual orthogonal directions, respectively, along (x) and transversally (y and z) to fiber direction and at three different temperatures i.e., 25 °C, 50 °C and 75 °C. Figure 10 reveals the effect of the presence of an interphase along all of the directions (i.e., x-axis, y-axis, and z-axis of the composite) in the fiber reinforced composites produced. In case of the x-axis (Figure 10a), the thermal conductivity of composites containing rGO coated fibers was significantly higher than that of composites with uncoated fibers or GO coated fibers (around +20%). This increase of thermal conductivity is also a confirmation of the reduction of GO during chemical treatment with hydrazine hydrate. Moreover, the advantage of aligning (even a very low content of) rGO nanosheets as a continuous interphase between the matrix and fiber results in a 20% increase in the thermal conductivity. Along the y-axis and z-axis of the composites, the thermal conductivity did not showed any significant change, as shown in Figure 10b,c. In these two directions, the GO or rGO interphase did not create a continuous network making it impossible to create a percolation threshold enough to improve the thermal conductivity.
4. Conclusions
In this study, epoxy/glass composites were prepared in which the glass fibers (GF) were coated with either GO or rGO. The coating of GO on GF was performed using electrophoretic deposition with deposition parameters being optimized to obtain a homogenous coating. rGO coated GF were obtained by subsequent chemical reduction of the GO coating. Multiscale composites were produced by the hand lay-up method, which produced high fiber volume fraction composites containing around 50% of fiber volume content with only 0.3% by weight of graphene nanosheets. The interphase of graphene nanosheets was effective in improving the thermal stability of the composites.
Electrical resistivity measurements revealed that the orientation of rGO nanosheets along the length of the fibers offered the lowest resistivity as compared to other orientations, hence confirming the advantage of oriented and aligned rGO interphase for tailored functional properties. The conductive behavior of epoxy/glass composite containing rGO interphase also induced the property of permittivity in the composites. This was verified along with the other composites containing uncoated and GO coated fibers. This functionality offers the possibility to use such composites for electromagnetic interference shielding in advanced applications. Other than electrical functionalities, the aligned rGO interphase along with the fibers in epoxy/glass composites offered a better thermal conductivity. This was verified by comparing the thermal conductivity values along other orientations of the composite based on either uncoated, GO, or rGO coated GF. This result supports the advantage of aligning graphene interphase in epoxy/glass composites for improved functional properties.
Acknowledgments
The authors greatly acknowledge the help of Gian-Franco Dalla Betta and Andrea Ficorella in carrying out the dielectric properties measurement in their laboratory.
Author Contributions
Haroon Mahmood and Alessandro Pegoretti conceived and designed the experiments; Haroon Mahmood performed the experiments; Seraphin H. Unterberger performed the thermal analysis tests; Haroon Mahmood, Alessandro Pegoretti and Seraphin H. Unterberger analyzed the data and wrote the paper.
Conflicts of Interest
The authors declare no conflict of interest.
References
- Kornmann, X.; Rees, M.; Thomann, Y.; Necola, A.; Barbezat, M.; Thomann, R. Epoxy-layered silicate nanocomposites as matrix in glass fibre-reinforced composites. Compos. Sci. Technol. 2005, 65, 2259–2268. [Google Scholar] [CrossRef]
- Vlasveld, D.; Parlevliet, P.; Bersee, H.; Picken, S. Fibre-matrix adhesion in glass-fibre reinforced polyamide-6 silicate nanocomposites. Compos. Part A Appl. Sci. Manuf. 2005, 36, 1–11. [Google Scholar] [CrossRef]
- Wichmann, M.H.G.; Sumfleth, J.; Gojny, F.H.; Quaresimin, M.; Fiedler, B.; Schulte, K. Glass-fibre-reinforced composites with enhanced mechanical and electrical properties–benefits and limitations of a nanoparticle modified matrix. Eng. Fract. Mech. 2006, 73, 2346–2359. [Google Scholar] [CrossRef]
- Ferrari, A.C.; Bonaccorso, F.; Fal’ko, V.; Novoselov, K.S.; Roche, S.; Boggild, P.; Borini, S.; Koppens, F.H.L.; Palermo, V.; Pugno, N.; et al. Science and technology roadmap for graphene, related two-dimensional crystals, and hybrid systems. Nanoscale 2015, 7, 4598–4810. [Google Scholar] [CrossRef] [PubMed] [Green Version]
- Novoselov, K.S.; Geim, A.K.; Morozov, S.V.; Jiang, D.; Zhang, Y.; Dubonos, S.V.; Grigorieva, I.V.; Firsov, A.A. Electric field effect in atomically thin carbon films. Science 2004, 306, 666–669. [Google Scholar] [CrossRef] [PubMed]
- Lee, C.; Wei, X.; Kysar, J.W.; Hone, J. Measurement of the elastic properties and intrinsic strength of monolayer graphene. Science 2008, 321, 385–388. [Google Scholar] [CrossRef] [PubMed]
- Balandin, A.A.; Ghosh, S.; Bao, W.; Calizo, I.; Teweldebrhan, D.; Miao, F.; Lau, C.N. Superior thermal conductivity of single-layer graphene. Nano Lett. 2008, 8, 902–907. [Google Scholar] [CrossRef] [PubMed]
- Atif, R.; Shyha, I.; Inam, F. Modeling and experimentation of multi-layered nanostructured graphene-epoxy nanocomposites for enhanced thermal and mechanical properties. J. Compos. Mater. 2017, 51, 209–220. [Google Scholar] [CrossRef]
- Xue, Q.; Sun, J. Electrical conductivity and percolation behavior of polymer nanocomposites. In Polymer Nanocomposites: Electrical and Thermal Properties; Huang, X., Zhi, C., Eds.; Springer International Publishing: Cham, Switzerland, 2016; pp. 51–82. [Google Scholar]
- Cheng, X.; Yokozeki, T.; Wu, L.; Wang, H.; Zhang, J.; Koyanagi, J.; Weng, Z.; Sun, Q. Electrical conductivity and interlaminar shear strength enhancement of carbon fiber reinforced polymers through synergetic effect between graphene oxide and polyaniline. Compos. Part A Appl. Sci. Manuf. 2016, 90, 243–249. [Google Scholar] [CrossRef]
- Mittal, G.; Dhand, V.; Rhee, K.Y.; Park, S.-J.; Lee, W.R. A review on carbon nanotubes and graphene as fillers in reinforced polymer nanocomposites. J. Ind. Eng. Chem. 2015, 21, 11–25. [Google Scholar] [CrossRef]
- Chen, H.; Ginzburg, V.V.; Yang, J.; Yang, Y.; Liu, W.; Huang, Y.; Du, L.; Chen, B. Thermal conductivity of polymer-based composites: Fundamentals and applications. Prog. Polym. Sci. 2016, 59, 41–85. [Google Scholar] [CrossRef]
- Chen, C.; Gu, Y.; Wang, S.; Zhang, Z.; Li, M.; Zhang, Z. Fabrication and characterization of structural/dielectric three-phase composite: Continuous basalt fiber reinforced epoxy resin modified with graphene nanoplates. Compos. Part A Appl. Sci. Manuf. 2017, 94, 199–208. [Google Scholar] [CrossRef]
- Jan, R.; Habib, A.; Gul, I.H. Stiff, strong, yet tough free-standing dielectric films of graphene nanosheets-polyurethane nanocomposites with very high dielectric constant and loss. Electron. Mater. Lett. 2016, 12, 91–99. [Google Scholar] [CrossRef]
- Yousefi, N.; Sun, X.; Lin, X.; Shen, X.; Jia, J.; Zhang, B.; Tang, B.; Chan, M.; Kim, J.-K. Highly aligned graphene/polymer nanocomposites with excellent dielectric properties for high-performance electromagnetic interference shielding. Adv. Mater. 2014, 26, 5480–5487. [Google Scholar] [CrossRef] [PubMed]
- Chen, J.; Wu, J.; Ge, H.; Zhao, D.; Liu, C.; Hong, X. Reduced graphene oxide deposited carbon fiber reinforced polymer composites for electromagnetic interference shielding. Compos. Part A Appl. Sci. Manuf. 2016, 82, 141–150. [Google Scholar] [CrossRef]
- Wu, J.; Chen, J.; Zhao, Y.; Liu, W.; Zhang, W. Effect of electrophoretic condition on the electromagnetic interference shielding performance of reduced graphene oxide-carbon fiber/epoxy resin composites. Compos. Part B Eng. 2016, 105, 167–175. [Google Scholar] [CrossRef]
- Pedrazzoli, D.; Pegoretti, A. Expanded graphite nanoplatelets as coupling agents in glass fiber reinforced polypropylene composites. Compos. Part A Appl. Sci. Manuf. 2014, 66, 25–34. [Google Scholar] [CrossRef]
- Pedrazzoli, D.; Pegoretti, A.; Kalaitzidou, K. Synergistic effect of exfoliated graphite nanoplatelets and short glass fiber on the mechanical and interfacial properties of epoxy composites. Compos. Sci. Technol. 2014, 98, 15–21. [Google Scholar] [CrossRef]
- Pedrazzoli, D.; Pegoretti, A. Hybridization of short glass fiber polypropylene composites with nanosilica and graphite nanoplatelets. J. Reinf. Plast. Compos. 2014, 33, 1682–1695. [Google Scholar] [CrossRef]
- Kumar, S.K.; Benicewicz, B.C.; Vaia, R.A.; Winey, K.I. 50th anniversary perspective: Are polymer nanocomposites practical for applications? Macromolecules 2017, 50, 714–731. [Google Scholar] [CrossRef]
- Park, J.G.; Cheng, Q.; Lu, J.; Bao, J.; Li, S.; Tian, Y.; Liang, Z.; Zhang, C.; Wang, B. Thermal conductivity of mwcnt/epoxy composites: The effects of length, alignment and functionalization. Carbon 2012, 50, 2083–2090. [Google Scholar] [CrossRef]
- Zhu, Y.-F.; Ma, C.; Zhang, W.; Zhang, R.-P.; Koratkar, N.; Liang, J. Alignment of multiwalled carbon nanotubes in bulk epoxy composites via electric field. J. Appl. Phys. 2009, 105, 054319. [Google Scholar] [CrossRef]
- Schwarz, M.-K.; Bauhofer, W.; Schulte, K. Alternating electric field induced agglomeration of carbon black filled resins. Polymer 2002, 43, 3079–3082. [Google Scholar] [CrossRef]
- Martin, C.A.; Sandler, J.K.W.; Windle, A.H.; Schwarz, M.K.; Bauhofer, W.; Schulte, K.; Shaffer, M.S.P. Electric field-induced aligned multi-wall carbon nanotube networks in epoxy composites. Polymer 2005, 46, 877–886. [Google Scholar] [CrossRef]
- Abdalla, M.; Dean, D.; Theodore, M.; Fielding, J.; Nyairo, E.; Price, G. Magnetically processed carbon nanotube/epoxy nanocomposites: Morphology, thermal, and mechanical properties. Polymer 2010, 51, 1614–1620. [Google Scholar] [CrossRef]
- Mahfuz, H.; Zainuddin, S.; Parker, M.R.; Al-Saadi, T.; Rangari, V.K.; Jeelani, S. Reinforcement of SC-15 epoxy with CNT/CNF under high magnetic field: An investigation of mechanical and thermal response. J. Mater. Sci. 2009, 44, 1113–1120. [Google Scholar] [CrossRef]
- Fragouli, D.; Das, A.; Innocenti, C.; Guttikonda, Y.; Rahman, S.; Liu, L.; Caramia, V.; Megaridis, C.M.; Athanassiou, A. Polymeric films with electric and magnetic anisotropy due to magnetically assembled functional nanofibers. ACS Appl. Mater. Interfaces 2014, 6, 4535–4541. [Google Scholar] [CrossRef] [PubMed]
- Bhattacharya, M. Polymer nanocomposites—A comparison between carbon nanotubes, graphene, and clay as nanofillers. Materials 2016, 9, 262. [Google Scholar] [CrossRef] [PubMed]
- Mahmood, H.; Tripathi, M.; Pugno, N.; Pegoretti, A. Enhancement of interfacial adhesion in glass fiber/epoxy composites by electrophoretic deposition of graphene oxide on glass fibers. Compos. Sci. Technol. 2016, 126, 149–157. [Google Scholar] [CrossRef]
- Mahmood, H.; Vanzetti, L.; Bersani, M.; Pegoretti, A. Mechanical properties and strain monitoring of glass-epoxy composites with graphene-coated fibers. Compos. Part A Appl. Sci. Manuf. 2017. Submitted. [Google Scholar]
- Parker, W.J.; Jenkins, R.J.; Butler, C.P.; Abbott, G.L. Flash method of determining thermal diffusivity, heat capacity, and thermal conductivity. J. Appl. Phys. 1961, 32, 1679–1684. [Google Scholar] [CrossRef]
- Buchsteiner, A.; Lerf, A.; Pieper, J. Water dynamics in graphite oxide investigated with neutron scattering. J. Phys. Chem. B 2006, 110, 22328–22338. [Google Scholar] [CrossRef] [PubMed]
- Nan, C.-W.; Shen, Y.; Ma, J. Physical properties of composites near percolation. Annu. Rev. Mater. Res. 2010, 40, 131–151. [Google Scholar] [CrossRef]
Figure 1.
Schematic diagram of the electrophoretic deposition setup.
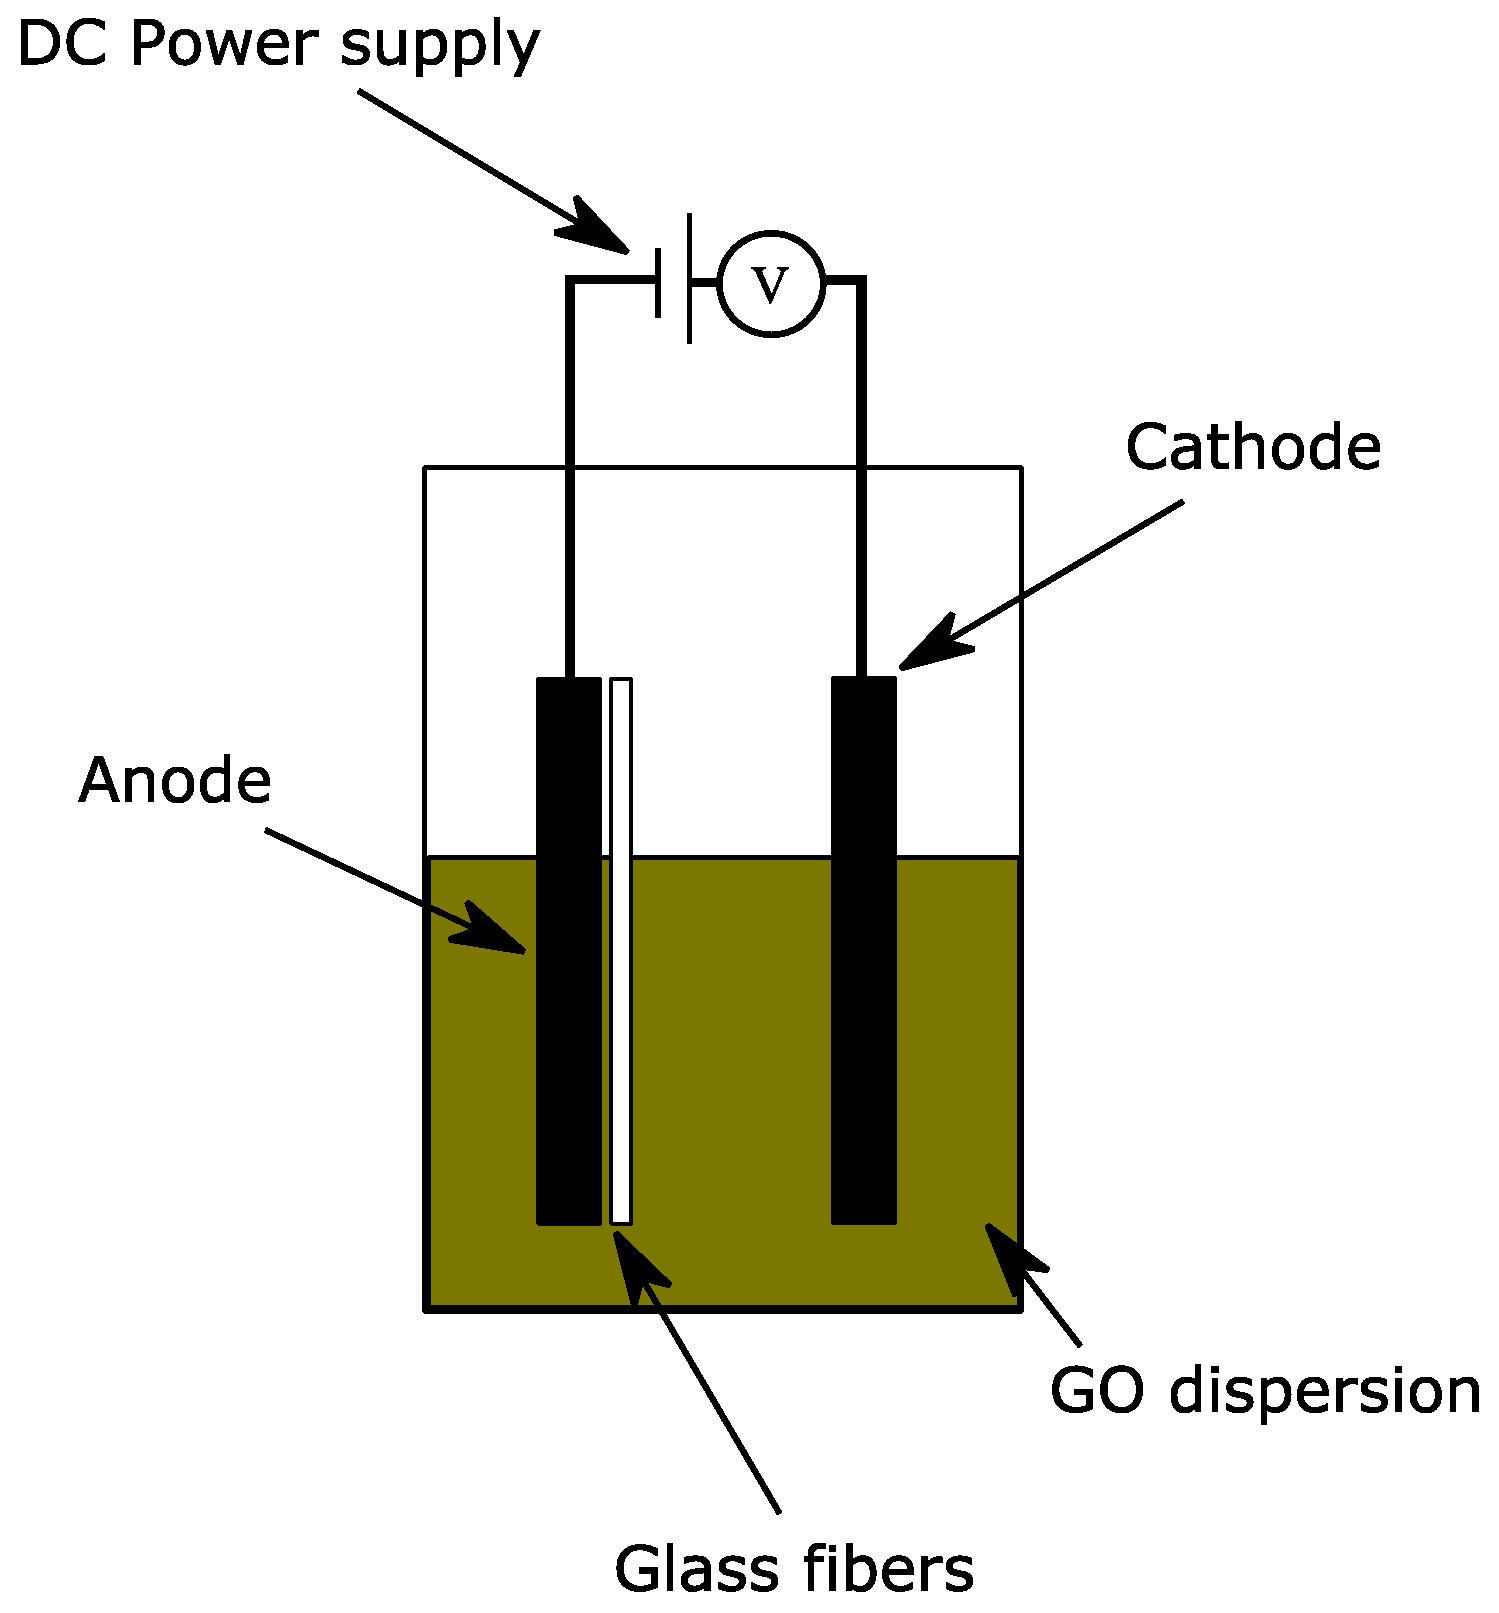
Figure 2.
Description of directions in terms of orientation for electrical resistivity and thermal conductivity measurements.
Figure 2.
Description of directions in terms of orientation for electrical resistivity and thermal conductivity measurements.
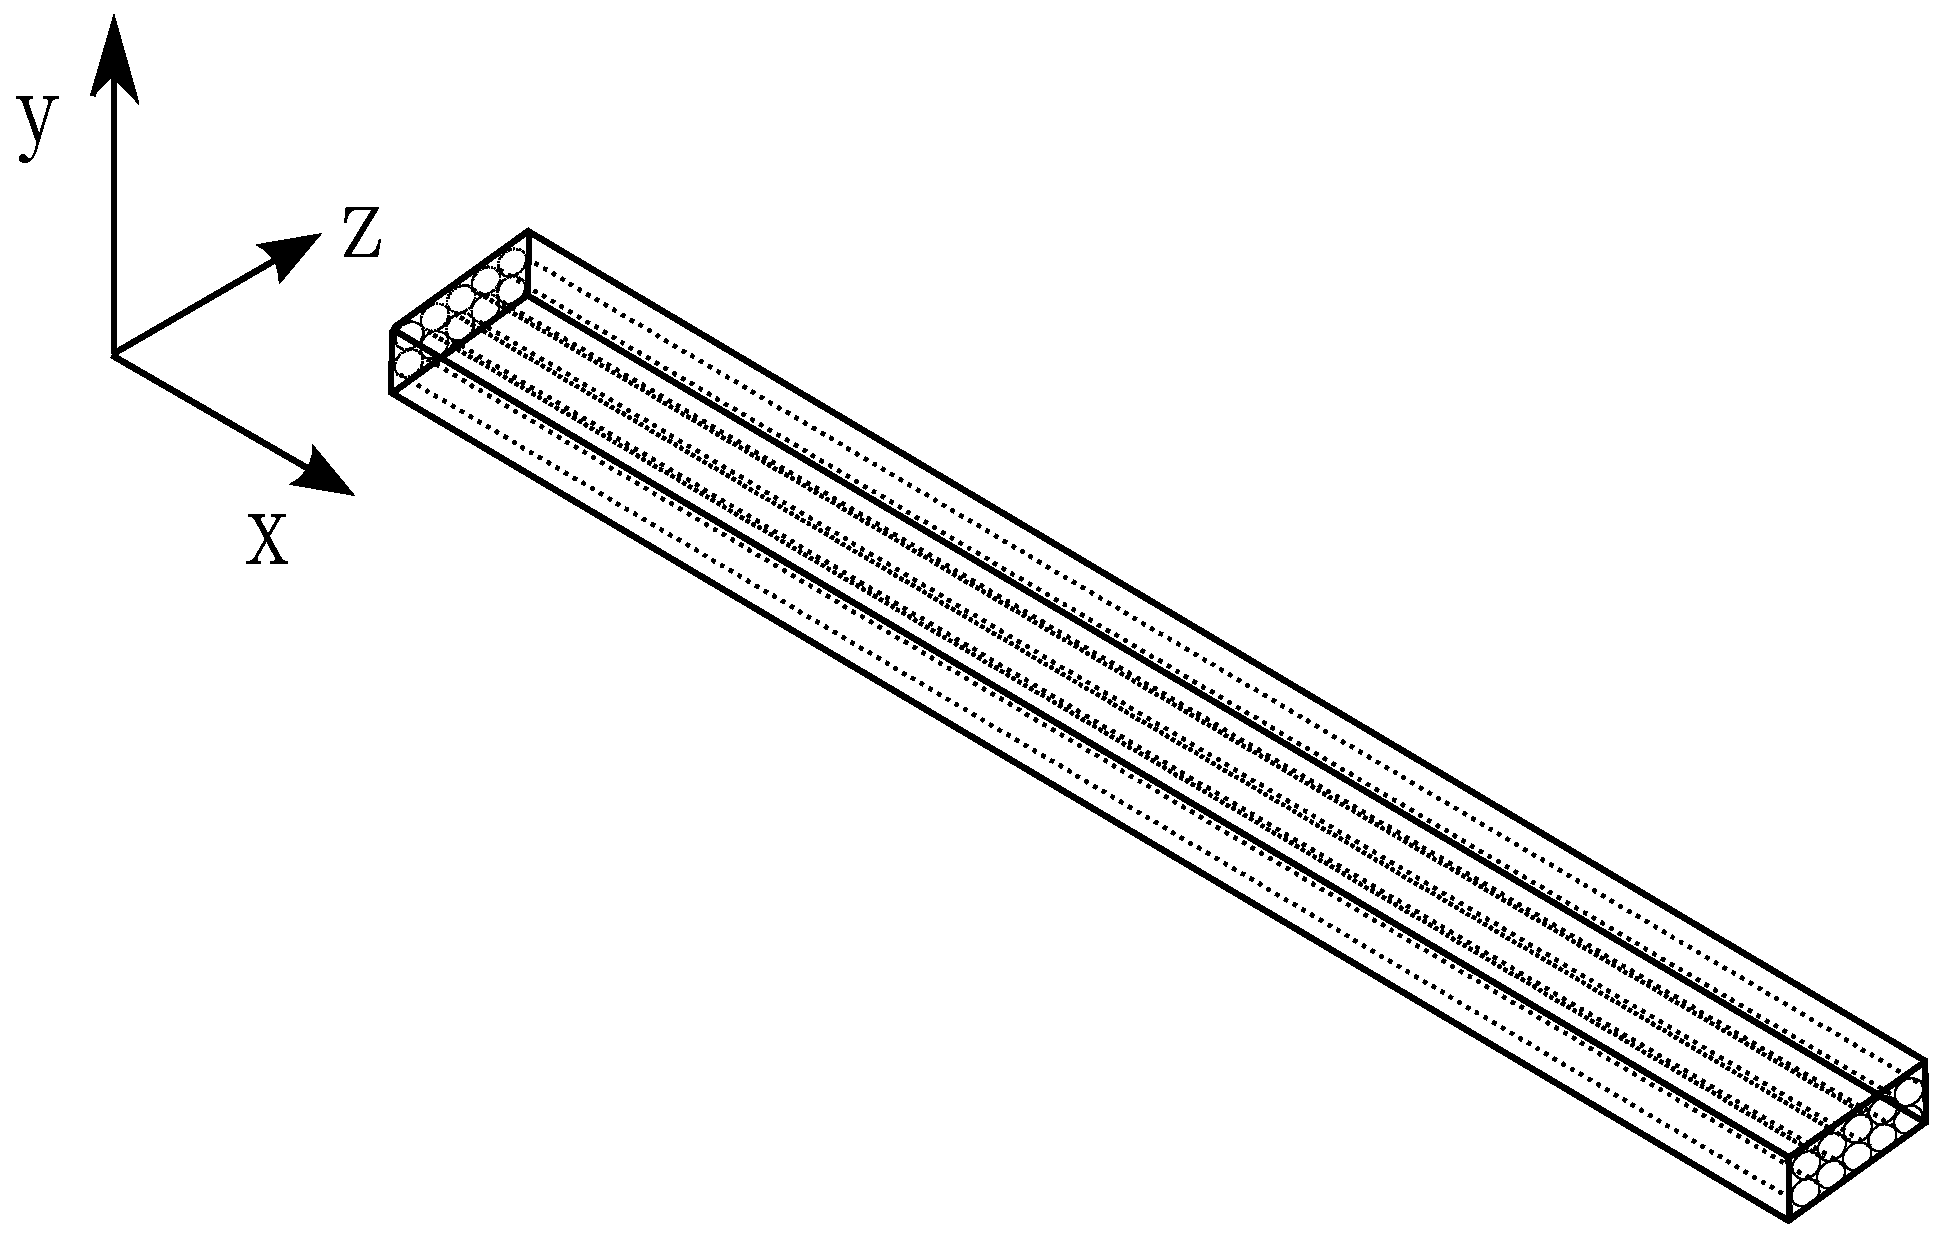
Figure 3.
(a) X-ray diffractograms of pristine graphite, GO and rGO (the internal box shows the magnified picture of diffractograms of GO and rGO); (b,c) FESEM images of exfoliated GO nanosheets.
Figure 3.
(a) X-ray diffractograms of pristine graphite, GO and rGO (the internal box shows the magnified picture of diffractograms of GO and rGO); (b,c) FESEM images of exfoliated GO nanosheets.
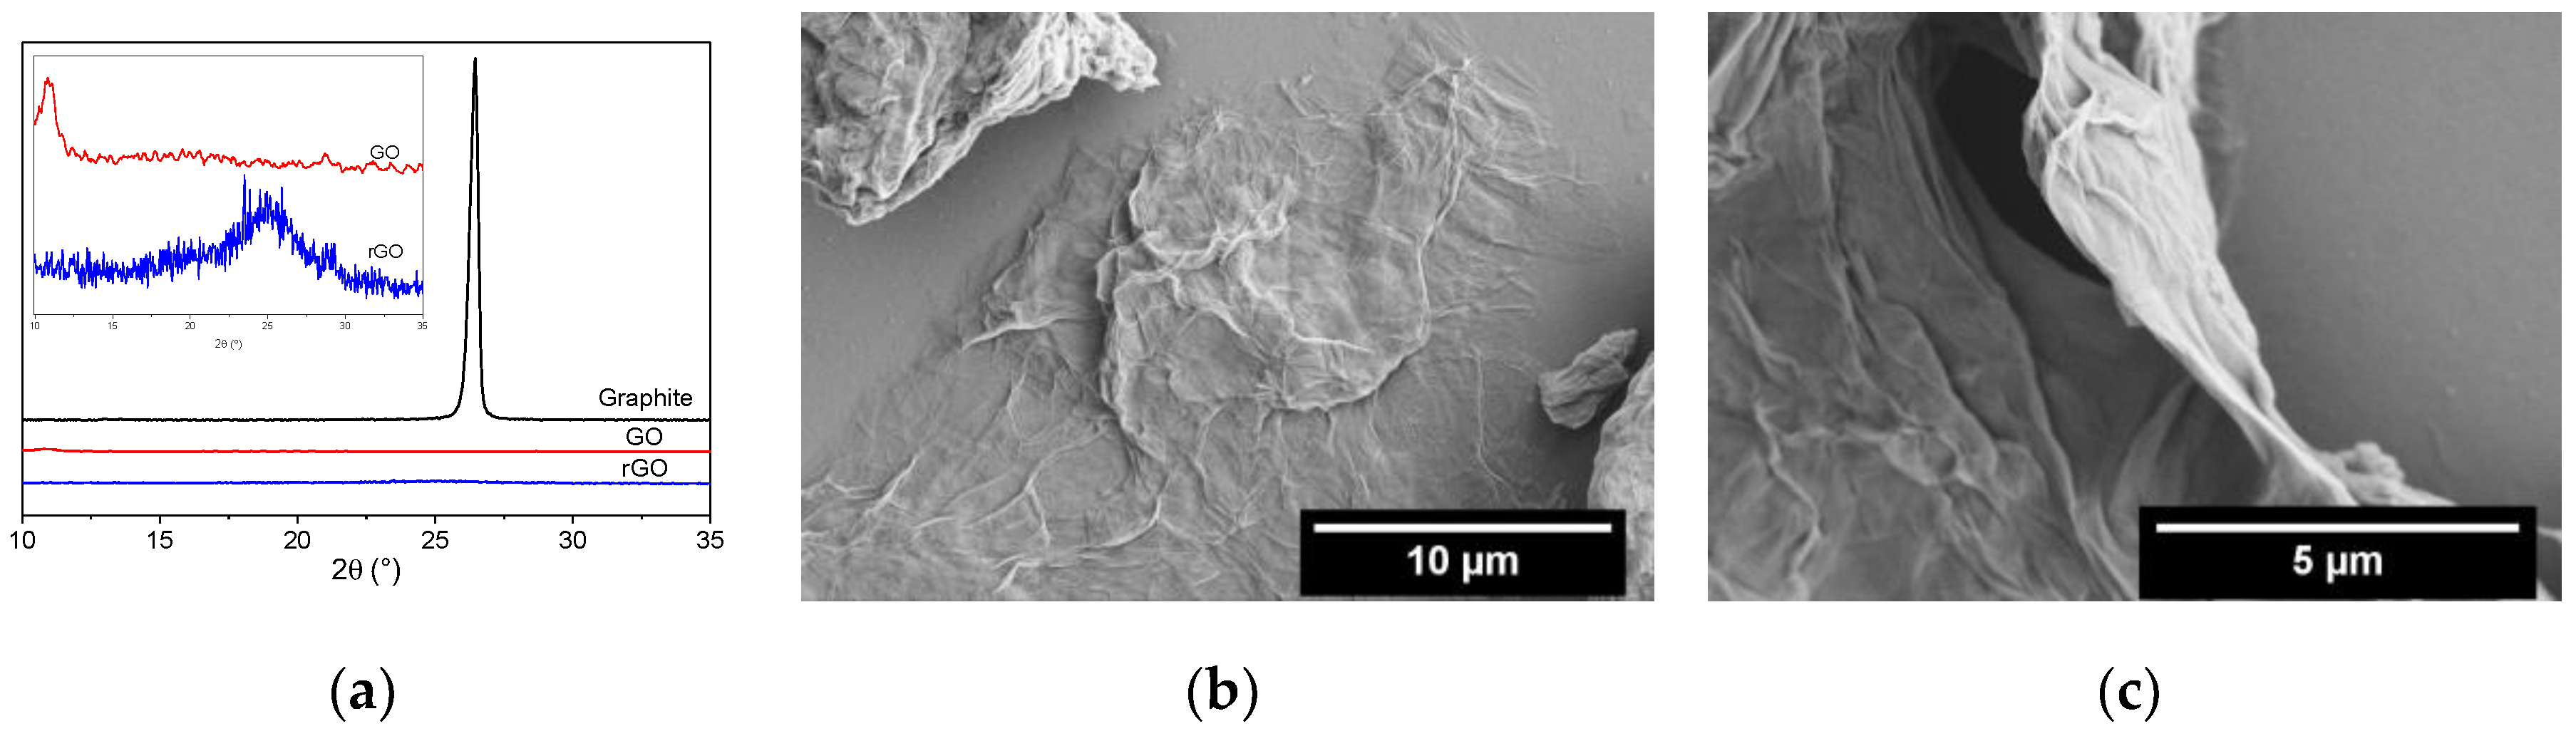
Figure 4.
Metallic window frames with (a) uncoated E-glass fibers (GF) and (b) GO coated GF and (c) rGO coated GF.
Figure 4.
Metallic window frames with (a) uncoated E-glass fibers (GF) and (b) GO coated GF and (c) rGO coated GF.

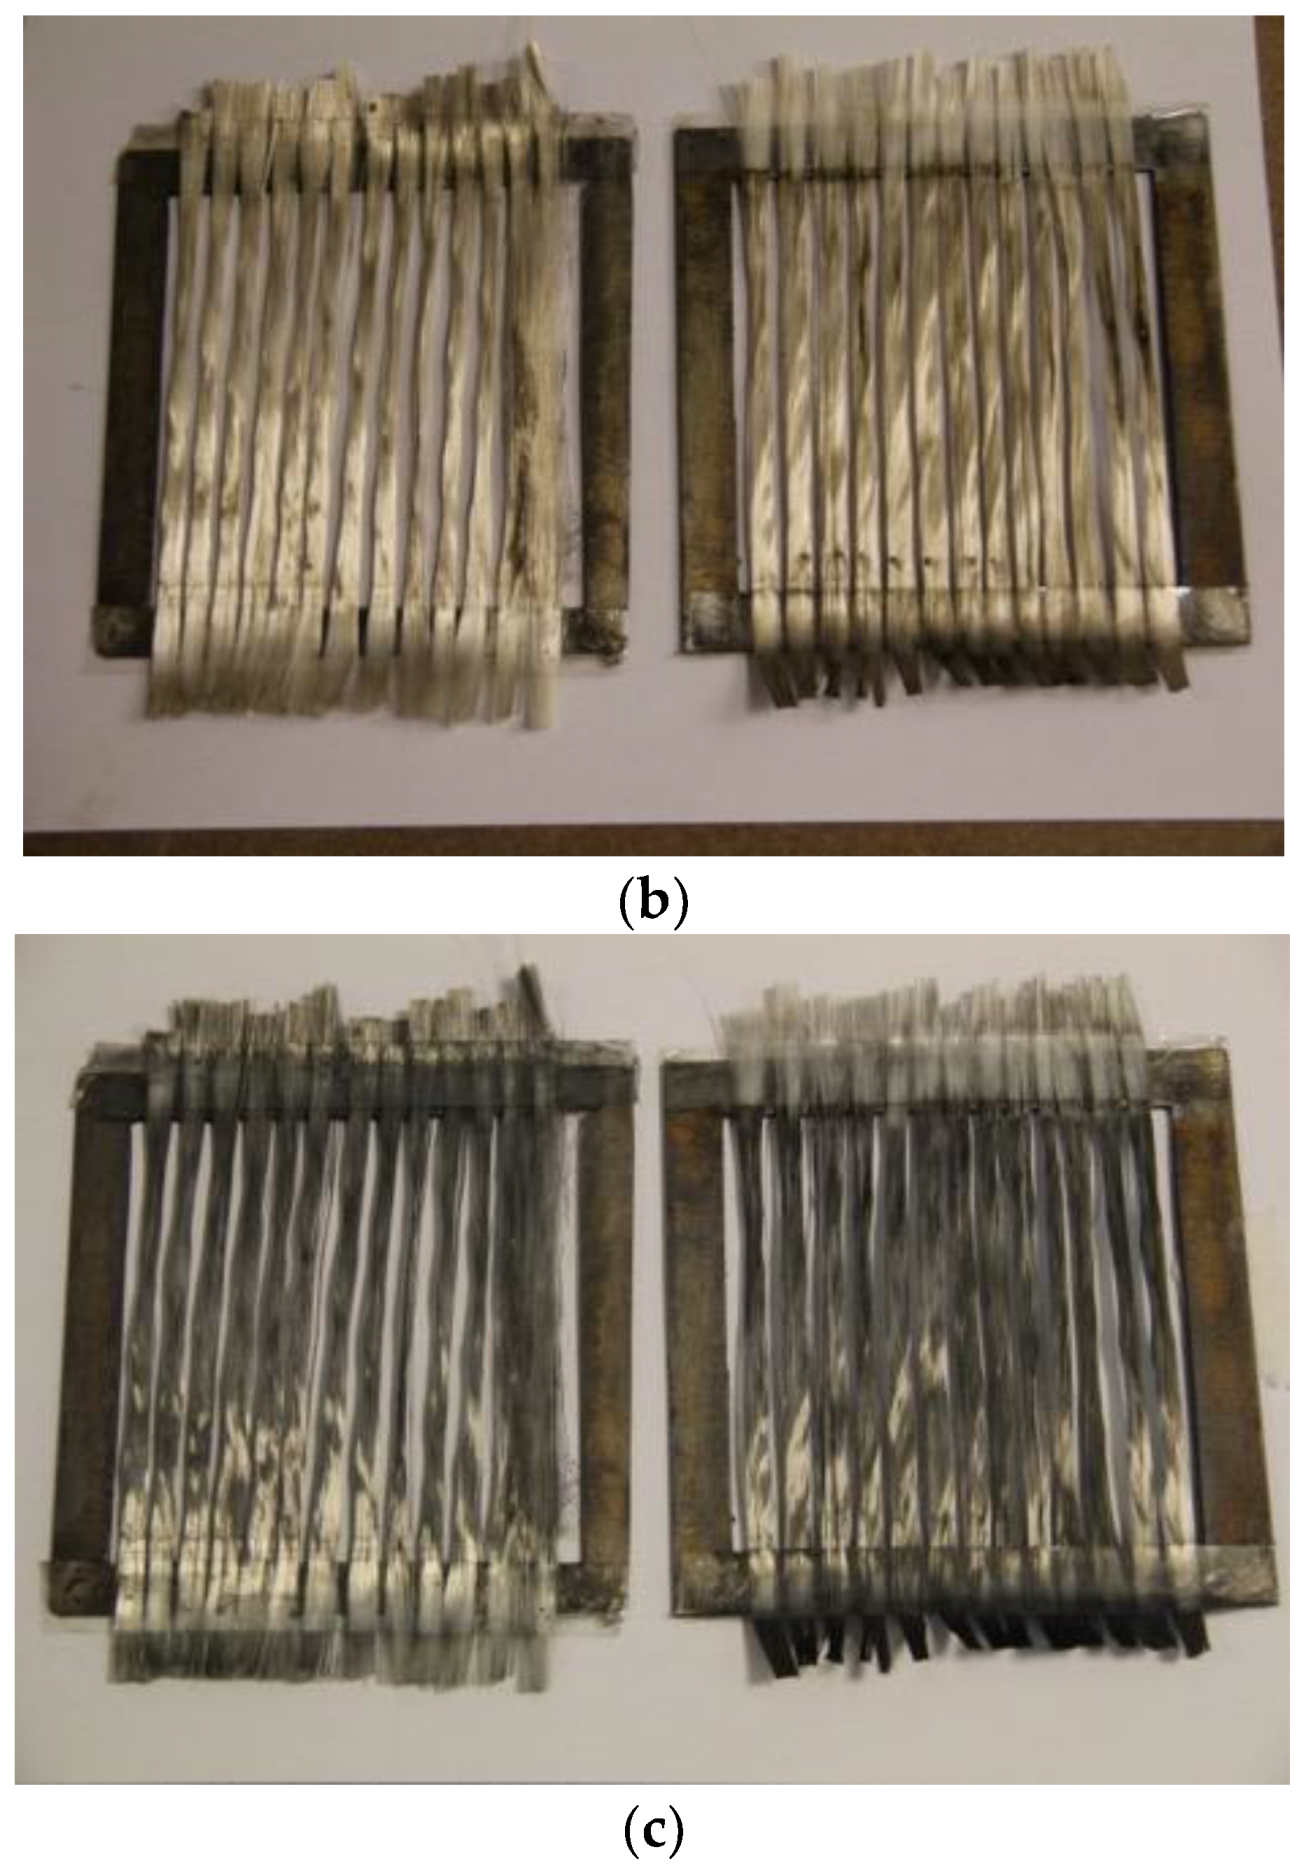
Figure 5.
Field emission scanning electron microscopy (FESEM) pictures of GF (a) coated with GO using applied field of 10 V/cm (b) and rGO after chemical reduction (c).
Figure 5.
Field emission scanning electron microscopy (FESEM) pictures of GF (a) coated with GO using applied field of 10 V/cm (b) and rGO after chemical reduction (c).
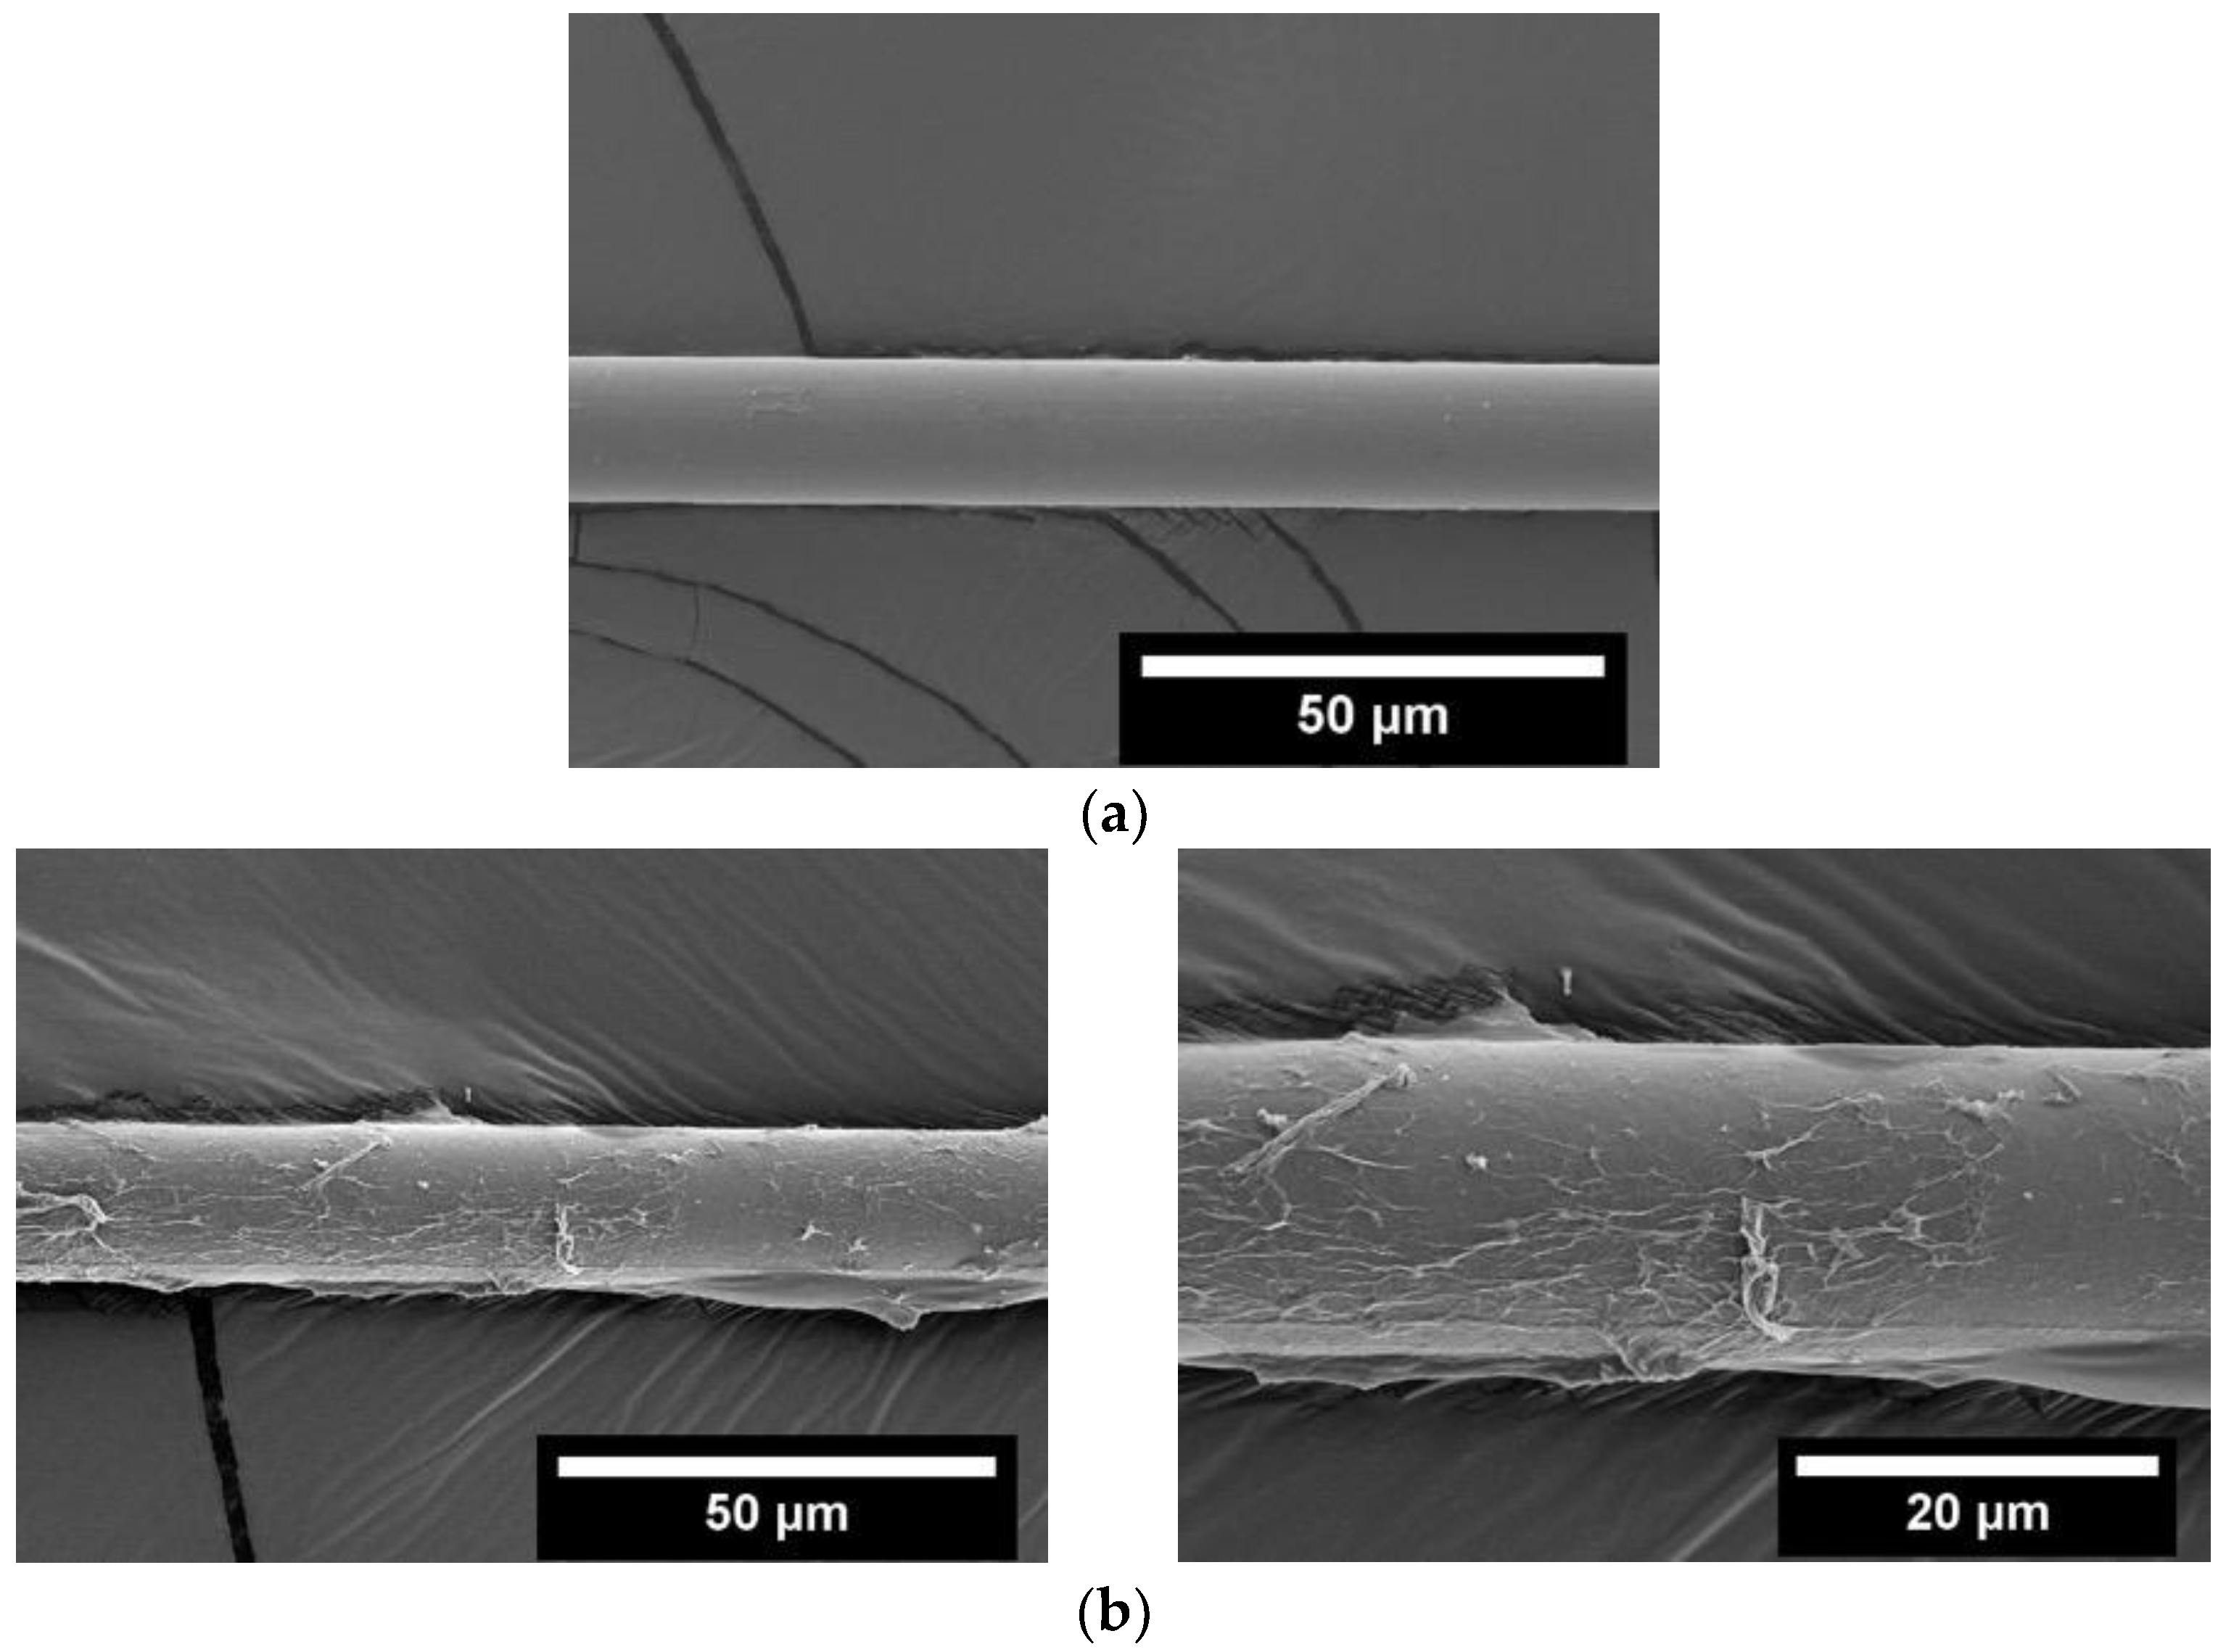

Figure 6.
Cross-section of composite observed through optical and electron microscopy at different magnifications.
Figure 6.
Cross-section of composite observed through optical and electron microscopy at different magnifications.

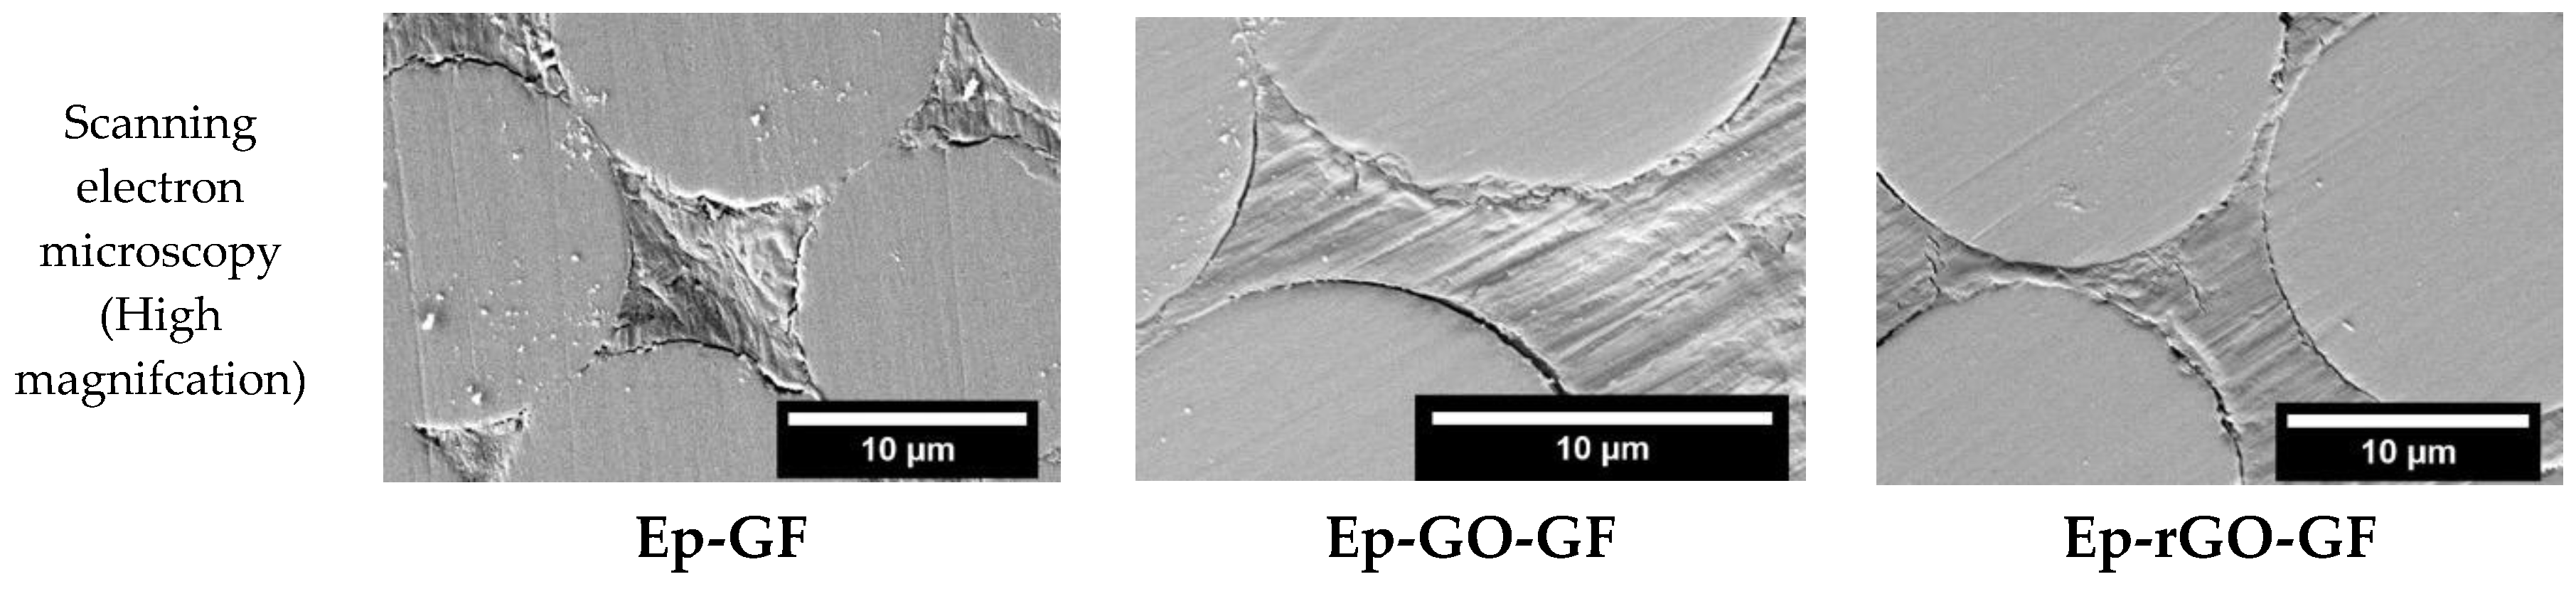
Figure 7.
Volume resistivity of Ep-rGO-GF composites measured along three different directions of the sample with respect to fiber orientation.
Figure 7.
Volume resistivity of Ep-rGO-GF composites measured along three different directions of the sample with respect to fiber orientation.

Figure 8.
Dielectric properties of the investigated composites: (a) permittivity (or dielectric constant) related to the applied frequency; and, (b) dissipation factor (or dielectric loss).
Figure 8.
Dielectric properties of the investigated composites: (a) permittivity (or dielectric constant) related to the applied frequency; and, (b) dissipation factor (or dielectric loss).
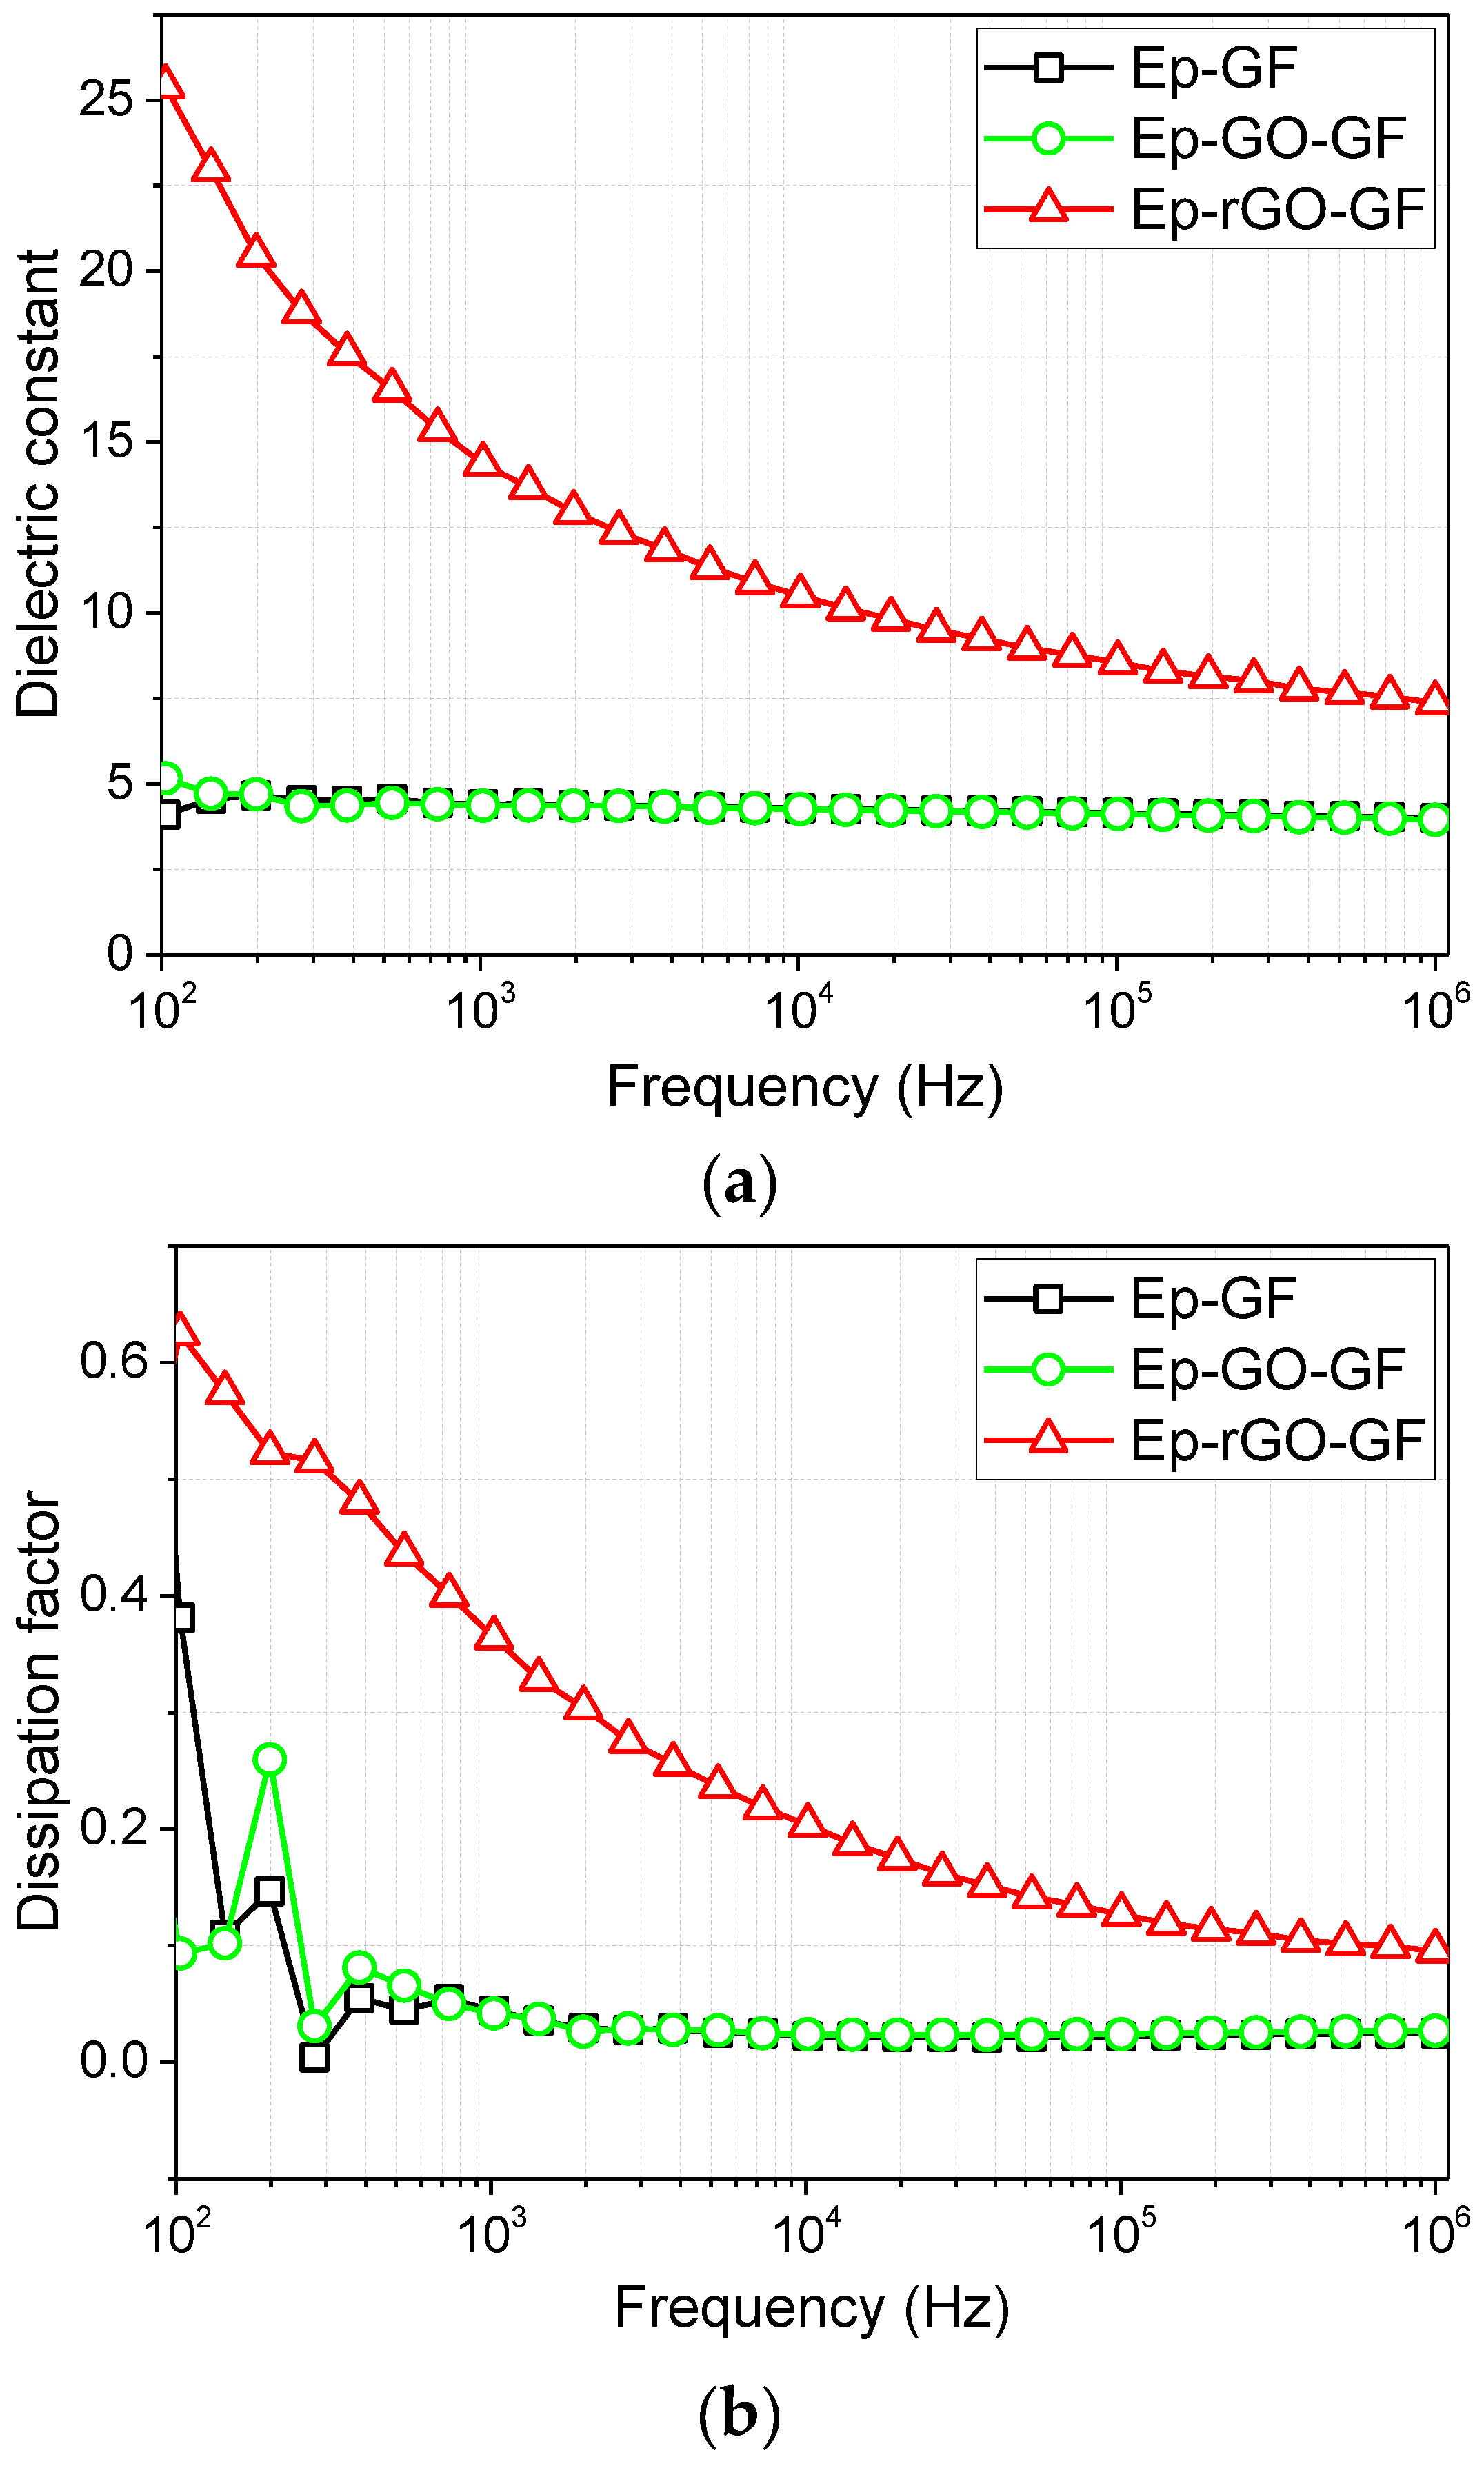
Figure 9.
Thermogravimetric analysis (TGA) thermograms of uncoated and graphene coated fiber reinforced composites. (a) Residual mass as a function of temperature; (b) derivative of the mass loss.
Figure 9.
Thermogravimetric analysis (TGA) thermograms of uncoated and graphene coated fiber reinforced composites. (a) Residual mass as a function of temperature; (b) derivative of the mass loss.
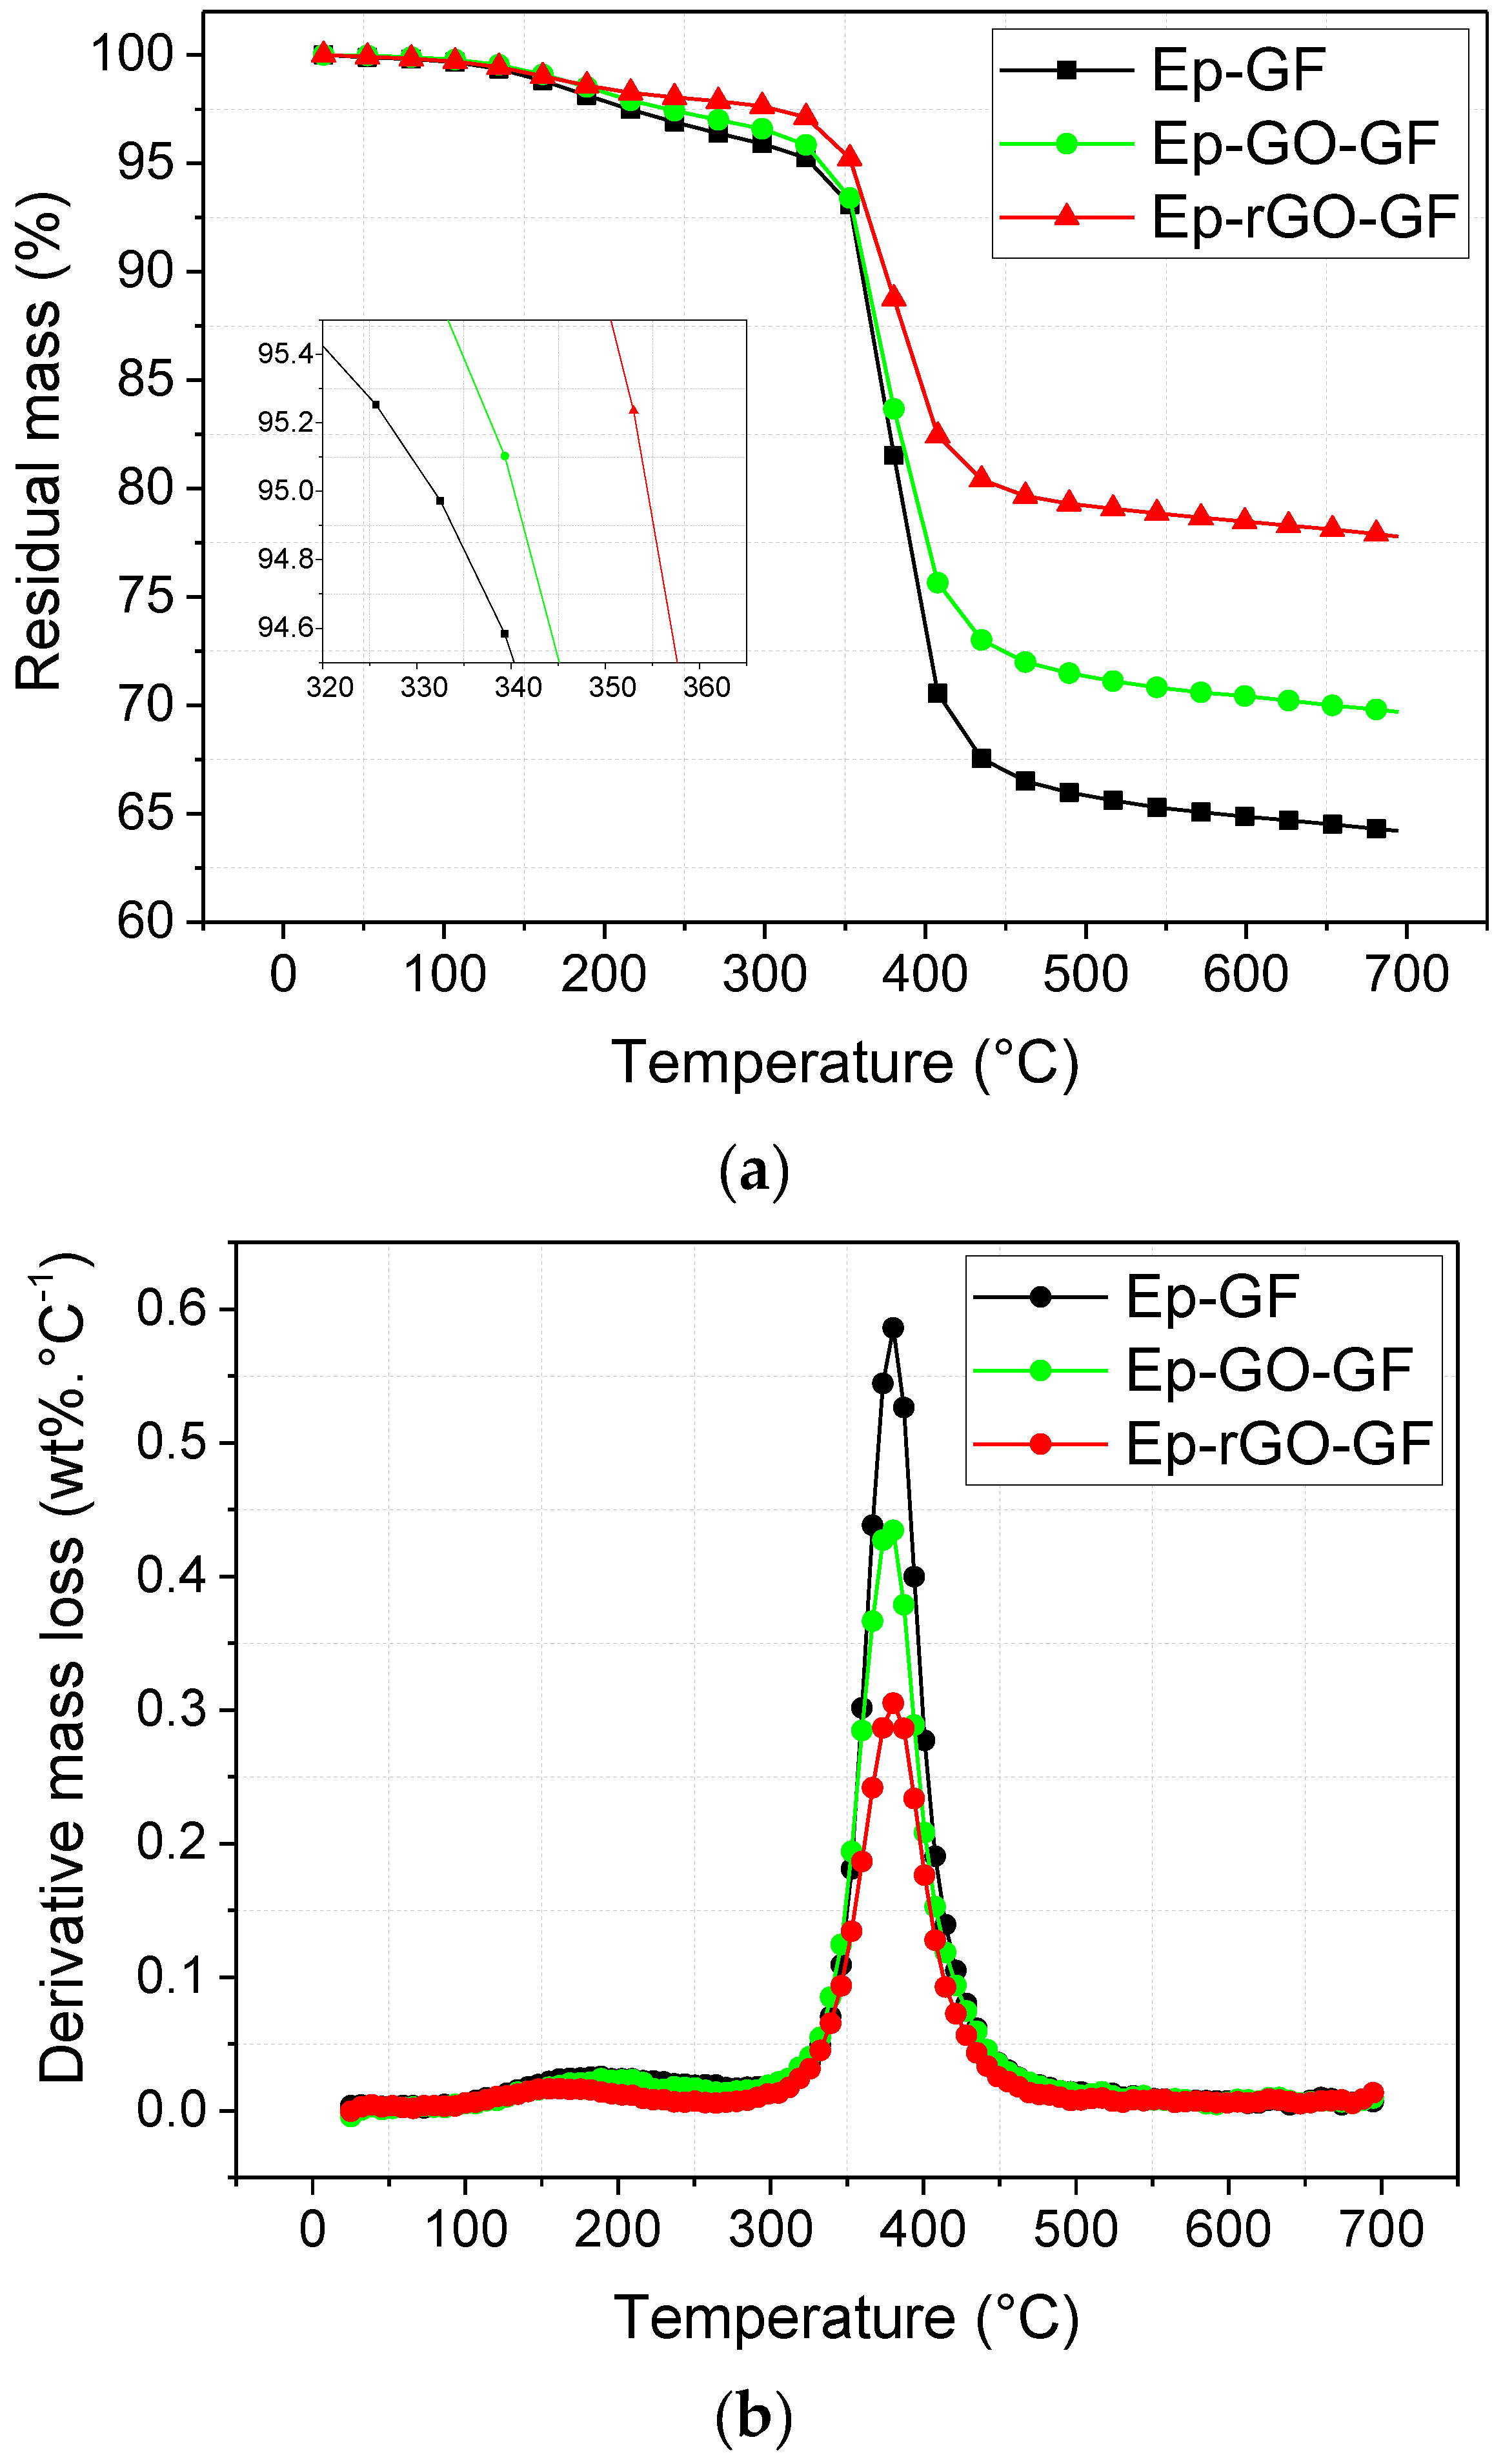
Figure 10.
Thermal conductivity of three composites along (a) x-axis; (b) y-axis; and, (c) z-axis directions.
Figure 10.
Thermal conductivity of three composites along (a) x-axis; (b) y-axis; and, (c) z-axis directions.

Table 1.
Electrical resistivity values of composites with uncoated and coated fibers.
| Property | Ep-GF | Ep-GO-GF | Ep-rGO-GF |
|---|---|---|---|
| Volume resistivity (Ω·cm) | 3.7 × 10¹⁴ | 6.9 × 10¹³ | 4.5 × 10² |
Table 2.
Results of TGA on composites with uncoated and coated fibers.
| Characteristic | Ep-GF | Ep-GO-GF | Ep-rGO-GF |
|---|---|---|---|
| Onset temperature (°C) | 331.8 | 340.3 | 354.4 |
| Residual mass at 700 °C (%) | 64.2 | 71.6 | 77.8 |
| Peak temperature (°C) | 380.3 | 380.3 | 380.3 |
© 2017 by the authors. Licensee MDPI, Basel, Switzerland. This article is an open access article distributed under the terms and conditions of the Creative Commons Attribution (CC BY) license (http://creativecommons.org/licenses/by/4.0/).
Share and Cite
MDPI and ACS Style
Mahmood, H.; Unterberger, S.H.; Pegoretti, A. Tuning Electrical and Thermal Properties in Epoxy/Glass Composites by Graphene-Based Interphase. J. Compos. Sci. 2017, 1, 12. https://doi.org/10.3390/jcs1020012
AMA Style
Mahmood H, Unterberger SH, Pegoretti A. Tuning Electrical and Thermal Properties in Epoxy/Glass Composites by Graphene-Based Interphase. Journal of Composites Science. 2017; 1(2):12. https://doi.org/10.3390/jcs1020012
Chicago/Turabian StyleMahmood, Haroon, Seraphin H. Unterberger, and Alessandro Pegoretti. 2017. "Tuning Electrical and Thermal Properties in Epoxy/Glass Composites by Graphene-Based Interphase" Journal of Composites Science 1, no. 2: 12. https://doi.org/10.3390/jcs1020012