Modelling Local Bending Stiffness of Norway Spruce Sawn Timber Using Scanned Fibre Orientation †

Department of Building Technology, Linnaeus University, 351 95 Växjö, Sweden
*
Author to whom correspondence should be addressed.
†
Presented at the 18th International Conference on Experimental Mechanics (ICEM18), Brussels, Belgium, 1–5 July 2018.
Proceedings 2018, 2(8), 505; https://doi.org/10.3390/ICEM18-05426
Published: 2 July 2018
(This article belongs to the Proceedings of The 18th International Conference on Experimental Mechanics)
Abstract
:Strength of structural timber depends to a high degree on the occurrence of knots and on the local fibre deviation around such defects. Knowledge of local fibre orientation, obtained by laser scanning, have been utilized in a previously developed machine strength grading method. However, that method was based on rather crude assumptions regarding the fibre orientation in the interior of boards and a mechanical model that does not capture the full compliance of knotty sections. The purpose of the present study was to suggest and verify a model by which local bending stiffness can be predicted with high accuracy. This study included development of a model of fibre orientation in the interior of boards, and application of a three-dimensional finite element model that is able to capture the compliance of the board. Verification included bending of boards in laboratory and application of digital image correlation to obtain strain fields comparable to those obtained by finite element simulation. Results presented comprise strain fields of boards subjected to bending and calculated bending stiffness variation along boards. Comparisons of results indicated that models suggested herein were sufficient to capture the variation of local bending stiffness along boards with very high accuracy.
1. Introduction
Development of accurate machine strength grading methods requires knowledge on the mechanical properties of timber, which depend on clear wood properties and influence of defects. Wood exhibits orthotropic properties. The material is much stronger and stiffer along fibres than in the transverse directions. Thus, strength and stiffness in clear wood are highly dependent on the angle between fibre and load directions, and such a relationship was described mathematically by [1]. In timber, knots and the related local fibre deviation are regarded as the most important type of defect that considerably reduce the strength of structural timber (e.g. [2]). Therefore, gaining knowledge of local fibre orientation and using such information to develop models for the mechanical properties of individual boards are in focus of the current research.
Nowadays, by application of industry scanners that include dot lasers, it is possible to determine the in-plane fibre direction on timber surfaces with a resolution of a few millimetres. This is done by utilizing the so-called tracheid effect, which is dependent on scattering and reflection of light within wood fibres [3,4]. Knowledge of local fibre orientation obtained by tracheid effect scanning have been utilized in a previously developed machine strength grading method [5]. Although the mentioned method enables rather accurate prediction of bending strength [6], it is based on simplifying assumptions on the interior fibre orientation and when calculating local bending MOE. The purpose of the present study was therefore to investigate the significance of these assumptions, and to suggest and verify a model by which local bending stiffness can be predicted with high accuracy.
2. Material and Methods
2.1. Material and Introductory Investigation
The study comprised two boards of Norway spruce (Picea abies (L.) H. Karst) denoted board B1 and B2, see Table 1. The boards were of dimensions 45 × 145 × 4550 mm and the moisture content was, at the time of laboratory testing, 12%. The board density, ρ, was calculated based on the dimensions and the weight of the boards at 12% moisture content. The axial dynamic MOE was determined by means of dynamic excitation using an impact hammer, vibration response captured by a microphone, and fast Fourier transformation using a spectrum analyzer. The location of the pith of each of the logs from which the two boards were sawn was determined in relation to the center of the end cross-sections of the boards using a transparent plastic sheet on which a number of concentric arcs and a 2D grid were drawn. The position of the pith was determined by fitting the annual rings visible on the end surfaces of the boards to the concentric arcs on the plastic sheet.
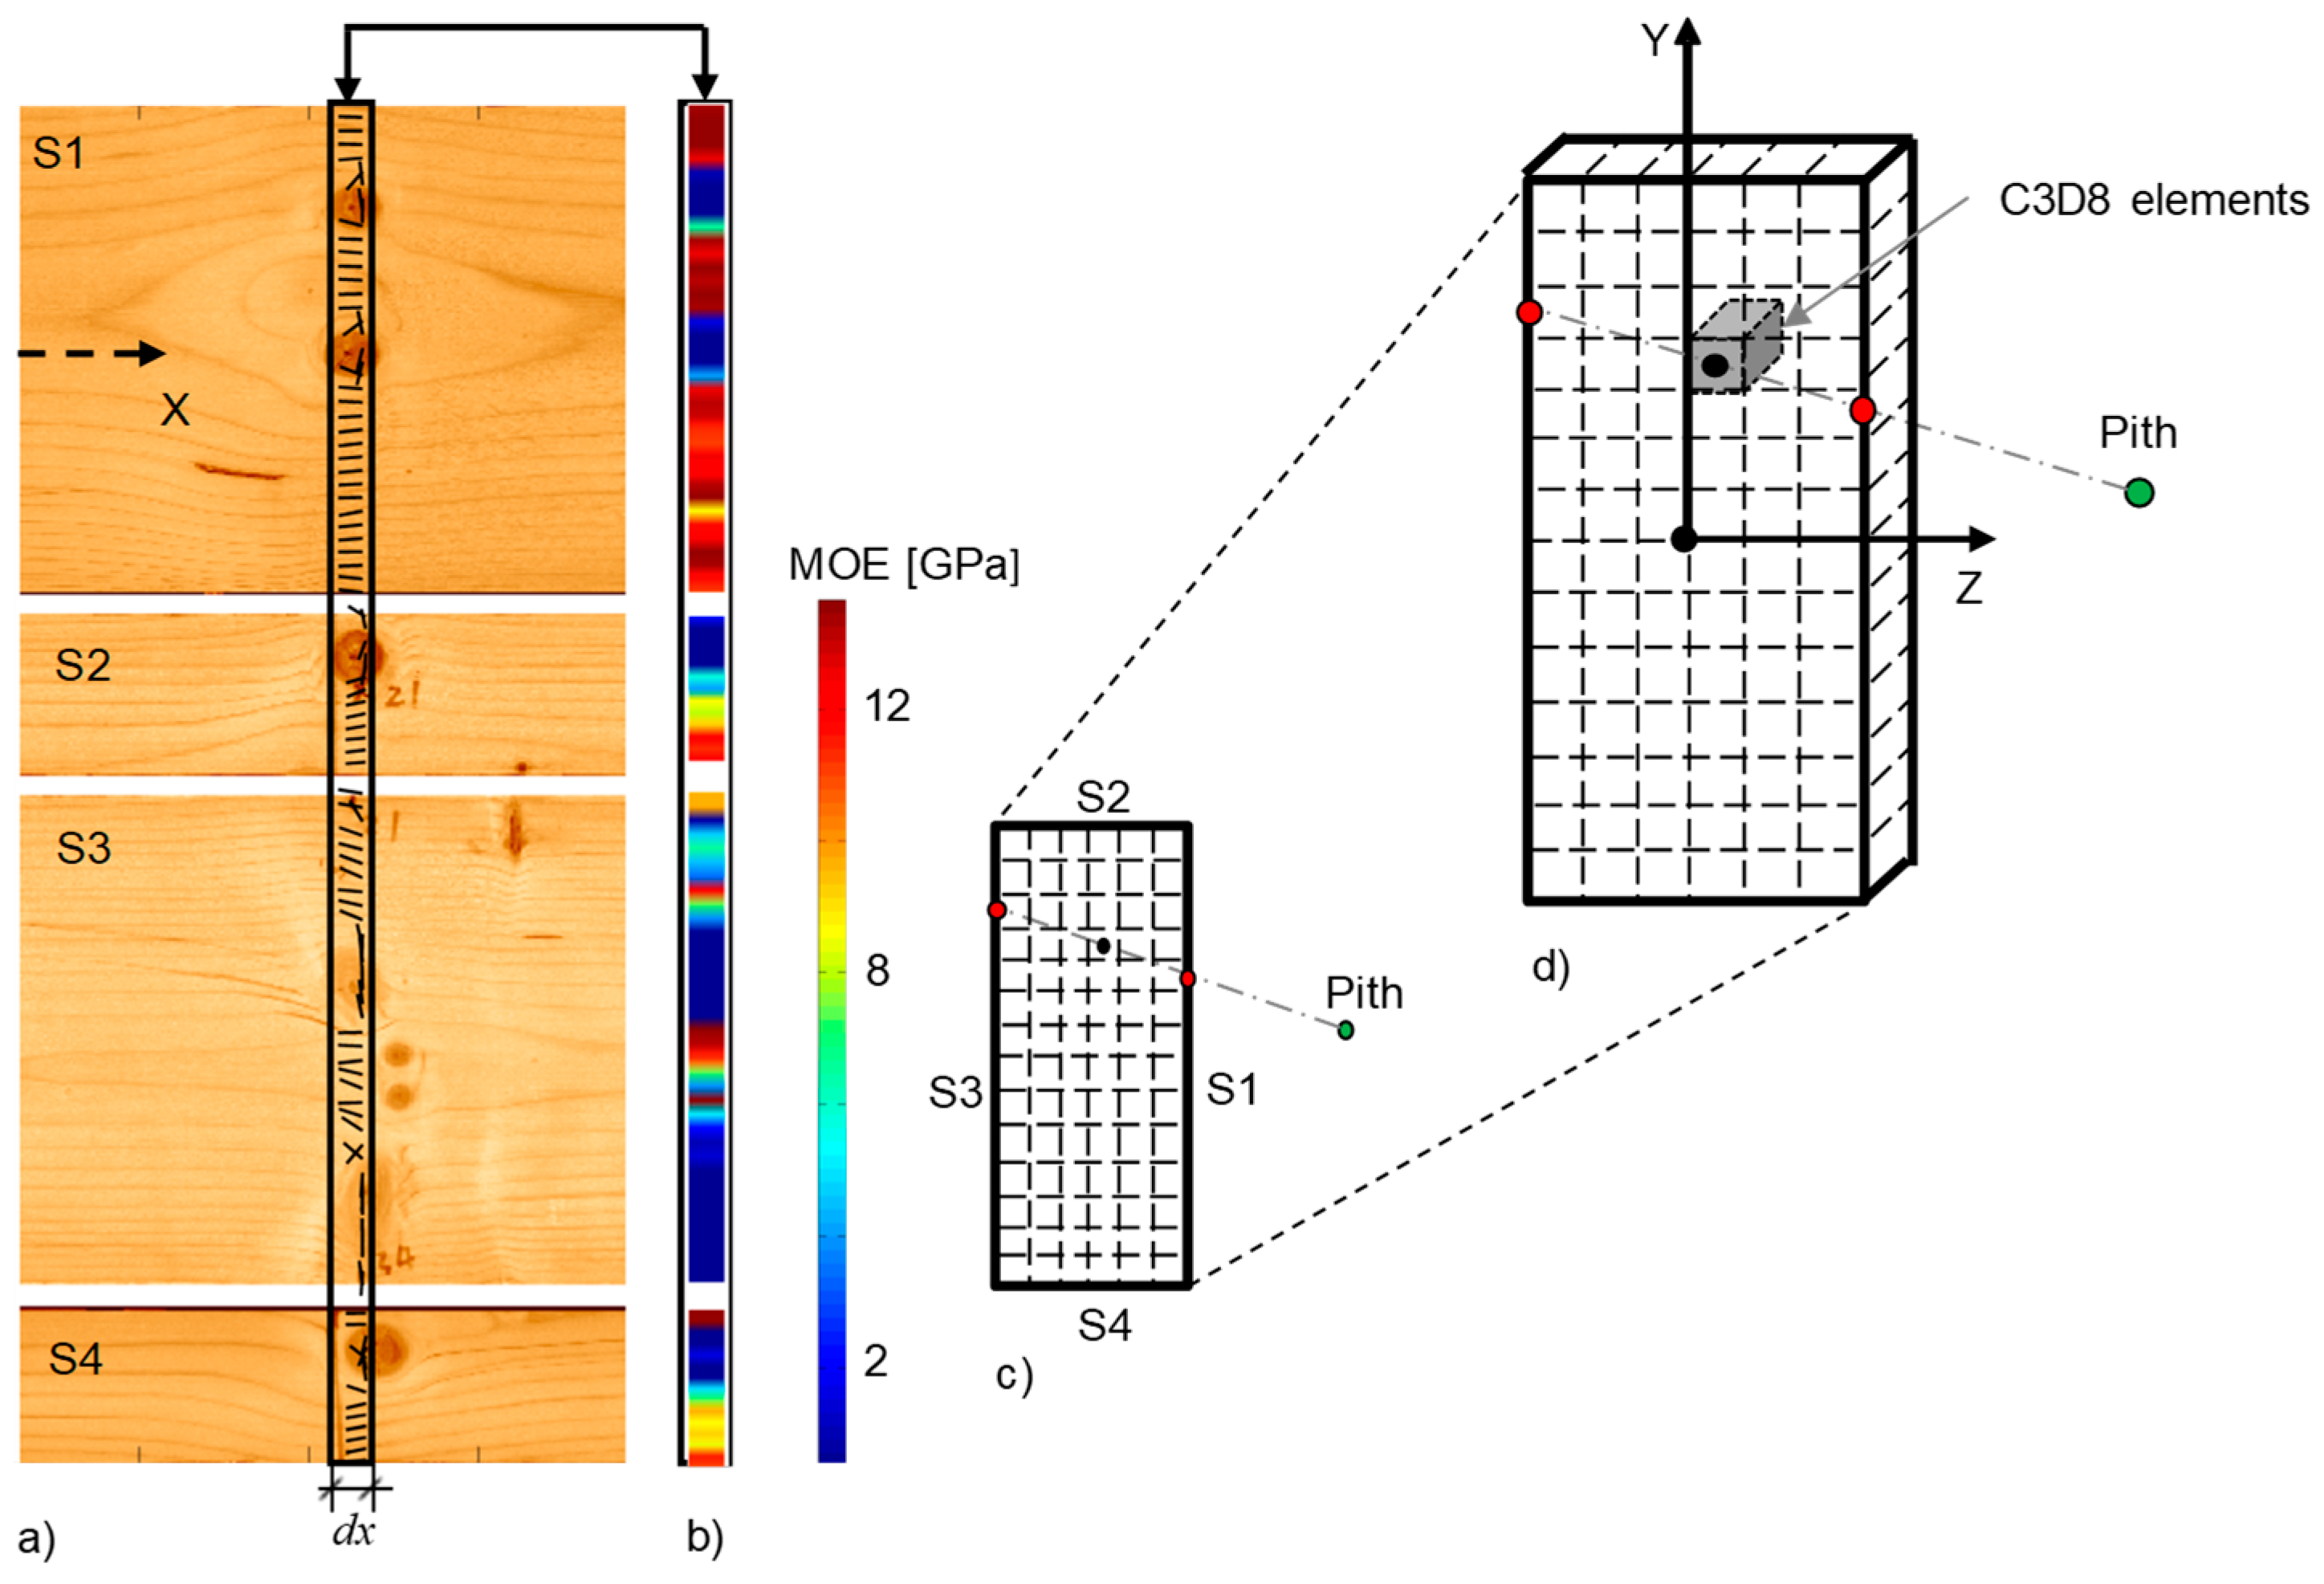
The introductory investigation also consisted of laser scanning of the boards using tracheid effect to obtain knowledge of in-plane fibre orientation on the surfaces. For this purpose, an optical scanner of make WoodEye 5 [7] was used. Boards were fed through the scanner in longitudinal direction, by which a grid of in-plane fibre angles with a resolution of 1.0(x) × 4.4(y) mm was achieved. Such obtained in-plane fibre orientations for a small segment with a length marked as dx are shown in Figure 1a.
2.2. Modelling of Interior Fibre Orientation and Material Properties
The interior fibre angles were determined using a fibre angle model (FAM), which is illustrated in Figure 1c,d. The employed FAM requires knowledge of the location of the pith of the log. The idea is that, taking the location of pith and thus also the direction of knot into account, the interior fibre angles are determined by linear interpolation between the fibre angles on board surfaces.
An orthotropic linear elastic material model with nine parameters were used and a set of nominal parameter values [8] were adopted, see the second row of Table 2. Adjusted values of the six stiffness parameters were then determined for each individual board, by multiplying a specific scaling factor, μ. This factor was determined using the axial frequency. Based on the nominal material parameters and FAM, local Ex(x, y, z) was calculated for every position within the board as shown in Figure 1b. This included transformation of material parameters from the lrt—to the xyz–coordinate system (e.g., [9]). A simple 1-D FE model was created with stiffness as a function of x:
The first axial resonance frequency was calculated by performing eigenvalue analysis on the established 1-D model and μ was calculated as the ratio to the experimentally determined axial resonance frequency.
2.3. FE Modelling
3D FE models of the boards were established and analysed using the commercial softwares MATLAB and ABAQUS. The FE model consisted of 8-node linear brick, full integration elements, i.e., element C3D8 of ABAQUS, see Figure 1d. The element size used was 5 × 5 × 5 mm and a convergence study showed that this element mesh was sufficient for the present purpose. The model of the board comprised the entire length of 4550 mm. Constraints were applied such that the end sections had to remain plane as the board was deformed. A constant bending moment was applied by external bending moments acting at each end of the board. Furthermore, regarding practical implementation, material directions in positions corresponding to the element grid using the FAM were prepared in MATLAB. This data was then imported to ABAQUS via an analysis Input file. Thereafter the FE simulation was carried out using ABAQUS/standard and data of calculated 3D nodal coordinates and corresponding displacements were exported to MATLAB, which enabled post-processing of calculated displacements in MATLAB.
2.4. Laboratory Measurements by DIC
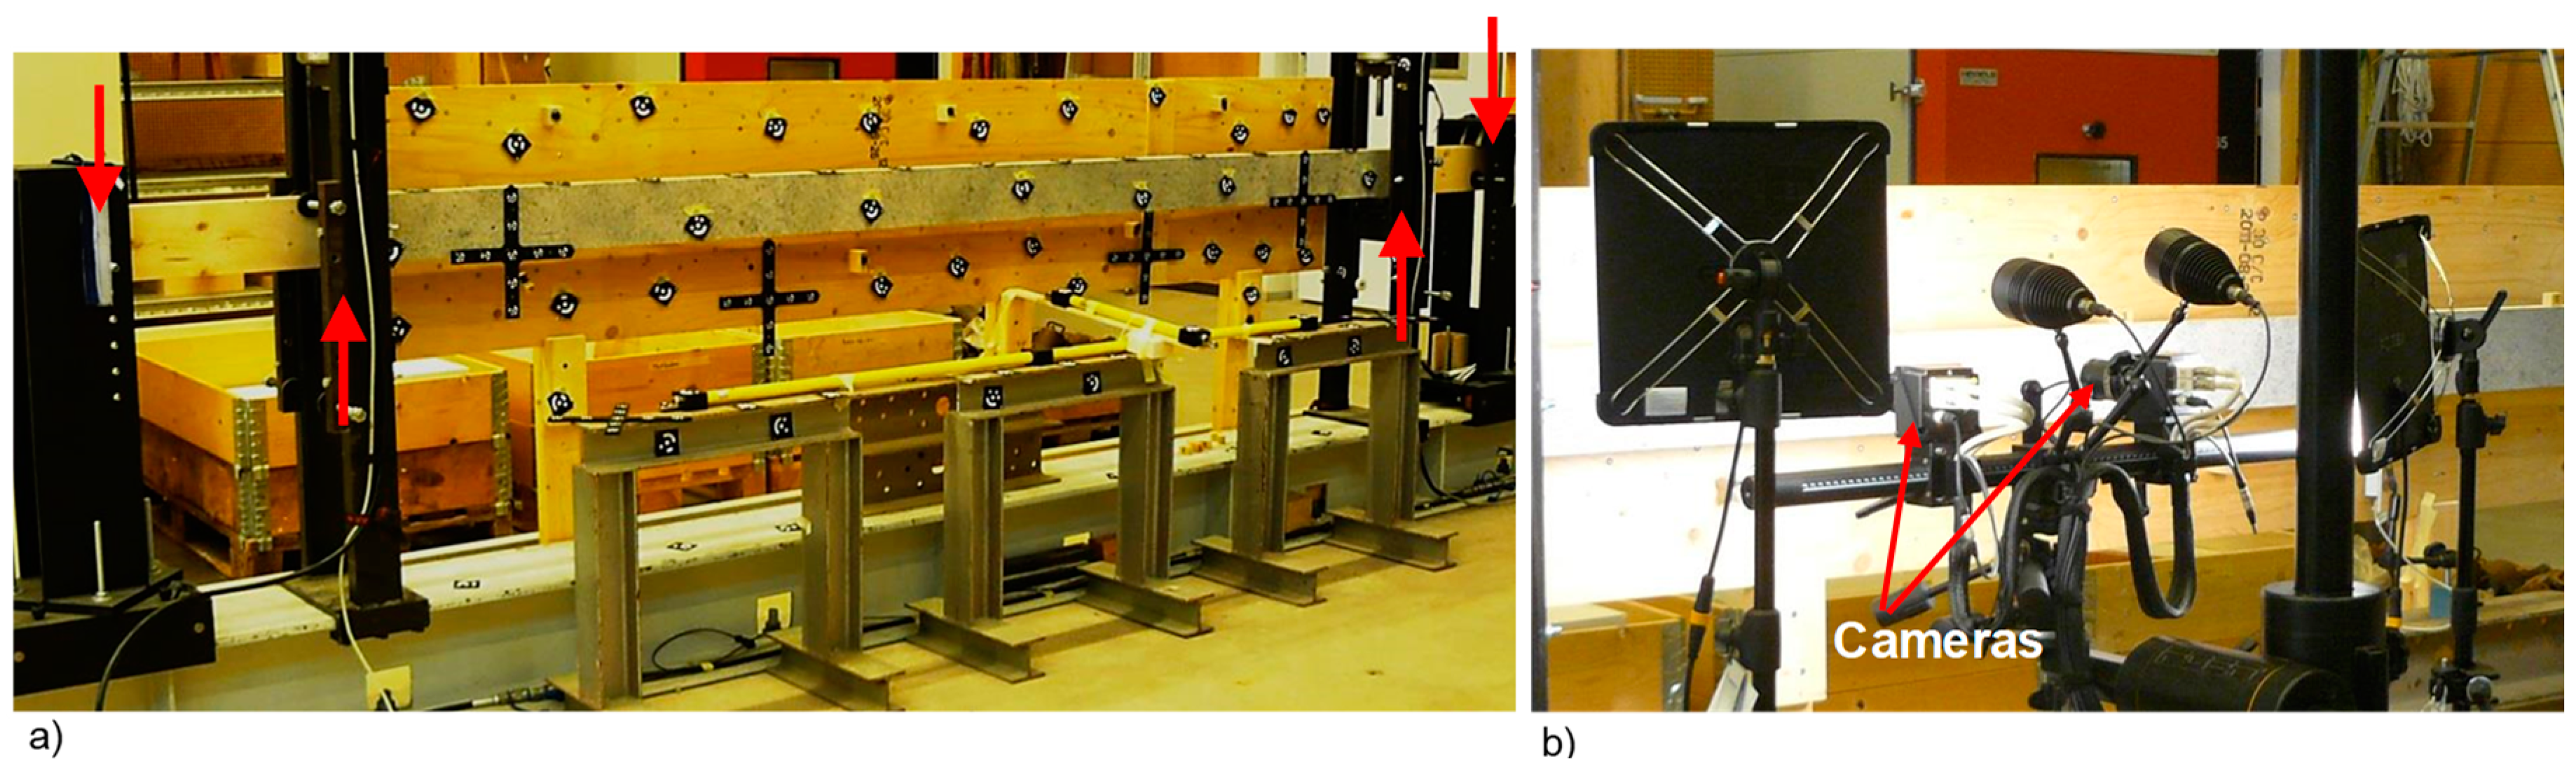
The boards were subjected to four-point bending tests combined with DIC measurements, for which a DIC system of make ARAMIS was used. For the four-point bending, the center span that was 3300 mm long were exposed to the maximum and constant bending moment. Thus, the two wide surfaces of the boards, each having an area of about 145 × 3300 mm, were to be captured by the DIC. To capture the whole surface and ensure high-resolution measurement, each object surface was divided into six subareas for which six individual ARAMIS projects were performed. Another measurement system TRITOP was used to establish a global coordinate system and to relate all the six separate ARAMIS projects to this common global coordinate system. In this way, DIC data with a resolution of about 2.2(x) × 2.6(y) mm was achieved for a board area of 145 × 3300 mm. Figure 2 shows the implementation of the jointed TRITOP and ARAMIS measurements.
2.5. Calculation of Bending MOE
The strain in x-direction from the FE modelling and DIC measurement were used to calculate the local bending MOE based on Euler-Bernoulli beam theory. In order to reduce any noise of the strain field a lower resolution, namely average strains over an area 20 × 20 mm2, was firstly calculated on the basis of the original resolution. Thereafter, the strains were once more averaged over a length of the board, Lr, and used to calculate the local cross sectional bending MOE valid for the chosen board length Lr as:
where M represents the constant bending moment, I is the moment of inertia of the cross section, represents the strains averaged over both area and length, y is arbitrary position on the cross section in question and is the neutral layer position on the cross section where no deformation occur.
3. Results and Discussion
In this section, results regarding strain fields and local bending MOE variation along the boards are presented and discussed. The results are based both on the modelling and on the DIC measurements, and thus the suggested models are verified through comparison of the obtained results. The two wide surfaces of each board are herein denoted as Sa and Sb. Regarding the comparison, similar results are achieved for the two specimens. To keep the paper concise, results presented below are based on specimen B2.
3.1. Strain Distribution
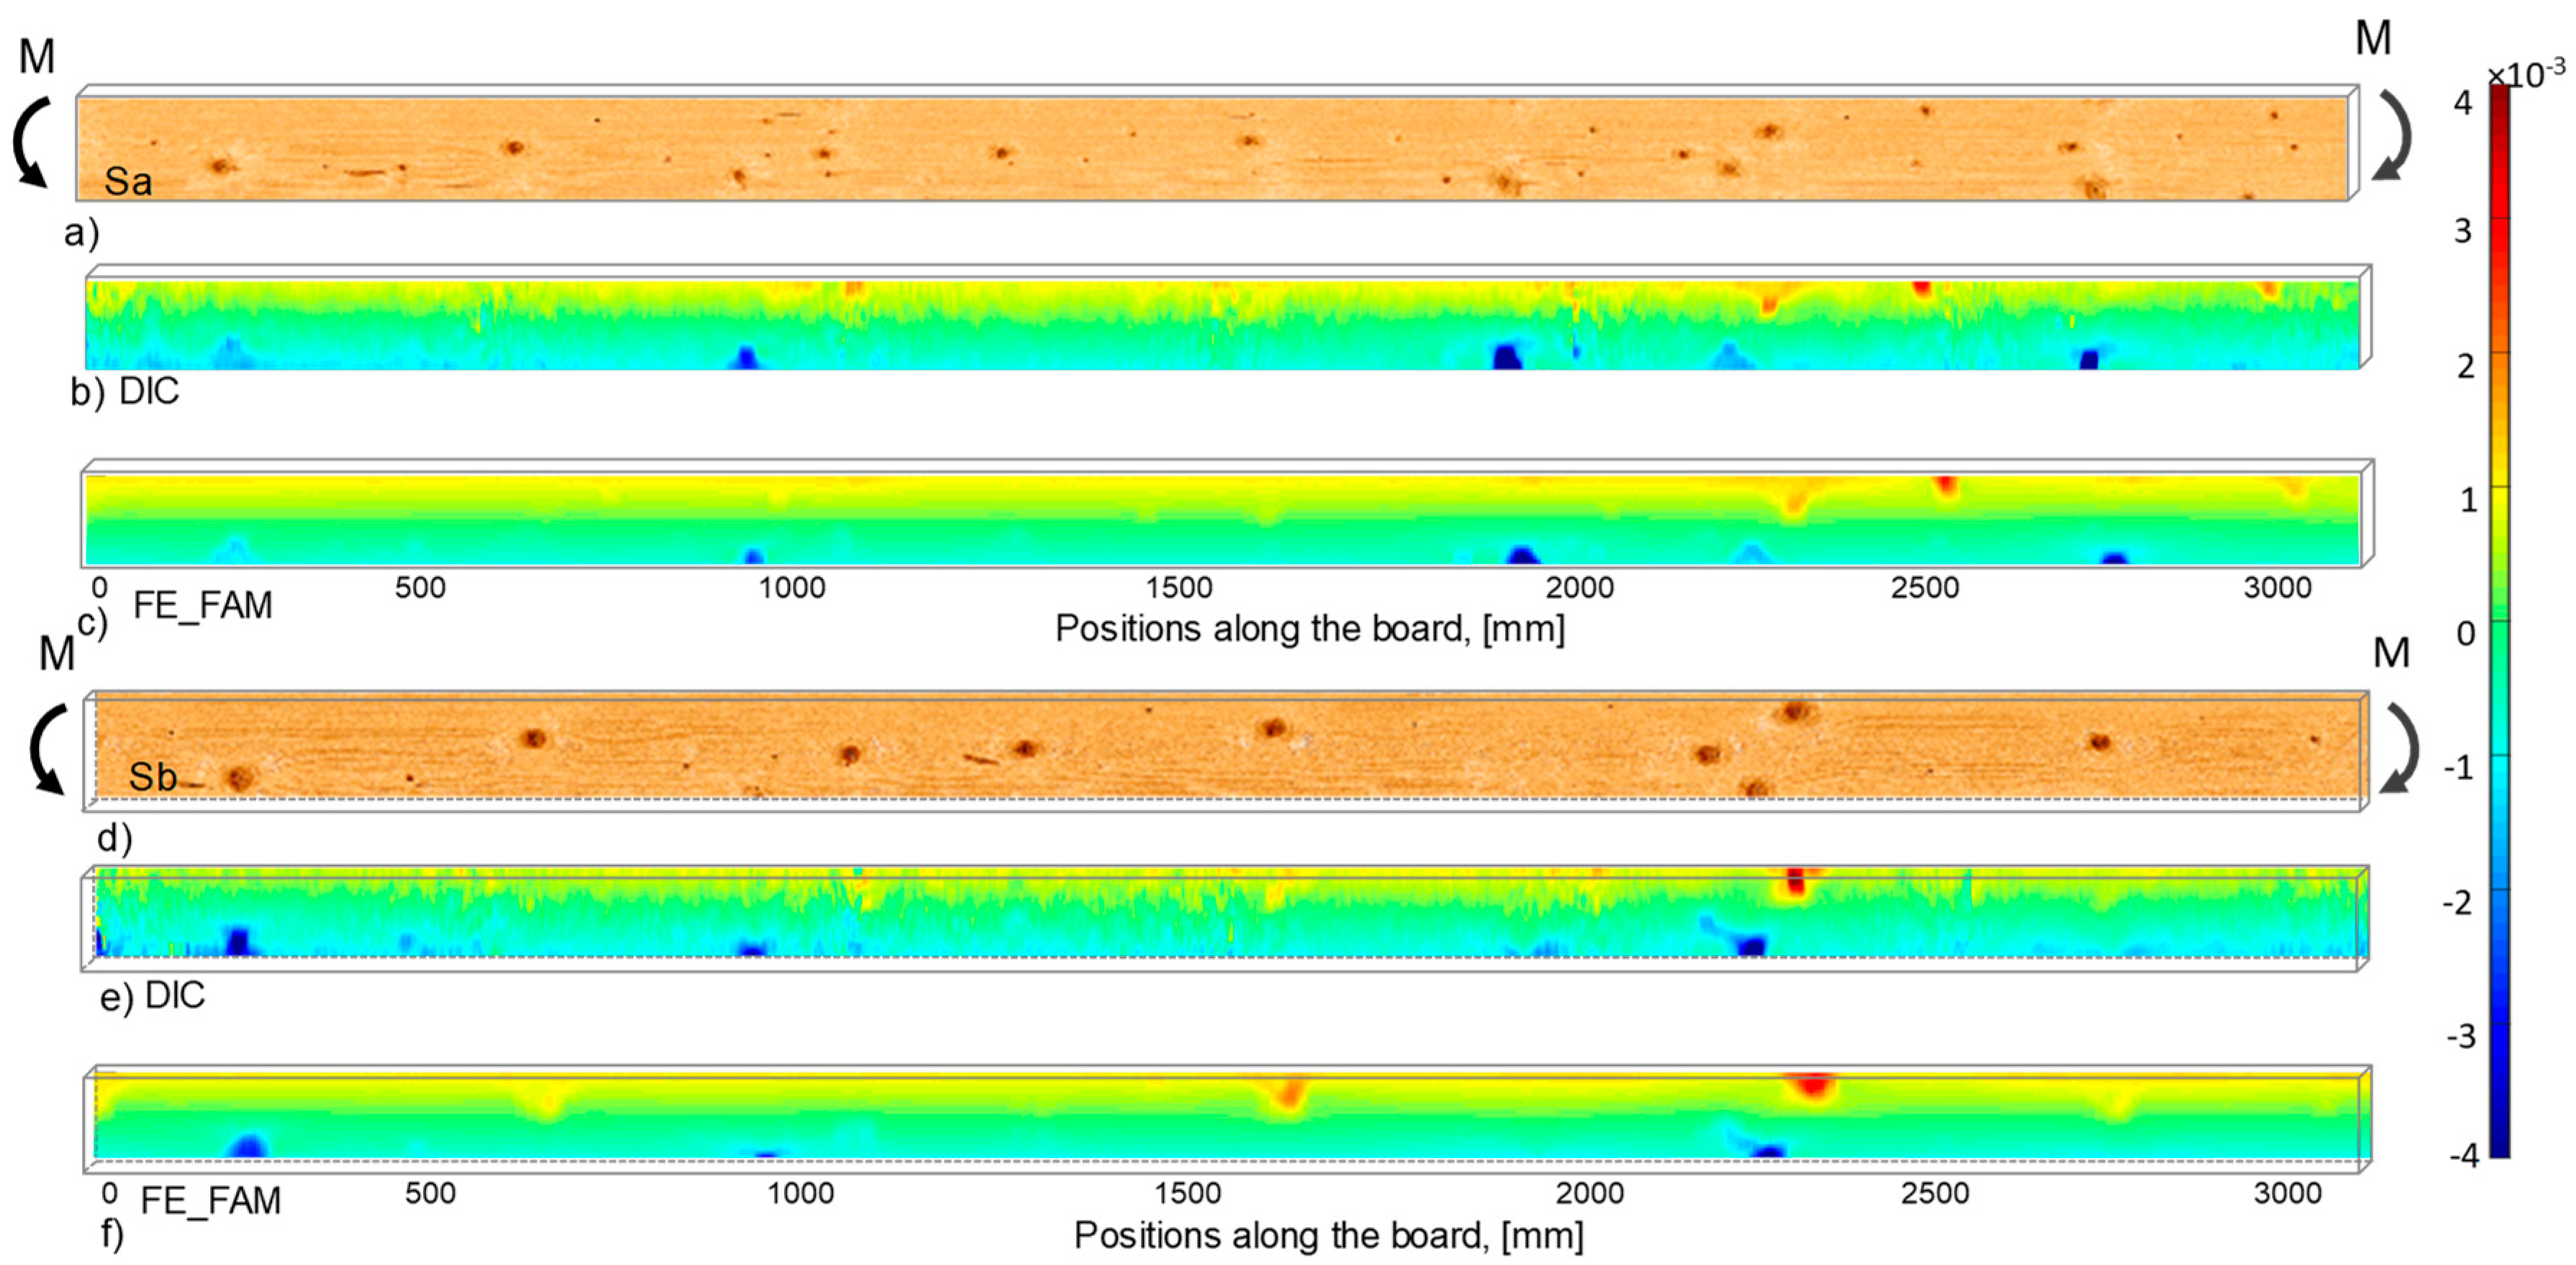
Figure 3 shows the strain results at a nominal stress of about 13.9 MPa at the outermost edge where (a) shows boards surface image of Sa valid for the 3300 mm long part of the board that was exposed to constant bending moment in the laboratory test; and (b) shows the strain distribution valid for the corresponding surface calculated on the basis of displacements of DIC. Figure 3c shows the corresponding strain distribution calculated on the basis of displacements from the FAM and FE simulation. Figure 3d–f show the corresponding surface image and strain distribution of Sb. The strains displayed in Figure 3 are average values over the surrounding area of 20 × 20 mm2 and the strain levels are indicated by the colour bar to the right.
From the board surface images shown in Figure 3, it can be observed that specimen B2 included numerous knots spread all over the board. These knots can be grouped into a number of knot clusters scattered along the board and the sections between are more or less free from knots. When comparing the surface images with the corresponding strain plots, strain concentrations in areas with knots close to the edges emerge very clearly in all the strain plots. Another observation that can be made is that knots located in the middle of the board in the transversal direction do not result in strain concentrations because there is hardly any deformation occurring there in a pure bending condition.
3.2. Bending Stiffness Variation along Boards
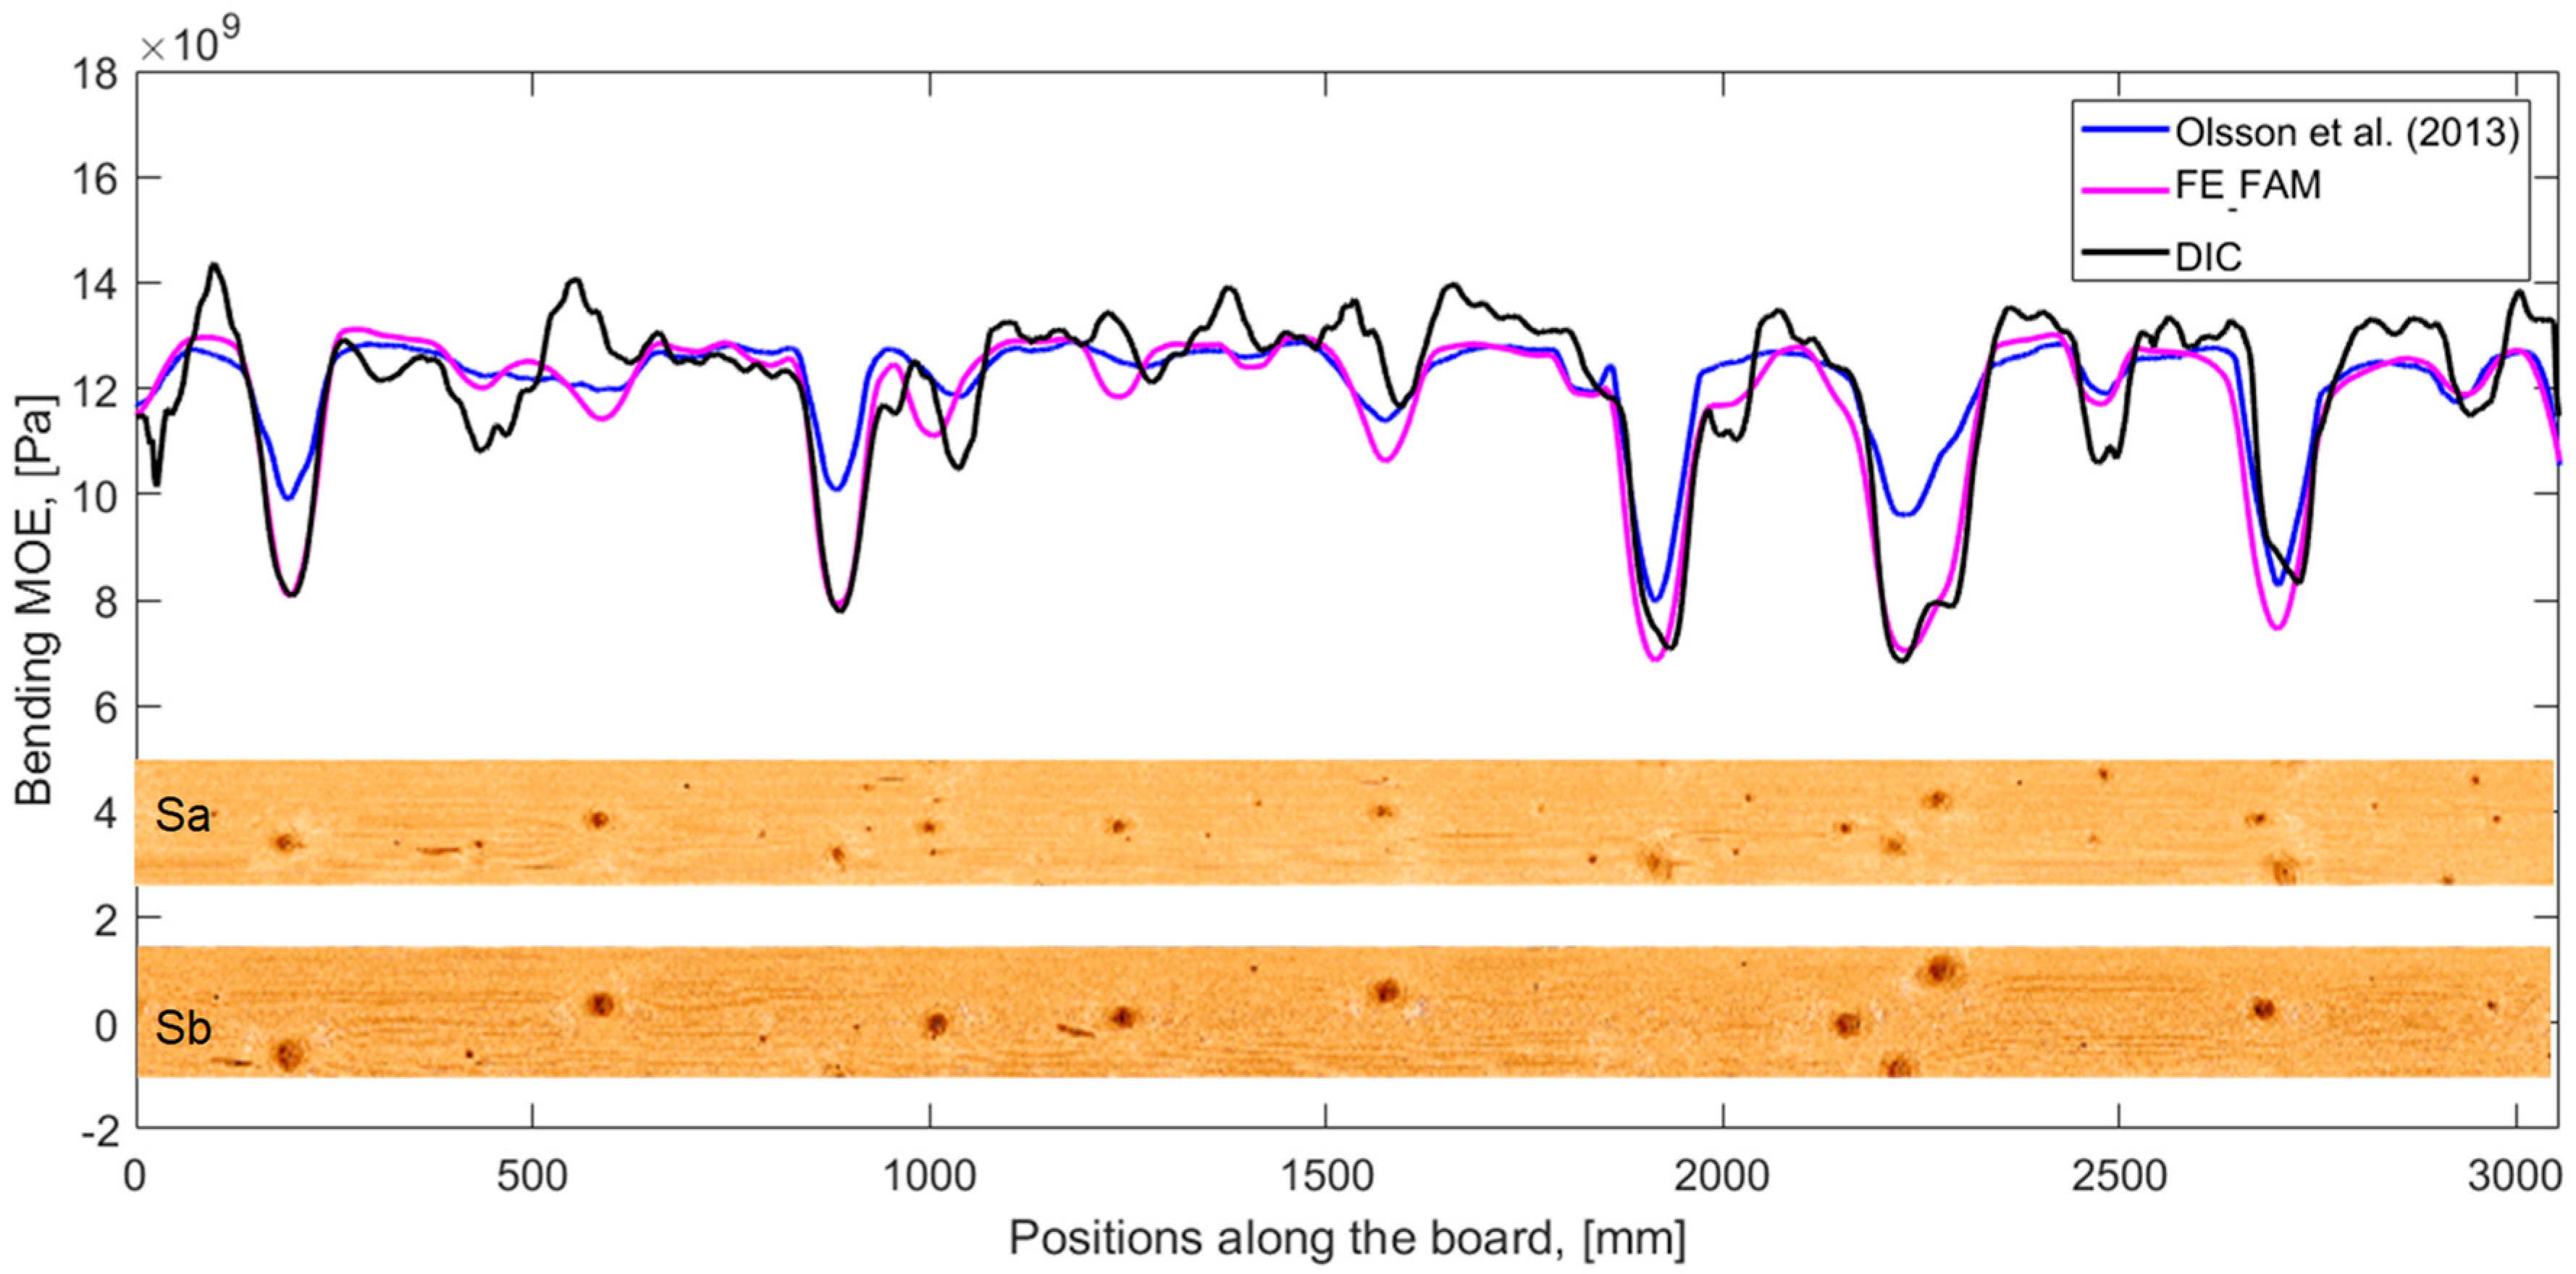
The local bending MOE along the board B2 are presented in Figure 4, in which each value of each of the curves represent a mean bending MOE over a surrounding distance of 50 mm in x-direction. Shown local MOE variations are based on strains that originate from DIC (black curve), and FE_FAM (purple curve). In addition, Figure 4 also includes the local bending MOE (blue curve) calculated using the above-mentioned grading method [5] for a comparison.
The curves displayed in Figure 4 show that the bending MOE drops, indicating weak section of low stiffness, at positions along the board where knots or knot clusters are present on the surface images. Moreover, the depths of the drops depend on the size, number and placement of the knot such that more and bigger knots close to the edges lead to deeper drops. Regarding the position of the weak sections, there is very good agreement between the different curves, but the curves indicate different loss of bending MOE due to the defects. Assuming that the profiles based on data from DIC represent the true bending MOE variation along the board, Figure 4 show that the suggested FE_FAM gives a more accurate representation of the local bending MOE. This is because the FE models capture the reduction of bending MOE more accurately since more compliance including shear deformations were taken into account. The local MOE calculated using the suggested FE_FAM model comply very well with those obtained based on data from DIC.
4. Conclusions
The study showed that the suggested FAM and FE model was able to capture the compliance of boards containing knot clusters in a very similar manner as was indicated by the results obtained from DIC, implying that the models are sufficient to capture the variation of bending MOE along boards. For other purposes, e.g., for prediction of bending stiffness and strength, further improvements may still be necessary.
References
- Hankinson, R. L. Investigation of crushing strength of spruce at varying angles of grain. In Air Service Information Circular; No. 259; U. S. Air Service: Washington, DC, USA, 1921. [Google Scholar]
- Johansson, C.-J.; Boström, L.; Bräuner, L.; Hoffmeyer, P.; Holmquvist, C.; Solli, K.H. Laminations for Glued Laminated Timber—Establishment of Strength Classes and for Visual Strength Grade and Machine Settings for Glulam Laminations of Nordic Origin; SP Report 1998:38; SP Swedish National Testing and Research Institute: Borås, Sweden, 1998. [Google Scholar]
- Matthews, P.C.; Beech, B.H. Method and Apparatus for Detecting Timber Defects. U.S. Patent No. 3976384, 24 August 1976. [Google Scholar]
- Soest, J.; Matthews, P.C.; Wilson, B. A simple optical scanner for grain defects. In Proceedings of the 5th International Conference on Scanning Technology and Process Control for the Wood Products Industry, Atlanta, GA, USA, 25−27 October 1993. [Google Scholar]
- Olsson, A.; Oscarsson, J.; Serrano, E.; Källsner, B.; Johansson, M.; Enquist, B. Prediction of timber bending strength and in-member cross-sectional stiffness variation on the basis of local wood fibre orientation. Eur. J. Wood Prod. 2013, 71, 319–333. [Google Scholar] [CrossRef]
- Olsson, A.; Oscarsson, J. Strength grading on the basis of high resolution laser scanning and dynamic excitation: A full scale investigation of performance. Eur. J. Wood Prod. 2017, 75, 17–31. [Google Scholar] [CrossRef]
- WoodEye, AB. Available online: http://woodeye.se/en/ (accessed on 4 October 2017).
- Dinwoodie, J.M. Timber: Its Nature and Behaviour; E & FN Spon, New Fetter Lane: London, UK, 2000; p. 109. [Google Scholar]
- Ormarsson, S. Numerical Analysis of Moisture-Related Distortions in Sawn Timber; Publication 99:7; Chalmers University of Technology: Gothenburg, Sweden, 1999. [Google Scholar]
Figure 1.
Illustration of the modelling scheme: (a) An image of a piece of a board’s surface consisting of all four surfaces denoted as S1-4; the dashed arrow shows the global x-direction; a small segment with a length marked as dx is highlighted and the corresponding in-plane fibre orientation by the tracheid effect scanning is indicated. (b) The local Ex variation, valid for the segment as in (a), was obtained by the material property transformation based on the fibre orientation. The same procedure indicated by (a,b) was also done for the interior of boards using a fibre angle model shown in (c,d).
Figure 2.
The test setup of the bending test combined with DIC: (a) Arrangement of the TRITOP measurement in which dedicated markers were used; (b) The ARAMIS measurement, for which the ARAMIS system was placed at six positions along the boards.
Figure 2.
The test setup of the bending test combined with DIC: (a) Arrangement of the TRITOP measurement in which dedicated markers were used; (b) The ARAMIS measurement, for which the ARAMIS system was placed at six positions along the boards.
Figure 3.
The strain distribution obtained for board B2: (a) Board surface image of Sa valid for the part which was exposed to the constant bending moment in the bending test; (b) The strain field valid for the surface in (a) and calculated using the DIC data; (c) The strain field valid for the surface in (a) and calculated using the FE and FAM; (d–f) The corresponding surface image and strain distribution valid for surface Sb.

Figure 4.
Bending MOE variation along board B2 obtained using data of DIC (black curve), the suggested FE_FAM (purple curve) and the grading method in [5] (blue curve). Each value on the curves represents the average bending MOE over a distance of 50 mm. The two images are the surface images of Sa and Sb.

Table 1.
Board dimension, density, axial frequency, dynamic MOE and pith location of the investigated boards.
Table 1.
Board dimension, density, axial frequency, dynamic MOE and pith location of the investigated boards.
| Board Properties | Value | |
|---|---|---|
| B1 | B2 | |
| Dimension, [mm] | 45 × 145 ×4550 | 45 × 145 ×4550 |
| Board density, ρ [kg/m3] | 458 | 464 |
| Axial frequency, fa1 [Hz] | 548 | 559 |
| Dynamic MOE, Edyn [GPa] | 11.4 | 12.0 |
| Pith location (y, z) [mm] 1 | (−3.5, 77.5) | (−7.5, 41.5) |
1 Coordinates according to the coordinate system defined in Figure 1.
Table 2.
Material parameters employed in this study, of which the nominal values originate from [8].
Table 2.
Material parameters employed in this study, of which the nominal values originate from [8].
| Parameter | |||||||||
|---|---|---|---|---|---|---|---|---|---|
| Nominal values | 10,700 | 710 | 430 | 500 | 620 | 24 | 0.025 | 0.31 | 0.38 |
| Adjusted values | 10,700 µ | 710 µ | 430 µ | 500 µ | 620 µ | 24 µ | 0.025 | 0.31 | 0.38 |
Publisher’s Note: MDPI stays neutral with regard to jurisdictional claims in published maps and institutional affiliations. |
© 2018 by the authors. Licensee MDPI, Basel, Switzerland. This article is an open access article distributed under the terms and conditions of the Creative Commons Attribution (CC BY) license (https://creativecommons.org/licenses/by/4.0/).
Share and Cite
MDPI and ACS Style
Hu, M.; Olsson, A.; Johansson, M.; Oscarsson, J. Modelling Local Bending Stiffness of Norway Spruce Sawn Timber Using Scanned Fibre Orientation. Proceedings 2018, 2, 505. https://doi.org/10.3390/ICEM18-05426
AMA Style
Hu M, Olsson A, Johansson M, Oscarsson J. Modelling Local Bending Stiffness of Norway Spruce Sawn Timber Using Scanned Fibre Orientation. Proceedings. 2018; 2(8):505. https://doi.org/10.3390/ICEM18-05426
Chicago/Turabian StyleHu, Min, Anders Olsson, Marie Johansson, and Jan Oscarsson. 2018. "Modelling Local Bending Stiffness of Norway Spruce Sawn Timber Using Scanned Fibre Orientation" Proceedings 2, no. 8: 505. https://doi.org/10.3390/ICEM18-05426