On the Material Characterization of an Aluminium Alloy Using Different Specimens and Identification Methods †

1
Structural Impact Laboratory (SIMLab), Department of Structural Engineering, Norwegian University ofScience and Technology (NTNU), NO-7491 Trondheim, Norway
2
Centre for Advanced Structural Analysis (CASA), NTNU, NO-7491 Trondheim, Norway
*
Author to whom correspondence should be addressed.
†
Presented at the 18th International Conference on Experimental Mechanics, Brussels, Belgium, 1–5 July 2018.
Proceedings 2018, 2(8), 400; https://doi.org/10.3390/ICEM18-05237
Published: 19 May 2018
(This article belongs to the Proceedings of The 18th International Conference on Experimental Mechanics)
Abstract
:The validity of material properties obtained from uniaxial tension tests using different specimen types and measurement techniques is investigated in this paper. Four different specimen geometries were tested, including round axisymmetric and rectangular flat samples of different sizes. This gave a significant variation in both size and shape of the specimens. The specimens were strained in tension to fracture, and different measurement techniques were applied to measure the deformation of the specimens during loading. This involved an extensometer, a laser micrometre, digital image correlation (DIC) and edge tracing. Cauchy stress versus logarithmic strain curves were obtained from the experimental data, and little spread was seen between the different test series. The data were further used to calibrate a work-hardening relation for the material, and it was found that the fitted curves differed mainly for strains beyond diffuse necking.
1. Introduction
The uniaxial tension test is by far the most used material test for providing information about the mechanical properties of metallic materials required for finite element simulations [1]. But, the tension test specimen comes in many different shapes and sizes depending on the problem and material at hand, and there exists a variety of measuring and calibration techniques. During testing, the specimen is subjected to a linearly increasing displacement while simultaneously recording the applied force and the elongation of the gauge area. Based on these measurements the engineering stress-strain curve until necking can be constructed, and this forms the basis for a direct calibration of material parameters. However, during the last decade advances in both computer technology and digital cameras have made various optical field-measuring techniques increasingly popular for identification of material properties. One such method is digital image correlation (DIC), which is a full-field image analysis technique based on grey value digital images (see e.g., [2]). DIC can be used to determine the contour and displacement field of an object under loading in both two and three dimensions. If DIC is combined with the finite element method (FEM), a powerful tool in obtaining optimized material properties based on rather simple material tests becomes available [3].
In this study, the main objective is to examine the validity of the material properties obtained using different measurement techniques and specimen types. Multiple tension tests were performed on the aluminium alloy AA6061, which was cast and homogenized before heat-treated to temper T6. Four different geometries of the tension test specimen were chosen, providing a significant variation in both shape and size. The selected specimens made it possible to compare round with flat, and small with large, samples. The measurement techniques used included a laser micrometre, 2D-DIC, edge tracing available in the DIC software and extensometers, depending on the specimen geometry.
From these measurements, Cauchy (true) stress versus logarithmic strain curves were obtained (also after necking), providing a basis for a direct calibration of the work-hardening parameters. The obtained material parameters found from the different specimen types and measurement techniques were finally validated against each other. The main conclusion from the study is that no significant influence of specimen type or measuring technique was observed on the true stress versus logarithmic strain curves before necking. However, acquiring experimental data also after necking is important in order to have a good representation of the material response until fracture.
2. Experimental Study
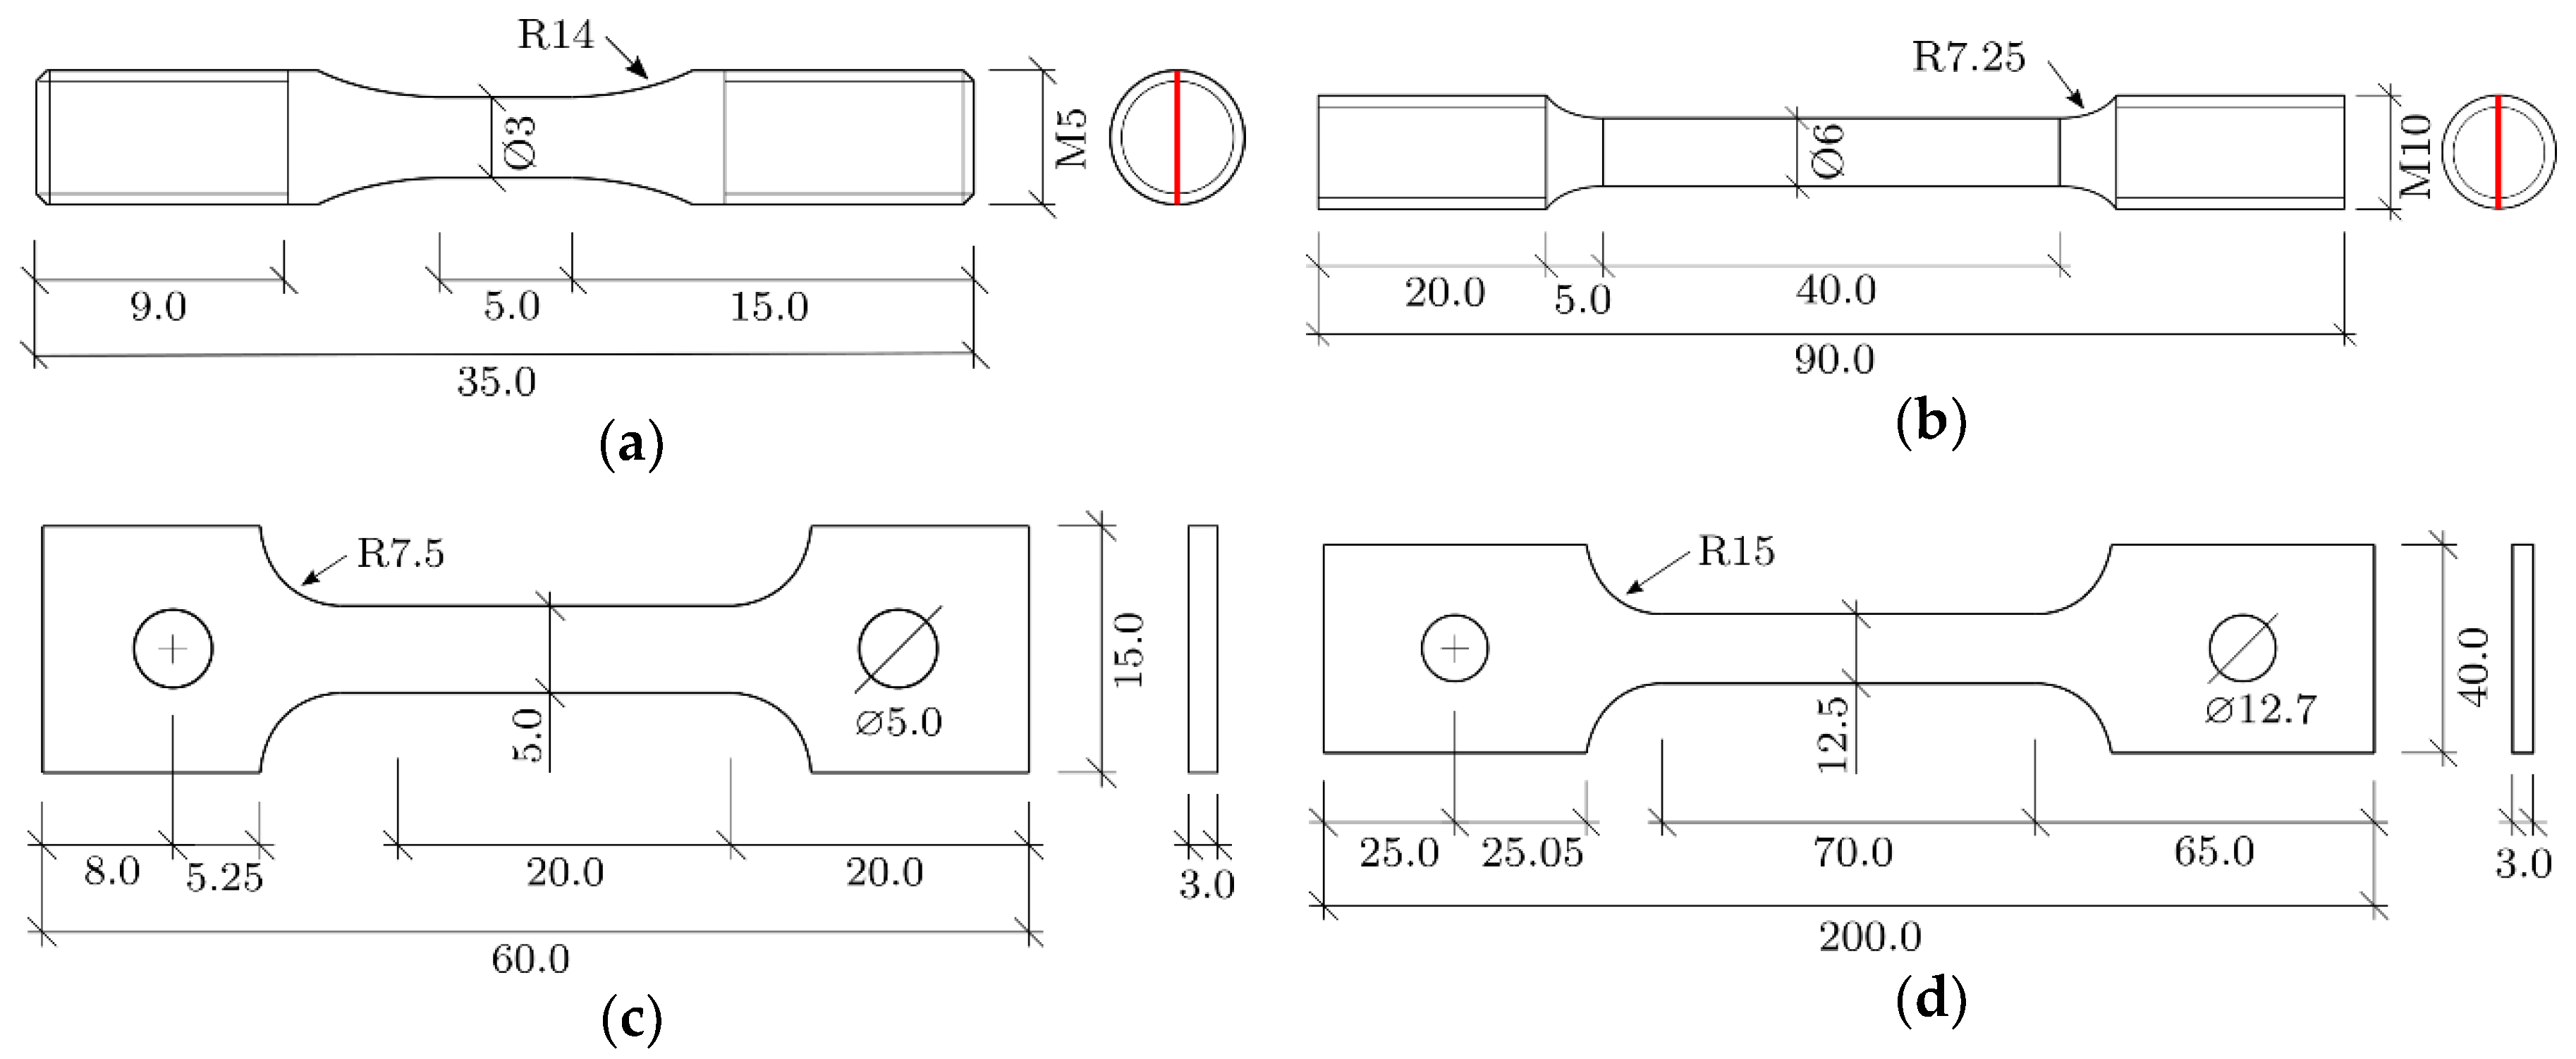
The geometry of the four different tension test specimens chosen for this study is shown in Figure 1. For both the round and the flat specimens, one large and one small specimen type were used. Note that the UT35 specimen has the same geometry as the one used for dynamic tension tests in the Split-Hopkinson tension bar (SHTB) [4]. The specimens were machined from a billet of the aluminium alloy AA6061 that had been cast and homogenized before being heat-treated to temper T6. The tensile axis of the specimens coincided with the length direction of the billet, and the material is assumed isotropic in the cast and homogenized condition.
All tests were performed using an Instron 5982 L2935 universal testing machine with a 30 kN load cell. Table 1 shows the experimental programme for this study. In all of the nine test series, three repeat tests were conducted. The crosshead velocity was varied in order to achieve an initial strain rate of approximately in all the specimens, corresponding to quasi-static conditions. Four different measurement techniques were applied, and a brief introduction is given below.
The extensometer is one of the traditional measuring techniques, and has been widely used in mechanical testing [1]. The particular extensometer used in these tests is a contact type that is clipped onto the specimen. It provides the elongation between two points in the gauge area. The data obtained with the extensometer are only valid until diffuse necking of the specimen as the deformation is not uniform after this point.
The introduction of laser micrometres made non-contact measurements available. The laser micrometre provides continuous measurements of the current diameter of the specimen all the way to fracture. In this study, an AEROEL XLS 13XY laser micrometre with 1 µm resolution was used [5]. Here, two perpendicular laser beams, each measuring 13 × 0.1 mm2, are projected towards two detectors on the opposite side of the specimen. To ensure that the smallest diameter was measured at all times the laser was mounted on a mobile frame that was free to move vertically.
Advances in both computer technology and digital cameras over the last decades have been an important factor for the emergence of various optical field-measuring techniques. One of them is DIC, a non-contact optical measuring technique that employs tracking and imaging for determining the surface deformation of a specimen [2]. In this study, an in-house 2D-DIC code implemented in the software eCorr [6] was used for measuring the surface displacement of the flat specimens. By defining a vector on the specimen surface, the program provides its elongation in a similar way as by using an extensometer.
Another feature implemented in eCorr is the edge tracing technique [7]. Here, the gradient in grey scale value of the specimen towards the background is used to define the edge of the specimen, which obviously requires good contrast to achieve accurate results. This technique serves as an optical alternative to the laser micrometre, and provides the user with the same measurements. However, it has the advantage that the whole gauge area is registered during deformation.
3. Experimental Results
Measurements of the force and diameters in two perpendicular directions, denoted and , were provided from the round samples using either a laser micrometre or edge tracing. As these test specimens were axisymmetric, the initial and current cross-section area were calculated from and , respectively, where is the initial diameter of the specimen. The true stress and the logarithmic strain were further calculated as
It should be noted that the true stress and logarithmic strain are average values over the minimum cross-section of the specimen after diffuse necking, and that plastic incompressibility and small elastic strains were assumed in order to obtain the logarithmic strain.
For the tests instrumented by either extensometer or DIC, the elongation between two points in the gauge area was provided, along with the force measurements. The engineering stress and the engineering strain were calculated using and , respectively, where is the initial gauge length. The initial area was calculated by for the rectangular specimens. Here, is the initial width and is the initial thickness of the cross-section. These values were further used to find the true stress and the logarithmic strain through the relations
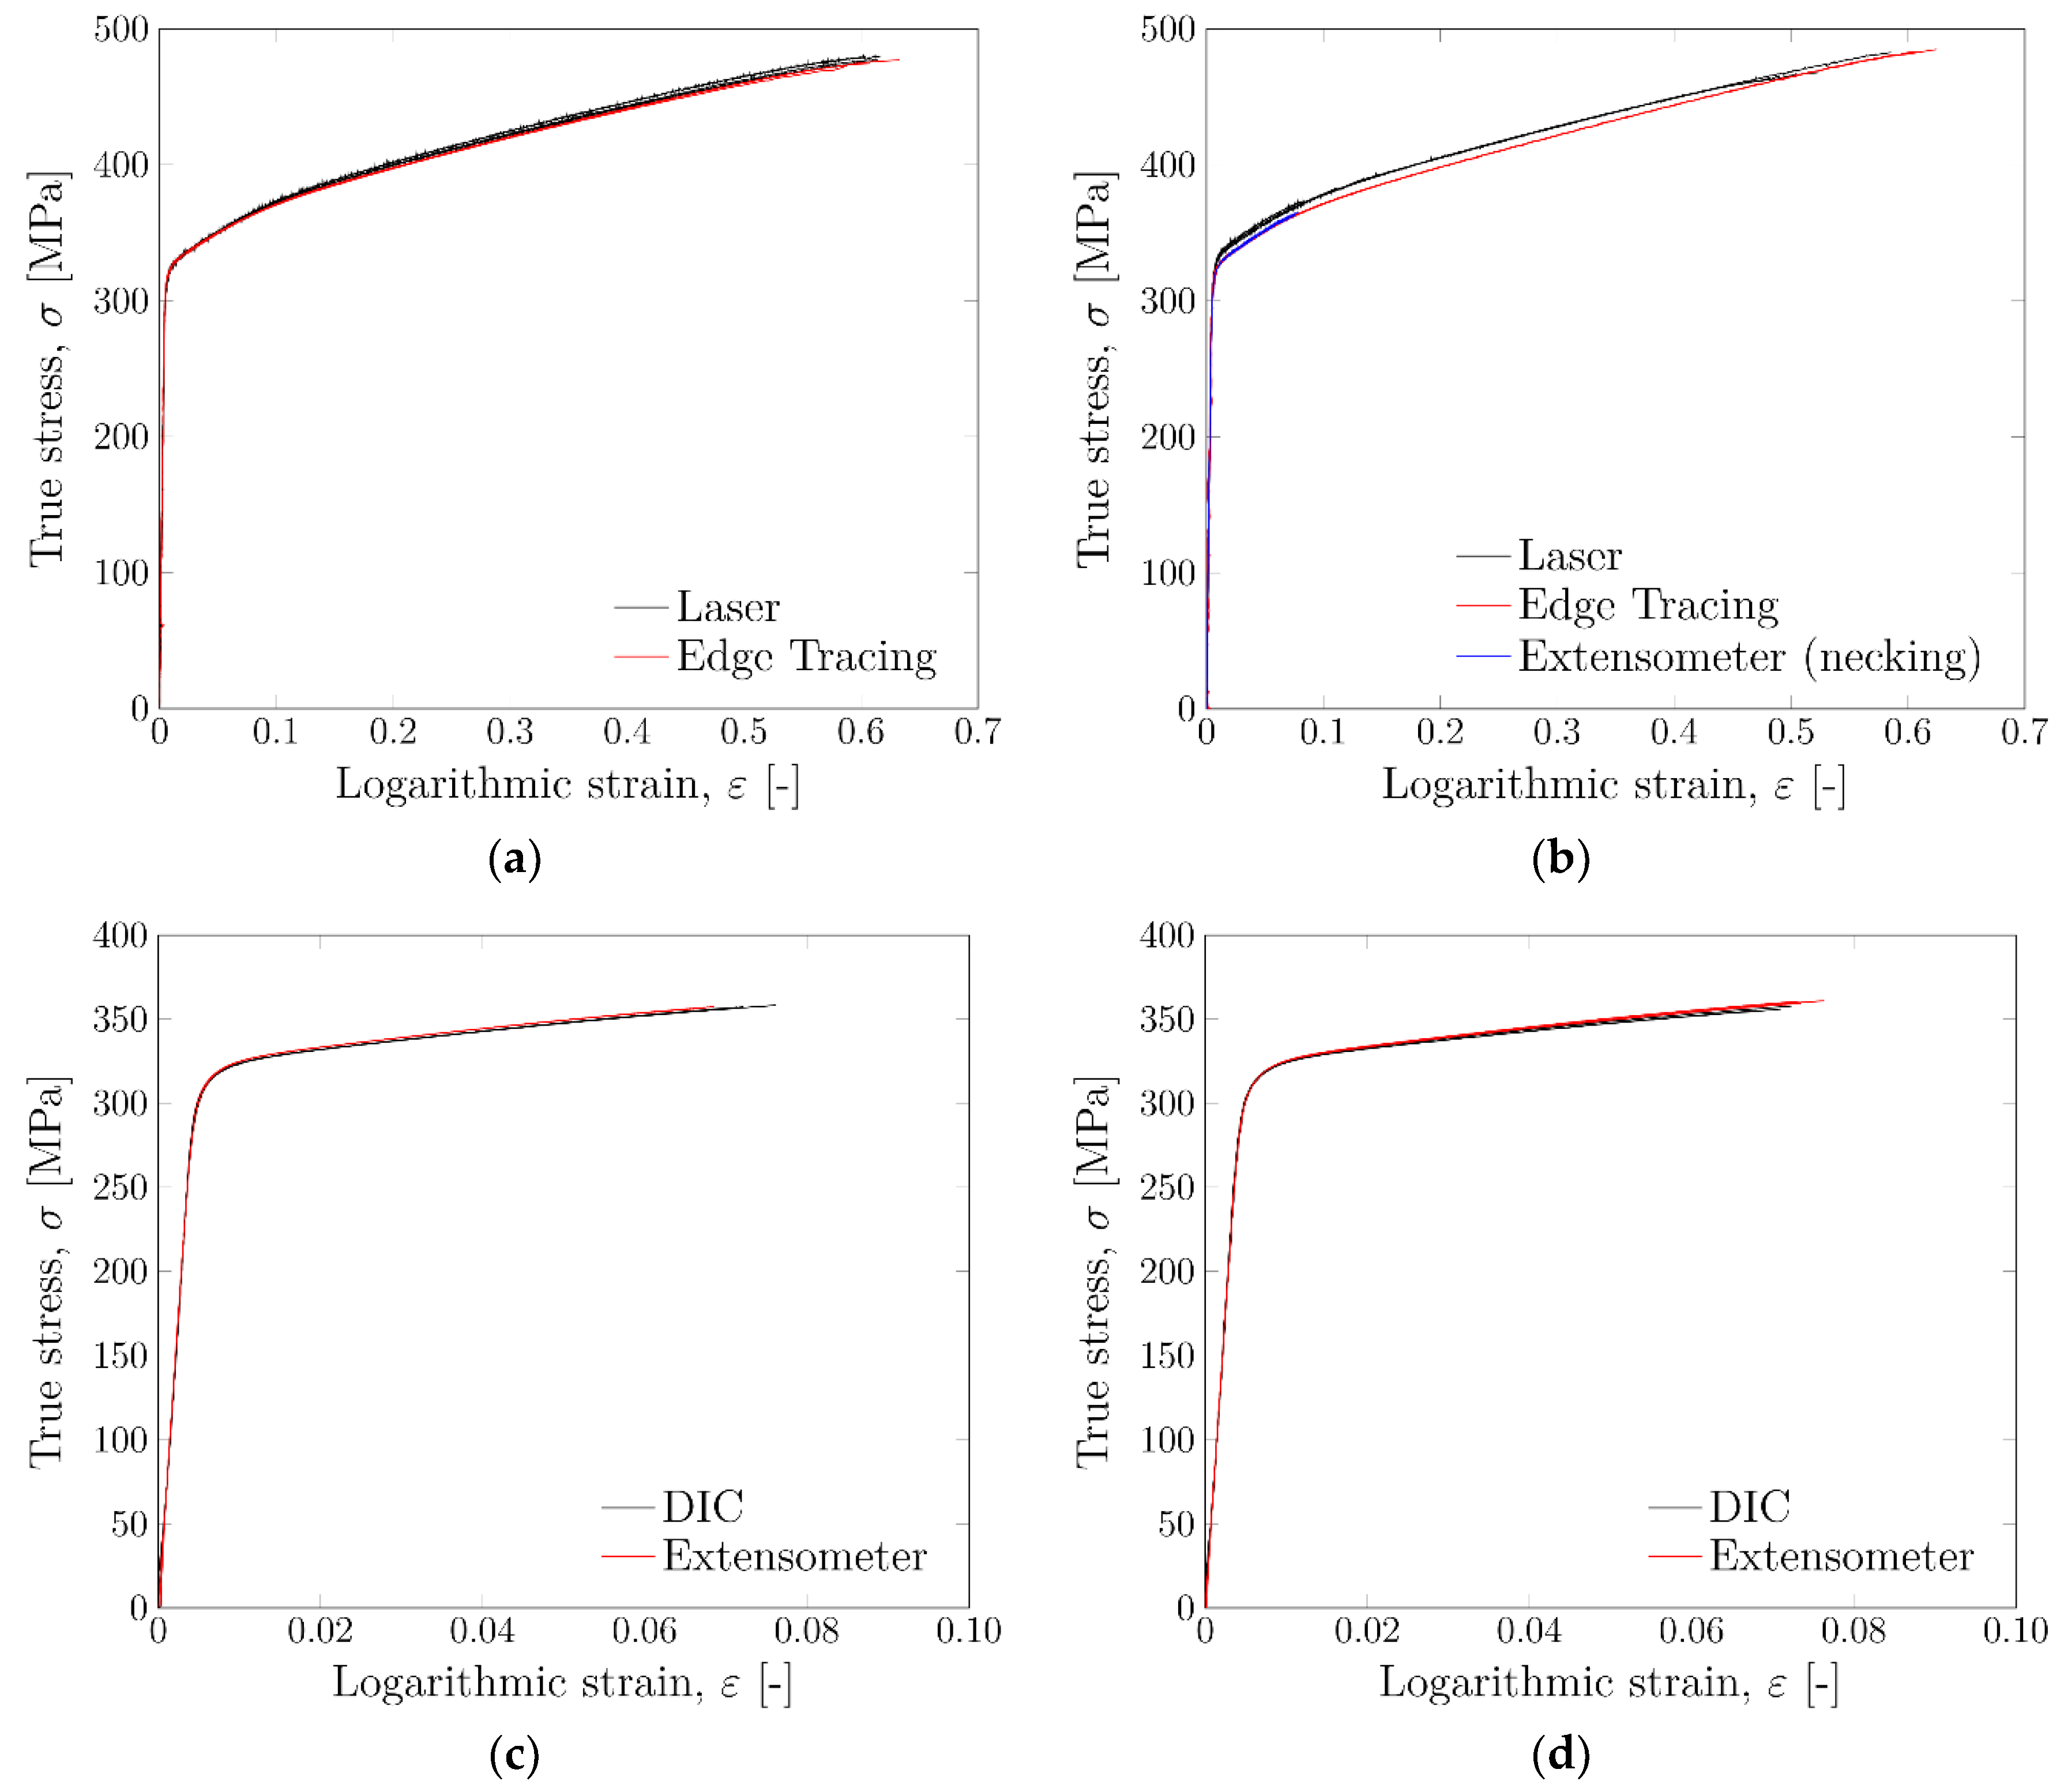
Figure 2 compares the true stress versus logarithmic strain curves for each specimen type separately. This makes it possible to compare the measurement techniques used for each specimen type. Little deviation is seen between the repeat tests and the measurement techniques applied for each specimen type. For the UT90 specimen, the tests instrumented with the laser micrometre deviate slightly from the other tests. The specimens used for these tests were machined from another billet of the same batch, and this is believed to be the main cause of the deviation seen.
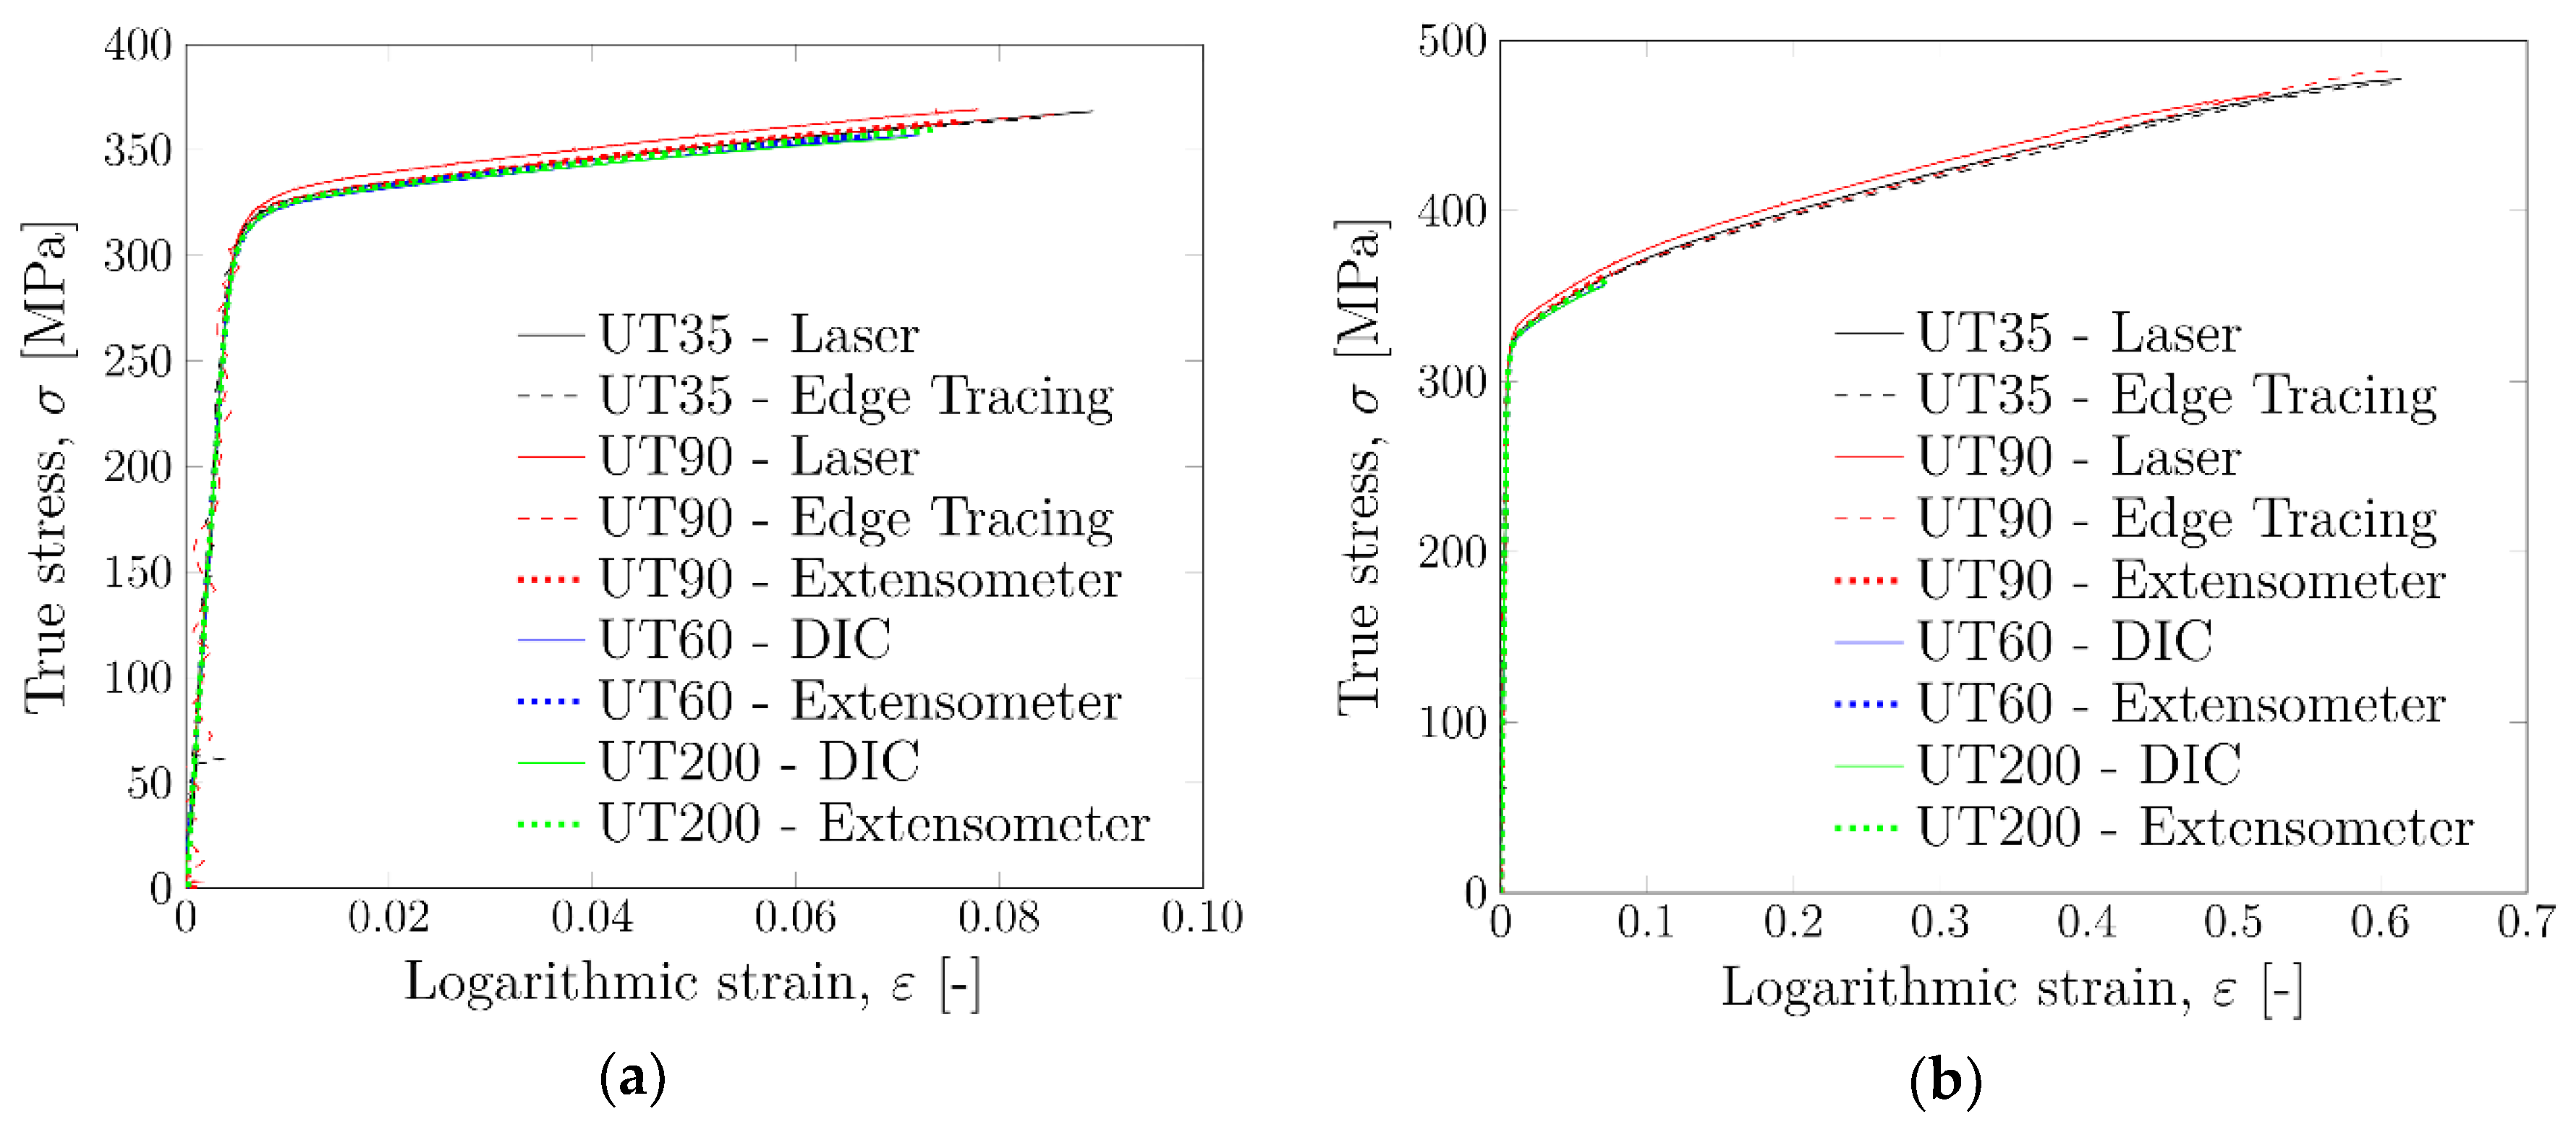
A representative test from each test series is presented in Figure 3 and it is observed that the different specimen types provide more or less the same curve. Some deviations are seen in both strain to necking and strain to failure, but these are minor. Note also that it was difficult to measure strains in the elastic region using edge tracing, and considerable oscillations were observed.
4. Calibration of Work-Hardening Relation
To parameterise the work-hardening curve, a three-term Voce rule was used, given by
Here, is the equivalent stress, is the equivalent plastic strain, and are model constants to be fitted. The calibration of the model constants was performed using the experimental true stress versus logarithmic strain curves shown in Figure 3. To calibrate the constants the equivalent stress and plastic strain had to be obtained. The equivalent plastic strain equals the logarithmic plastic strain in uniaxial tension, i.e., , where and is the elastic modulus taken as 70 GPa for aluminium. Further, the equivalent stress is equal to the true stress, i.e., , before necking. However, as the neck introduces a complex, triaxial stress state in the material, which increases the stress level, the stress had to be corrected. This was performed for the round (axisymmetric) specimens using the correction proposed by Bridgman [1]
where is the notch radius and the specimen radius at the neck. This was combined with the empirical expression proposed by Le Roy et al. [8], where is the logarithmic plastic strain at diffuse necking.
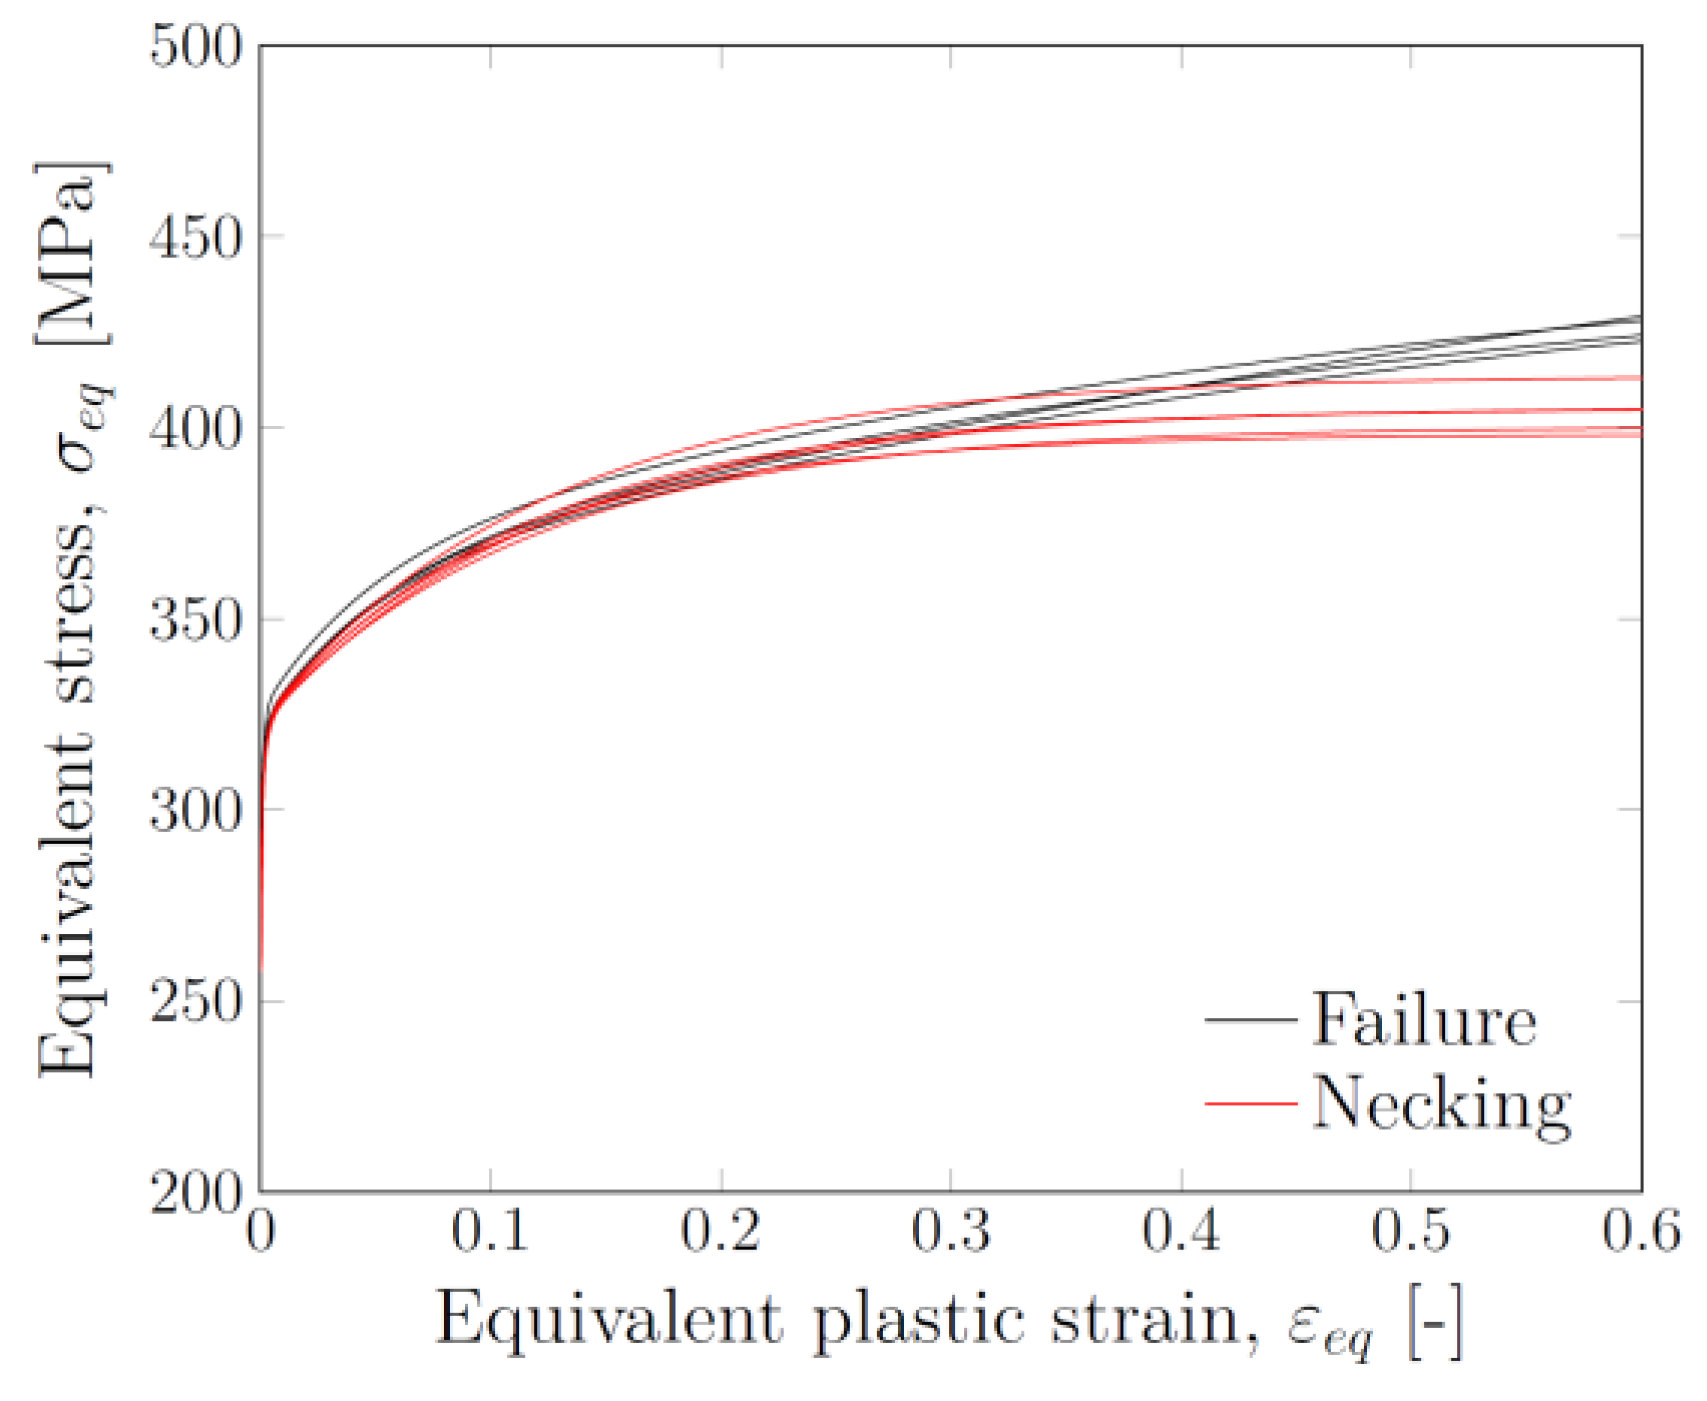
Figure 4 shows the obtained work-hardening curves for all the different test series. For the specimens measured with either laser micrometre or edge trace, the constants were fitted to the experimental curve all the way to failure. As the data from the extensometer and DIC (using a defined vector to measure the elongation) were only valid until diffuse necking, the constants were fitted to this point and the resulting work-hardening curves extrapolated to larger strains. Note that it is possible to extract material data from the DIC measurements also after diffuse necking, but that would require a combined experimental-numerical approach, which was outside the scope of the present experimental study. The obtained work-hardening parameters for all test series are listed in Table 2.
5. Concluding Remarks
In this study, the main objective has been to examine the validity of the material properties obtained using different measuring techniques and specimen types. Four different geometries of a tension test specimen have been applied in uniaxial tension tests and different measuring techniques including a laser micrometre, 2D-DIC, edge tracing and an extensometer, depending on the specimen geometry, have been used to obtain the data.
From these measurements, Cauchy stress versus logarithmic strain curves were obtained (also after necking), providing a basis for a direct calibration of the work-hardening parameters. Even though some variations were noticed, no significant influence of specimen type or measuring technique was observed on the true stress versus logarithmic strain curves. However, the fitted work- hardening curve is clearly dependent on whether the constants were determined from experimental data all the way to failure, or only up to diffuse necking and further extrapolated to large strains (see Figure 4). It should be noted that inverse modelling has not been conducted in this study. This would probably yield better result for the calibrated curves, but this has been left out for further work.
A natural continuation of the presented work would be to validate and compare the work-hardening parameters obtained through the various fitting procedures in finite element simulations of typical component tests. It is believed that the sensitivity of the numerical results to the chosen test and fitting procedure will be less for energy absorbing components, such as e.g., crushing of crash boxes [9], than in problems where fracture is prominent. Further studies, outside the scope of the present work, are required to confirm this.
Author Contributions
The work in this study is performed by S.T. in connection with her PhD Thesis, and supervised by T.B. and O.S.H.
Acknowledgments
The authors gratefully appreciate the financial support from NTNU and the Research Council of Norway through the FRINATEK Program FractAl, Project No. 250553.
Conflicts of Interest
The authors declare no conflict of interest.
References
- Dieter, G.E. Mechanical Metallurgy: SI Metric Edition; McGraw-Hill Book Company: New York, NY, USA, 1988. [Google Scholar]
- Sutton, M.A.; Orteu, J.J.; Schreier, H. Image Correlation for Shape, Motion and Deformation Measurements; Springer: Berlin, Germany, 2009. [Google Scholar]
- Marth, S.; Häggblad, H.Å.; Oldenburg, M.; Östlund, R. Post necking characterization for sheet metal materials using full field measurements. J. Mater. Process. Technol. 2016, 238, 315–324. [Google Scholar] [CrossRef]
- Vilamosa, V.; Clausen, A.H.; Fagerholt, E.; Hopperstad, O.S.; Børvik, T. Local measurement of stress-strain behaviour of ductile materials at elevated temperatures in a Split-Hopkinson tension bar system. Strain 2014, 50, 223–235. [Google Scholar] [CrossRef]
- Fourmeau, M.; Børvik, T.; Benallal, A.; Hopperstad, O.S. Anisotropic failure modes of high-strength aluminium alloy under various stress states. Int. J. Plast. 2013, 48, 34–53. [Google Scholar] [CrossRef]
- Fagerholt, E. Field Measurements in Mechanical Testing Using Close-Range Photogrammetry and Digital Image Analysis. Ph.D. Thesis, NTNU, Trondheim, Norway, 2012. [Google Scholar]
- User Manual—eCorr—Digital Image Correlation Tool. Available online: https://www.ntnu.edu/kt/ecorr (accessed on 13 March 2018).
- Le Roy, G.; Embury, J.D.; Ashby, M.F. A model of ductile fracture based on the nucleation and growth of voids. Acta Metall. 1981, 29, 1509–1522. [Google Scholar] [CrossRef]
- Granum, H.; Myhr, O.R.; Børvik, T.; Hopperstad, O.S. Nanostructure-based finite element analyses of aluminium profiles subjected to quasi-static axial crushing. Submitted for journal publication. 2018. [Google Scholar]
Figure 1.
Specimen geometries. (a) UT35; (b) UT90; (c) UT60; (d) UT200.

Figure 2.
True stress versus logarithmic strain curves. (a) UT35; (b) UT90; (c) UT60; (d) UT200.

Figure 3.
Comparison of true stress versus logarithmic strain curves for all specimen types and measurement techniques. In (a) all curves are plotted to diffuse necking only, while in (b) they are plotted to either necking or fracture, depending on the data available directly from the test.
Figure 3.
Comparison of true stress versus logarithmic strain curves for all specimen types and measurement techniques. In (a) all curves are plotted to diffuse necking only, while in (b) they are plotted to either necking or fracture, depending on the data available directly from the test.

Figure 4.
Work-hardening curves for all 9 test series.


Table 1.
Experimental programme.
| Specimen | Laser | Edge Tracing | Extensometer | DIC |
|---|---|---|---|---|
| UT35 | ✔ | ✔ | ||
| UT90 | ✔ | ✔ | ✔ | |
| UT60 | ✔ | ✔ | ||
| UT200 | ✔ | ✔ |
Table 2.
Work-hardening parameters *.
| Test Series | σ0 [MPa] | C1 [ - ] | Q1 [MPa] | C2 [ - ] | Q2 [MPa] | C3 [ - ] | Q3 [MPa] |
|---|---|---|---|---|---|---|---|
| UT35 ET UT35 Laser UT90 ET UT90 Laser UT90 Ext UT60 DIC UT60 Ext UT200 DIC UT200 Ext | 284.6 281.1 292.7 288.2 271.1 271.0 260.9 259.7 257.6 | 976.6 1180 661.3 891.3 3661.7 2670.5 3567.5 2965.4 3803.9 | 36.1 39.1 29.5 37.4 25.2 27.2 34.4 39.1 38.7 | 21.9 20.1 18.7 19.8 495.3 460.1 508.4 448.6 493.0 | 36.7 40.2 42.0 40.5 26.7 23.7 27.7 24.1 26.6 | 1.7 2.0 0.8 1.8 8.4 8.2 9.6 8.4 8.7 | 100.5 92.2 177.5 92.4 90.5 83.4 75.3 77.3 82.0 |
* Note: “ET” means edge trace and “Ext” means extensometer.
Publisher’s Note: MDPI stays neutral with regard to jurisdictional claims in published maps and institutional affiliations. |
© 2018 by the authors. Licensee MDPI, Basel, Switzerland. This article is an open access article distributed under the terms and conditions of the Creative Commons Attribution (CC BY) license (https://creativecommons.org/licenses/by/4.0/).
Share and Cite
MDPI and ACS Style
Thomesen, S.; Hopperstad, O.S.; Børvik, T. On the Material Characterization of an Aluminium Alloy Using Different Specimens and Identification Methods. Proceedings 2018, 2, 400. https://doi.org/10.3390/ICEM18-05237
AMA Style
Thomesen S, Hopperstad OS, Børvik T. On the Material Characterization of an Aluminium Alloy Using Different Specimens and Identification Methods. Proceedings. 2018; 2(8):400. https://doi.org/10.3390/ICEM18-05237
Chicago/Turabian StyleThomesen, Susanne, Odd Sture Hopperstad, and Tore Børvik. 2018. "On the Material Characterization of an Aluminium Alloy Using Different Specimens and Identification Methods" Proceedings 2, no. 8: 400. https://doi.org/10.3390/ICEM18-05237