Optimal Football Pressure as a Function of a Footballer’s Physical Abilities †


1
Edwin O. Smith High School, 1235 Storrs Road, Storrs, CT 06268, USA
2
Department of Mechanical Engineering, University of Connecticut, 191 Auditorium Road, Unit 3139, Storrs, CT 06269, USA
*
Author to whom correspondence should be addressed.
†
Presented at the 12th Conference of the International Sports Engineering Association, Brisbane, Queensland, Australia, 26–29 March 2018.
Proceedings 2018, 2(6), 236; https://doi.org/10.3390/proceedings2060236
Published: 13 February 2018
(This article belongs to the Proceedings of The 12th Conference of the International Sports Engineering Association)
Abstract
:Football is one of the most popular sports in the world. It is played by a diverse set of people, from little kids to professional athletes, who possess a large range of physical abilities and skill. One of the most important pieces of equipment is the football itself. This paper examines the physics behind the optimal football pressure as a function of ball speed, touch and force of kick, considering the vibration and dynamics of the football as it is kicked. It was observed that the pressure of a football plays a significant role in the dynamic interaction between the ball and foot. A low-order nonlinear lumped mass dynamic model of kicking foot and ball with mass, stiffness and damping was proposed and equations of motion were derived. Simulations were conducted and the optimal football pressure between 0.138 bar (2 psi) and 0.965 bar (14 psi) was proposed considering a multi-objective DIRECT optimization.
1. Introduction
Football is one of the most popular sports in the world. It is played by a diverse set of people. The kicking of a football involves the interaction between the player’s foot and the ball itself. This interaction is arguably the most crucial part of the game. Speed and touch. Speed can be quantified by velocity amplification factor. Touch is quantified by duration the foot is in contact with the ball. A footballer’s ability may best be quantified as the foot force that they are able to impart upon a football and the balance between touch and speed. It is important to understand the dynamics of a football strike to better understand the influence of the physical properties of a football, namely the pressure, on the speed and touch of a football being kicked.
The football strike typically occurs in less than 10 milliseconds (ms). Even with such a small duration of impact, the deformation can still be divided into four distinct phases [1]. The first phase takes place in the first 2 ms of impact. In this phase, ball deformation occurs on the kicking side while the opposite edge of the ball does not move. The second phase is characterized by the movement of the ball as a whole. The second phase begins when the ball starts to move as a whole and ends when the ball velocity exceeds that of the foot velocity. The third phase begins when the ball is maximally deformed, and ends when the velocity of the center of gravity of the ball plateaus. The final, fourth phase starts at this point and ends when the ball loses contact with the foot. It is noted that in this last phase, the deceleration of the foot was almost stopped and only a slight increase to the velocity of the center of gravity of the ball is observed.
Previous research has conducted various laboratory tests of a football being kicked. Shinkai et al. [2] used a high-speed camera collecting data at 5000 frames per second. It was observed that the front hemisphere of the ball moves before and in a separate manner from the other side of the ball during initial impact. This indicates that the ball can be modeled as two masses. Thompsett et al. [3] used a bespoke Kicking Robot and a high speed camera to identify the compression ratio, mass, and stiffness to examine to perception of hardness and weight. These laboratory tests showed a trend that with increased pressure the speed of the ball increases while the time the foot is in contact with the ball decreases.
A number of researchers have proposed numerical models to capture the behavior of a ball being impacted. Petersen and McPhee [4] proposed a lumped-mass model of an impact of a golf club and ball that includes the mass of the ball being modeled as two lumped masses. They were able to show that a lumped mass model can provide a good measure of the post-impact velocity of a ball as compared to a detailed finite element model. Nunome et al. [1] and Babbs [5] each developed a mathematical model of a football being kicked that only includes a single mass and a spring interface. These models capture the general behavior of the football strike, however, they may simplify the dynamic interaction between the foot and the ball and any internal dynamic behavior of the football.
This paper examines the physics behind the optimal football pressure as a function of ball speed, touch and force of kick, considering the football modeled as two lumped masses and the kicking foot modeled as a spring mass system with spring interface with the ball. This model is able to capture the dynamics of the foot impacting a ball and associated dynamics of the ball itself. Simulations were conducted and the optimal football pressure is proposed as a function of footballer’s ability by considering a multi-objective DIRECT optimization. In such a manner, the optimal football pressure can be identified for players of distinct ability.
2. Materials and Methods
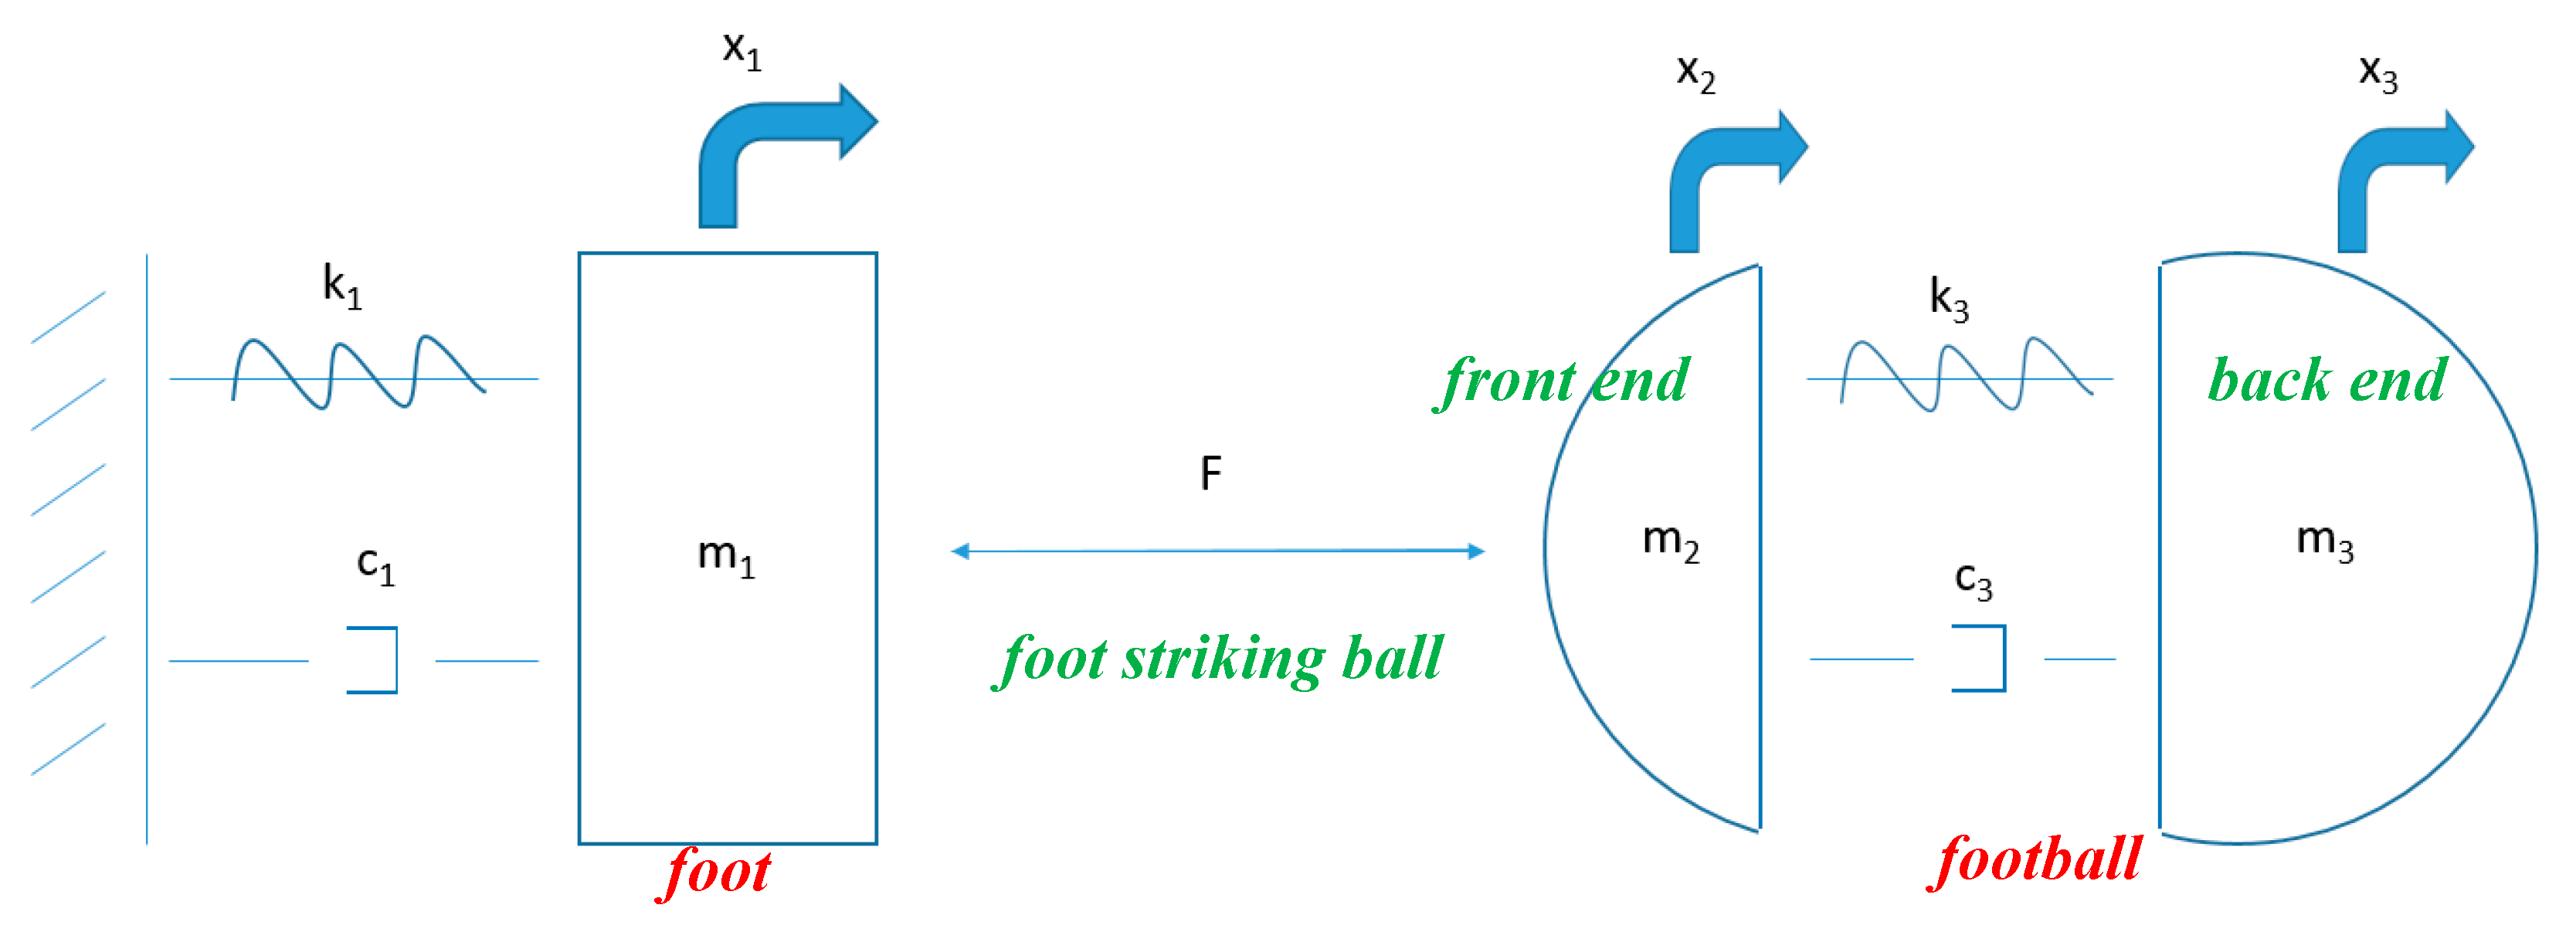
A simplified lumped mass dynamic model was proposed to capture the important dynamics of a footballer striking a football, as illustrated in Figure 1.
From Newton’s second law the dynamic set of equations of motion of the system shown in Figure 1 can be written as:
where m1 is the mass of the players foot, m2 is the mass of the deformed portion for the ball during impact, m3 is the mass of the remainder portion of the ball, k1 and c1 are the stiffness and damping of the players foot, k3 and c3 are the stiffness and damping of the ball between the two ball masses, and f is the force the foot applies to the front end of the football. The mass of the football, m, is related to masses m2 and m3 through mass ratio as
The natural frequency of the foot, ω1, and ball, ω3, can be written as functions of the mass and stiffness as
Linear viscous damping is assumed for the damping coefficients such that
where z1 and z2 are the damping ratios for the foot and ball, respectively. The force the foot applies to the front end of the football, f, can be defined by the nonlinear function as
where the stiffness of the shoe is k2 and is the displacement of the foot at the time of initial impact with the ball, such that when x2 is larger than (the otherwise case in Equation (7)) the foot is no longer in contact with the front end of the ball.
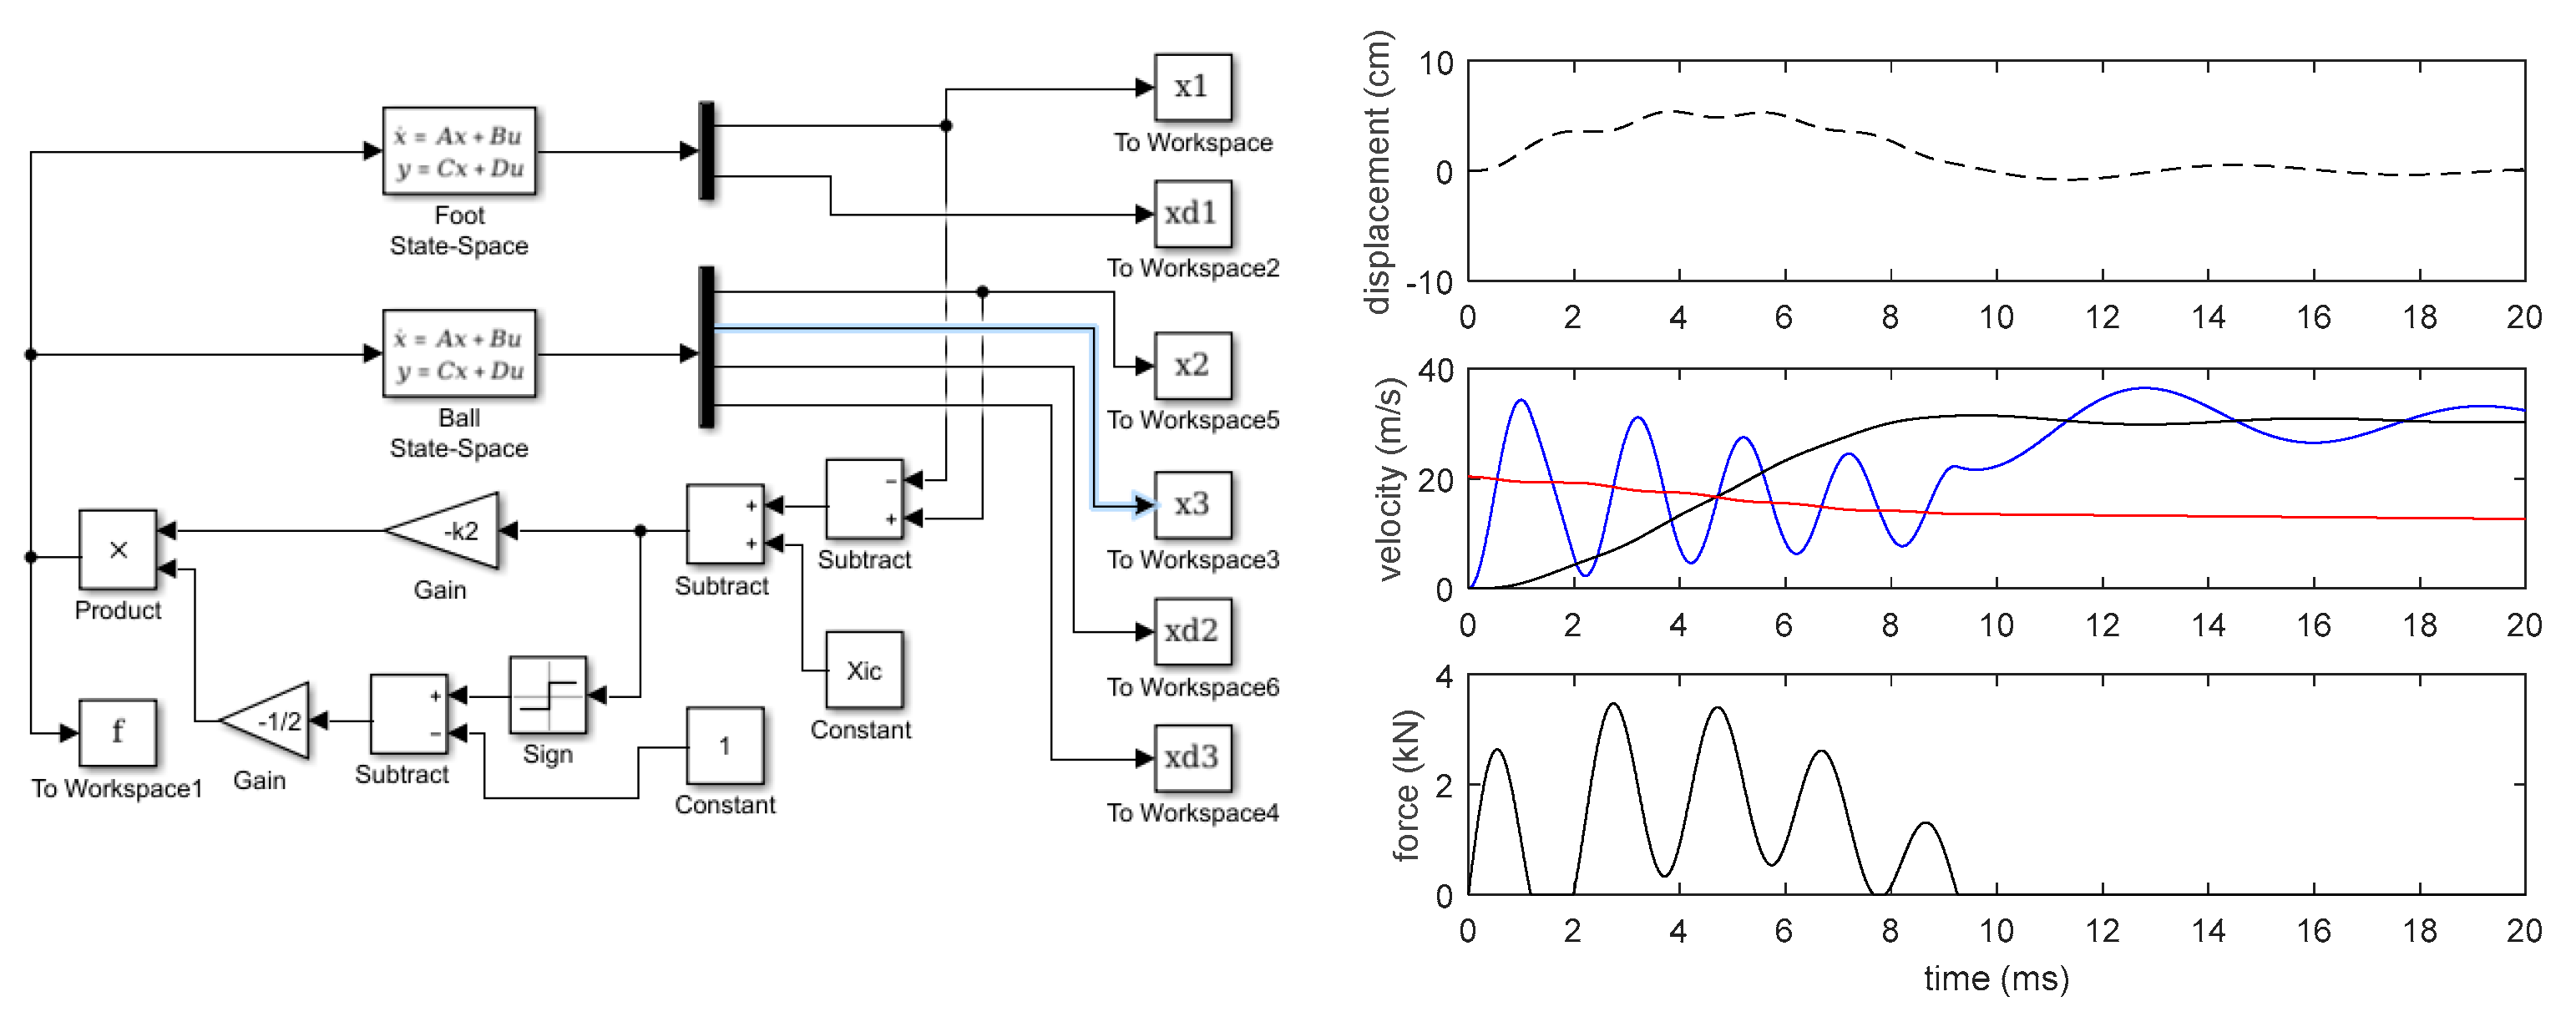
The equations of motion in Equations (1)–(3) can be solved simultaneously in MATLAB Simulink while simulating the interface force in Equation (7). The parameters are identified from various prior research on footballs and the values selected for this study are given in Table 1.
It is assumed that the air pressure in a football affects both the stiffness and damping of the ball. The stiffness of the ball, , at the prescribed air pressure is determined from Equation (5) such that . Babbs [5] showed that the ball stiffness is equal to the product of the air pressure and the circumference of the ball. As such, is directly proportional to air pressure.
The relationship between the pressure and damping of a soccer ball is more complex. While it is reasonable to assume that the damping of the ball is inversely related to the pressure, an experiment is designed to better quantify this relationship. In the experiment balls of varying ball pressure are dropped from a fixed height, , and the height of the first rebound, , is measured such that the coefficient of restitution (CoR), , can be calculated. The damping ratio, shown by Nagurka and Huang [6] depends only on the CoR. It can then be determined as
3. Results
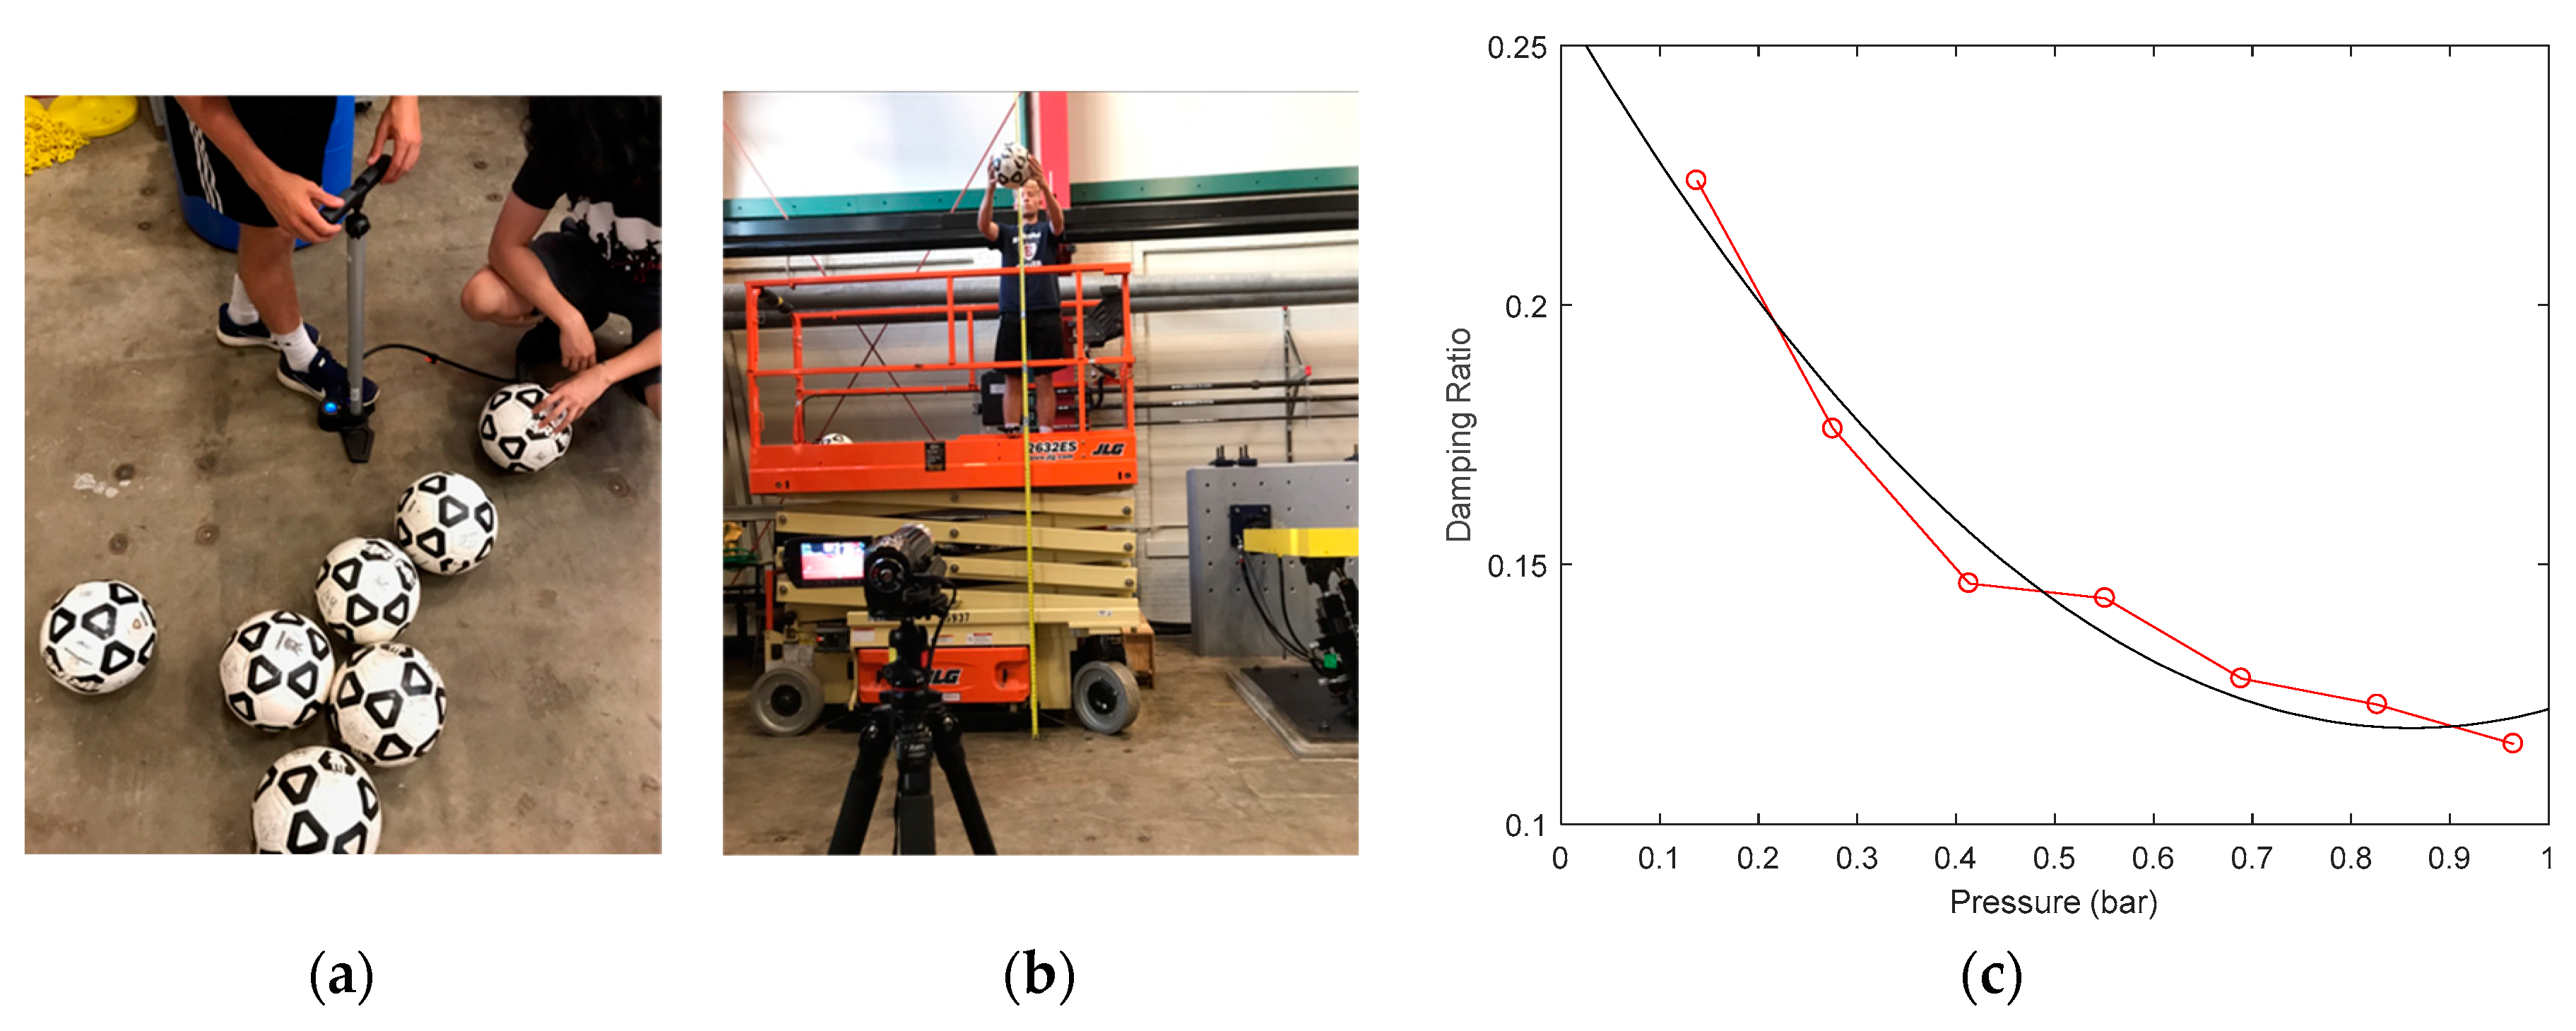
The drop testing of the footballs to determine damping was conducted by dropping 10 soccer balls of a specific pressure from a predefined height of 3.084 m (10 ft) onto a flat 0.9144 m (3 ft) thick concrete floor and measuring the height of the first rebound using a digital video camera. A picture of the laboratory setup is shown in Figure 2. The balls used were practice balls being used by the E.O. Smith High School varsity boys’ soccer team and were Brine Championship 2014 soccer balls. The pressure in each ball was set using a Bell Air Glide pump with a digital pressure gage. The suggested pressure range written on the balls was 0.552–0.827 bar (8–12 psi). A pressure range from 0.138 bar (2 psi) to 0.965 bar (14 psi) was tested. The damping ratio was determined by Equation (8). The results of the drop tests are shown in Figure 3. A best fit curve was identified for the mean damping ratio to provide the equation relating ball pressure, p, to damping ratio as
where the coefficients are fit using a quadratic polynomial curve such that in4/lb2 in2/lb and . While the resulting function does not monotonically decrease over the high end of the pressure range considered, there is a significant overall trend that the damping decreases as the pressure increases. The results should be considered only valid over the pressure range tested. The r-squared value for this model is 96.5%.
4. Discussion
A drop test was used on a series of balls of different pressures. The damping ratio is inversely related to pressure as expected. A quadratic function was fit to represent the relationship between the pressure and the damping ratio.
A discrete lumped mass numerical model was developed for the foot and ball. The results of the model as shown in Figure 3 capture the four phases of ball impact as identified in Nunome et al. [1]. As such, the numerical model is considered to be validated for a football strike.
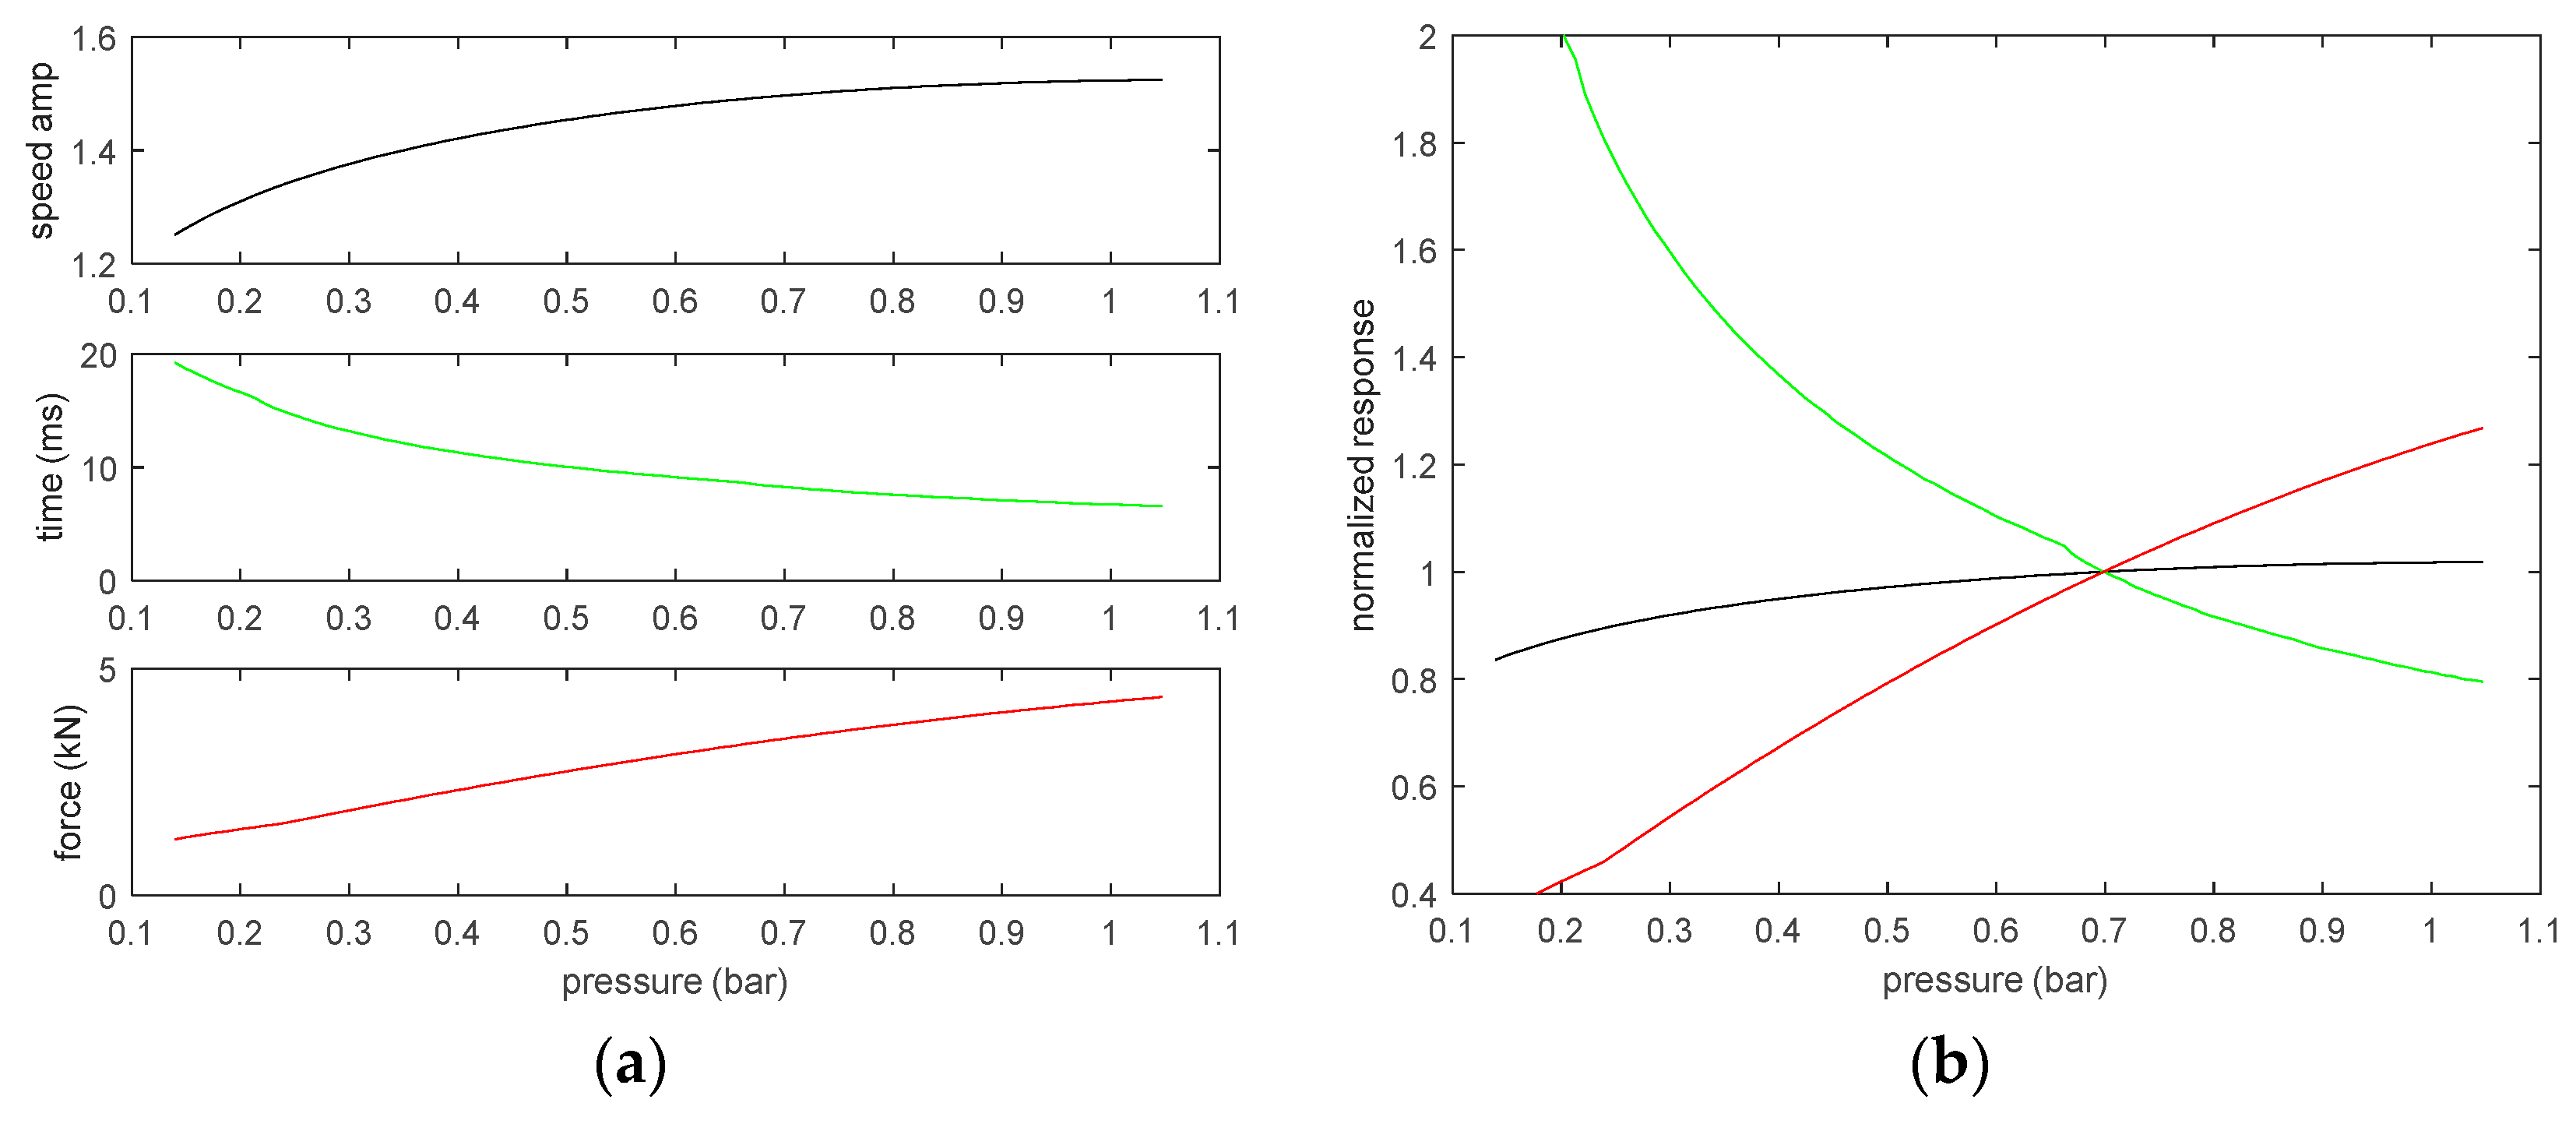
The numerical model was then used along with the experimentally determined function of damping ratio versus pressure to examine certain aspects of a football strike for a range of pressures. The variation of pressure is shown to have an effect on speed and touch, as shown in Figure 4. The speed amplification varies slightly from 1.47 to 1.51, less than a 3% increase, over the recommended pressure range from 0.552 to 0.827 bar. The touch, as measured by the amount of time the foot is in contact with the ball, varies from 9.5 ms to 7.4 ms, a 22% decrease, as the pressure increases over the recommended pressure range. The force also varies significantly, increasing from 3.0 kN to 3.9 kN, a 30% increase, over the recommended pressure range.
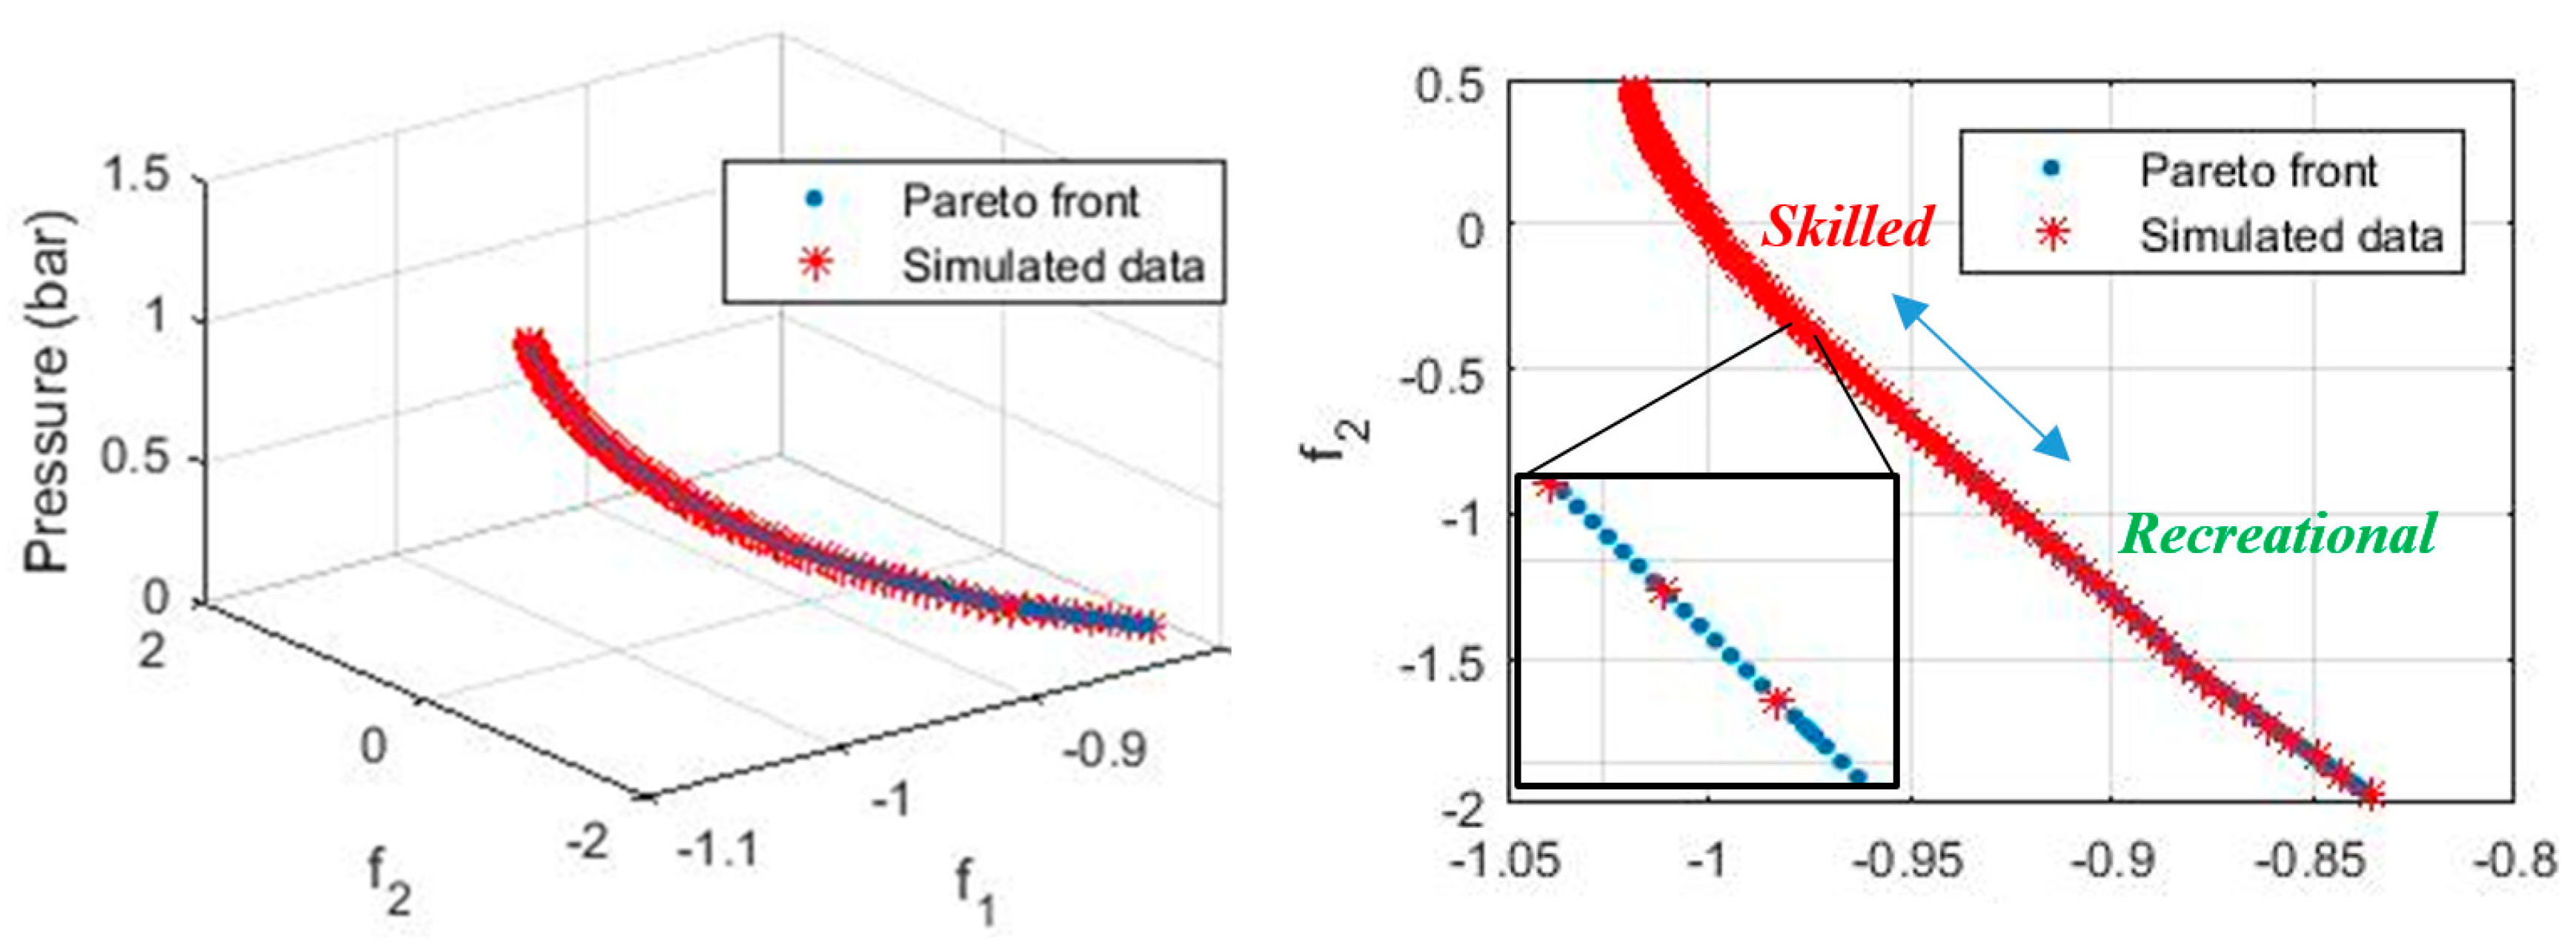
For most football players, large speed amplification, more touch, and less impact force are ideal. However, while more touch and less impact force indicate less pressure of the ball, large speed implies that more air should be pumped in. To tackle the challenge of the two contradictory objectives, a multi-objective optimization problem that exhibits the tradeoff between different objectives can be formulated as follows:
where SP(p), TC(p), and FR(p) are the speed amplification, time, and force as a function of pressure, respectively. In optimization, when a decision maker expresses a subjective judgment before or during the optimization, a single biased solution is obtained. However, in practice, it is quite common that several solutions are of interest. For example, a recreational player may prefer touch and low force over speed, on the other hand, a skilled player may be inclined to speed rather than touch and low force. Therefore, it is preferable that the problem-solving and decision-making processes are independent of each other so that the problem-solving approach could remain unchanged when player judgments differ.
Minimize f1(p) = −SP(p), f2(p) = −TC(p) + FR(p)
In this research, a multi-objective DIRECT optimization is adopted [7], which will provide a set of solutions (also known as Pareto front) as pressure candidates that can accommodate the needs of different players. Figure 5 depicts the results of optimization, where each point corresponds to an optimal pressure candidate. The player can then select the pressure of the ball according to his/her preference with regard to the two objectives.
This numerical model can also potentially be applicable to heading the football. The results indicate that even within the recommended pressure range of the ball, the force on a head can be 30% higher for a ball with the higher recommended pressure.
5. Conclusions
Drop tests were conducted to experimentally determine a mathematical function to represent damping in footballs as a function of ball pressure. A simplified lumped mass model fully capturing the dynamic behavior of the foot and ball was proposed and validated by comparing to prior researchers experimental results. Simulations were conducted using MATLAB Simulink. A relationship was established between force, time, and speed as a function of pressure. The proposed optimal football pressure for players of different abilities was determined using a multi-objective DIRECT optimization. This simple demonstration can be applied to more detailed models which capture more complex dynamics of the kicking of a football, as well as other ball-impact applications.
Conflicts of Interest
The authors declare no conflict of interest. The funding sponsors had no role in the design of the study; in the collection, analyses, or interpretation of data; in the writing of the manuscript, and in the decision to publish the results.
References
- Nunome, H.; Ball, K.; Skinkai, H. Myth and fact of ball impact dynamics in football codes. Footwear Sci. 2014, 6, 105–118. [Google Scholar] [CrossRef]
- Shinkai, H.; Nunome, H.; Isokawa, M.; Ikegami, Y. Ball Impact Dynamics of Instep Soccer Kicking. Med. Sci. Sports Exerc. 2009, 41, 889–897. [Google Scholar] [CrossRef] [PubMed]
- Thompsett, B.; Harland, A.; Roberts, J. Investigating the relationship between physical properties of a football and player perceptions. In Proceedings of the 11th Conference of the International Sports Engineering Association, ISEA, Delft, The Netherlands, 11–14 July 2016. [Google Scholar]
- Petersen, W.; McPhee, J. Shape optimization of golf clubface using finite element impact models. In Proceedings of the 4th Conference of the International Sports Engineering Association ISEA, Belfast, Northern Ireland, 23 August–1 September 2009. [Google Scholar]
- Babbs, C.F. Biomechanics of Heading a Soccer Ball: Implications for Player Safety. Sci. World 2001, 1, 281–322. [Google Scholar] [CrossRef] [PubMed]
- Nagurka, M.; Huang, S. A Mass-Spring-Damper Model of a Bouncing Ball; Department of Mechanical and Industrial Engineering, Marquette University: Milwaukee, WI, USA, 2006. [Google Scholar]
- Cao, P.; Yoo, D.; Shuai, Q.; Tang, J. Structural damage identification with multi-objective DIRECT algorithm using natural frequencies and single mode shape. In Proceedings of the SPIE Smart Structures & Materials, Nondestructive Evaluation and Health Monitoring, Portland, OR, USA, 25–29 March 2017; International Society for Optics and Photonics: Bellingham, WA, USA, 2017. [Google Scholar]
Figure 1.
Proposed lumped mass representation of a foot striking a soccer ball with linear stiffness and viscous damping.
Figure 1.
Proposed lumped mass representation of a foot striking a soccer ball with linear stiffness and viscous damping.

Figure 2.
Photographs of (a) pumping balls to pressure; (b) video recording ball dropped at 3.084 m (10 ft) height; and (c) experimentally determined average damping ratio as a function of pressure (experimentally measured mean damping ratio—red circles; Equation (9)—black curve).
Figure 2.
Photographs of (a) pumping balls to pressure; (b) video recording ball dropped at 3.084 m (10 ft) height; and (c) experimentally determined average damping ratio as a function of pressure (experimentally measured mean damping ratio—red circles; Equation (9)—black curve).

Figure 3.
Kicking of football MATLAB Simulink model and resulting plot indicating: deformation of the ball; velocity of foot (red), front (blue) and back (black) of ball; and force of the foot on the ball.
Figure 3.
Kicking of football MATLAB Simulink model and resulting plot indicating: deformation of the ball; velocity of foot (red), front (blue) and back (black) of ball; and force of the foot on the ball.

Figure 4.
The effect of ball pressure on the: speed amplification (final velocity of ball divided by initial foot velocity (black); time the foot is in contact with the ball (green); and maximum impact force of the foot and ball (red), for (a) engineering units and (b) normalized to response at 0.69 bar pressure.

Figure 5.
The Pareto front of optimization.


Table 1.
Values for football simulation.
| Parameter | Variable | Value | Units |
|---|---|---|---|
| mass of ball | m | 0.43 | kg |
| mass ratio | μ | 0.1 | -- |
| ball frequency | ω | 150 | Hz |
| ball damping ratio | z3 | 12 | % |
| foot mass | m1 | 2.27 | kg |
| foot frequency 1 | ω | 0.5214 | Hz |
| foot damping ratio | z1 | 100 | % |
| foot displacement I.C. | x10 | −30.48 | cm |
| Foot velocity I.C. | 20.32 | m/s | |
| shoe stiffness | k2 | 10 × k1 | -- |
1 corresponds to a foot at the end of a 3 ft long leg/pendulum. I.C.—initial condition.
Publisher’s Note: MDPI stays neutral with regard to jurisdictional claims in published maps and institutional affiliations. |
© 2018 by the authors. Licensee MDPI, Basel, Switzerland. This article is an open access article distributed under the terms and conditions of the Creative Commons Attribution (CC BY) license (https://creativecommons.org/licenses/by/4.0/).
Share and Cite
MDPI and ACS Style
Christenson, A.; Cao, P.; Tang, J. Optimal Football Pressure as a Function of a Footballer’s Physical Abilities. Proceedings 2018, 2, 236. https://doi.org/10.3390/proceedings2060236
AMA Style
Christenson A, Cao P, Tang J. Optimal Football Pressure as a Function of a Footballer’s Physical Abilities. Proceedings. 2018; 2(6):236. https://doi.org/10.3390/proceedings2060236
Chicago/Turabian StyleChristenson, Andrew, Pei Cao, and Jiong Tang. 2018. "Optimal Football Pressure as a Function of a Footballer’s Physical Abilities" Proceedings 2, no. 6: 236. https://doi.org/10.3390/proceedings2060236