Towards an Operational Framework for Designing Training Based Sports Virtual Reality Performance Simulators †


1
School of Engineering, Griffith University, Nathan, QLD 4111, Australia
2
Centre for Excellence for Applied Sports Science Research, Queensland Academy of Sport, Nathan, QLD 4111, Australia
3
School of Information Communication Technologies, Griffith University, Nathan, QLD 4111, Australia
4
School of Exercise Science, Australian Catholic University, Banyo, QLD 4014, Australia
*
Author to whom correspondence should be addressed.
†
Presented at the 12th Conference of the International Sports Engineering Association, Brisbane, Queensland, Australia, 26–29 March 2018.
Proceedings 2018, 2(6), 214; https://doi.org/10.3390/proceedings2060214
Published: 22 February 2018
(This article belongs to the Proceedings of The 12th Conference of the International Sports Engineering Association)
Abstract
:With the advent of commercially available virtual reality (VR) hardware, immersive experiences can be created to simulate competitive performance environments. Simulators can provide novel ways for fans to engage with otherwise unattainable performance situations. Furthermore, simulators can also have clear advantages for elite athletic training by controlling the perceptual inputs, measuring the kinematic based outputs, measuring how the athlete is interacting with the created environment, and providing concurrent audio-visual-haptic feedback. When engineering a virtual simulation system, fundamental design considerations include; hardware selection, software design, user safety, and the provision of performance factors. This paper provides a case study into the design considerations of engineering a track cycling simulator for the 2018 Commonwealth Games Velodrome. The experience utilises a stationary exercise bike (Wattbike, 2016 Pro) transmitting performance data wirelessly, via the ANT+ protocol, to a PC connected to an Oculus Rift VR projecting the audio-visual simulated environment. The simulator has been tested on a large reference group to evidence the design decisions. The design processes have been generalized to create an operational framework to aid the creation of future VR sports simulators.

1. Introduction
Emerging technology is rapidly being adopted in sport to improve performance and gain a competitive advantage over rivals. Performance enhancement requires an understanding of the perception-action cycle [1]. One technology medium that has the potential to drastically alter the sports training space is virtual reality (VR). VR is a global term for visual-based computer simulation of a real or imaginary environment with technology being used to both display and interact with the environment [2]. VR experiences allow users to intuitively interact with 3D computer generated models in real time, designed to either entertain, explain, or to train [3]. There is a desire to improve sensorimotor skills through using VR as a training mechanism, rather than using VR to purely explain (for example for tactical or decision making optimization) or to entertain [3].
VR systems have several potential advantages for athletic training; environments can be precisely controlled and scenarios standardized, augmented information can be incorporated to guide performance, and the environment can be dynamically altered to create different competitive situations [3]. The advent of high frame rate head-mounted displays (HMDs), such as the Oculus Rift (Oculus, Irvine, CA, USA), has allowed bespoke sports training software to be developed. Current HMD VR sports training systems that are on the consumer market are primarily based on video training, for example the American Football focused STRIVR product [4]. This software allows users to watch pre-recorded plays from an egocentric viewpoint, giving athletes immersive familiarization without the dependency of being at training. In this context, VR has benefits over 2D video playback, associated with the stereoscopic 360° field of view [1]. These benefits may be focused on either educating athletes about the plays, hence, adding confidence, or through entertainment factors [2].
It could be reasoned that for the VR environment to create a strong positive transfer, realistic opportunities for action, with appropriate sensory information, must be coupled with natural functional movement fidelity. VR has been used as a training simulator across a range of sports including; basketball free-throw shooting [5], rugby side-stepping [1,2], handball goal-keeping [1], soccer goal keeping [2], and fly ball catching [6] to varying degrees of success. Covaci et al. [5] used a basketball free-throw shooting task. Experienced athletes shot firstly on a virtual simulator, achieving an average accuracy of 47 ± 1% with terminal feedback after each shot, followed by real court transfer test in which they achieved 53 ± 1%. These numbers do not provide evidence of a transfer of training, or success in the VR environment, which could be due to shooting a virtual ball without haptic feedback. The de-coupling of perception and action by eliminating the natural haptic inputs, when used for training situations, could cause maladaptive training adaptions [7].
Miles et al. [3] developed a criterion for evaluating the efficacy of sports virtual environments for training sports skills which included being, having high functionally fidelity, affordability, and to be validated to work as intended. One marker of functional fidelity is presence, the subjective feeling of “being there” [8]; in this case, the athlete feeling that they are physically located at the virtual sporting environment [2]. This is made possible through both the perceptual and functional realism of the system. Perceptual fidelity, defined as the audio-visual appearance of the real-environment in the system, is not nearly as important as functional fidelity for skill acquisition, defined as the elicitation of realistic movement behaviours [2,3]. The assessment of validity can be achieved through capturing the behaviour in the virtual environment and correlating this with the real world, ensuring results and learnings are transferable [6]. As VR technology has become more widely adopted, the affordability problem has become less of an issue, with one of the most popular HMDs, the Oculus Rift, available for under $500USD. Furthermore, rapid technological advances have negated Miles et al. [3] concern with HMD being too cumbersome to wear and now users can with relative comfort wear these devices whilst performing active movement tasks.
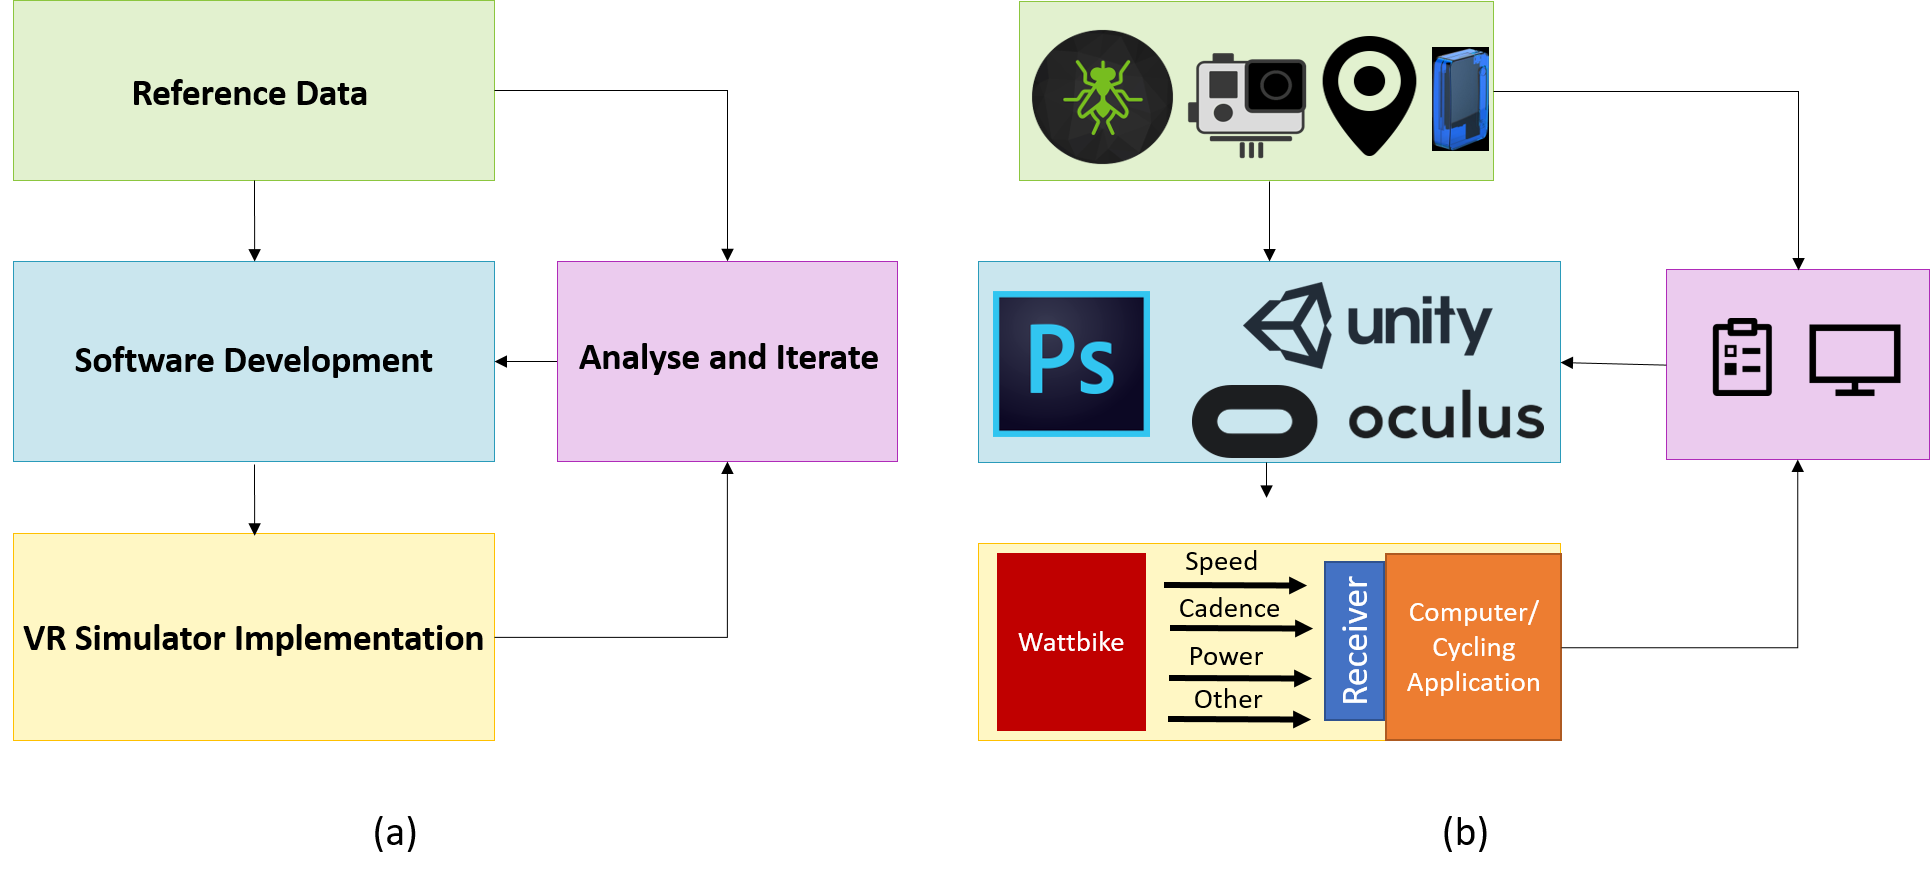
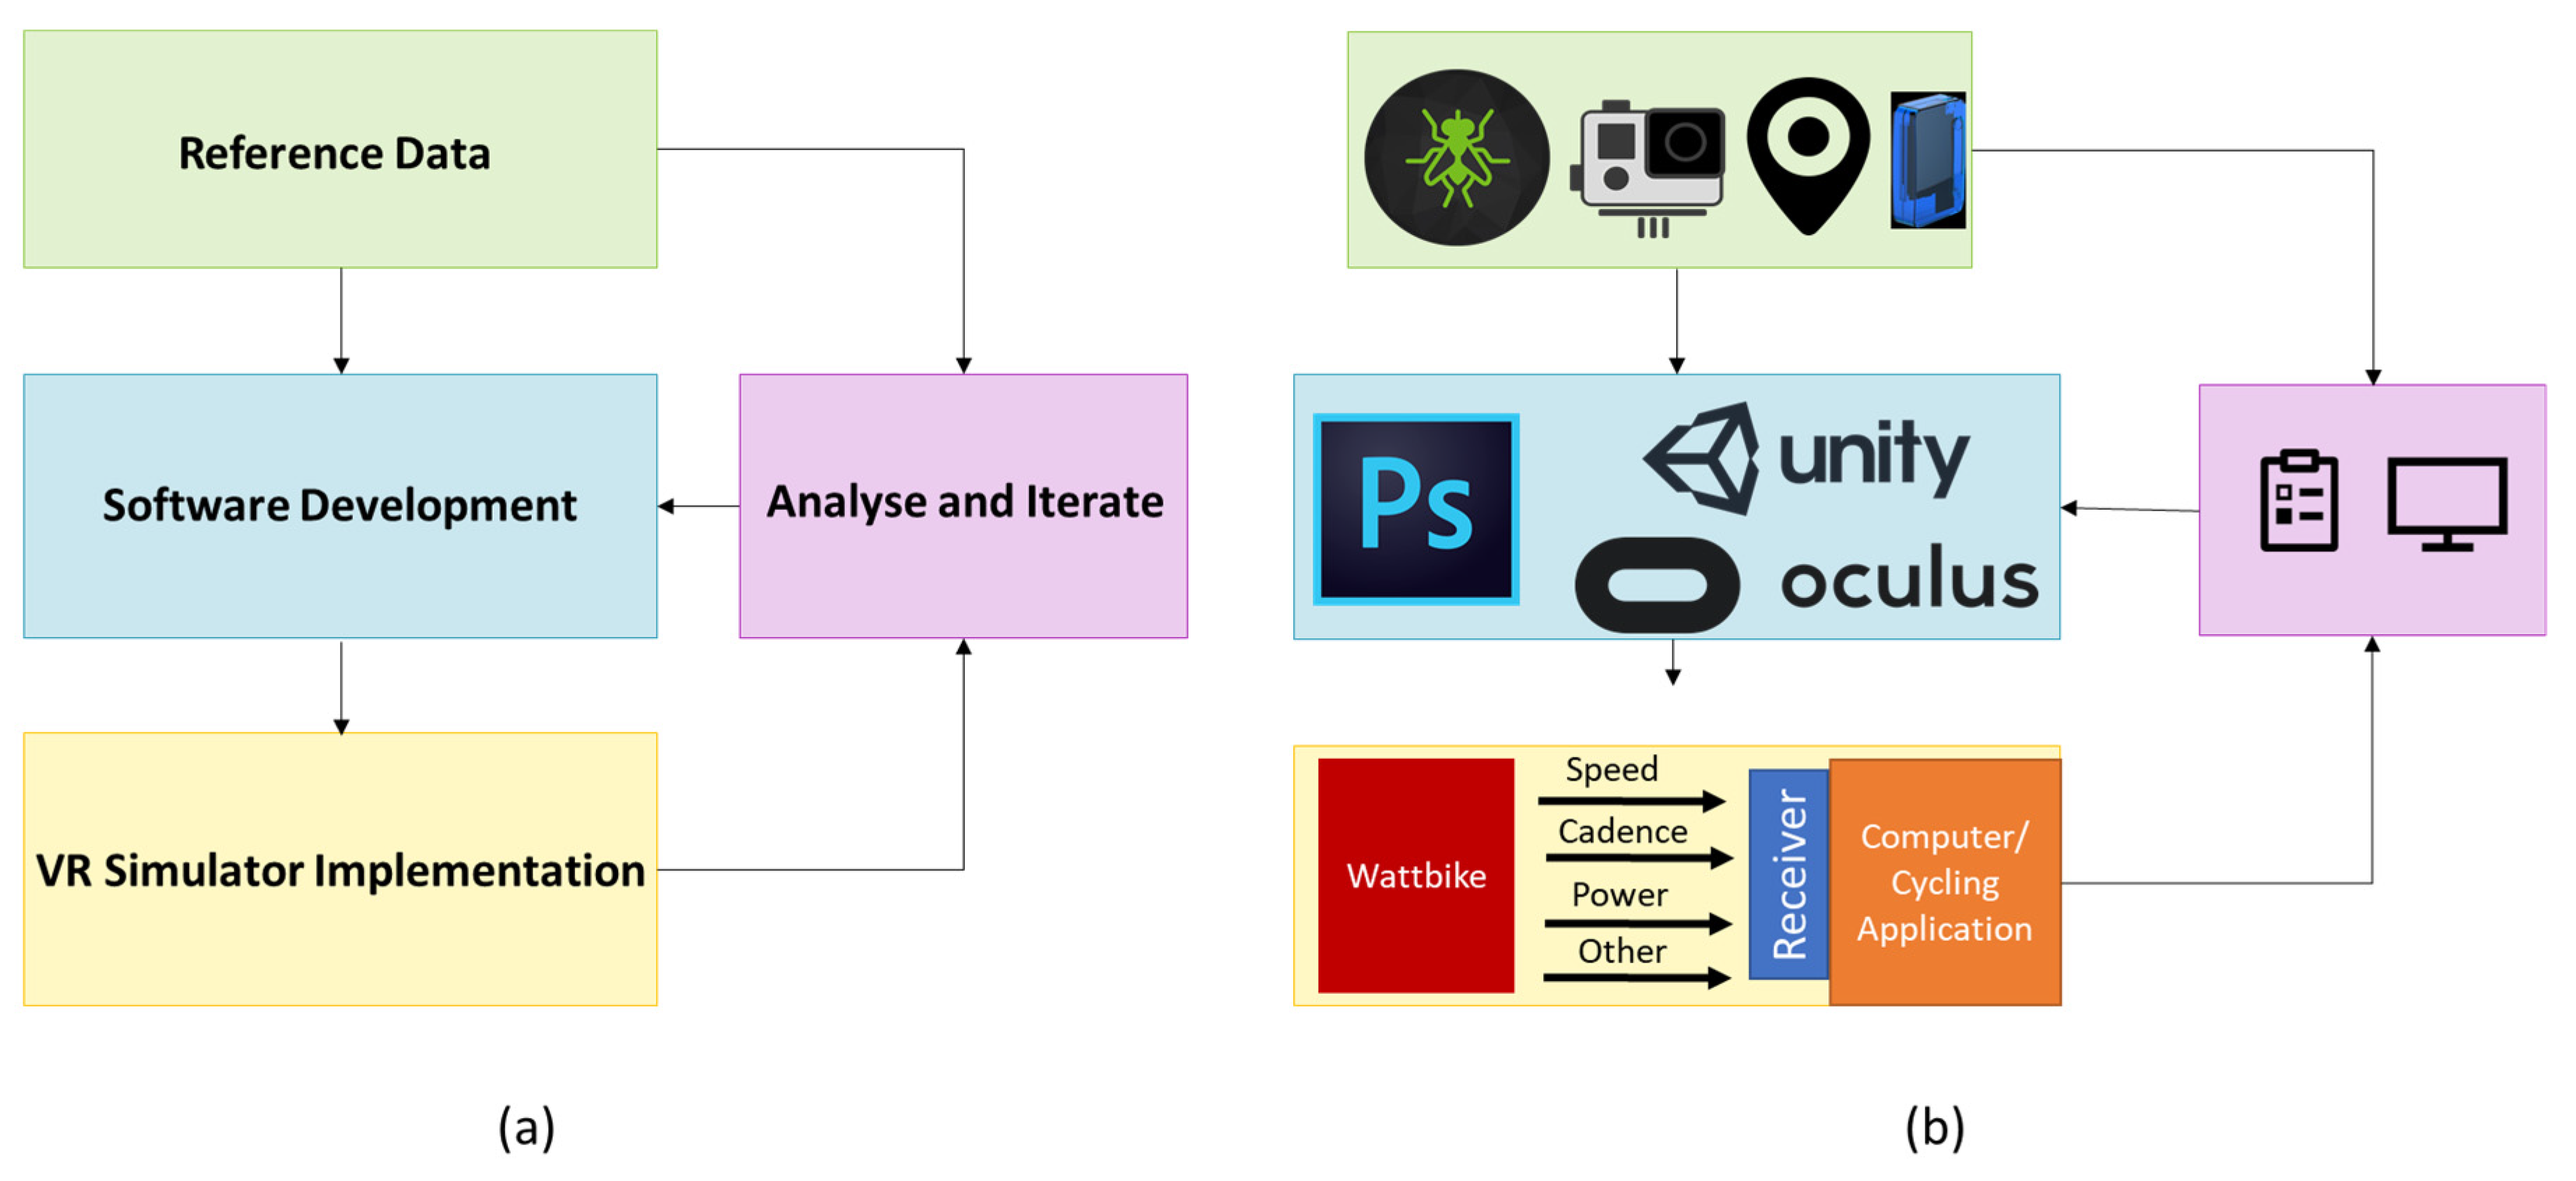
Bideau et al. [1] created a three step framework for creating VR sports simulators utilizing a perception action coupled task (handball goalkeeping) and a de-coupled perception task (rugby side-stepping). The framework encompasses an initial capture of the athlete’s actions (using motion capture), computer based animation of the virtual humanoids and, finally, the virtual environment presentation, an application specific process. The design framework is useful for the applications discussed, however is not generalizable to other sports, such as track cycling where motion capturing the entire performance to drive the humanoid models, is complicated due to the size of the capture volume. The aim of this paper was to extrapolate the Bideau et al. [1] concept to create a more generalizable VR sports training simulator technological design framework, which includes an additional step allowing incremental modification, shown in Figure 1a. The stepwise process includes;
- Capturing Reference Data
- Software Development
- Hardware Development
- Analysis, and Iteration.
The fourth step uses an adapted two step criteria from Miles et al. [3], in which the following is asked: is the simulator realistic (in terms of functional and perpetual fidelity)?; and are the behaviours represented in the real environment?
2. Materials and Methods
The simulator was designed to replicate the experience of competing in a track cycling event in the 2018 Commonwealth Games stadium in Chandler, Queensland. To achieve this a stepwise design process was implemented, as illustrated in Figure 1.
Figure 1.
Implementation guideline for the creation and iteration of a VR sports simulator. (a) Generalized guidelines (b) the detailed implementation for the creation of this simulator.
Figure 1.
Implementation guideline for the creation and iteration of a VR sports simulator. (a) Generalized guidelines (b) the detailed implementation for the creation of this simulator.

2.1. Reference Data
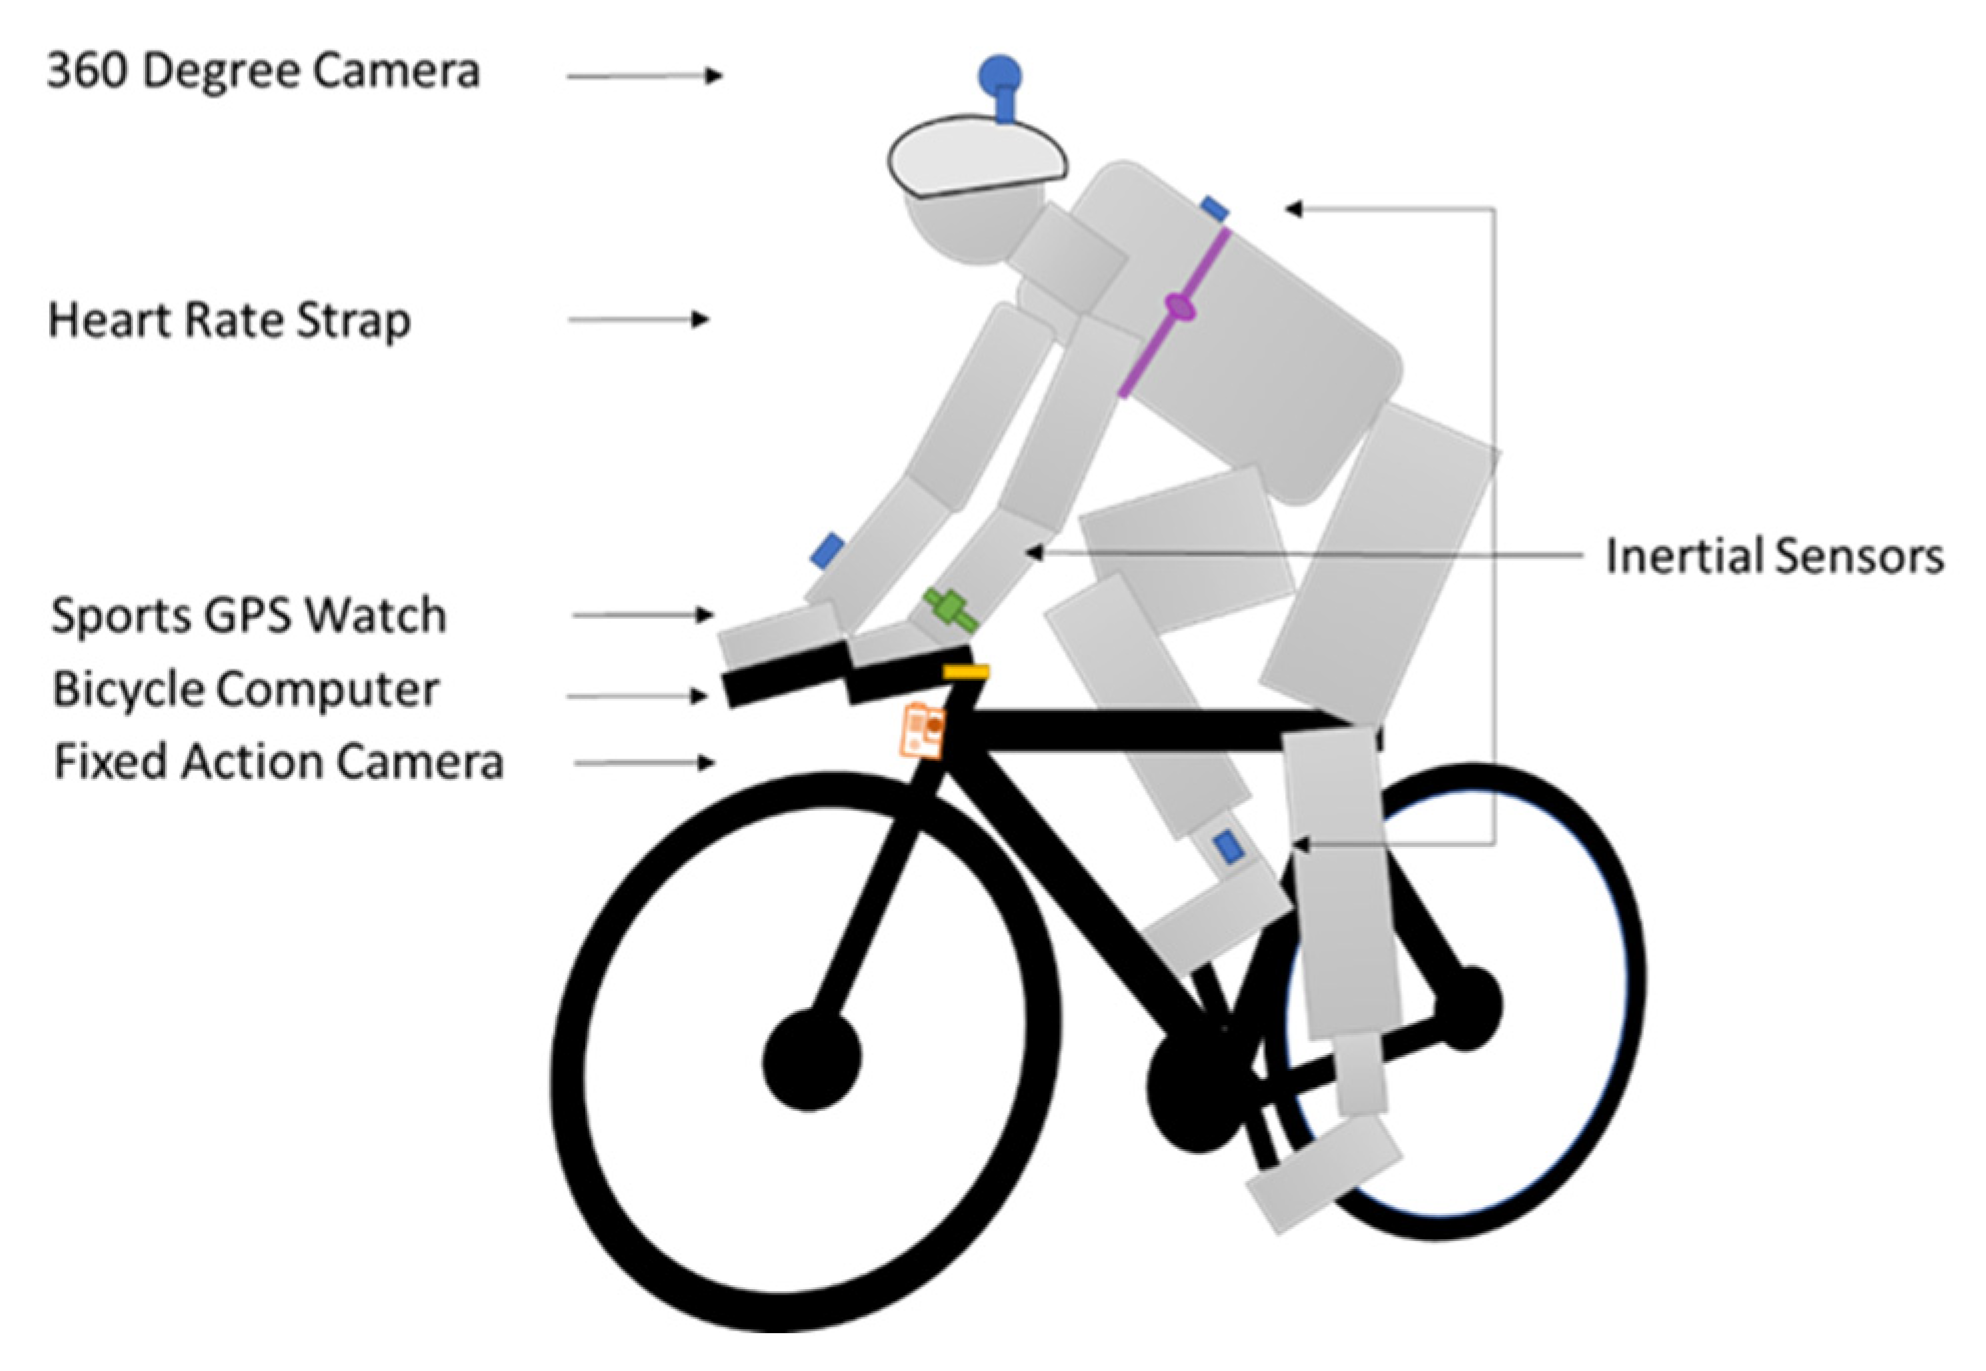
One elite male cyclist, who was a previous gold medallist at the Commonwealth Games track cycling in the men’s sprint, gave informed consent to participate in the research study (Ethics Number: GU2016/746). The athlete was instrumented with three 9DOF inertial sensors (SABEL Sense, Brisbane, Australia) mounted using Velcro straps on the right shank, the right wrist, and between the shoulder blades (250 Hz, ±16 g accel., ±2000°/s gyro., ±7 Gauss mag., weight = 23 g). These sensors [9] logged data on a SD card and were calibrated before the trial [10]. A helmet mounted 360-degree camera (360Fly, Pittsburgh, PA, USA) collected video at 60 Hz, along with additional video from a fixed sports action camera (GoPro, San Mateo, CA, USA) also sampling at 60 Hz. The athlete used a bike computer (Garmin, Olathe, KS, USA), wore a GPS sports watch (Polar, M400) and a chest strap mounted heart rate monitor (Polar, Kempele, Finland). The athlete was instructed to perform ten slow laps on the race line, followed by three flying two hundred meter efforts at maximal intensity, then finally a shadow 3 lap race, where he was asked to visualize that he was ‘off the front’ match racing an invisible opponent. The placement of these sensors and other equipment is shown in Figure 2. A fixed camera (Panasonic HC-V750M, Osaka, Japan) was also used for reference data recording at 50 Hz and a microphone (Rode NT, Sydney, Australia) was placed next to the track to gather ambient track sound data.
Additional documentation including UCI track dimension regulations and stadium layout was also attained to complete the reference files.
2.2. Software Development
The reference video data from the sports action camera and the 360-degree camera was used to create high-fidelity models in 3DSMAX (Autodesk, Montreal, QC, Canada) and Photoshop (Adobe, San Jose, CA, USA). These models were helped driven using the temporal and spatial data captured from the IMU sensors. The models were animated in Unity (Unity, San Fransicso, CA, USA) and optimised for the Oculus Rift HMD. The software uses gaze input for menu selection. To create the simulators soundscape the captured bike noises were augmented with open-sourced crowd noises to increase the fidelity and to aid presence.
2.3. Simulator Implementation
The simulator consists of a stationary exercise bike (Wattbike, 2016 Pro) which transmits real time performance data wirelessly, via the ANT+ protocol, to a connected PC with an Oculus Rift HMD projecting the audio-visual simulated environment, the setup of which is shown Figure 3a. Sprint performance on this cycling ergometer has shown to be highly related and reproducible to track cycling performance [11]. The simulation experience is an egocentric viewpoint from the perspective of the Pursuiter’s Line. Riding against the user in the Sprinter’s Line is a competing avatar. For competition scalability, the virtual opponent matches the riders speed for the first three quarters of the final lap, then maintains the average speed for the remainder of the race. This segmentation is shown in Figure 3b.
2.4. User Testing
210 non-elite riders with ranging cycling experience gave informed consent to participate in the research study (Ethics Number GU2016/746). Riders were given two laps, a warm up lap and the final sprint lap. They were instructed to try to beat the competitor, but did not know that the competitors speed was dependent on theirs. Data was captured at 15 Hz including track positioning of them and the opponent, speed, power, cadence, lap times, and the position and rotation of the head in three-axes. The data was processed using a custom MATLAB (Mathworks, Natick, MA, USA) script. An assessment of functional fidelity was performed using the following criteria; if the riders completed the two laps, whether the rider beat the avatar, and the number of times the rider looked directly at the avatar for a period over 0.5 s, which was termed unique gazes (Ug).
3. Results
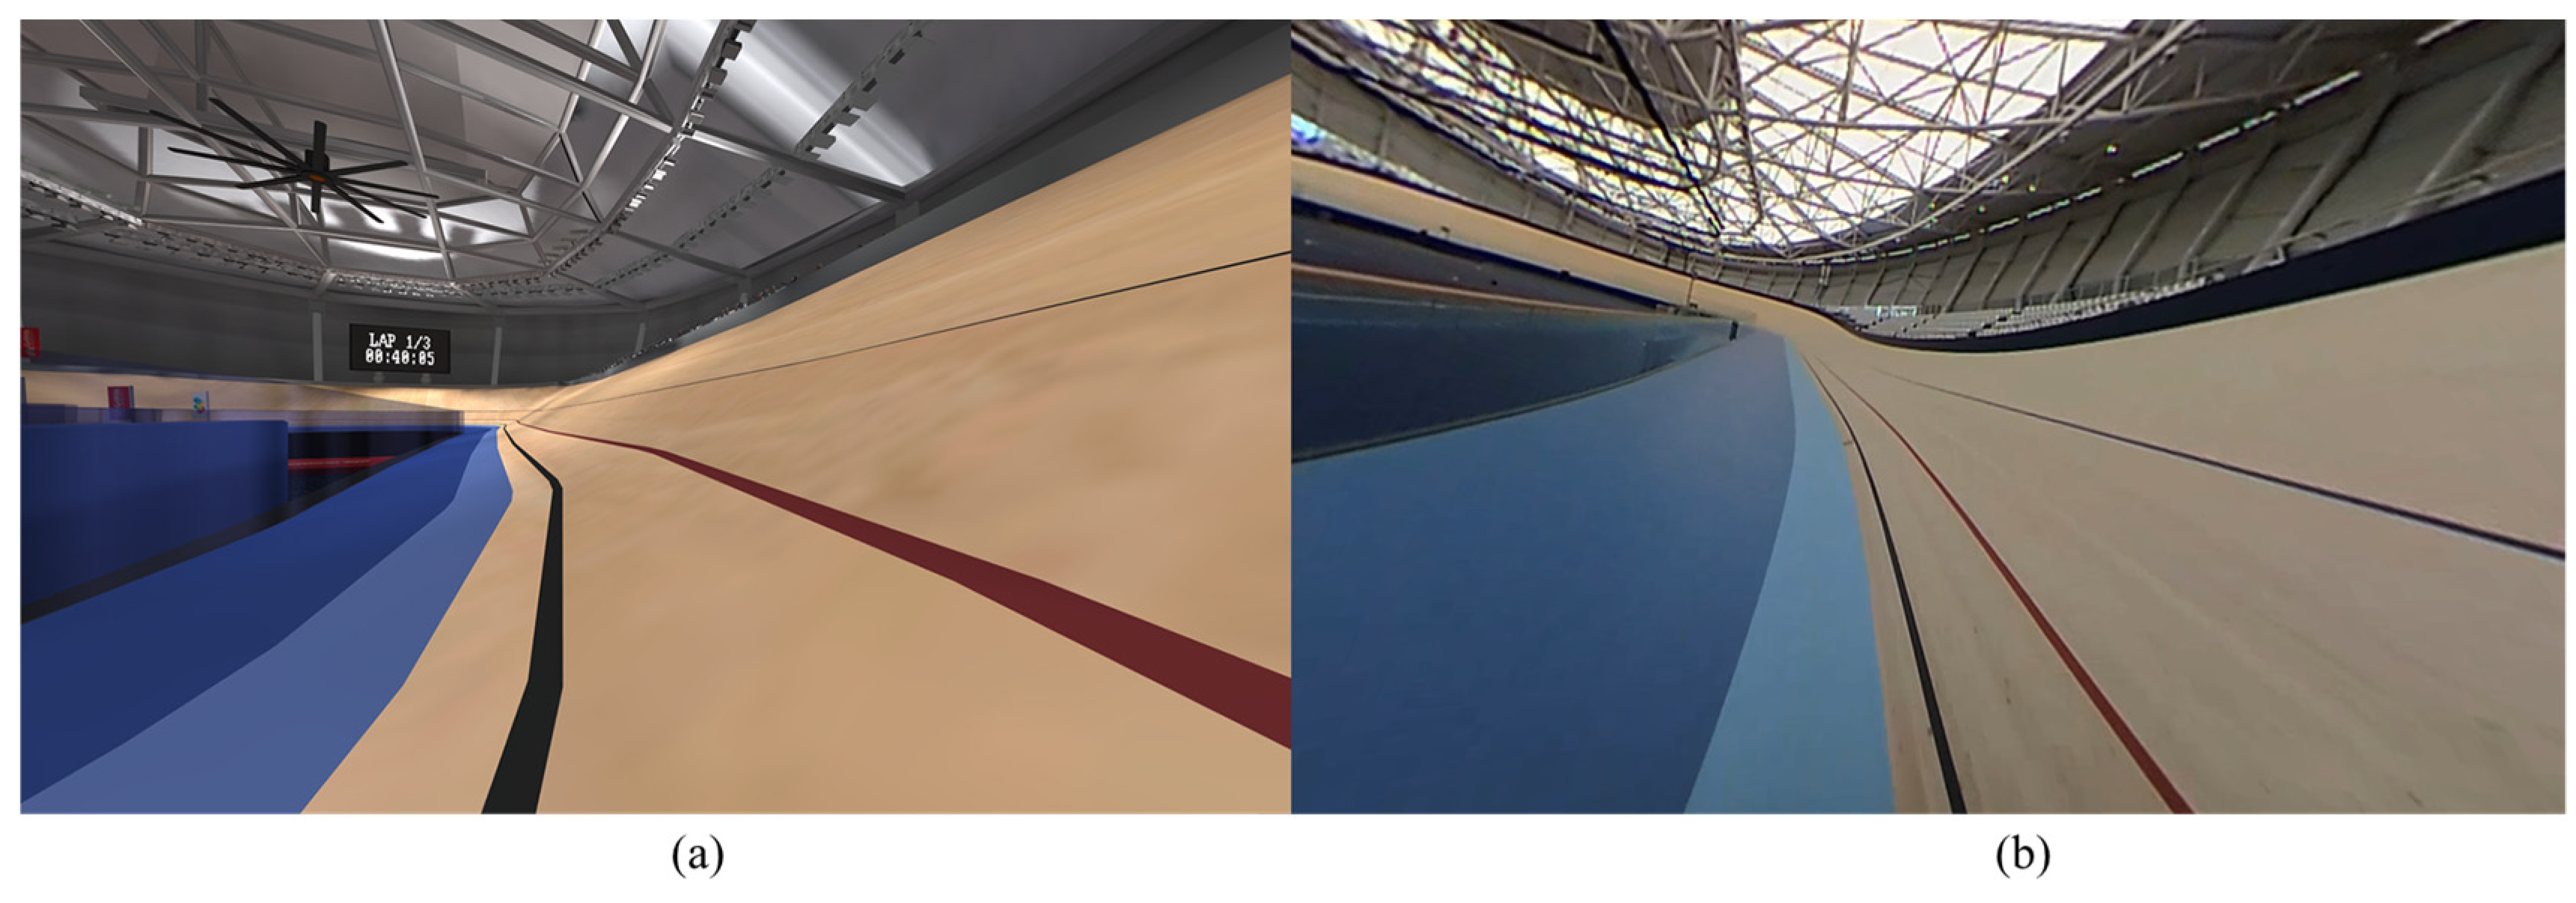
All users completed the two laps with no negative comments regarding the visual fidelity. Most remarked after participation how realistic the environment looked. Through visual comparison of the real and simulated environment, shown in Figure 4, an estimation of perpetual fidelity is possible.
Behavioural fidelity was assessed through the final lap times, with all 210 participants completing the race, shown in Figure 5.
Another marker of behavioural fidelity was the outcomes against the avatar opponent in terms of win/loss percentages and the number of times the riders looked at the opponent.
4. Discussion
Adapting Miles et al. [3] success criteria, the visual fidelity is adequate to keep the riders immersed, as evidenced in Figure 4 and through user feedback. To further improve visual fidelity, novel technologies such as laser scanning or real-world footage could be utilized to maximise the visual acuity of the environment. However, improving the visual fidelity of the simulated environment may not be imperative for a transfer of training if immersion is maintained [2].
A determination of whether the athlete beat the competing avatar was used as marker of behavioural fidelity. It would be expected that a high percentage of non-elite riders would fatigue towards the end of the race, and therefore lose against the opponent. However, as indicated in Table 1, the win percentage was 43.33 ± 0.5%, inferring a behavioural change has occurred as a result of the virtual environment. As the VR simulator created the affordances for this behavioural change, it could be reasoned that it is of a sufficient level of behavioural fidelity. Delving into the factors behind this change is possible through the medium of VR as the simulation is both controlled and measured.
This is a large benefit of VR simulators as they allow practitioners to understand why this behavioural change has occurred, which could create actionable insights into performance. To evidence this one performance feature extracted was the number of times a participant looked at the opponent, or unique gazes, during the final lap. A weak correlation was evident, indicating the winning percentage increased as the amount of gazes increased. Assessing whether this insight is present in elite track cyclists in both the simulated and in the real world environment will determine if this is an influential factor in the athlete’s performance. From this the simulator could be iterated to encourage optimal visual search strategies to optimise performance, which can then be transferred into the performance domain. To further investigate behavioural fidelity, the actions of the athletes could also be assessed. Future work will perform a thorough biomechanical analysis with the aim to contrast the cyclist’s movements from the reference data from the velodrome, the simulator, and riding the Wattbike without VR augmentation. This will determine whether the virtual environment improves the biomechanical validity of ergometer training.
5. Conclusions
Virtual reality has the potential to be a powerful technology in training athletes. This allows researchers and practitioner to measure previously unattainable measures, for example measuring the way the athlete is interacting with the environment. Using a four-step approach, we demonstrate a feasible operational framework for engineering a sports simulator. Further iteration and analysis of this simulator with the aim of increasing fidelity and creating sports simulators from different sports will help confirm the generalizability of this framework and more deeply understand the power of VR technology in measuring and improving performance.
Acknowledgments
The authors would like to thank the Queensland Academy of Sport and Advanced Queensland for providing project funding. We would also like to additionally thank the Chandler Sports Complex for facilitating velodrome access, and to the students from Griffith University VRC team for the creation of the initial prototype for this project.
Conflicts of Interest
The authors declare no conflict of interest. The funding sponsors had no role in the design of the study; in the collection, analyses, or interpretation of data; in the writing of the manuscript, and in the decision to publish the results.
References
- Bideau, B.; Kulpa, R.; Vignais, N.; Brault, S.; Multon, F.; Craig, C. Using Virtual Reality to Analyze Sports Performance. IEEE Comput. Graph. Appl. 2010, 30, 14–21. [Google Scholar] [PubMed]
- Craig, C. Understanding perception and action in sport: How can virtual reality technology help? Sports Technol. 2013, 6, 161–169. [Google Scholar] [CrossRef]
- Miles, H.C.; Pop, S.R.; Watt, S.J.; Lawrence, G.P.; John, N.W. A review of virtual environments for training in ball sports. Comput. Graph. 2012, 36, 714–726. [Google Scholar] [CrossRef]
- STRIVR Labs Inc. Sports Training. STRIVR: Changing the Way Athletes Prepare for Competition. 2017. Available online: https://www.strivr.com/sports/ (accessed on 9 July 2017).
- Covaci, A.; Postelnicu, C.-C.; Panfir, A.N.; Talaba, D. A Virtual Reality Simulator for Basketball Free-Throw Skills Development. In Technological Innovation for Value Creation; Camarinha-Matos, L.M., Shahamatnia, E., Nunes, G., Eds.; Springer: Berlin/Heidelberg, Germany, 2012; Volume 372, pp. 105–112. [Google Scholar]
- Zaal, F.T.J.M.; Bootsma, R.J. Virtual Reality as a Tool for the Study of Perception-Action: The Case of Running to Catch Fly Balls. Presence Teleoper. Virtual Environ. 2011, 20, 93–103. [Google Scholar] [CrossRef]
- Kulpa, R.; Multon, F.; Argelaguet, F. Virtual Reality & Sport. In Proceedings of the ISBS 2016 Conference, Tsukuba, Japan, 18–22 July 2016. [Google Scholar]
- Held, R.M.; Durlach, N.I. Telepresence. Presence Teleoper. Virtual Environ. 1992, 1, 109–112. [Google Scholar] [CrossRef]
- Leadbetter, R.; James, D. Platform Technologies and Visualisation Tools for Sensors in Sport and Health Applications. Hum. Technol. Proc. Eng. Theme 3 Retreat 2016, 1, 9–10. [Google Scholar]
- Lai, A.; James, D.A.; Hayes, J.P.; Harvey, E.C. Semi-automatic calibration technique using six inertial frames of reference. In Proceedings of the SPIE the International Society for Optical Engineering, Denver, CO, USA, 2–3 August 2004; pp. 531–542. [Google Scholar]
- Driller, M.W.; Argus, C.K.; Shing, C.M. The Reliability of a 30-s Sprint Test on the Wattbike Cycle Ergometer. Int. J. Sports Physiol. Perform. 2013, 8, 379–383. [Google Scholar] [CrossRef] [PubMed]
Figure 2.
Data capture devices and their located positions on the athlete’s person and on the bike.

Figure 3.
(a) VR simulator implementation: Wattbike Pro connected to a PC with Oculus Rift HMD connected. A LCD monitor projects what the rider is seeing; (b) A schematic of the track used with the riders riding anticlockwise. The avatar maintained the average lap speed from the first three quarters of the lap (red-line to red-line) for the last quarter.

Figure 4.
(a) Visual comparison of virtual environment contrasted with (b), the footage collected from the reference testing from the handlebar mounted action camera taken from a similar aspect.
Figure 4.
(a) Visual comparison of virtual environment contrasted with (b), the footage collected from the reference testing from the handlebar mounted action camera taken from a similar aspect.

Figure 5.
Final lap (lap 2) times for the 210 participants.


Table 1.
Combined outputs from the 210 riders. Showing the percentage of overall wins against the avatar (%win), number of unique gazes at the avatar (Ug), unique gazes average if the rider lost (n = 119), unique gazes if a loss was recorded (n = 91).
Table 1.
Combined outputs from the 210 riders. Showing the percentage of overall wins against the avatar (%win), number of unique gazes at the avatar (Ug), unique gazes average if the rider lost (n = 119), unique gazes if a loss was recorded (n = 91).
| Factor | %Win | Ug | Ug (Lose) | Ug (win) | Last Lap (%) | Lap Time (s) |
|---|---|---|---|---|---|---|
| Mean | 43.33 ± 0.5 | 3.2 ± 3.2 | 3.05 ± 2.6 | 3.4 ± 3.9 | 137.31 ± 38.7 | 23.11 ± 4 |
Publisher’s Note: MDPI stays neutral with regard to jurisdictional claims in published maps and institutional affiliations. |
© 2018 by the authors. Licensee MDPI, Basel, Switzerland. This article is an open access article distributed under the terms and conditions of the Creative Commons Attribution (CC BY) license (https://creativecommons.org/licenses/by/4.0/).
Share and Cite
MDPI and ACS Style
Shepherd, J.; Carter, L.; Pepping, G.-J.; Potter, L.-E. Towards an Operational Framework for Designing Training Based Sports Virtual Reality Performance Simulators. Proceedings 2018, 2, 214. https://doi.org/10.3390/proceedings2060214
AMA Style
Shepherd J, Carter L, Pepping G-J, Potter L-E. Towards an Operational Framework for Designing Training Based Sports Virtual Reality Performance Simulators. Proceedings. 2018; 2(6):214. https://doi.org/10.3390/proceedings2060214
Chicago/Turabian StyleShepherd, Jonathan, Lewis Carter, Gert-Jan Pepping, and Leigh-Ellen Potter. 2018. "Towards an Operational Framework for Designing Training Based Sports Virtual Reality Performance Simulators" Proceedings 2, no. 6: 214. https://doi.org/10.3390/proceedings2060214