Machine-Readable Pattern for Colorimetric Sensor Interrogation †


1
MIND, Department of Electronic & Biomedical Engineering, Universitat de Barcelona, 08028 Barcelona,
Spain
2
Institute of Nanoscience and Nanotechnology (IN2UB), Universitat de Barcelona, 08028 Barcelona, Spain
3
CELBIOTECH-Paper Engineering Research Group, Universitat Politècnica de Catalunya, 08222 Terrassa,
Spain
*
Author to whom correspondence should be addressed.
†
Presented at the Eurosensors 2018 Conference, Graz, Austria, 9–12 September 2018.
Proceedings 2018, 2(13), 906; https://doi.org/10.3390/proceedings2130906
Published: 29 November 2018
(This article belongs to the Proceedings of EUROSENSORS 2018)
Abstract
:We present a systematic methodology to generate machine-readable patterns embodying all the elements needed to carry out colorimetric measurements with conventional color cameras in an automated, robust and accurate manner. Our approach relies on the well-stablished machine-readable features of the QR Codes, to detect the pattern, identify the color reference elements and the colorimetric spots, to calibrate the color of the image and to conclude a quantitative measurement. We illustrate our approach with a NH3 colorimetric indicator operating at distinct color temperature ambient lights, demonstrating that with our design, consistent measurements can be achieved, with independence on the illumination conditions.
1. Introduction
Colorimetric sensor interrogation using digital cameras is a convenient way to obtain quantitative measurement from colorimetric indicators for manifold applications, like gases or temperature sensing [1]. However, the method is very sensitive to external factors like ambient light, camera setup, etc. To achieve accurate, reliable, and reproducible measurements, it is necessary to accompany the colorimetric indicators with a set of color references capable of correcting most of these effects. Also, to make possible automatic readout, such elements must be arranged in a machine-readable configuration. To design this machine-readable pattern optimized for the measurement of a certain colorimetric indicator, we propose here the following procedure: creating a color reference palette, using this color palette to design a machine-pattern and printing this palette and the colorimetric sensor using conventional techniques. We illustrate this with a NH3 colorimetric indicator [2].
2. Material and Methods
2.1. Pattern Fabrication and Experimental Conditions
First a set of color reference patterns were printed with a commercial ink-jet color printer to build up the final machine-readable devices on top of a plastic substrate, typically acetate or polyester. Then, we transferred the colorimetric indicator to well-defined areas using screen-printing. The response to gases of the machine-readable patterns was investigated exposing them to different NH3 concentrations (0–100 ppm in humid air, 50% RH), and acquiring their colors with a digital camera under illumination conditions with adjustable color temperature [3].
2.2. Color Reference Palette Construction
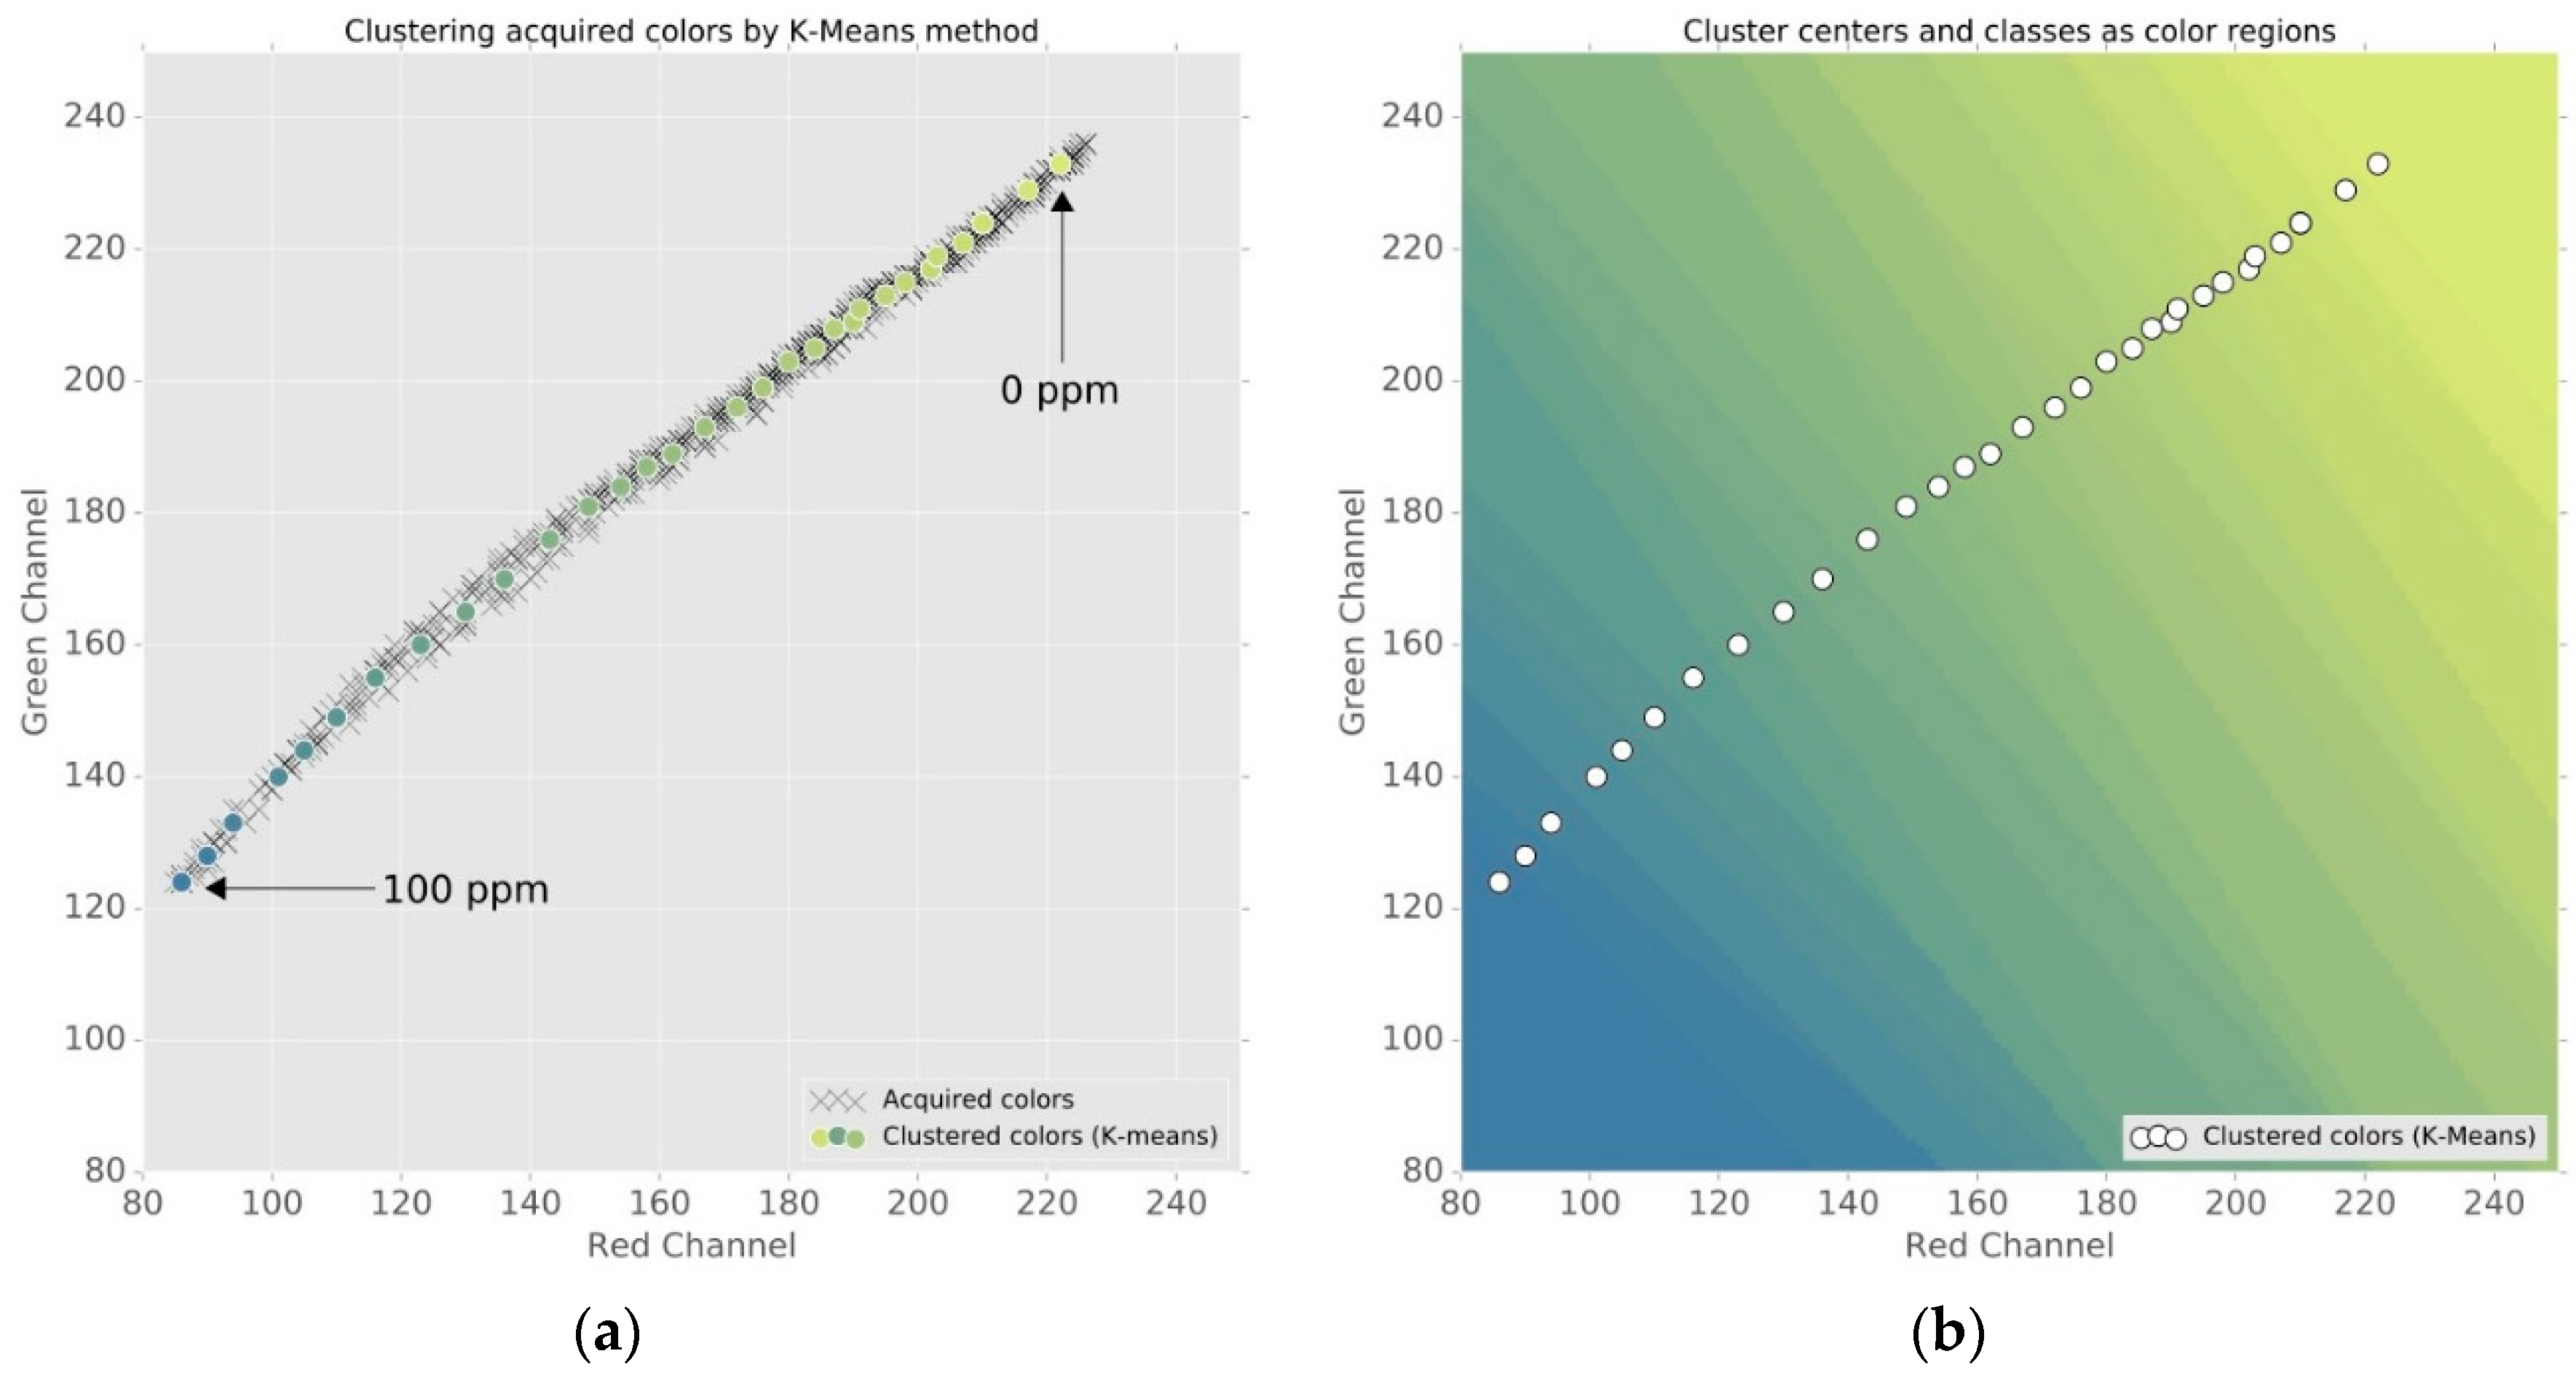
To find out the range of color shades developed by the indicator in presence of gases, we exposed the pattern to a range of NH3 concentrations (0, 5, 10, 20, 50 and 100 ppm) for 20 min per concentration, until a color change was fully developed. Then, images were captured under reference white light at 5500 K, and the ROIs (regions of interest) corresponding to the colorimetric indicator were located, cropped and saved. All the colors contained in the dataset of ROIs corresponded to the range of RGB colors that could be found in the colorimetric indicator (shown as “acquired colors” in Figure 1a).
This set of acquired colors was reduced to find out a palette of color reference which were representative of the colors expected in the indicator ink by means of K-Means clustering [4] (Figure 1b). This method allows for generating, in a systematic way, a relatively small set of color references of arbitrary size (in our case, 8, 16, 32, 64 and 128), that can be accommodated in the machine-readable pattern as a color calibration palette.
2.3. Machine-Readable Pattern Design
We chose to work on top of the QR Codes standard, which contains elements for finding, positioning, and aligning the pattern in the image, to build our machine-readable pattern [5]. Then, the pixel position normally used to allocate digital data, were used instead to accommodate the necessary color reference.
On one hand, we wanted to use as many color references as possible (8, 16, 32, 64 or 128 colors) to improve the quality of the calibration. On the other hand, using redundant (i.e., replicas) color reference would contribute to minimize the dispersion and uncertainty of the results. With all in mind, we selected the QR Code version 7, which provides an array of 45 × 45 pixels. This is more than enough to accommodate our palettes, even with replicas, as well as the color indictors.
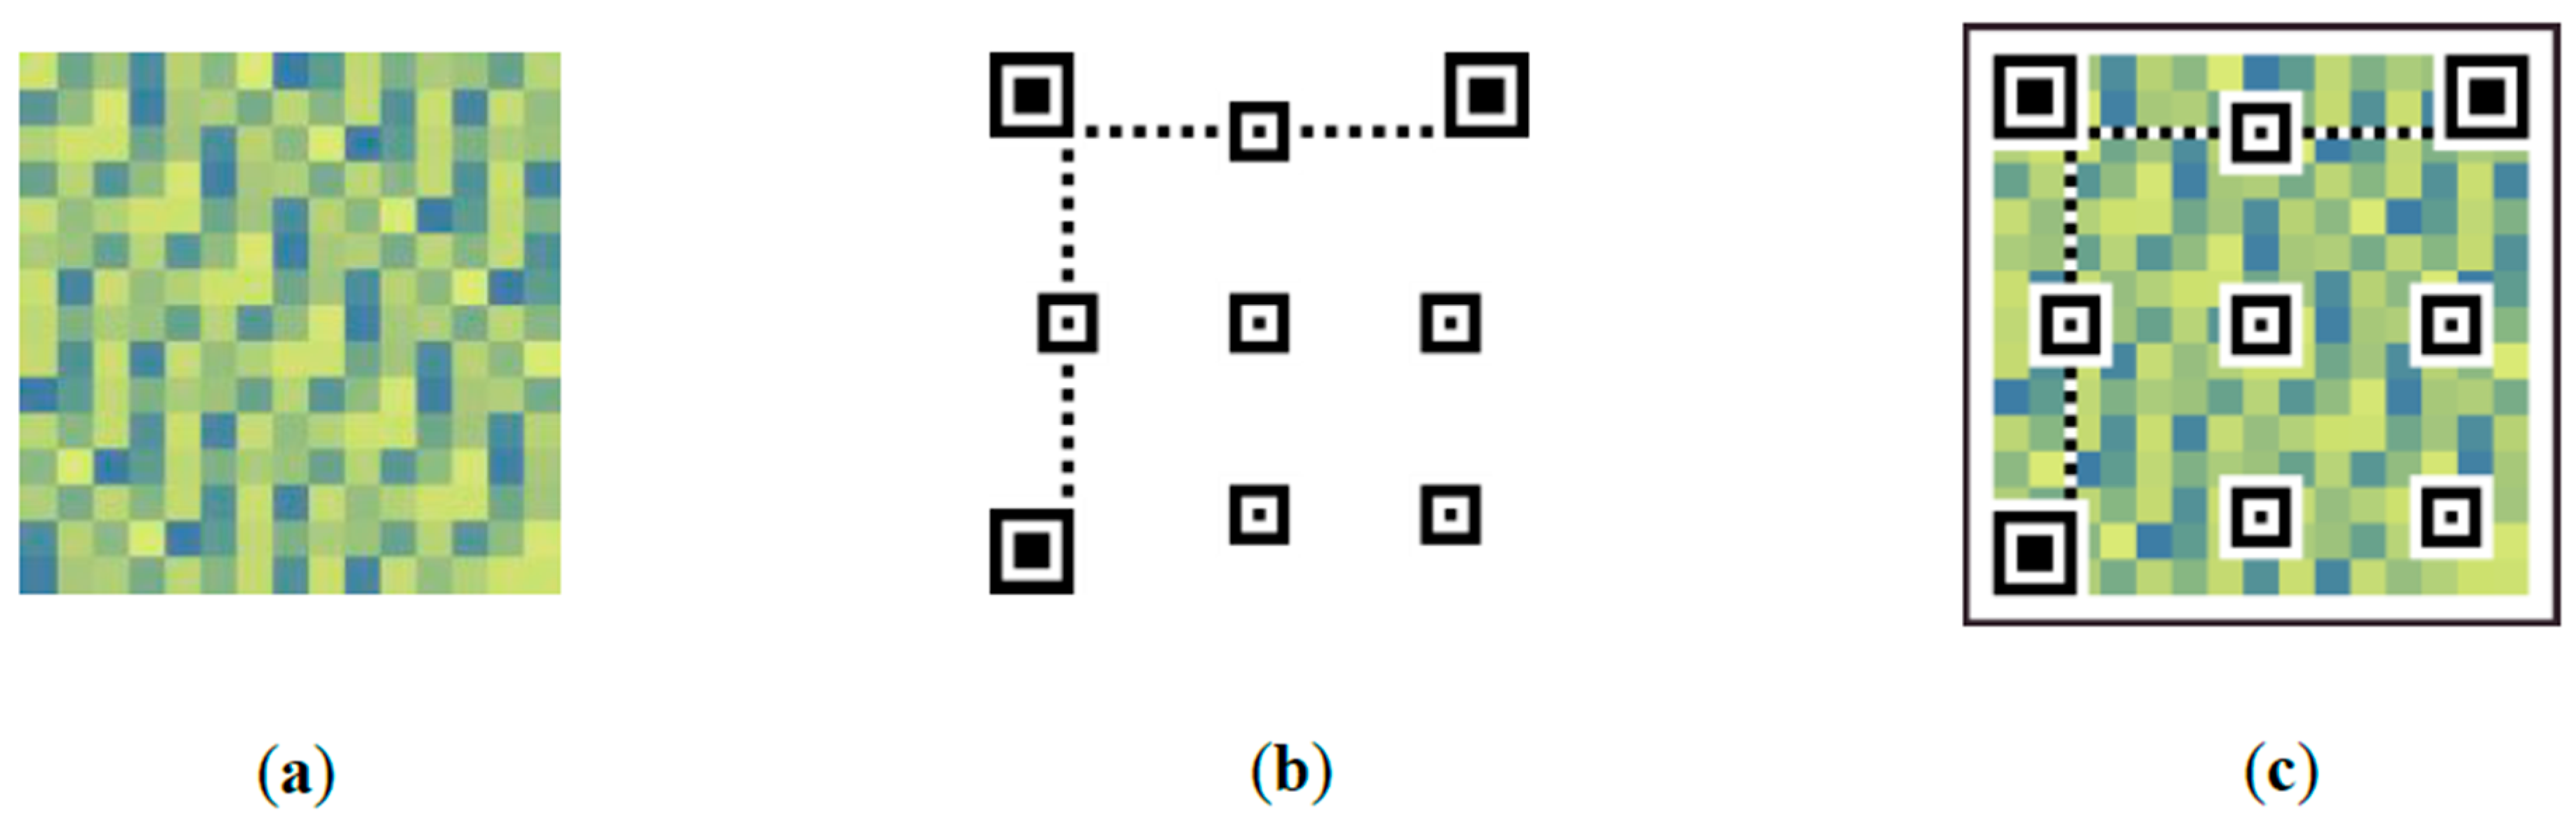
To minimize the error during the optical recognition and to facilitate the noise reduction, by means of averaging, we choose to arrange the reference colors in 3 × 3 pixels squares. This means that up to 15 × 15 independent position could be defined in a QR Code version 7. Therefore, different combinations of color palette size and number of replicas could be used, for example 32 color reference replicated up to 7 times each (Figure 2a). On top of this color patterns, the elements needed for optical recognition available in conventional QR Codes (Figure 2b) were added (Figure 2c).
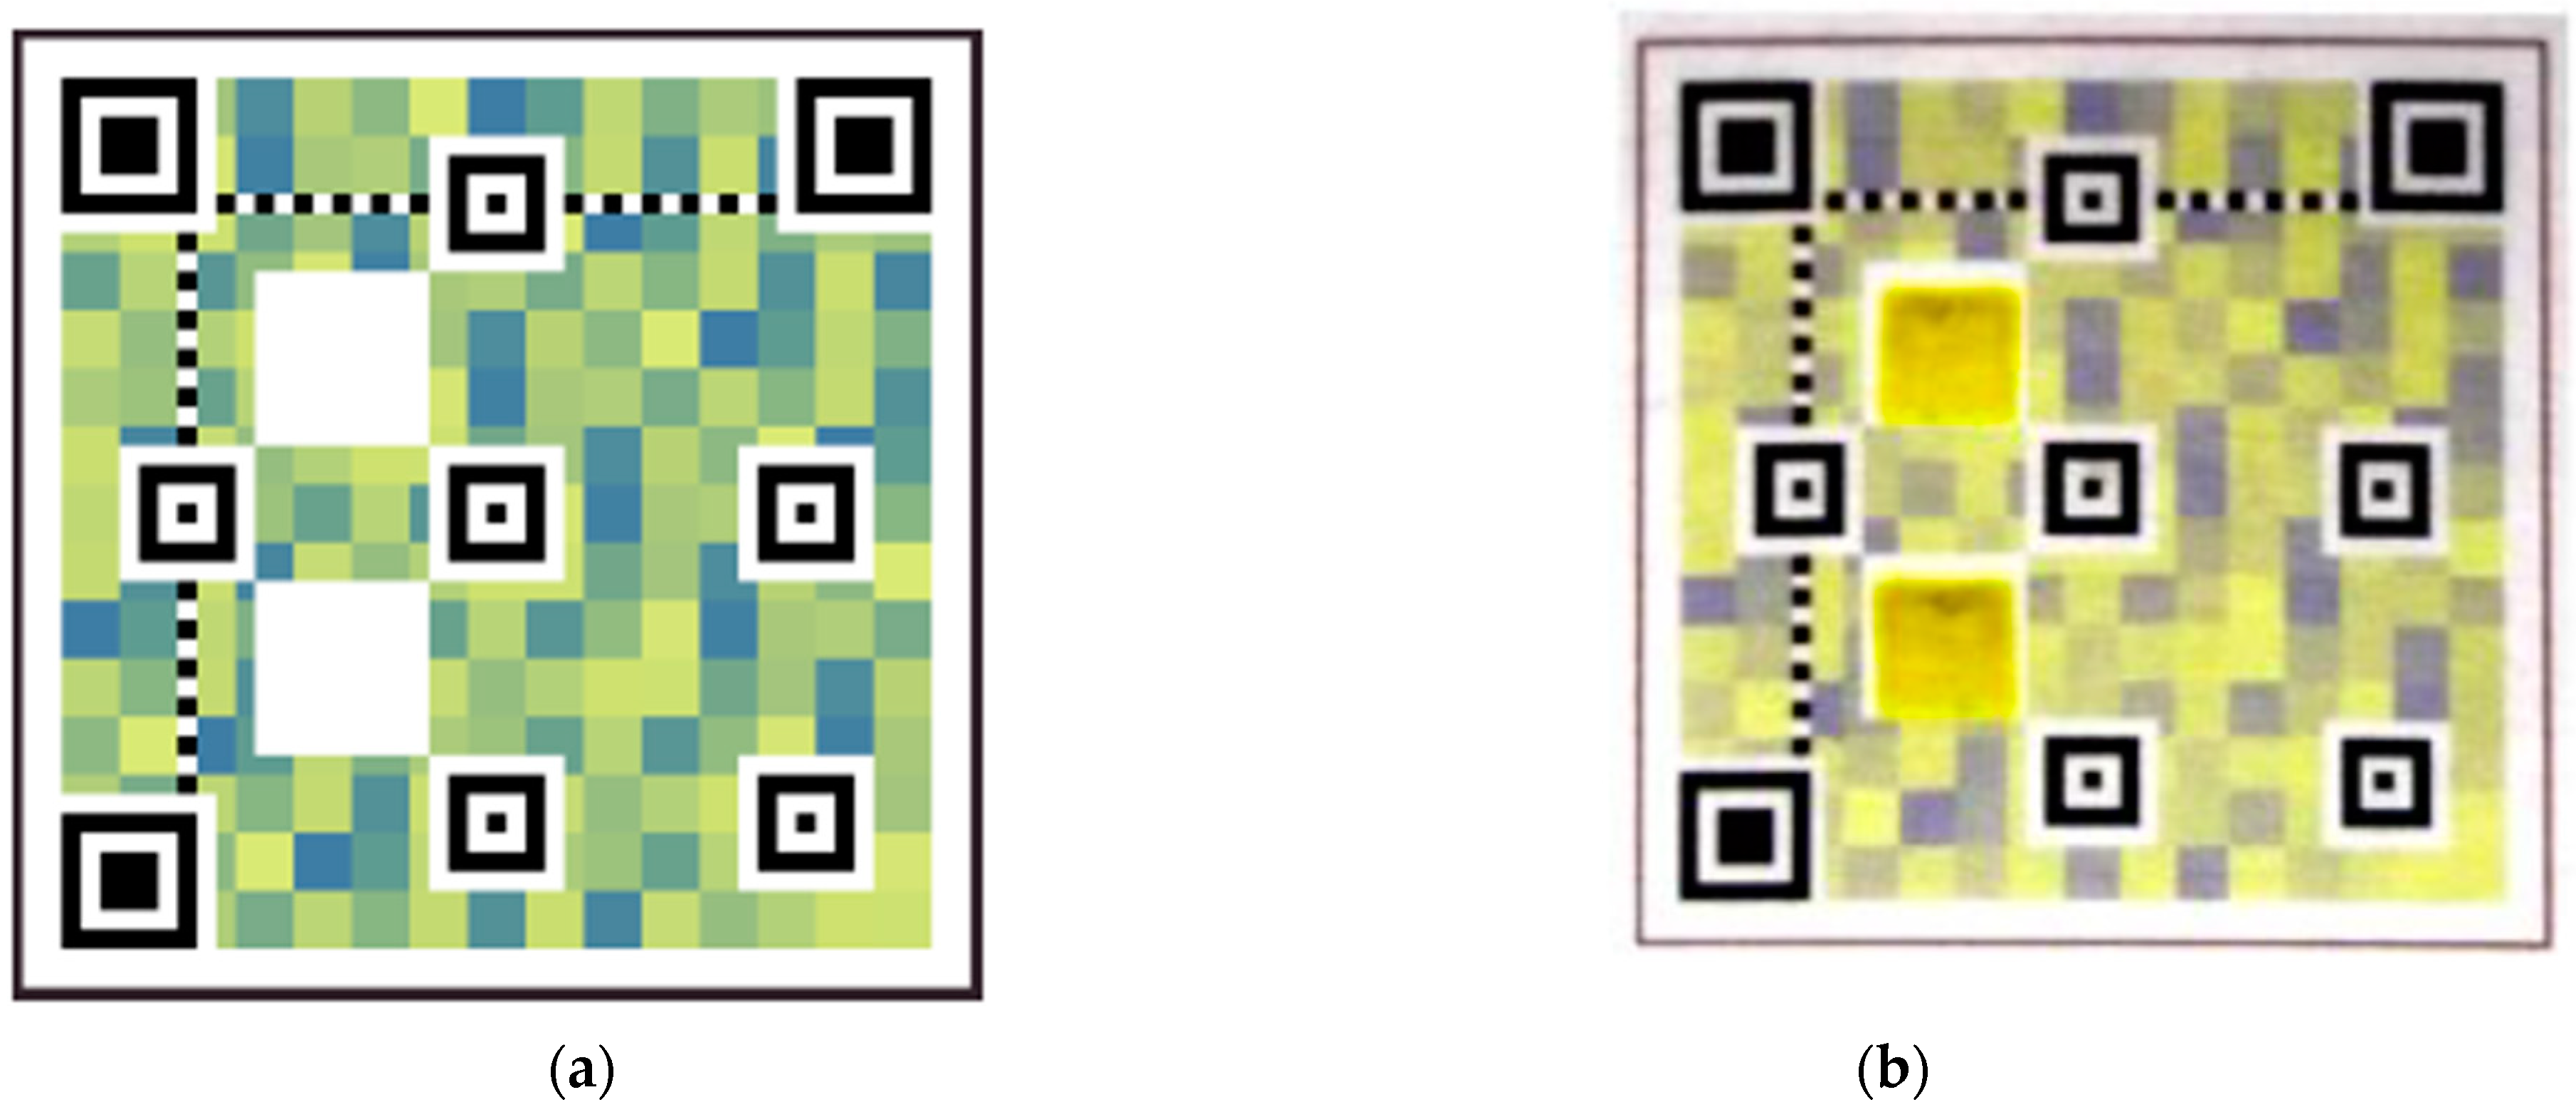
In the design, some regions in the QR Code were reserved (i.e., kept white) to allocate the colorimetric indicator (Figure 3a). The size of the regions reserved to the colorimetric indicator depends on the resolution and alignment capabilities of the printing technique used. In our case, manual screen printing required reserving a region of at least 6 × 6 pixels (Figure 3b).
3. Results
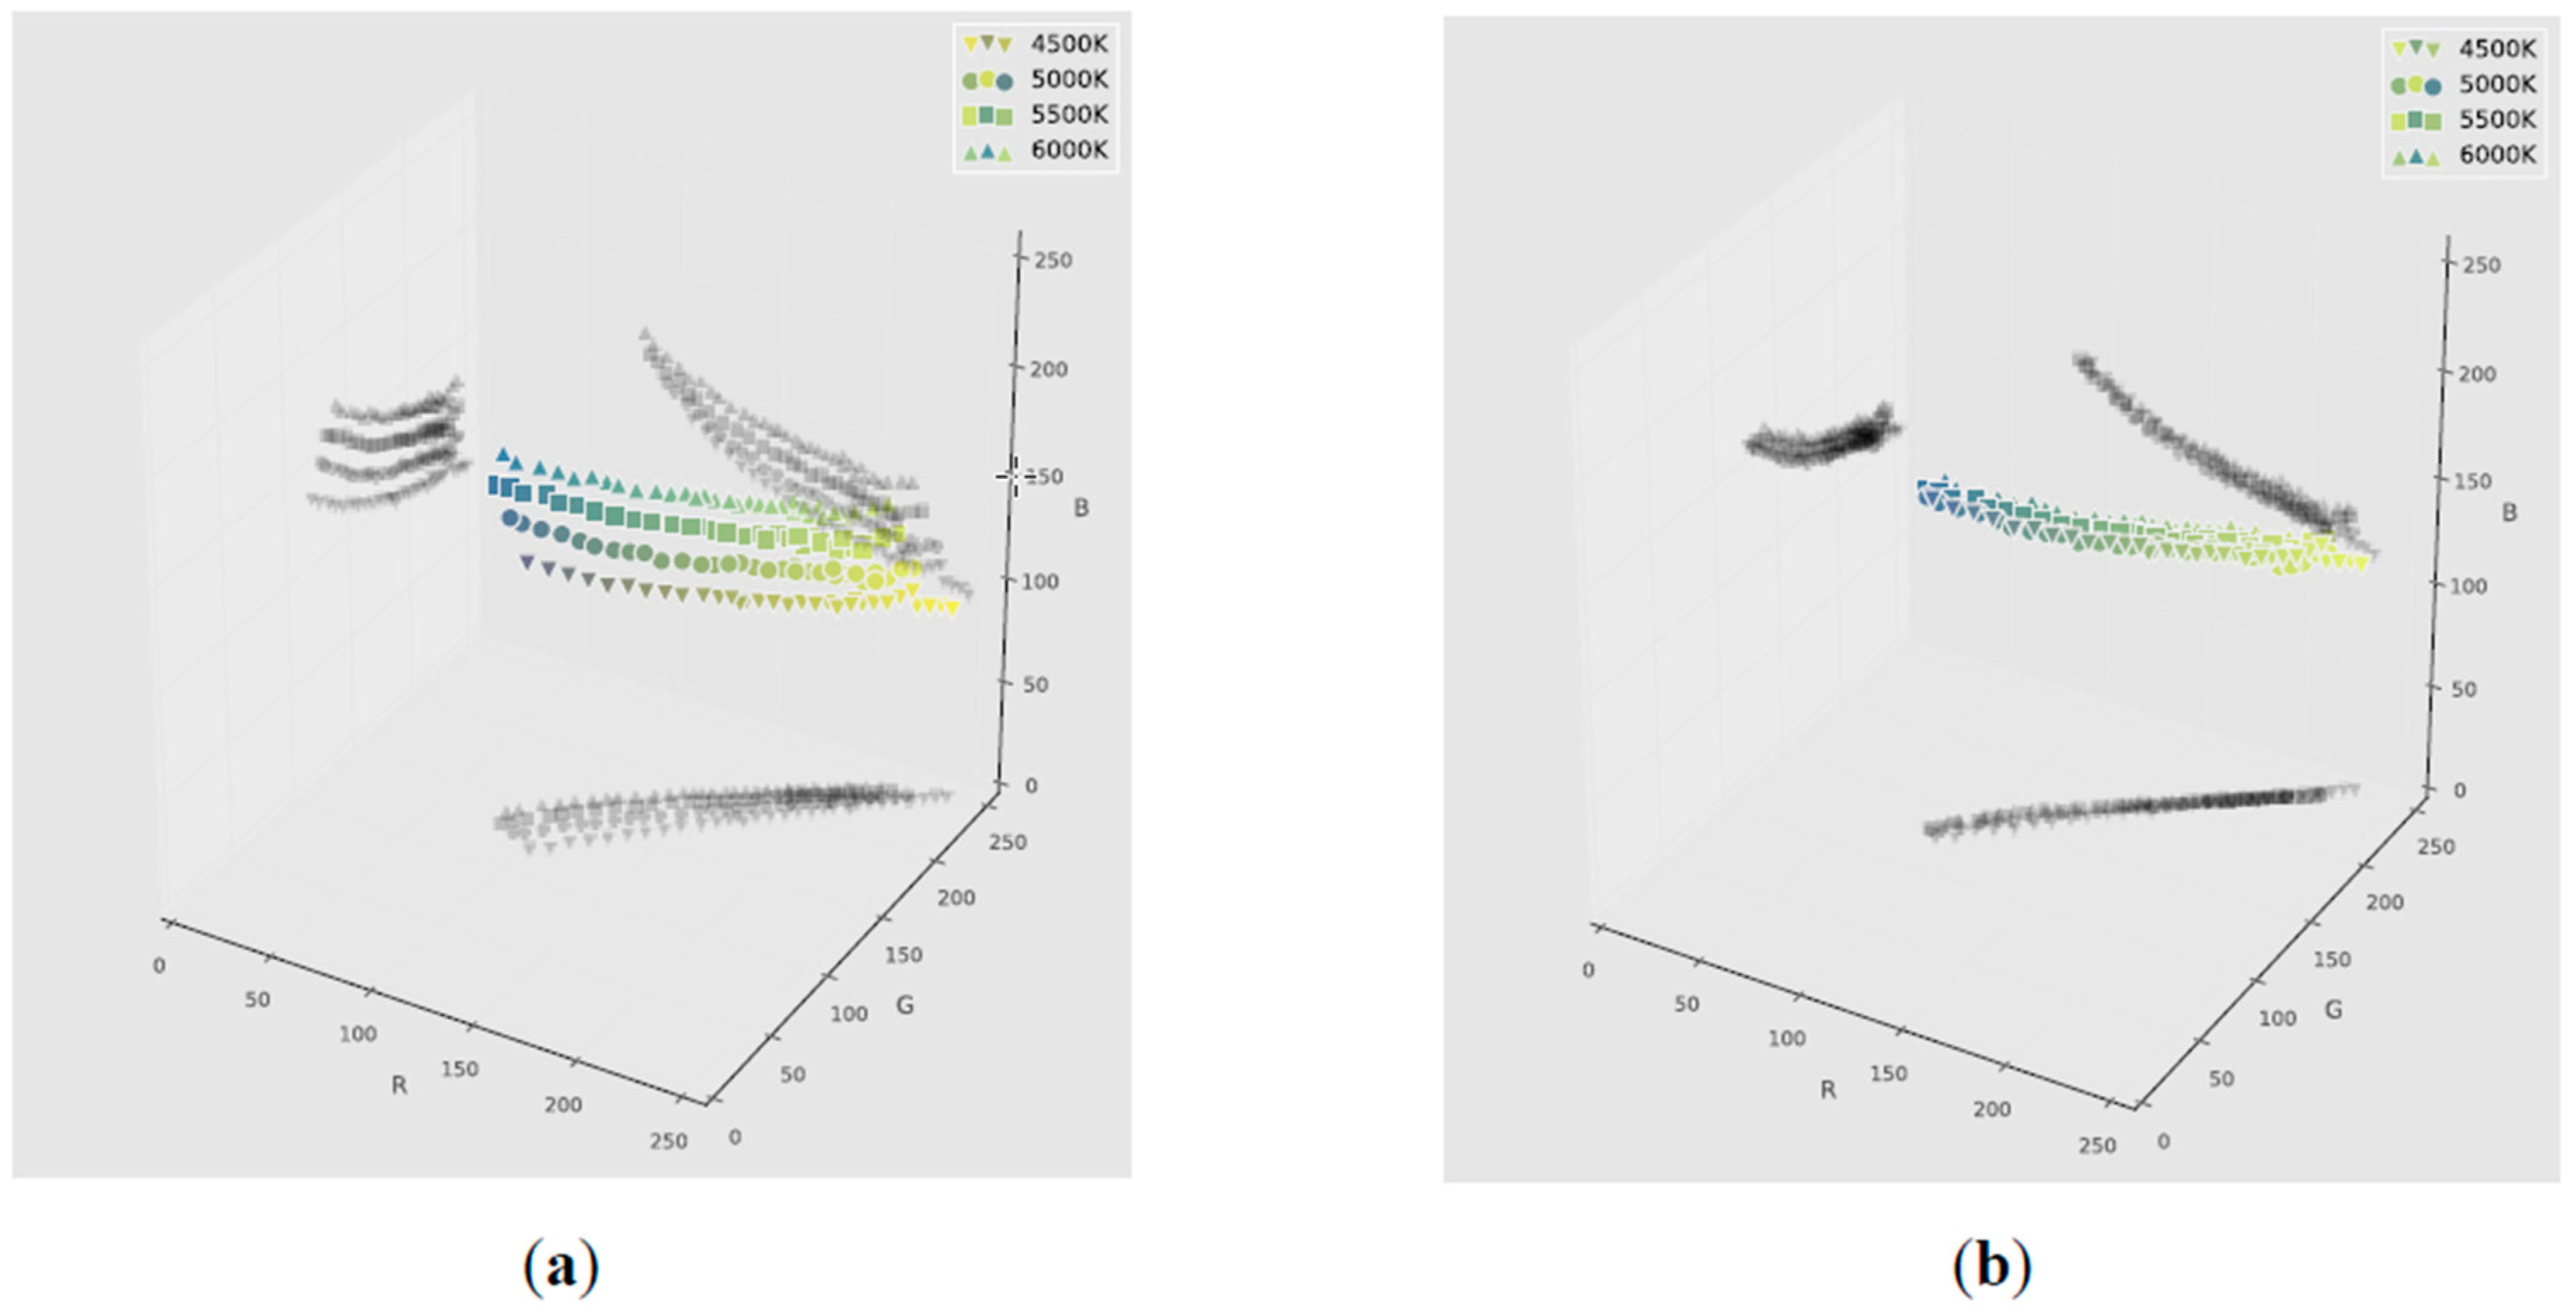
We exposed the machine-readable patterns with the color references and the colorimetric indicator to the same range of NH3 concentrations (0–100 ppm in humid air, 50% RH). Now, however, we acquired the images under different ambient lights, white light sources of temperatures from 4500 K to 6000 K.
Without any correction, the color curves of the NH3 indicator were not coincident, and unsuitable for quantitative measurements (Figure 4a). In contrast, after correcting the color curves of the indicators, by using the color references as landmarks to stablish a correspondence between apparent and real colors by means of the Thin-Plate Spline method [6], the color measurements obtained at different light temperatures were fully consistent, and suitable for quantitative measurement with an error of less than 5% (Figure 2c).
4. Conclusions
We have described a methodology to design a machine-readable pattern that can be used to quantify the color change developed in colorimetric indicators, using pictures taken with a conventional digital camera. We have demonstrated that this methodology can be applied to quantitative gas measurements with a colorimetric indicator targeting ammonia, under different illumination conditions, with and accuracy of a few points %.
Acknowledgments
The research leading to these results has received funding from the European Research Council under the European Union’s Seventh Framework Program (FP/2007–2013)/ERC Grant Agreement No. 336917 and the H2020 Framework Program ERC Grant Agreement No. 727297. J. D. Prades acknowledges the support from the Serra Húnter Program.
Conflicts of Interest
The authors declare no conflict of interest.
References
- Fàbrega, C.; Fernández, L.; Monereo, O.; Pons-Balagué, A.; Xuriguera, E.; Casals, O.; Waag, A.; Prades, J.D. Highly Specific and Wide Range NO2 Sensor with Color Readout. ACS Sensors 2017, 2–11, 1612–1618. [Google Scholar] [CrossRef] [PubMed]
- Mills, A.; Wild, L.; Chang, Q. Plastic Colorimetric Film Sensors for Gaseous Amonia. Mikrochim. Acta 1995, 121, 225–236. [Google Scholar] [CrossRef]
- Schmitt, K.; Tarantik, K.; Pannek, C.; Benito-Altamirano, I.; Casals, O.; Fàbrega, C.; Romano-Rodríguez, A.; Wöllenstein, J.; Prades, J.D. Colorimetric sensor for bad odor detection using automated color correction. Proc. SPIE 2017, 10246. [Google Scholar] [CrossRef]
- Arthur, D.; Vassilvitskii, S. K-means++: The advantages of careful seeding. In Proceedings of the Annual ACM-SIAM Symposium on Discrete Algorithms, New Orleans, LA, USA, 7–9 January 2007; pp. 1027–1035. [Google Scholar]
- ISO/IEC 18004:2015. Information Technology—Automatic Identification and Data Capture Techniques—QR Code Bar Code Symbology Specification; International Organization for Standardization: Geneva, Switzerland, 2015. [Google Scholar]
- Menesatti, P.; Angelini, C.; Pallottino, F.; Antonucci, F.; Aguzzi, J.; Costa, C. RGB Color Calibration for Quantitative Image Analysis: The “3D Thin-Plate Spline Warping Approach”. Sensors 2012, 12, 7063–7079. [Google Scholar] [CrossRef] [PubMed]
Figure 1.
(a) RGB 8-bit color data acquired from a colorimetric sensor captured with a digital camera at 5500 K color temperature exposition (2D color plane with Red and Green channels), with the centers of 32 clusters generated by K-means clustering; (b) 32 clusters centers from (a), and color clustering regions.

Figure 2.
(a) Colors from K-Means clustering (Figure 1b) spread over a square distribution with certain pattern (block size of 3 × 3 pixels, 32 different colors, 7 times redundancy), (b) computing vision patterns of a QR Code version 7 (position, alignment and timing patterns) and (c) a machine-readable pattern for colorimetric sensor interrogation.

Figure 3.
(a) A machine-readable pattern with two reserved regions to accommodate the colorimetric indicator, and (b) its captured version with two replicas of the colorimetric indicator showing color artifacts due to ambient light, camera setup, etc.
Figure 3.
(a) A machine-readable pattern with two reserved regions to accommodate the colorimetric indicator, and (b) its captured version with two replicas of the colorimetric indicator showing color artifacts due to ambient light, camera setup, etc.

Figure 4.
Color data (3D RGB 8-bit cube and corresponding 2D projections) of the NH3 indicators exposed to gas concentrations from 0 to 100 ppm in humid air (50% RH) acquired under different illumination conditions (4500 K, 5000 K, 5500 K and 6000 K color temperature); (a) before and (b) after color calibration.

Publisher’s Note: MDPI stays neutral with regard to jurisdictional claims in published maps and institutional affiliations. |
© 2018 by the authors. Licensee MDPI, Basel, Switzerland. This article is an open access article distributed under the terms and conditions of the Creative Commons Attribution (CC BY) license (https://creativecommons.org/licenses/by/4.0/).
Share and Cite
MDPI and ACS Style
Benito-Altamirano, I.; Pfeiffer, P.; Cusola, O.; Daniel Prades, J. Machine-Readable Pattern for Colorimetric Sensor Interrogation. Proceedings 2018, 2, 906. https://doi.org/10.3390/proceedings2130906
AMA Style
Benito-Altamirano I, Pfeiffer P, Cusola O, Daniel Prades J. Machine-Readable Pattern for Colorimetric Sensor Interrogation. Proceedings. 2018; 2(13):906. https://doi.org/10.3390/proceedings2130906
Chicago/Turabian StyleBenito-Altamirano, Ismael, Peter Pfeiffer, Oriol Cusola, and J. Daniel Prades. 2018. "Machine-Readable Pattern for Colorimetric Sensor Interrogation" Proceedings 2, no. 13: 906. https://doi.org/10.3390/proceedings2130906