Proceeding Paper

Screen-Printed f-EM Sensors Based on Two Chelating-Polymers and a Metal Oxide for the Continuous Detection of Cu Ions in Surface Water †

1
Faculty of Engineering and Technology, Liverpool John Moores University, Liverpool L3 3AF, UK
2
Faculty of Science, Liverpool John Moores University, Liverpool L3 3AF, UK
3
Animalia AS, Norwegian Meat and Poultry Research Centre, PO Box Økern, 0513 Oslo, Norway
*
Author to whom correspondence should be addressed.
Presented at the Eurosensors 2018 Conference, Graz, Austria, 9–12 September 2018.
Proceedings 2018, 2(13), 828; https://doi.org/10.3390/proceedings2130828
Published: 7 December 2018
(This article belongs to the Proceedings of EUROSENSORS 2018)

Abstract

:
Pollutants affect water worldwide and consequently present a risk to both the environment and to human health. Cu is an essential element for many organisms, but becomes toxic at relatively high concentrations. Current laboratory-based methods are not able to monitor water quality continuously, as they require laborious sampling and offline monitoring. A potential method that is capable to addressing this problem, guaranteeing the continuous monitoring of water resources, is the integration of microwave spectroscopy with functionalised electromagnetic (f-EM) sensors. The feasibility of using this combined method for achieving a more specific response toward low concentrations of Cu has been demonstrated.

1. Introduction

1.1. Cu Pollution

Copper (Cu) pollution of water can cause acute and chronic toxicity even at low concentrations, due to its potential for bioaccumulation and its bioavailability [1]. Environmental quality standards (EQS) for Cu in drinking water have been defined by the World Health Organisation (2 mg/L) and the UN Protection Agency (1.3 mg/L) [2]. Lower safe levels were established for surface water by the EU Water Framework Directive (<28 μg/L) for protecting aquatic organisms and to avoid the introduction of abnormal concentrations of Cu into the food chain.
Strategies for continuous monitoring Cu in water resources are currently limited by logistical constraints, sampling errors and costly off-line laboratory-based methods of analysis. Consequently, it is necessary to develop new sensing systems for the continuous detection of Cu (and other toxic metals) in water [2].

1.2. Microwave Spectroscopy and f-EM Sensors

A potential novel approach for meeting the current demand for cost-effective real-time water quality monitoring is a microwave sensing method [3]. The principle is based on the interaction of EM (electromagnetic) waves with the sample under test. The response of the sensor manifests itself as a resonant frequency change, alteration in the signal amplitude or a resonant peak shift. The sensitivity and selectivity toward a specific pollutant is then increased by the integration of functional materials [4,5].
Planar EM sensors were functionalised with two chelating polymers, namely chitosan and L-cysteine, and a resistive metal oxide, ruthenium (VI) oxide (acronym: L-Cy-Ch-Ru), using screen-printing technology. L-cysteine and chitosan (Figure 1a) have reactive amine and hydroxyl groups which serve as the active sites for interaction with Cu ions in aqueous media [6,7]. The resistive metal oxide showed higher sensitivity in impedance measurements of the sensor when exposed to Cu ions. The purpose of this paper is to evaluate the feasibility of an integrated method using microwave spectroscopy and electrical measurement with f-EM sensors based on L-Cy-Ch-Ru for detecting Cu ions in water with higher specificity than uncoated sensors.

2. Materials and Method

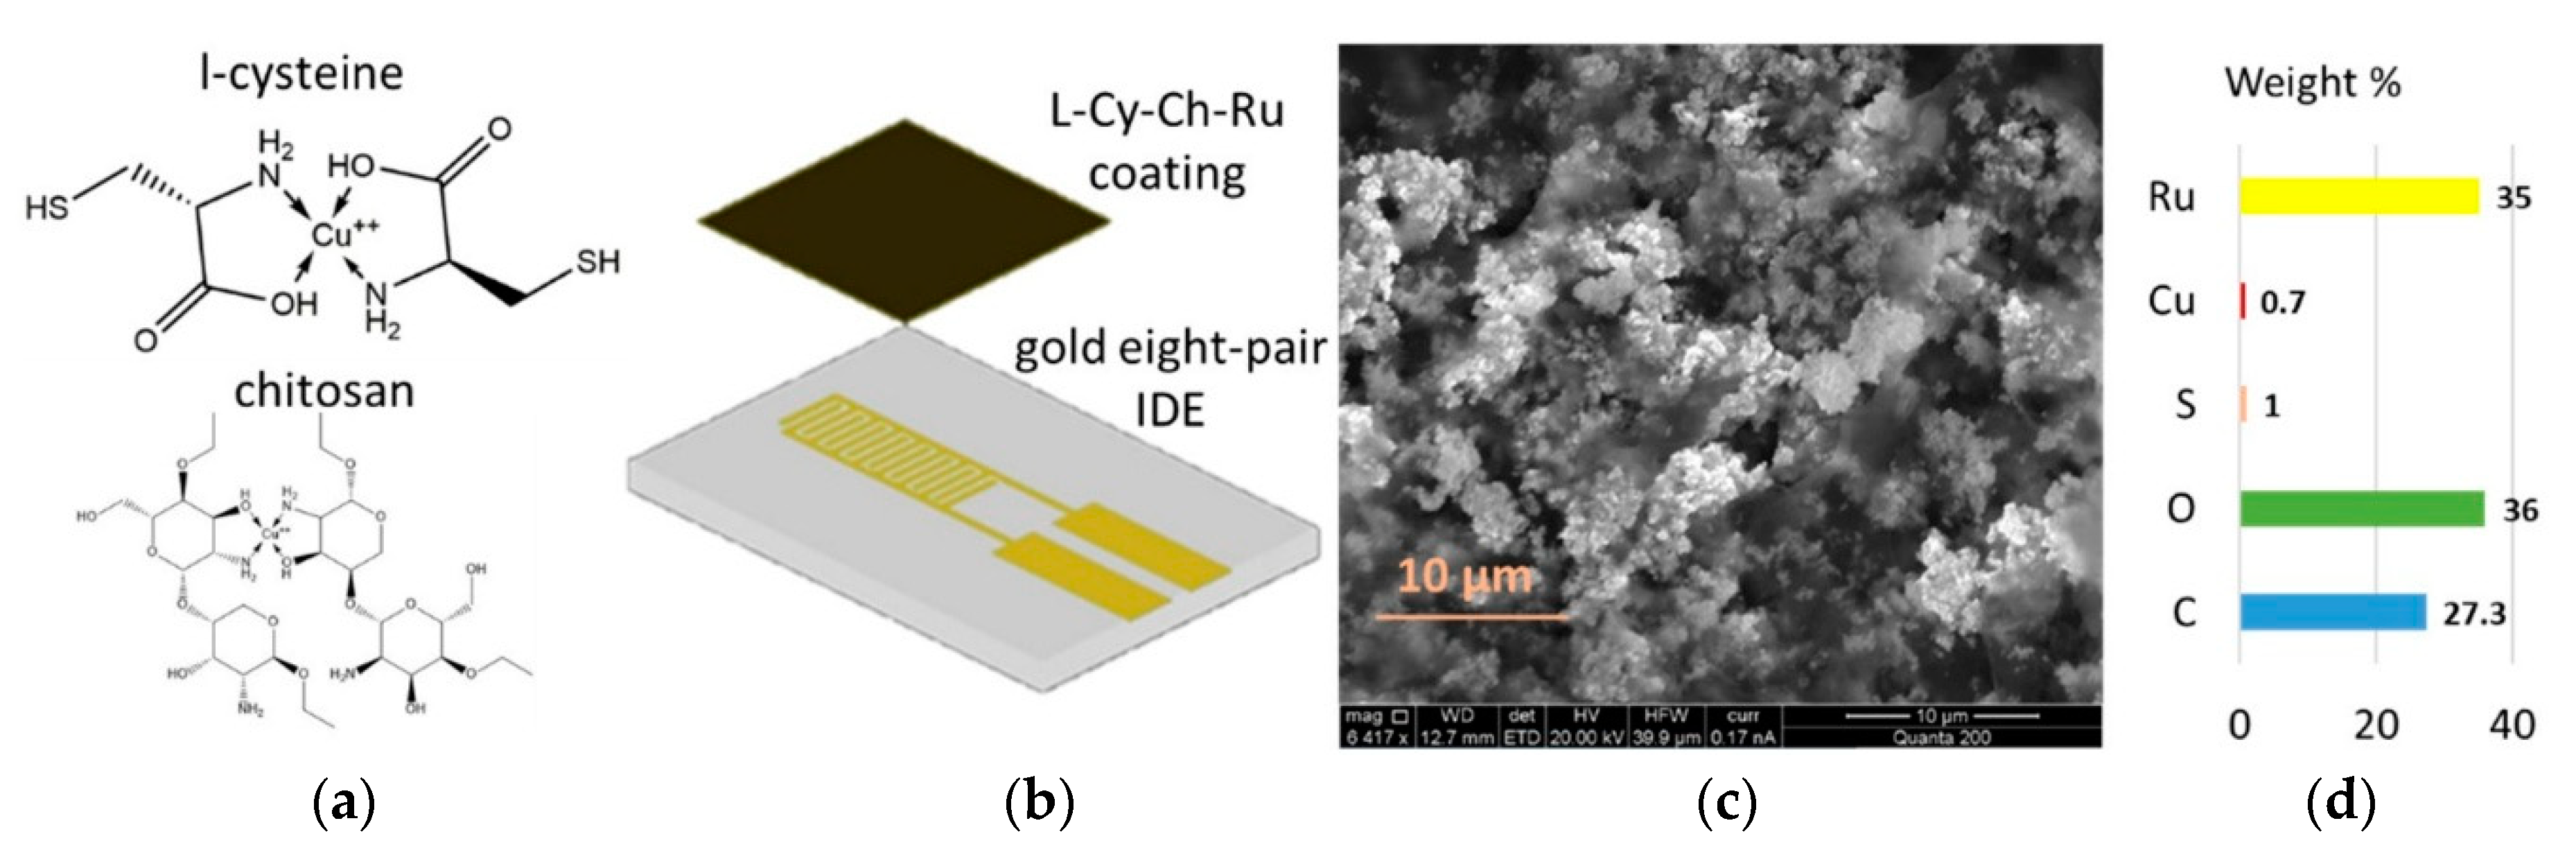
2.1. Coating Development and Characterisation

Planar sensors with gold eight-pair interdigitated electrodes (IDE) pattern on a polytetrafluoroethylene (PTFE) substrate (Figure 1b) were functionalised by screen-printing a paste mixture based on L-Cy-Ch-Ru (4:4:1) (Sigma-Aldrich 168149, 448869 and 238058, St. Louis, MI, USA). The powders were mixed with an organic binder (Butvar B98, 7.5wt.%, Sigma-Aldrich B0154) and an organic volatile solvent (ethylene glycol butyl ether, Sigma-Aldrich 579556) to form a paste with the appropriate viscosity to be printed with a semi-automatic screen-printer (Super Primex) onto planar IDE sensors. Several silver eight-pair IDE patterns were also screen-printed on microscope slide substrates and covered with paste mixtures using various percentages of the functional materials for an initial characterisation using impedance measurements. The thickness of the L-Cy-Ch-Ru based thick film was increased by multiple screen-printing, with suitable curing of the layers in an oven at 150° C for 1 hour between each print. Coating properties were measured through optical (with a UV-Vis Spectrophotometer, Jenway 7315), structural (with a scanning electron microscope, SEM, model FEI—Quanta 200) (Figure 1c) and elemental (with an X-Ray Fluorescence Analyser, XRF, model INCA-X-act) (Figure 1d) measurements.
Figure 1. (a) Sketched model for chelation between L-cysteine (above) and chitosan (below), selective polymers, and Cu ions using Chem3D. (b) Schematic drawing of the IDE sensor and L-Cy-Ch-Ru thick film. (c) SEM image of the coating and (d) its elemental composition (%) measured with the XRF after the interaction with Cu ions.
Proceedings 02 00828 g001

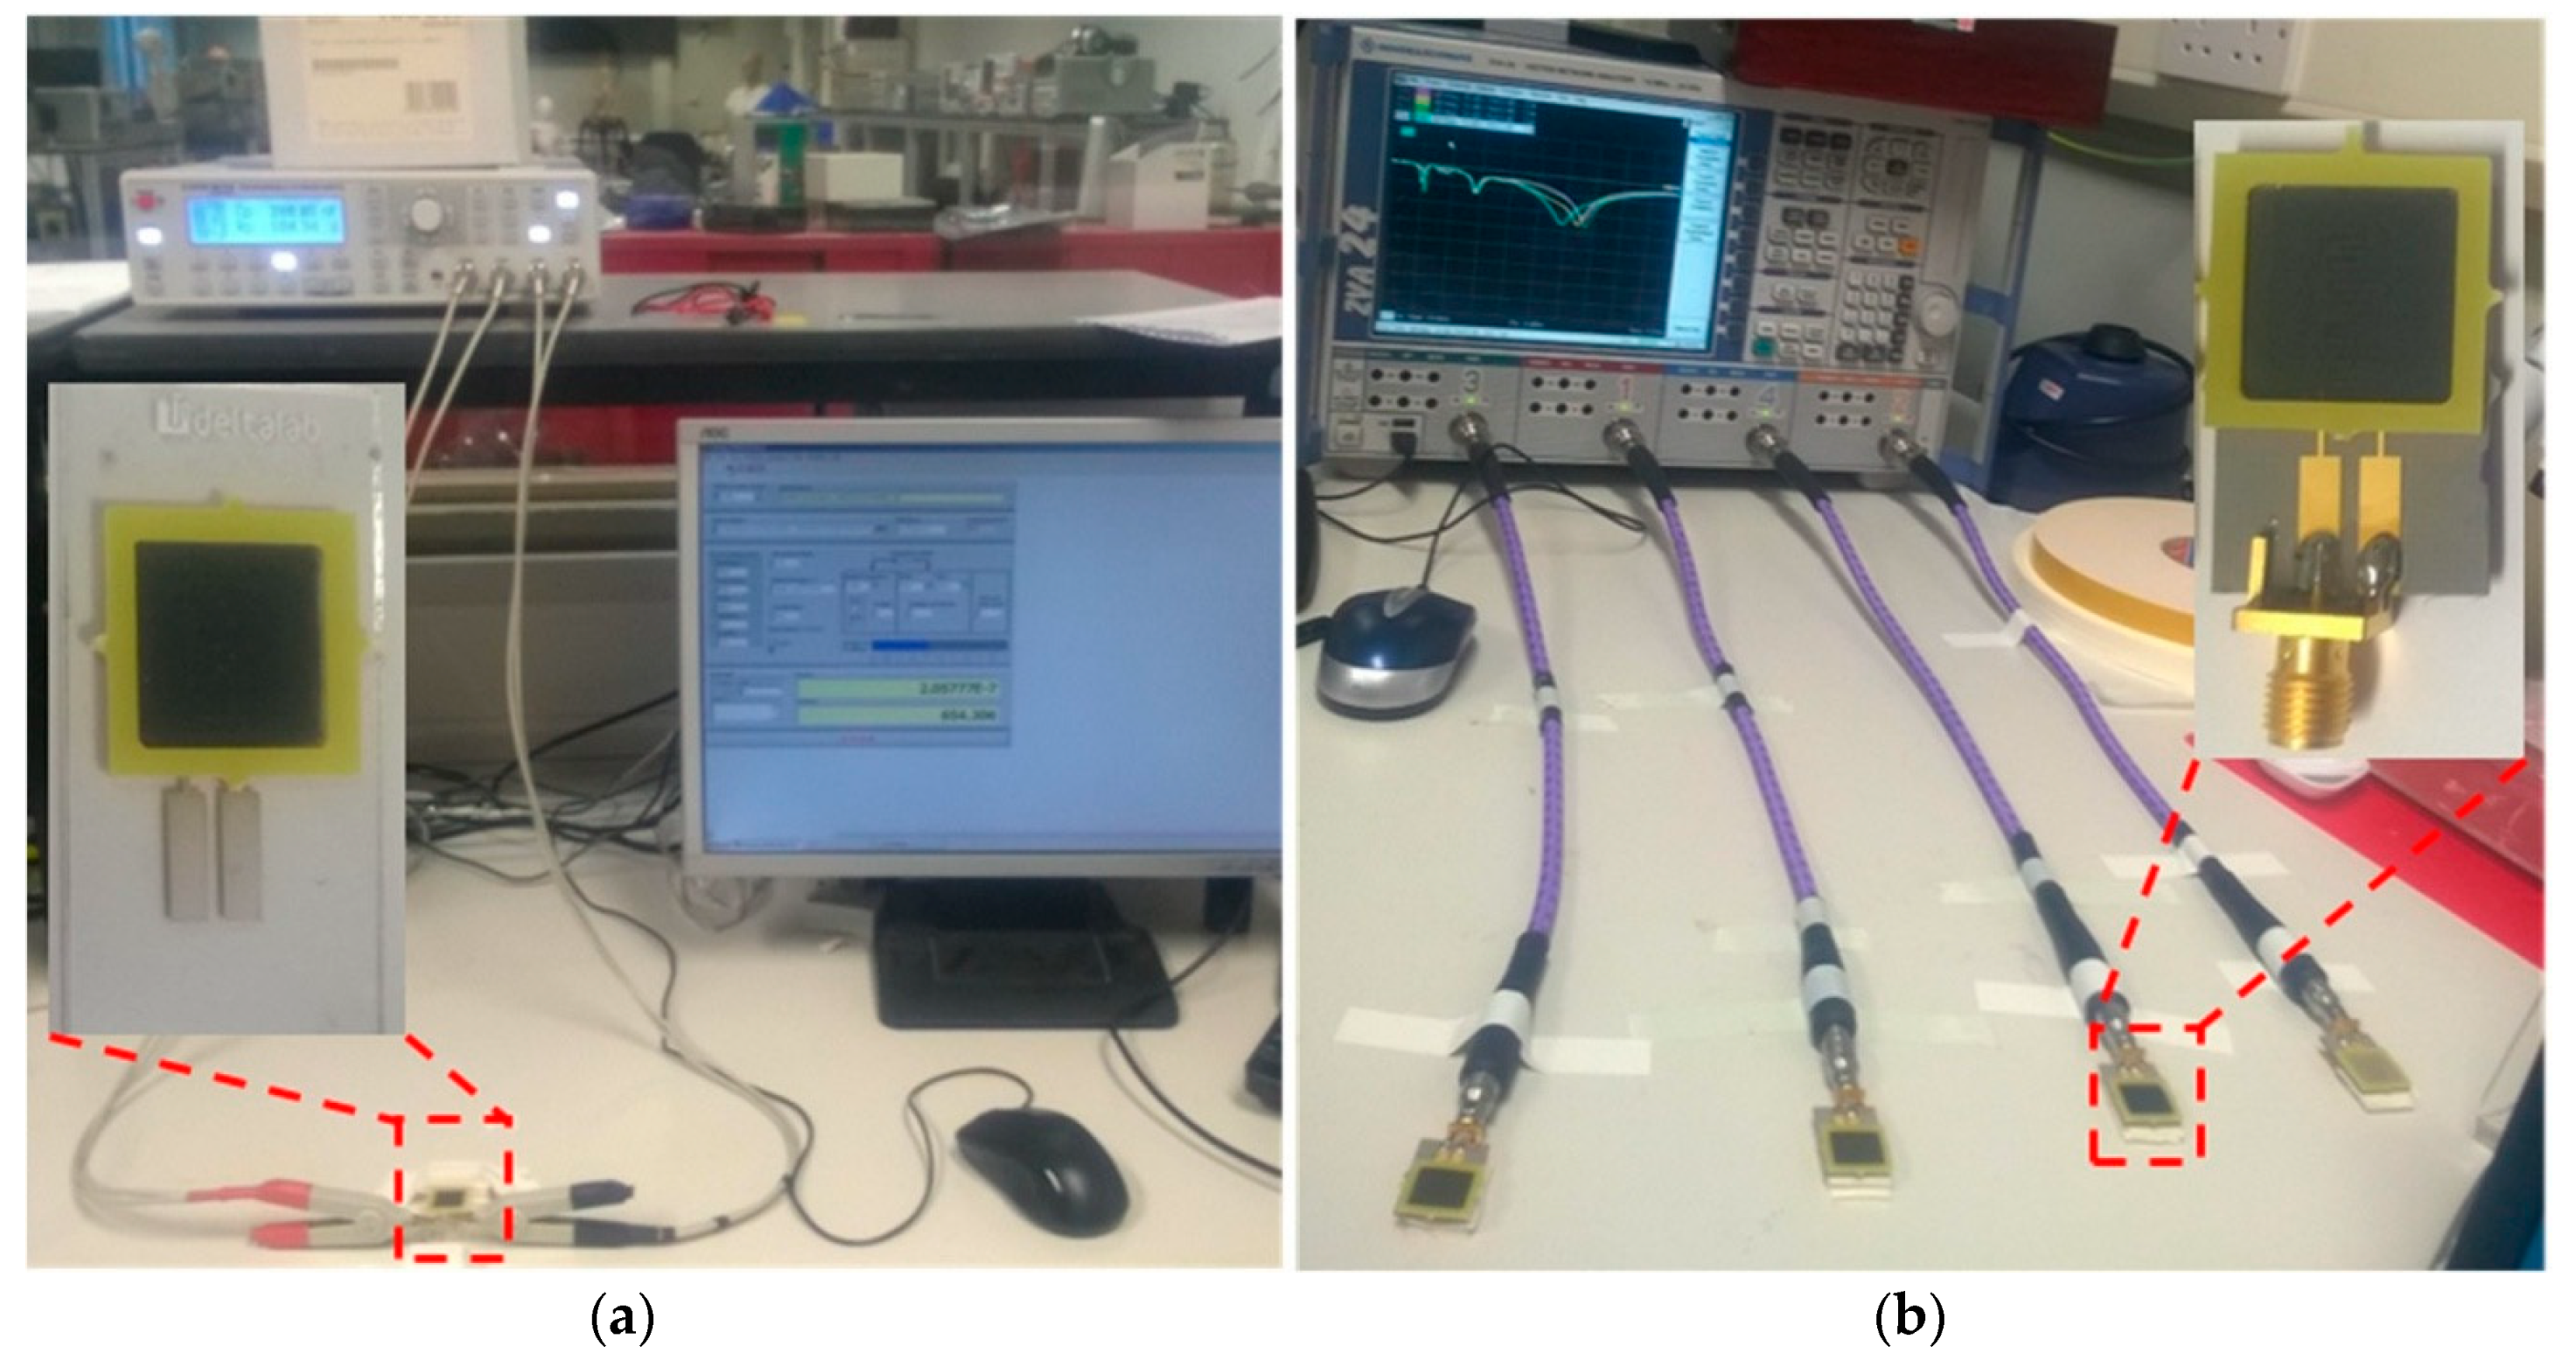
2.2. Optical, Microwave and Electrical Measurements

Absorbance measurements were performed using the aforementioned Spectrophotometer (200–1000 nm, 3.5 mL sample volume). Capacitance and the reflection coefficient (S11) were measured using uncoated and f-EM sensors with L-Cy-Ch-Ru based thick films (65 μm) using an LCR programmable bridge (Hameg 8118, Figure 2a) (30 Hz–20 kHz, 400 μL sample volume) and a Vector Network Analyser (Rohde & Schwarz VNA 24, Figure 2b) (10 MHz-8 GHz, 400 μL sample volume) respectively. The LCR device uses crocodile clips for the f-EM sensor and sample interaction characterisation; the EM-sensors were connected with the VNA via a coaxial cable. Cu solutions (0, 0.1, 0.25, 0.5, 1, 10, 25, 50 mg/L) were placed on the sensor using a specific holder. Each solution was tested (n = 5) for 10 min with both techniques which permits a continuous measurement to monitor real-time interaction between the coatings and the Cu solutions.

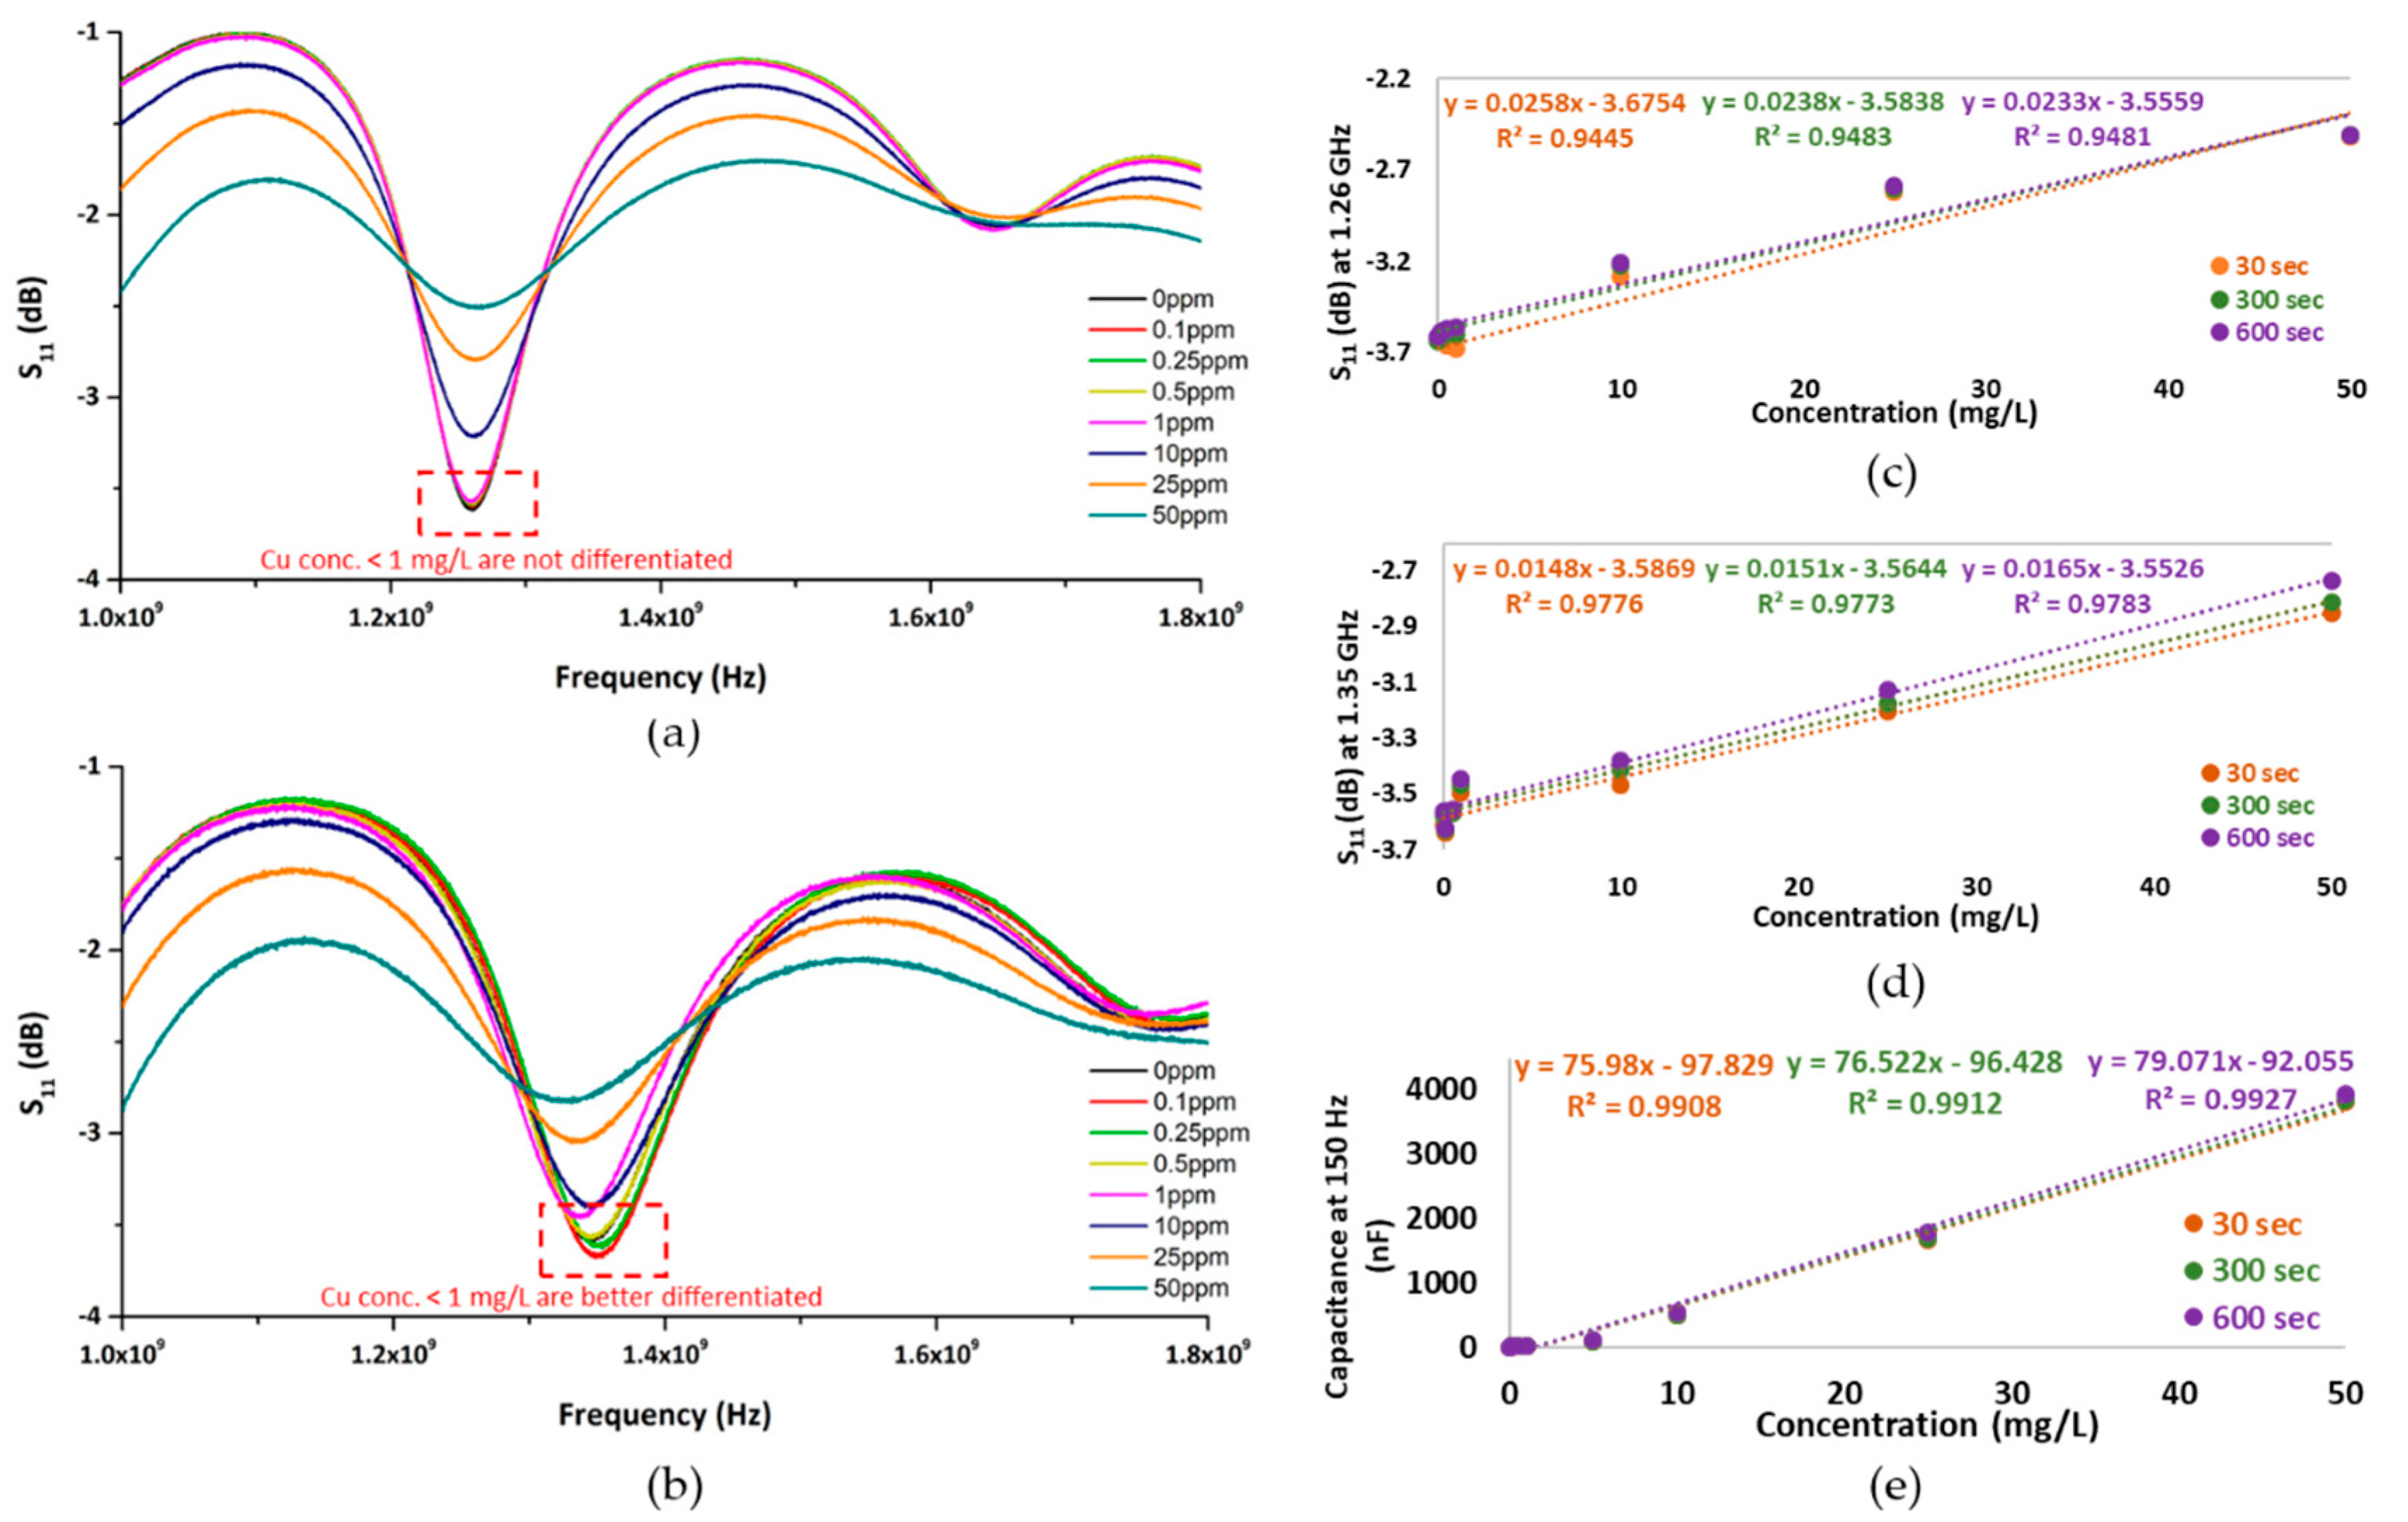
3. Results and Discussion

Exposure of f-EM sensors to Cu-spiked laboratory samples demonstrate the ability to detect changes in Cu concentration with higher sensitivity than uncoated sensors. During the measurements, significant resonant peak shifts were noticed as the different concentrations of Cu samples were placed in contact with the sensor pattern. The response changes due to the effect of the L-Cy-Ch-Ru based thick film has been compared with the uncoated sensors and shown significant differences due to the overlay. This functionalisation enhances the sensor performance, leading to a higher sensitivity of the sensor compared to bare gold eight-pair IDE electrode, namely in a specific frequency at around 1.35 GHz for Cu detection.
Results with a 65 μm L-Cy-Ch-Ru based film illustrate that f-EM sensors were able to detect and distinguish smaller changes of Cu concentration <1 mg/L at 1.35 GHz better than the uncoated sensors (Figure 3a,b) with a higher linear correlation (Figure 3c,d) and sensitivity, as summarised in Table 1. The measured capacitance using the coated Ag IDEs also has a high linear correlation with Cu solutions at diverse concentrations (R2 > 0.99) (Figure 3e), which demonstrates the change in complex permittivity, which alters the S11. The dielectric changes are associated with the chelation of Cu ions on the coating and the interaction with the EM field. This enables detection of Cu ions in surface and drinking water at concentrations below the EQS as well as higher concentrations.

4. Conclusions

This paper communicates the experimental results of using functionalised planar type microwave sensors based on chelating-polymers based thick film for the real-time detection of Cu in water. Specifically, eight-pair IDE planar sensors coated with L-cysteine, chitosan and ruthenium oxide based coating performed better when detecting lower Cu concentration (0–1 mg/L) than the uncoated sensors. Further work and field trials are in progress to expand and progress toward the realisation of a sensitive and selective sensor for monitoring and reporting in real-time water quality.

Acknowledgements

The authors gratefully acknowledge the support of Liverpool John Moores University, Faculty of Engineering and Technology in conjunction with the Faculty of Science PhD Scholarship Programme.

References

  1. Agency for Toxic Substances and Disease Registry (ATSDR). Toxicological Profile for Copper; U.S. Department of Health and Human Services, Public Health Service: Atlanta, GA, USA, 2004.
  2. Aragay, G.; Pons, J.; Merkoci, A. Recent trends in macro-, micro-, and nanomaterial-based tools and strategies for heavy-metal detection. Chem. Rev. 2011, 111, 3433–3458. [Google Scholar] [CrossRef] [PubMed]
  3. Mason, A.; Abdullah, B.; Muradov, M.; Korostynska, O.; Al-Shamma’a, A.; Bjarnadottir, S.G.; Lunde, K.; Alvseike, O. Theoretical basis and application for measuring pork loin drip loss using microwave spectroscopy. Sensors 2016, 16, 182. [Google Scholar] [CrossRef] [PubMed]
  4. Zarifi, M.H.; Farsinezhad, S.; Abdolrazzaghi, M.; Daneshmand, M.; Shankar, K. Selective microwave sensors exploiting the interaction of analytes with trap states in tio2 nanotube arrays. Nanoscale 2016, 8, 7466–7473. [Google Scholar] [CrossRef]
  5. Chen, T.; Li, S.; Sun, H. Metamaterials application in sensing. Sensors 2012, 12, 2742. [Google Scholar] [CrossRef] [PubMed]
  6. Ngah, W.S.W.; Fatinathan, S. Adsorption of Cu(ii) ions in aqueous solution using chitosan beads, chitosan—Gla beads and chitosan–alginate beads. Chem. Eng. J. 2008, 143, 62–72. [Google Scholar] [CrossRef]
  7. Koneswaran, M.; Narayanaswamy, R. L-cysteine-capped zns quantum dots based fluorescence sensor for cu2+ ion. Sens. Actuators B Chem. 2009, 139, 104–109. [Google Scholar] [CrossRef]
Figure 2. Experimental set-up: (a) LCR programmable bridge connected to an Ag-IDE screen-printed on microscope slide connected through crocodile clips; (b) VNA connected with coaxial cables to uncoated and f-EM sensors (Au-8 pair IDEs) with L-Cy-Ch-Ru based thick films.
Proceedings 02 00828 g002
Figure 3. S11 response (1–1.8 GHz) at 10 min for various Cu concentrations in water measured with (a) uncoated sensors and (b) f-EM sensors. Their linear correlations at the respective peaks (1.26 GHz and 1.35 GHz) at 30, 300 and 600 s of interaction are shown in (c,d); the high linear correlation (R2 > 0.99) between capacitance and Cu samples using L-Cy-Ch-Ru based coatings screen-printed on Ag IDE is shown in (e).
Proceedings 02 00828 g003
Table 1. Linear correlation (R2), relative standard deviation (RSD) and sensitivity for Cu samples using optical, electrical and microwave methods combined with f-EM sensors.
Measured ParameterR 2RSDSensitivity 1
Absorbance (at 217 nm)0.981–2%0.10
Capacitance using Ag f-EM sensors (at 150 Hz) 20.991–3%7.91 nF
S11 using uncoated Au EM sensors (at 1.26 GHz) 20.951–3%0.005 dB
S11 using coated Au f-EM sensors (at 1.35 GHz) 20.982–3%0.018 dB
1 for every 100 μg/L change in Cu calculated for the range 0–1 mg/L; 2 at 600 s.
Publisher’s Note: MDPI stays neutral with regard to jurisdictional claims in published maps and institutional affiliations.

