The Complementary Use of Optical and SAR Data in Monitoring Flood Events and Their Effects †


Department of Natural Resources Management and Agricultural Engineering, Agricultural University of Athens, 75 Iera Odos st., Athina 11855, Greece
*
Author to whom correspondence should be addressed.
†
Presented at the 3rd EWaS International Conference on “Insights on the Water-Energy-Food Nexus”, Lefkada Island, Greece, 27–30 June 2018.
Proceedings 2018, 2(11), 644; https://doi.org/10.3390/proceedings2110644
Published: 30 July 2018
(This article belongs to the Proceedings of EWaS3 2018)
Abstract
:This paper describes the synergetic use of earth observation satellites optical and radar data to detect flooded areas and explore the impacts of the flood event. A flash flood episode took place in May 2016, in the central-eastern part of West Thessaly (Central Greece). A Landsat-7 ETM+ and a Sentinel-1 SAR image were acquired. For Landsat-7 several water indices were applied and for the Sentinel-1 a threshold method was implemented. Furthermore, Sentinel-2 images were utilized so as to record the land use/cover of the flooded area. The inundated areas and the affected cultivations were delineated with high precision, and the financial effects were evaluated.
1. Introduction
Flash floods are considered to be among the most frequent and destructive types of natural disasters worldwide, with significant consequences including: (a) human and animal life losses, (b) agricultural crops destruction and soil loss (c) damages of infrastructures, communication networks, and, (d) transport of sediment loads and pollutants [1,2,3,4]. Particularly, it is estimated that floods cause about 40% of the damages caused by all kind of natural disasters [5]. Therefore, mapping and monitoring flood events and their impacts are essential for any flood risk mitigation plan, disaster detection and compensation services [6]. This information is often difficult to produce using traditional techniques because water bodies can be fast moving as in floods tides and storm surges or may be inaccessible [7].
Earth observation (EO) data from space can provide valuable and timely information when one must respond to and mitigate emergencies such as floods. Satellite observations enable the acquisition of data for large and hard-to-reach areas, as well as provide continuous measurements [8]. Optical sensors detect energy naturally reflected or emitted by the earth’s surface in visible and infrared spectral bands. Where clouds, trees, and floating vegetation do not obscure the water surface, high-resolution sensors can provide good delineation of inundated areas [8].
Since the early 1970s, the Landsat program provides us with the longest continuous global measurements of the Earth’s surface, creating a historical collection unparalleled in quality, coverage and length. Additionally, the European Space Agency (ESA) through the Copernicus program offers accurate, timely and easily accessible SAR data of Sentinel-1 satellite system. Sentinel-2 (S2) is a new land monitoring and classification mission that provides high spatial resolution optical imagery to perform terrestrial observations with global coverage of the Earth’s land surface every five days [9,10]. Numerous studies using modern techniques of Landsat imagery have been used several different water indices to delineate flooded areas, such as the Normalized Difference Water Index (NDWI), the Modified Normalized Difference Water Index (MNDWI), the Tasseled Cap Transformation (TCT), the Difference Between Vegetation and Water index (DVW), the Index of Free Water (IFW), the Water Impoundment Index (WII), the Modified Water Index (MWI), the Red and Short Wave Infrared index (RSWIR) and many others [11,12,13,14,15,16,17,18,19].
The inability of optical sensors to procure clear images during cloudy weather conditions limits its application potential during flood events accompanied by clouds. In such cases SAR images which are not dependent on daytime and weather conditions, providing data through clouds and hazy atmospheric circumstances as well as their ability to differentiate waterlogged and dry land, render them quite valuable in flood occasions [1,4]. Sentinel-1 (S1) is a Synthetic Aperture Radar (SAR) mission of the Copernicus Program. The contribution of S1 to the application of flood mapping arises from the sensitivity of the backscatter signal to open water [4,9,20,21].
The object of this study is to apply remote sensing techniques, using optical and SAR open source data for monitoring and evaluating the impacts of a natural disaster. The flash flood event took place from 20 to 22 May 2016, following an intense and heavy rainfall that occurred in the central-eastern part of West Thessaly, in Central Greece, including a part of the Thessalian plain, which is characterized by intensive agricultural activity. More precisely, it is mainly represented by summer cultivations (cotton, corn etc.) with high yields and financial importance (with significant subsidies). A Landsat-7 ETM+ (L7) image, acquired one day after the phenomenon at 23rd of May and two Sentinel-1 SAR images (S1), acquired at 21st of May, were processed. For L7 the TCT, the MNDW, the DVW and the RSWIR indices, were applied and tested. Their results were compared, and from their analysis, the inundated area was delineated. As far as it concerns the S1 SAR data, a Level-1 Ground Range Detected (GRD) products have been utilized and a method that sets a threshold value (that is established manually) of radar backscatter, which is followed by a binary algorithm to determine whether a given raster pixel is flooded or not, was implemented. Finally, four Sentinel-2 (S2) images were acquired so as to map the land use/cover and distinguish the existing crop types of the flooded area.
2. Study Area—Background
2.1. Study Area
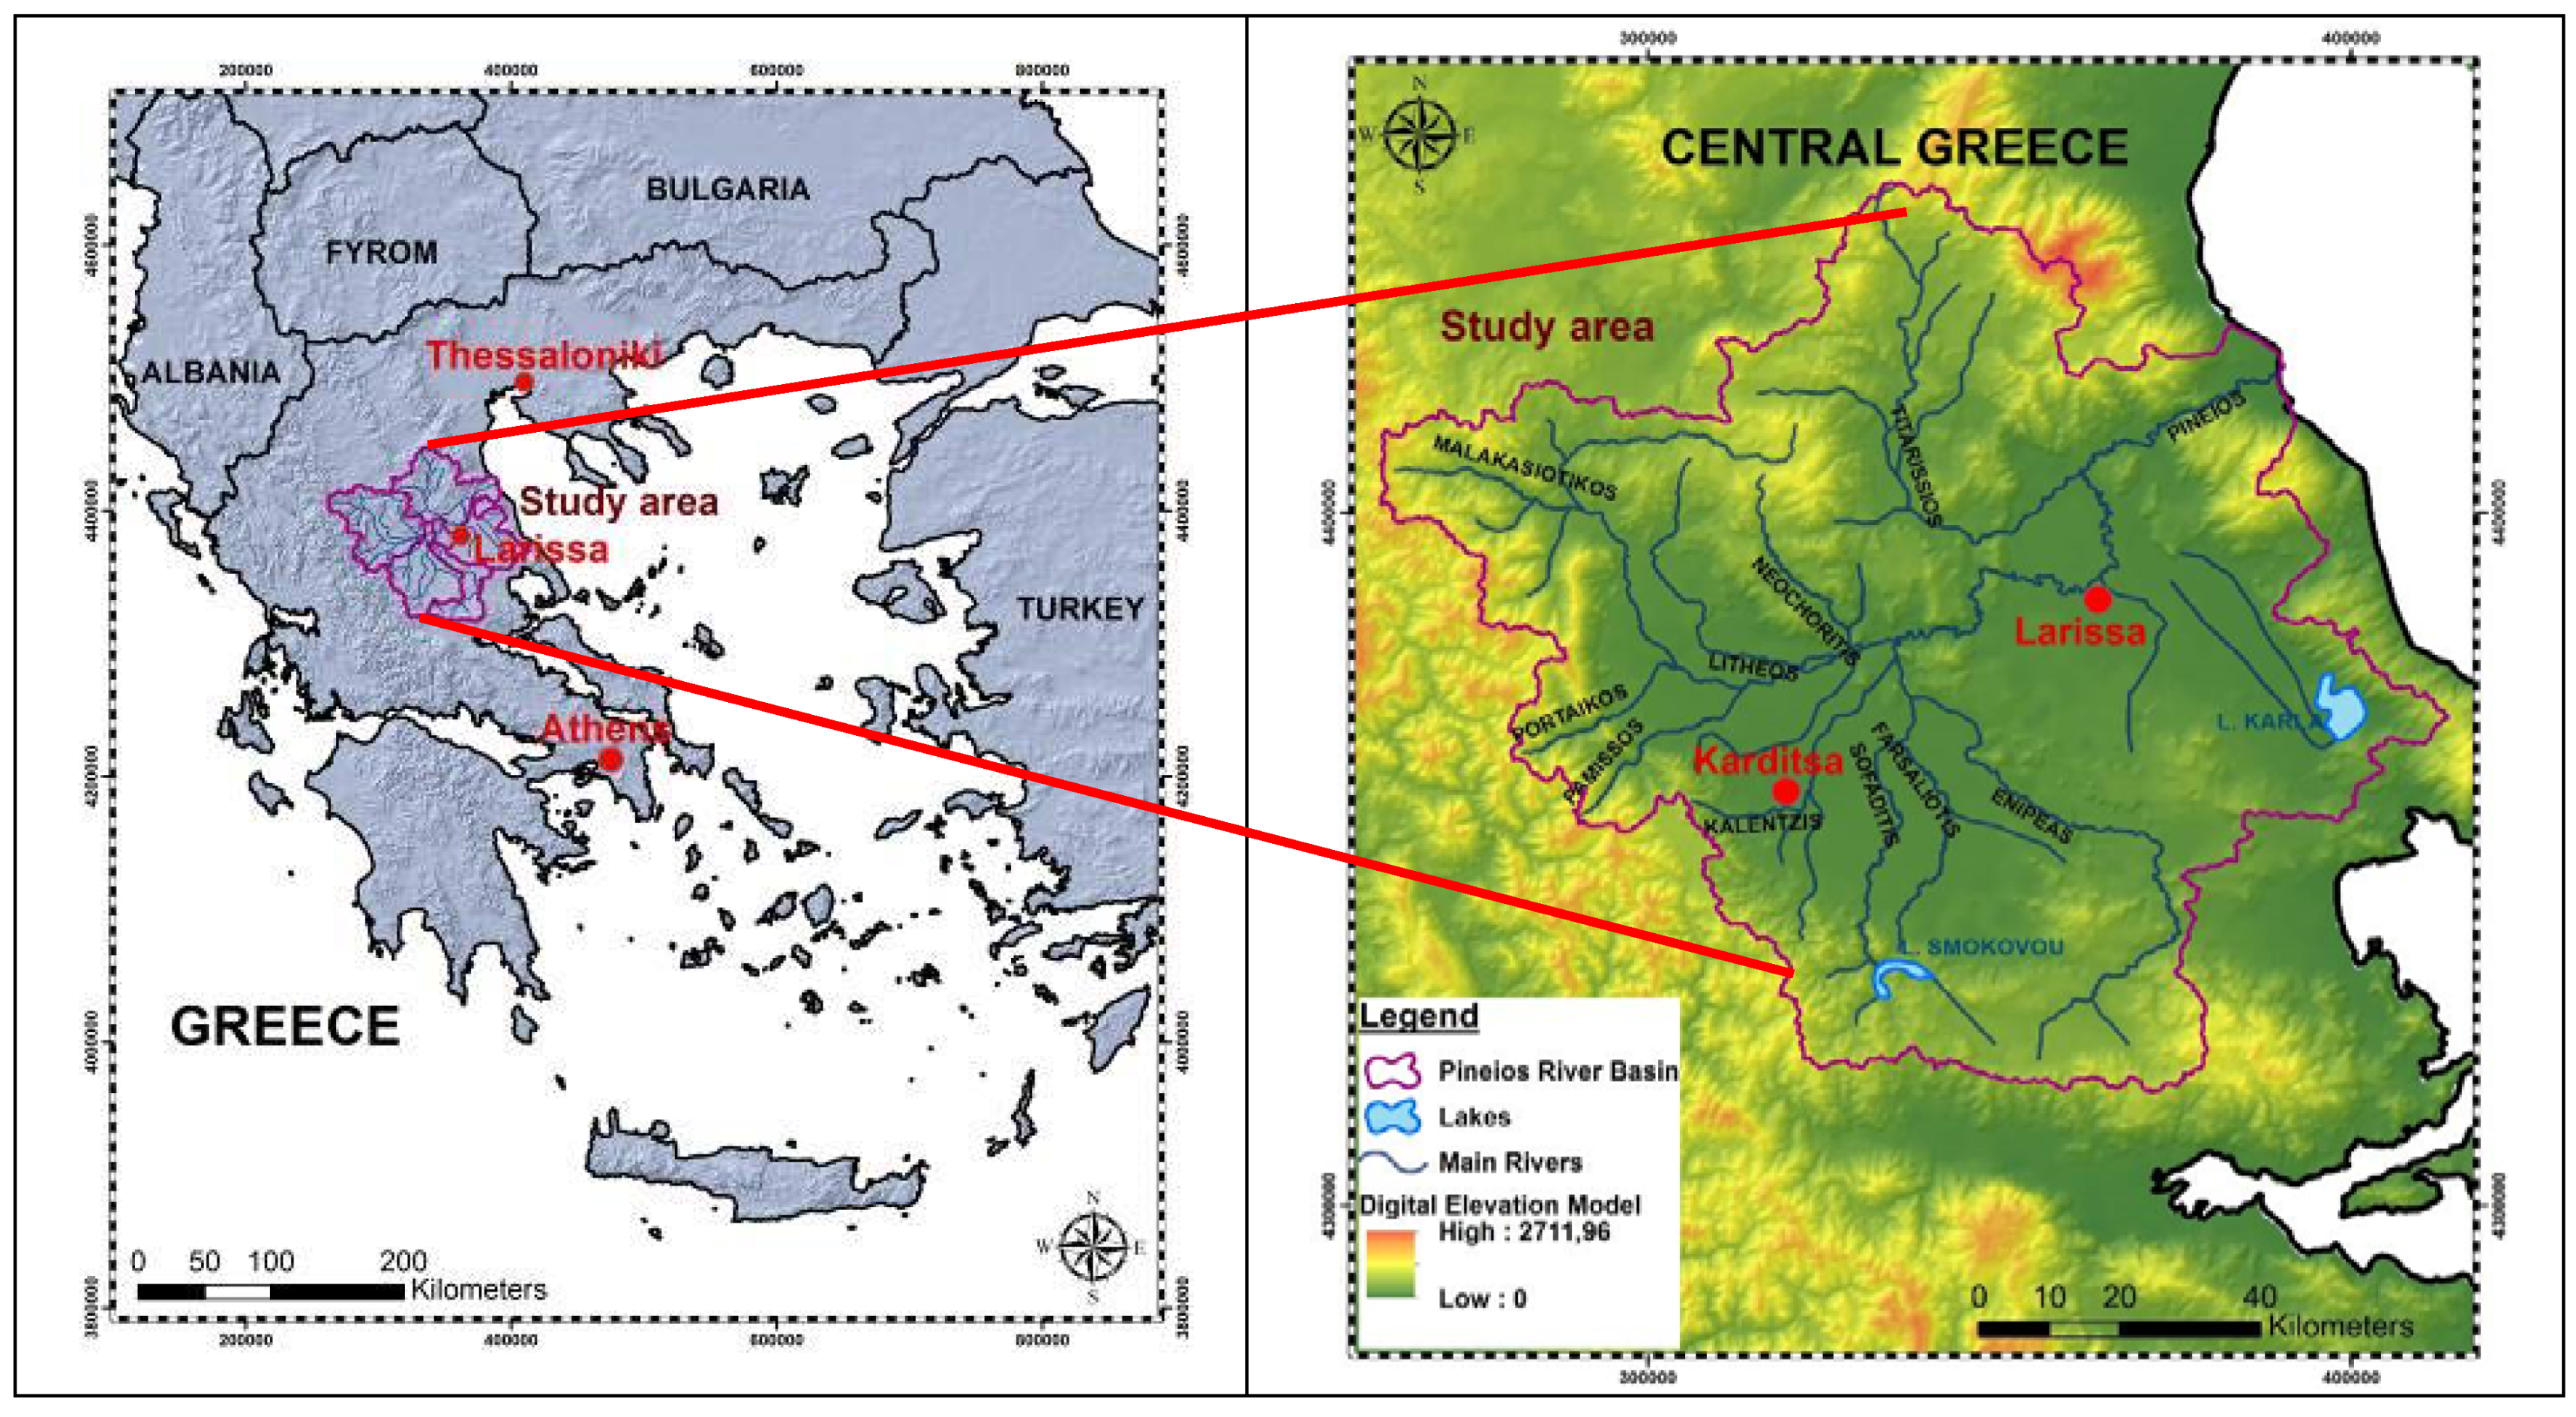
The study area lies between 39°11′ to 39°58′ N and 21°52′ to 22°45′ E (Figure 1), in the Pinios river basin (GR16), the largest catchment in the Thessaly Water District (GR08) with an area of 10,700 km2. The Thessaly plain lies in the center of the catchment and it is mostly a flat terrain which was subsequently filled with alluvial deposits that form the largest and among the most productive agricultural lands in Greece [22].
Pinios river originates from the Pindus sierra and empties into the Aegean Sea. The affected areas reside in Karditsa, Larissa and Trikala prefectures (geographic administrative region of Thessaly).
2.2. Background—Intensity of Rainfall from 20 to 22 May 2016
According to the EU Floods Directive (2007/60/EC) Preliminary Flood Risk Assessment that was implemented by the Ministry of Environment and Energy of Greece, several notable historical floods had been documented, such as those that occurred on 4 June 1907; 27 October 1980; 23 March 1987; 22 October 1994, while 31.7% of the total area of the Thessaly Water District is characterized as an area of potential significant flood risk [23]. The recorded rainfall from 20 to 22 of May 2016 for Kalabaka, Trikala and Karditsa station was 78.2, 87.8 and 91.8, respectively. The intense storm lasted from noon on the 20th of May until the dawn on the 22nd while its peak was reached on the 21st of May.
3. Materials and Methodology
3.1. Materials
Several data sets were examined to be procured for the purpose of this study. A Level 1T L7 image (path/row: 184/33), was acquired from the USGS Earth Explorer (EE) tool on the 23rd of May, hence the next daytime of the two-day flood event [24]. As well, S1 and S2 datasets were provided via ESA’s Open Access Hub [25]. S1 SAR data was an L1 GRD, high resolution (10 m) Interferometric Wide (IW) image, obtained from C-band during the flood, on the 21st of May (Time 07:05:10 p.m.). Moreover, four S2 images were used, from December 2015 until August 2016, to cover all the crops growth stages for the creation of the land use/cover classification map. The Digital image processing and analysis of the satellite data were carried out using ENVI (v.5.3) and SNAP (v.5.0) software, while the manipulation of the spatial information was made using ArcGIS (v.10.2).
3.2. Methodology
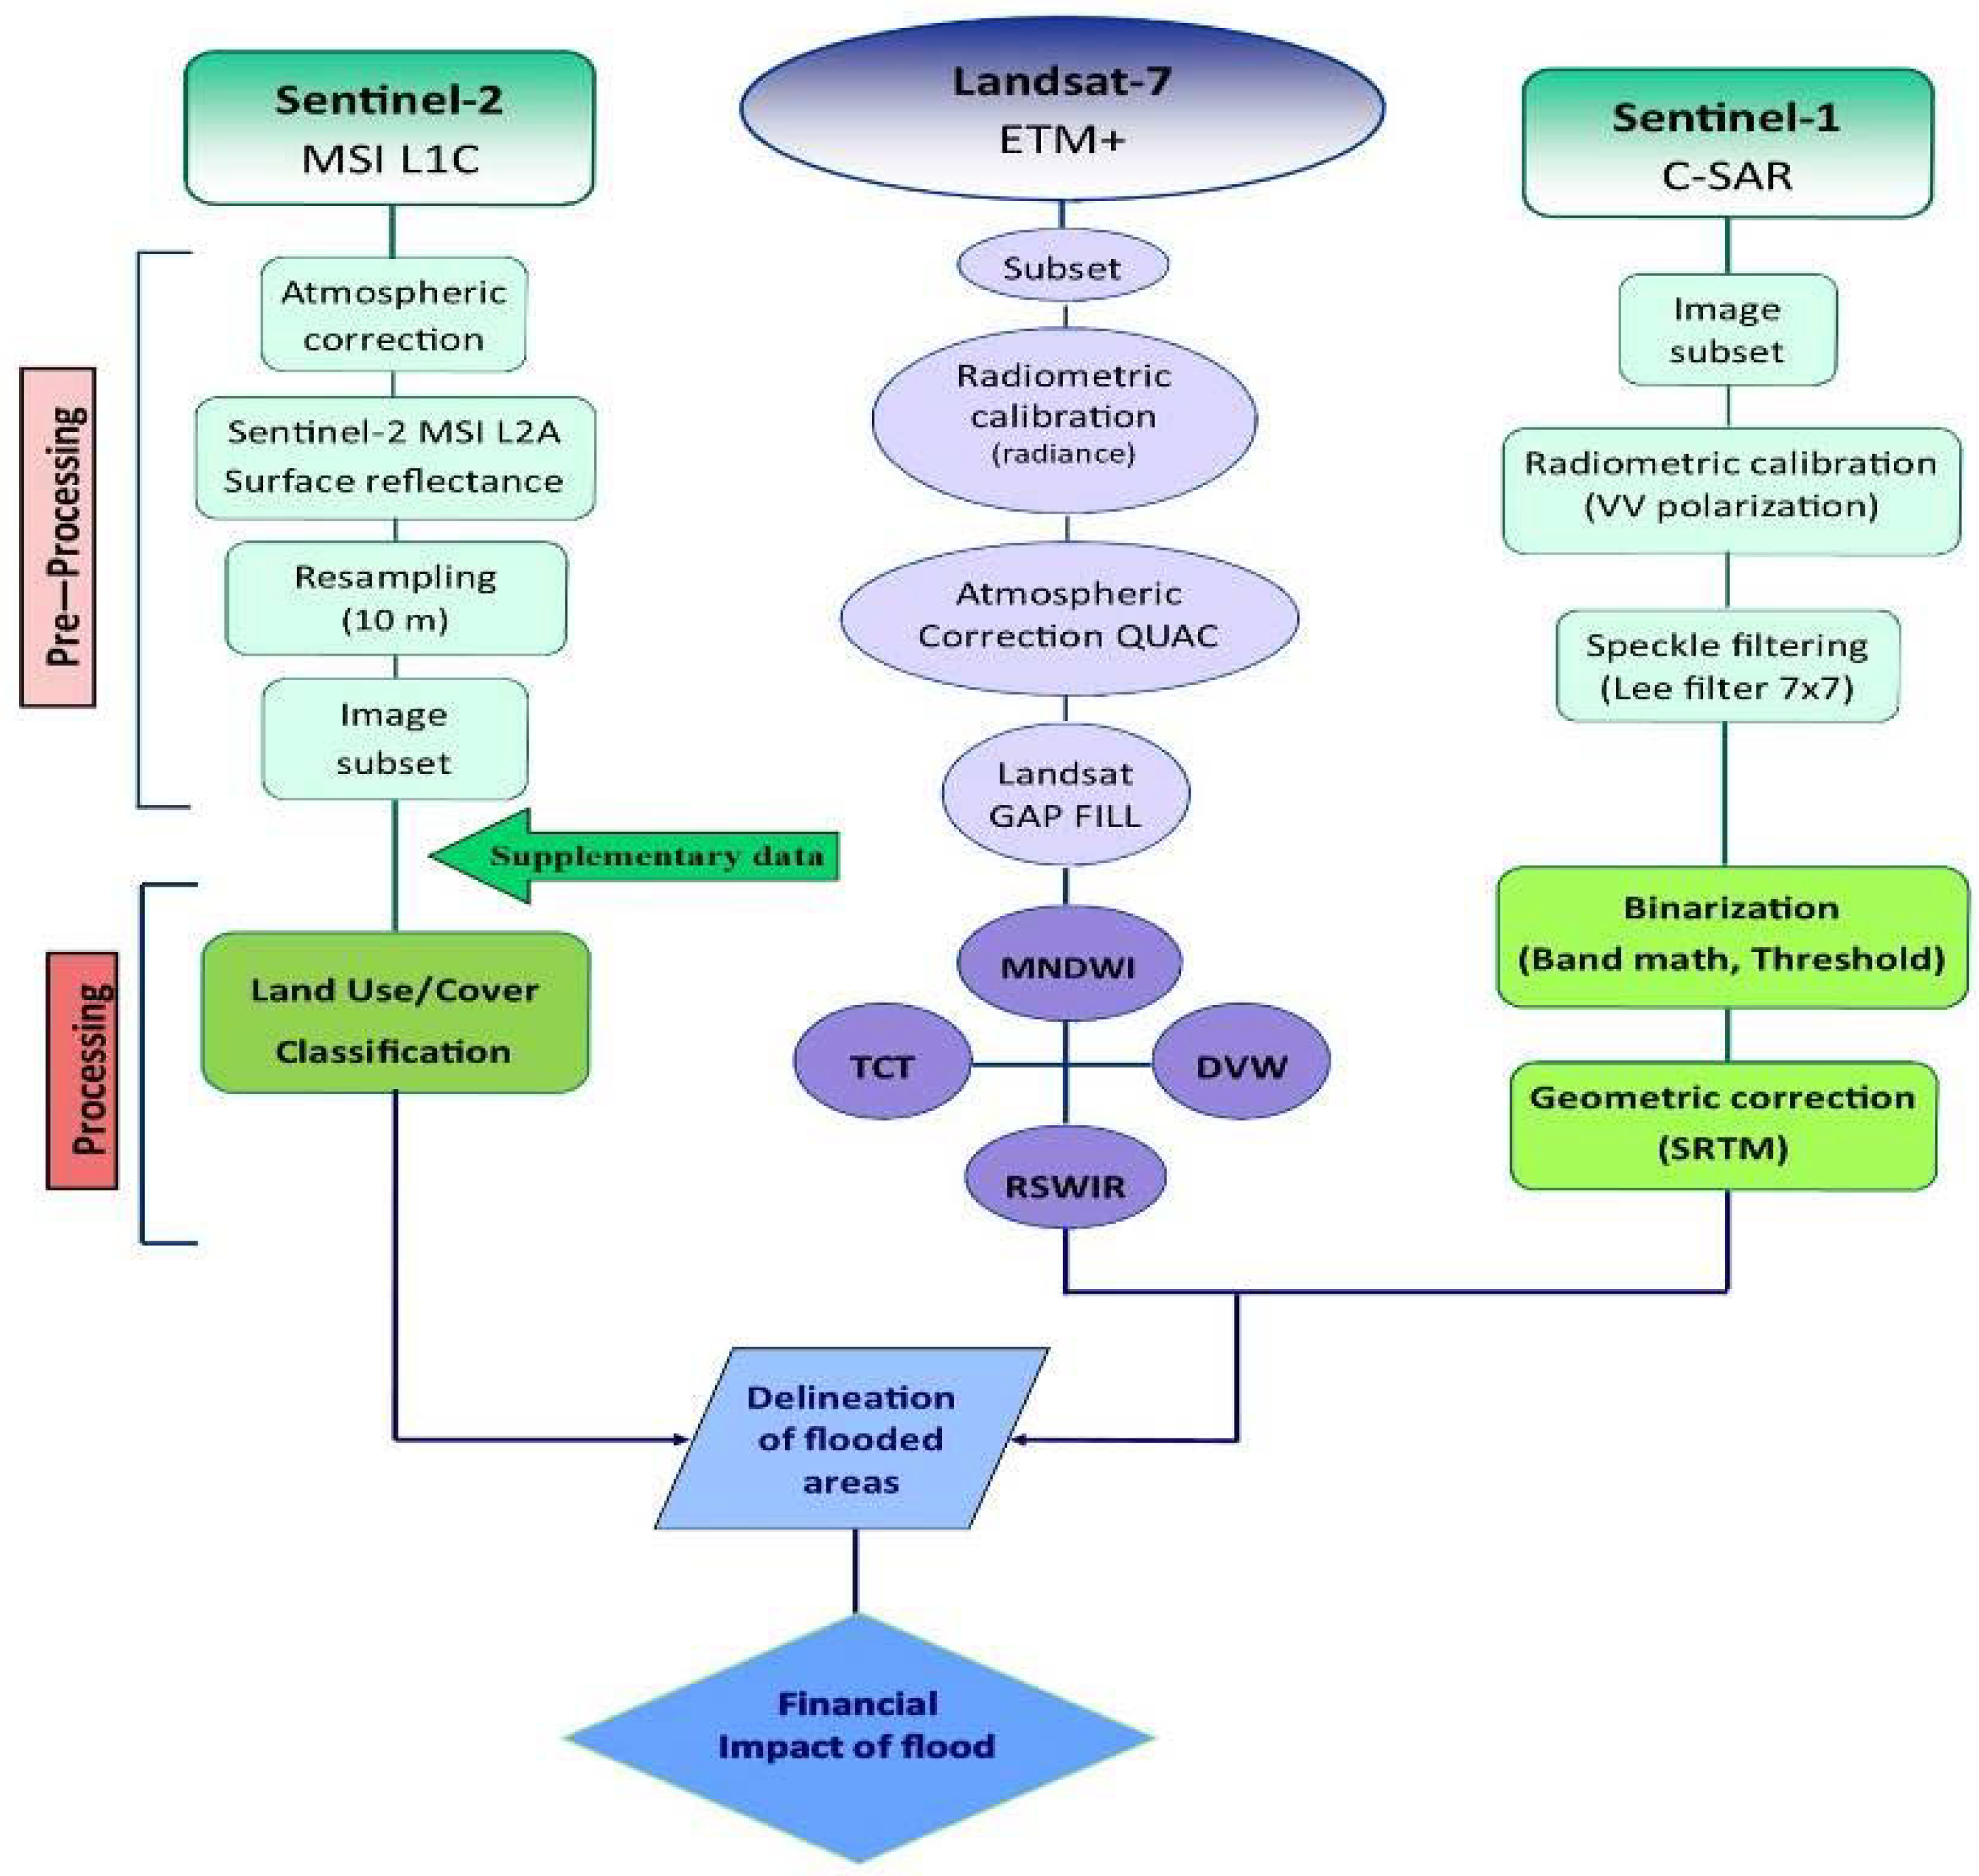
The intervening atmosphere between the satellite and the Earth’s surface can degrade the quality of the remote sensing data, by altering the intensity of the spectral response of ground features received at the sensor from their actual spectral characteristics. As atmospheric conditions can vary both spatially and temporally standardised atmospheric models, such as those provided by QUAC atmospheric correction model in ENVI is crucial for the atmospheric correction of the L7 image [6,26]. In the present study, three different processing methodologies were followed for the three-different kind of satellite data used (Figure 2).
The pre-processing step of the L7 ETM+ image included the gap initially filling that Scan Line Corrector (SLC) failure creates. For that reason, Landsat gap fill plugin of ENVI was used to retrieve the approximately 22% of data loss. This process deals with the implementation of a gap mask for each band that points the missing data in the scan gap and classifies regions as 0 and the existing data as 1. Then, the Digital Number values of the L7 image have been converted to Top of Atmosphere reflectance and then to surface reflectance.
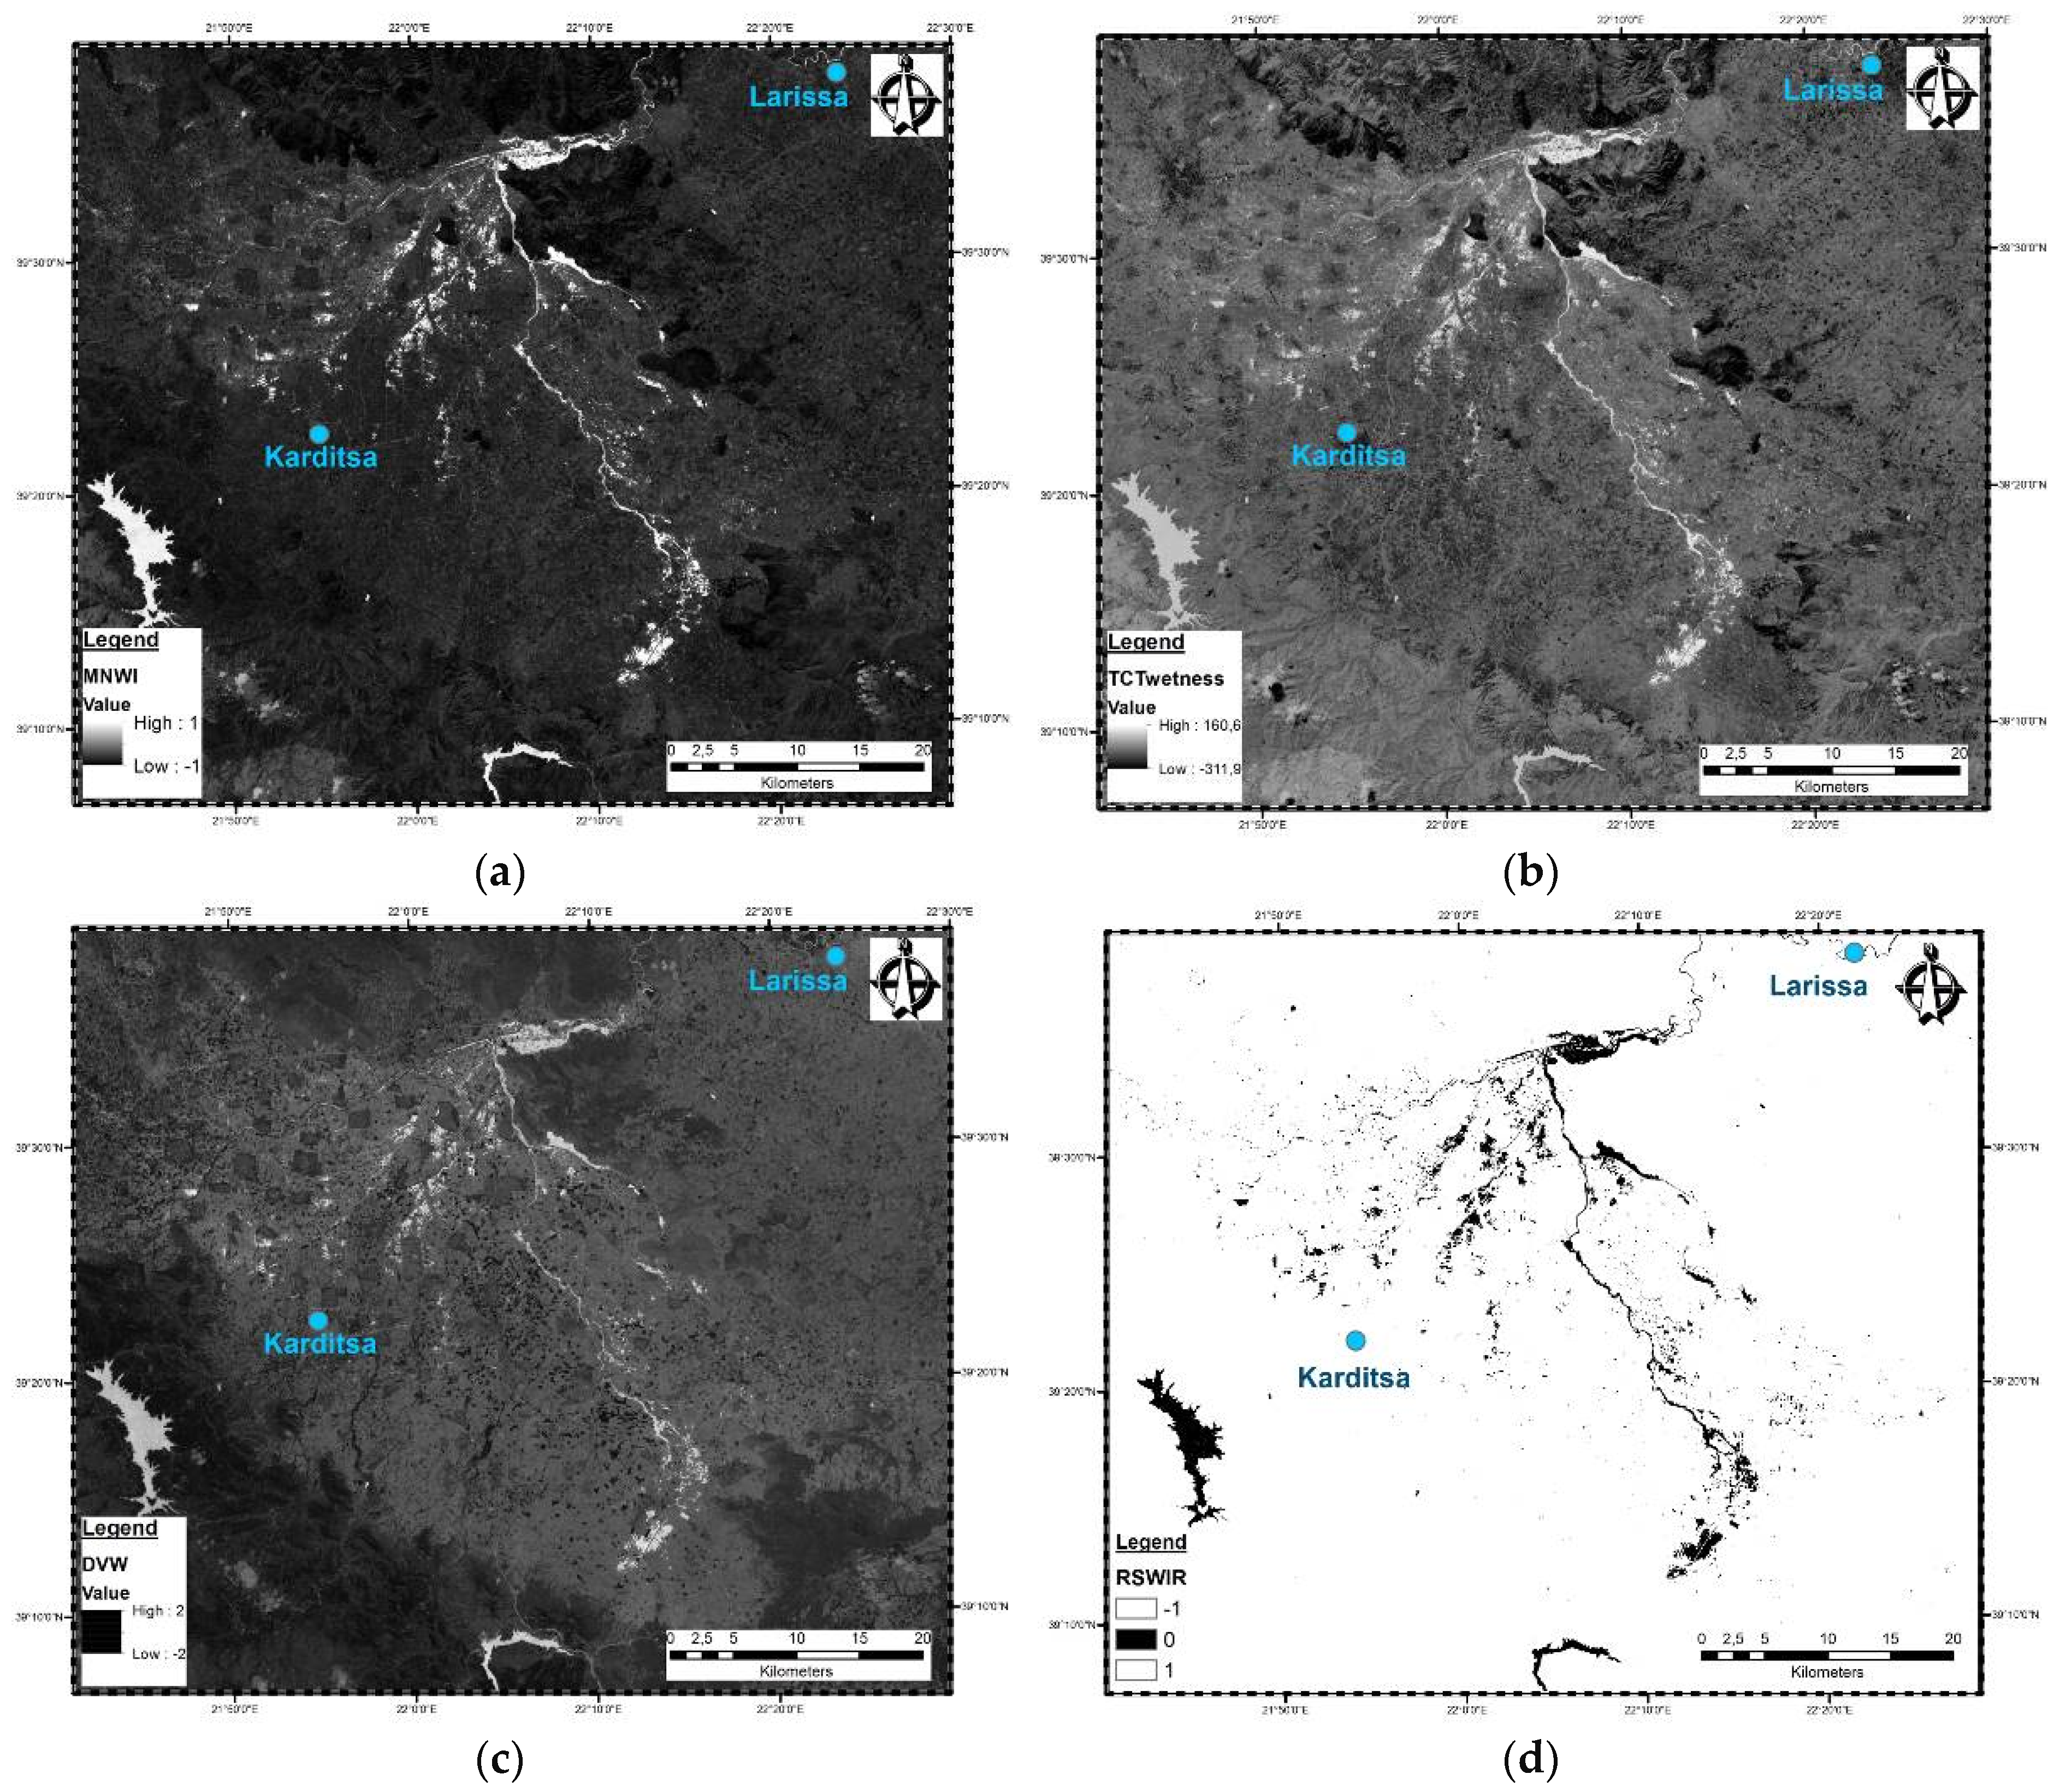
The basic processing step concerned the calculation of the four water indices, the MNDWI, the TCT, the DVW and the RSWIR. MNDWI enhances open water features while suppressing noise from built-up land, vegetation, and soil (Figure 3a). Xu (2006) reported that the MNDWI produced better results than the NDW index, in enhancing and extracting water from a background that is dominated by build-up land areas [12,17]. The TCT is a useful tool for compressing spectral data into a few bands associated with physical scene characteristics [14,15]. The new composite images represent the brightness of each pixel, the degree of greenness/yellowness of vegetation and the wetness which is correlated to soil moisture, water, and other moist features. The other additional components contain image noise and atmospheric influences, such as clouds, haze, sun angle differences etc. The third component that is relating to the tasseled cap wetness (TCW) has been used as a tool for flooded area delineation (Figure 3b). Furthermore, the DVW and RSWIR indices were implemented. The first functions by subtracting the simple Normalized Difference Water Index (NDWI) from the Normalized Difference Vegetation Index (NDVI) [27], while the second uses the Red and Short Wave Infrared (SWIR) bands in its equation (Figure 3c,d).
The S1 SAR image obtained from Sentinel-1C-band comprises an image which was acquired at the early stages of the flood. The processing method sets a threshold value (manually established) of radar backscatter which is followed by a binary algorithm (band math equation) to determine whether a given raster pixel is flooded or not. The data processing of the S1 VV polarization SAR image followed specific steps: (a) subset of the image to reduce the size of the data and make it more easily managed, (b) calibration of the images, (c) implementation of speckle filter to remove the “salt and pepper” texture of the image, (d) finally, a threshold was selected, analyzing first the histogram of the filtered backscatter coefficient. The histogram shows a peak of different magnitude. Low values of the backscatter correspond to the water, and high values correspond to the non-water class. To binarize the image band arithmetic was applied, putting as logical value (true) for values less than the chosen threshold and false for higher values, producing the final “Water” image.
As far as it concerns the four S2 images, the atmospheric correction was applied to convert the Top-of-Atmosphere reflectance values (TOA) to Bottom-of-Atmosphere reflectance values (BOA) using ESA’s Sen2Cor plugin. Then, a layer stack of the four images was made and a supervised maximum likelihood classification method was implemented, utilizing approximately 200 sampling points. The overall accuracy of the classification was about 89%, due to high homogeneity of the different land use/cover types of the area.
4. Results-Discussion
During floods, timely and detailed situation reports are required by the disaster management authorities to locate and identify the affected areas and to implement the corresponding damage mitigation; this is the most delicate management category since it involves rescue operations and the safety of people and property. Many of the existing and future satellite missions and airborne platforms provide rich data with great potential for enhanced monitoring, measuring and mapping of floods.
In our study case, spatial and temporal dynamics of the flooding were revealed, calculated and analyzed using L7 and S1 data. Thence, the information exported from the above-mentioned satellite systems was manipulated and contrasted with S2 output and public-sector data.
As already mentioned, the L7 image was acquired on 23 May 2016, one day after the expiration of the episode. Hence, there was probably a slight reduction as far as the total surface area covered by water is concerned, during 22–23 May 2016.
The flood map depicted that during 20–22 May 2016 an area of 5381.3 ha was inundated in the study site (Figure 3). Visual inspection of Figure 3 illustrates that MNDWI (Figure 3a) and TCW index (Figure 3b) resulted in a higher accuracy of surface water mapping compared to RSWIR (Figure 3d) and DVW (Figure 3c).
S1 satellite mission data are quite valuable for flood monitoring and damage assessment. However, at this case study, the outputs of water extraction using S1 data represent solely numerous dispersed spots in view of the fact that the image was obtained at the early/middle stages of the phenomenon. Specifically, the transformation of the precipitation to runoff and thence to flood routing, requires a certain period that is related to the hydrological and geomorphological characteristics of the watershed and the like. Thus, the major part of the study area was not under water at that time.
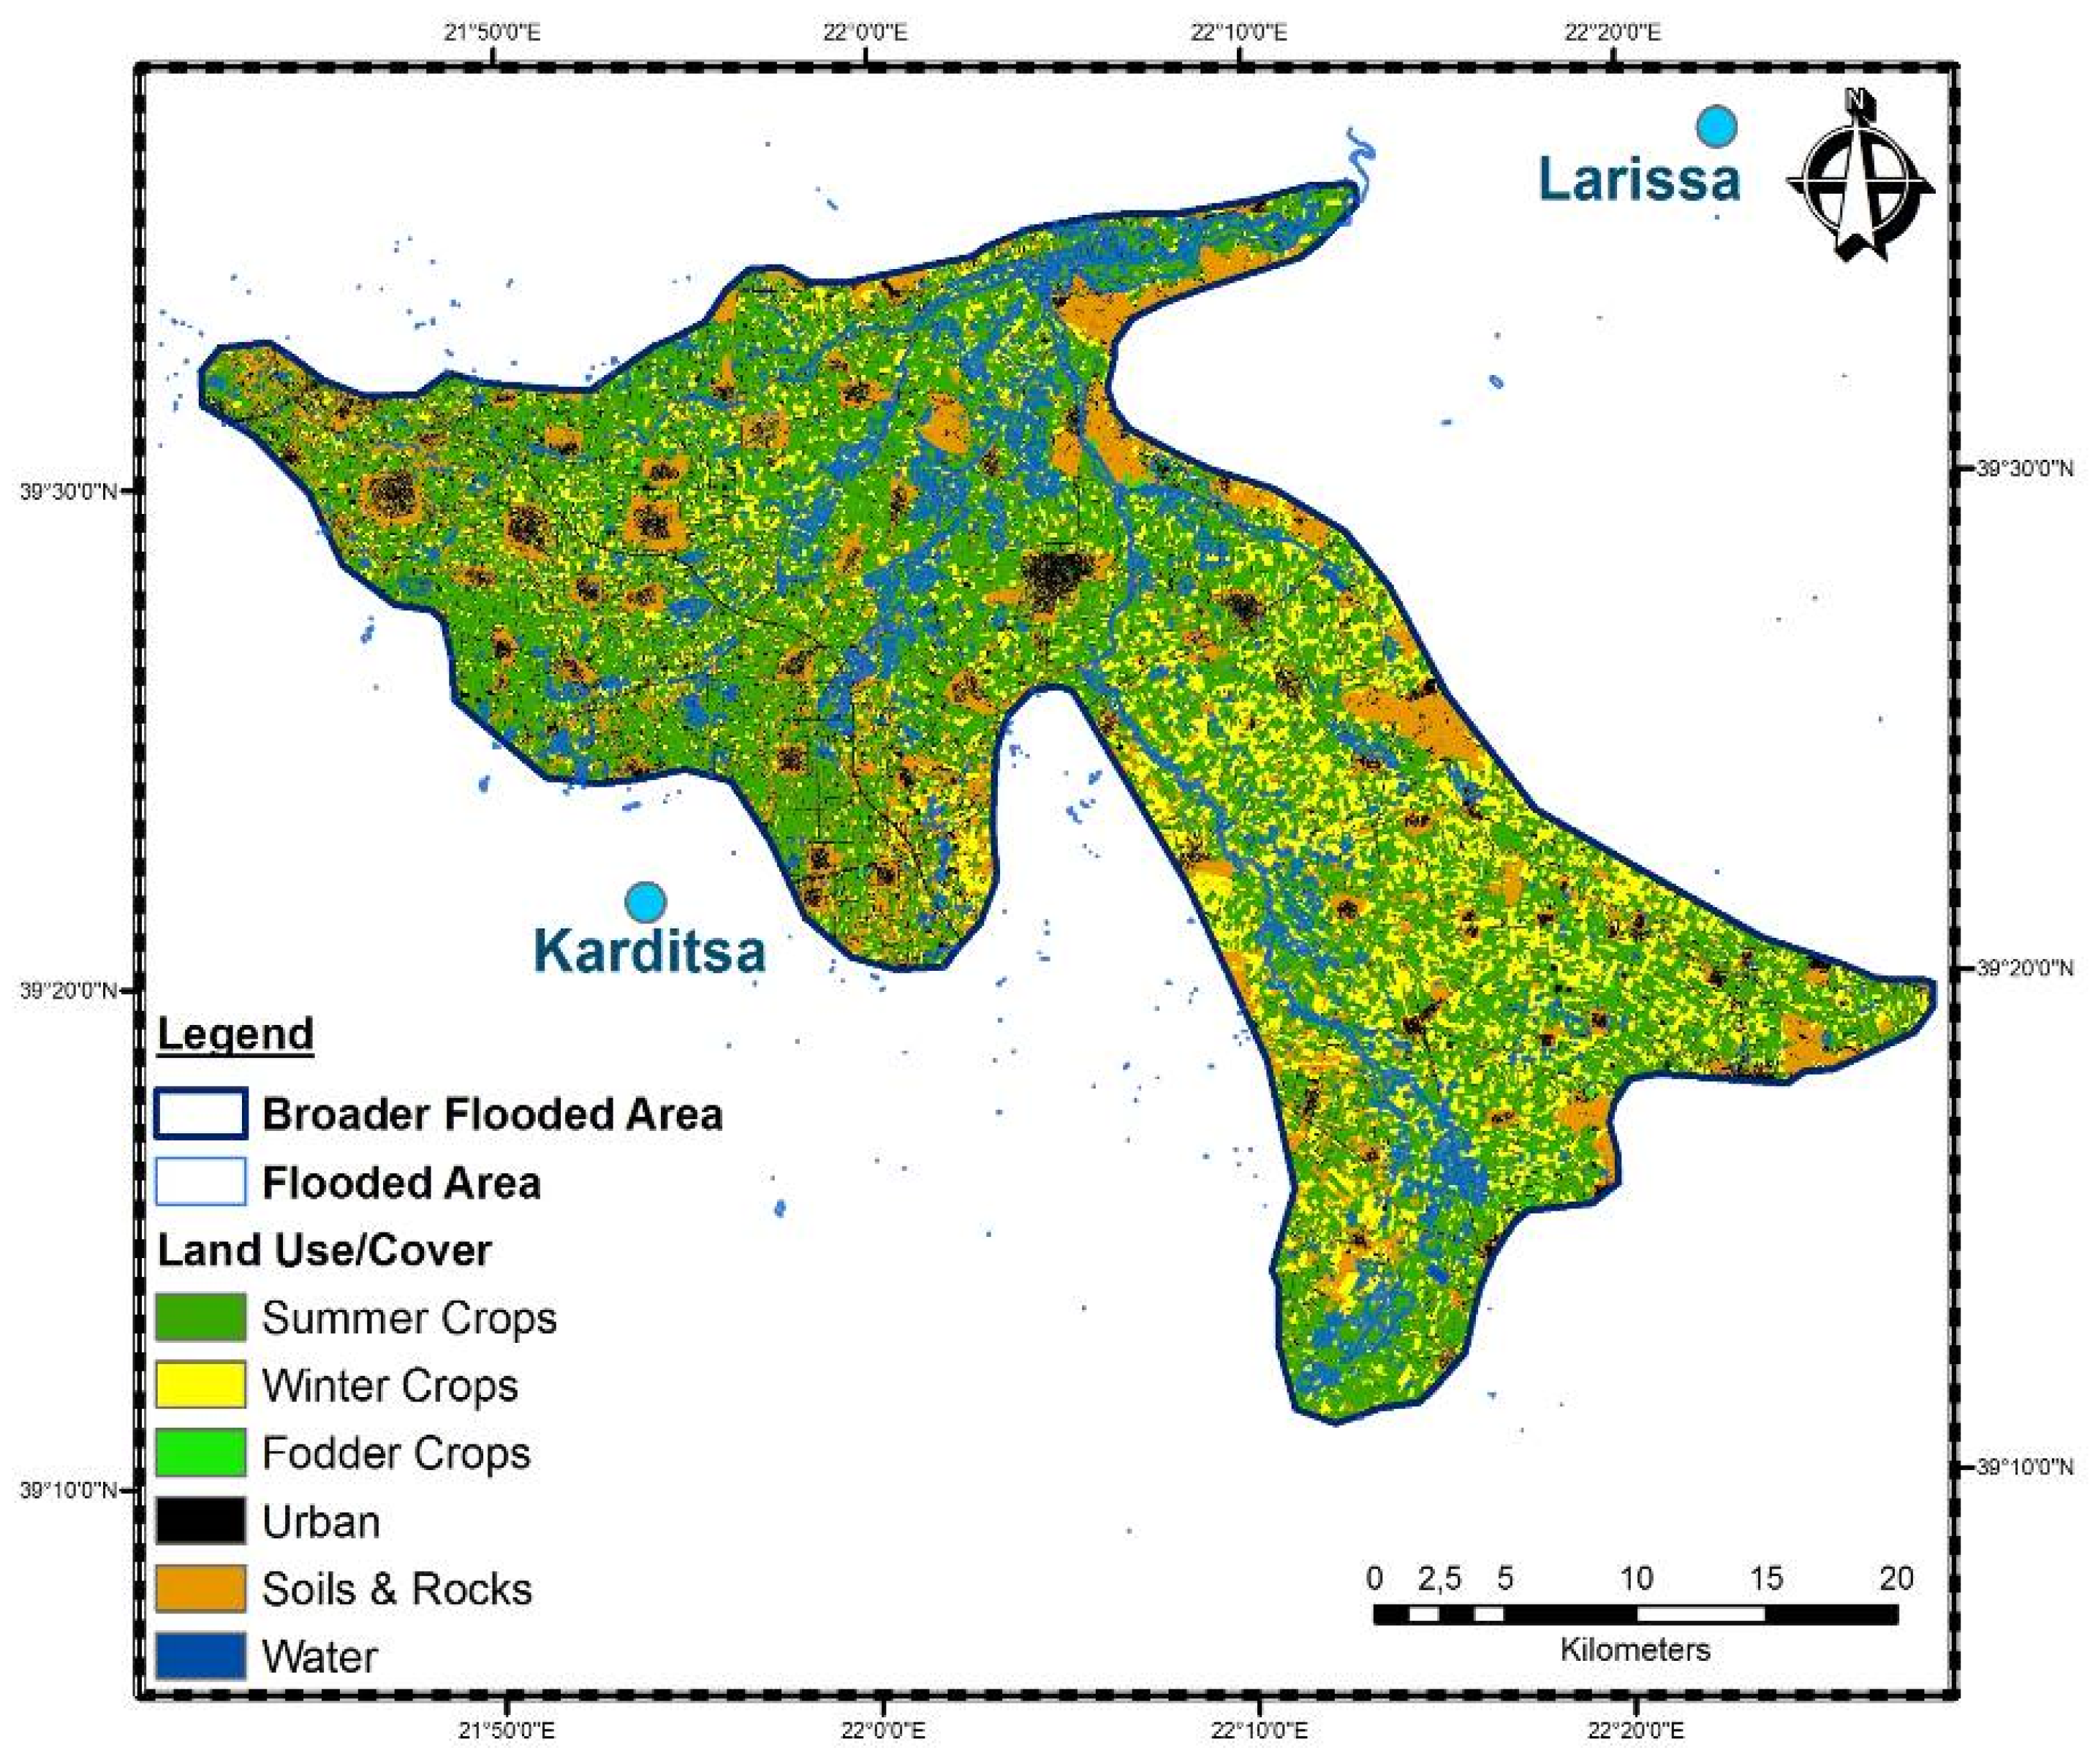
The classified land use/cover map derived from the four S2 multi-seasonal (Figure 4) reveals that the flood affected approximately 3885.7 ha (72.2%) of summer crops (green color), 399.5 ha (7.4%) of winter crops (yellow color), 54.4 ha (1.0%) of fodder crops (light-green color), 446.1 ha (8.3%) of urban areas and roads (black color), 516.8 ha (9.6%) of nude soils and rocks. Furthermore, the above-mentioned data were compared to the elaborated public-sector data. More precisely, the Greek Agricultural Insurance Organization (ELGA) covered an area of 3823.8 ha which mainly consists of summer and all-season cultivars such as cotton (79%), wheat (12%), corn (4%) and so on. The compensation recipients received the total amount of 844,563.8 €, that was mostly distributed to cotton (66%), wheat (11%), maize (6%), industrial tomatoes (4%), melon (6%) and so forth.
The results of this research indicate that there is a direct correlation between the flooded area that was delineated from the water indices and the area calculated and compensated by ELGA. The delayed acquisition of L7 data (one day after the phenomenon), the accuracy of crop classification (approximately 89%) and the fact that compensations are only given under certain circumstances, namely the total damaged production is greater than 20%, the total annual compensation of each parcel is no greater than 80% etc. [28], justify the small differentiation between them.
5. Conclusions
In a nutshell, remotely sensed data are increasingly being used for flood extent mapping and damage assessment. Optical sensor data are readily available free of charge and can be used with available well-defined, robust data processing techniques. Optical sensors cannot penetrate clouds. Effective and timely flood warning can be attained with frequent radar observations of flood-prone areas through cloud cover. However, radar data can be more difficult to interpret and analyze.
The visual interpretation analysis of four different water indices MNDWI, TCW, DVW and RSWIR of L7, shows that all indexes were very accurate at classifying water pixels, with very high accuracies. The MNDWI and RSWIR indices appear to be a little more efficient for delineating water bodies during floods.
The study also provides detailed information about the affected land use/land cover in flooded area. The use of multi-seasonal S2 data to classify crop types was more than satisfactory.
Author Contributions
E.P. and M.Z. contributed to the acquisition of the appropriate data and to their pre-process and process stages, as well as to the analysis of the results. E.P., M.Z. and N.D. wrote the paper.
Acknowledgments
The authors acknowledge ESA-Copernicus and USGS-NASA for the availability of Landsat and Sentinel satellite data; and the Greek Agricultural Insurance Organization (ELGA) provided compensation data.
Conflicts of Interest
The authors declare no conflict of interest.
References
- Brivio, P.A.; Colombo, R.; Maggi, M.; Tomasoni, R. Integration of remote sensing data and GIS for accurate mapping of flooded areas. Int. J. Remote Sens. 2002, 23, 429–441. [Google Scholar] [CrossRef]
- Jonkman, S.N.; Kelman, I. An analysis of the causes and circumstances of flood disaster deaths. Disasters 2005, 29, 75–97. [Google Scholar] [CrossRef] [PubMed]
- Diakakis, M.; Deligiannakis, G.; Katsetsiadou, K.; Lekkas, E.; Melaki, M.; Antoniadis, Z. Mapping and Classification of direct effects of the flood of October 2014 in Athens. Bull. Geol. Soc. Greece 2016, 50, 681–690. [Google Scholar] [CrossRef]
- Psomiadis, E. Flash flood area mapping utilizing Sentinel-1 radar data. In Proceedings of the Earth Resources and Environmental Remote Sensing/GIS Applications VII, Edinburgh, UK, 26–29 September 2016. [Google Scholar] [CrossRef]
- Ologunorisa, T.E.; Abawua, M.J. Flood risk assessment: A review. J. Appl. Sci. Eniron. Manag. 2005, 9, 57–63. [Google Scholar]
- Psomiadis, E.; Dercas, N.; Dalezios, N.; Spyropoulos, N. The role of spatial and spectral resolution on the effectiveness of satellite-based vegetation indices. In Proceedings of the SPIE, Remote Sensing for Agriculture, Ecosystems, and Hydrology XVIII, Edinburgh, UK, 26–29 September 2016. [Google Scholar]
- Frazier, P.S.; Page, J.K. Water Body Detection and Delineation with Landsat™ Data. Photogramm. Eng. Remote Sens. 2000, 66, 1461–1467. [Google Scholar]
- Klemas, V. Remote Sensing of Floods and Flood-Prone Areas: An Overview. J. Coast. Res. 2015, 31, 1005–1013. [Google Scholar] [CrossRef]
- Earth.esa.int. User Guides–Sentinel-2 MSI–Overview–Sentinel Online. 2015. Available online: https://earth.esa.int/web/sentinel/user-guides/sentinel-2-msi/overview (accessed on 13 November 2017).
- Chatziantoniou, A.; Petropoulos, G.P.; Psomiadis, E. Co-Orbital Sentinel 1 and Sentinel 2 for LULC Mapping with Emphasis in a Mediterranean Setting Based on Machine Learning. Remote Sens. 2017, 9, 1259. [Google Scholar] [CrossRef]
- Gao, B.C. NDWI—A normalized difference water index for remote sensing of vegetation liquid water from space. Remote Sens. Environ. 1996, 58, 257–266. [Google Scholar] [CrossRef]
- Xu, H.Q. Modification of normalized difference water index (NDWI) to enhance open water features in remotely sensed imagery. Int. J. Remote Sens. 2006, 27, 3025–3033. [Google Scholar] [CrossRef]
- Memon, A.; Muhammad, S.; Rahman, S.; Haq, M. Flood monitoring and damage assessment using water indices: A case study of Pakistan flood-2012. Egypt. J. Remote Sens. Space Sci. 2015, 18, 99–106. [Google Scholar] [CrossRef]
- Crist, E.P.; Cicone, R.C. A Physically-Based Transformation of Thematic Mapper Data—The TM Tasseled Cap. IEEE Trans. Geosci. Remote Sens. 1984, GE-22, 256–263. [Google Scholar] [CrossRef]
- Huang, C.; Wylie, B.; Yang, L.; Homer, C.; Zylstra, G. Derivation of a tasselled cap transformation based on Landsat 7 at-satellite reflectance. Int. J. Remote Sens. 2002, 23, 1741–1748. [Google Scholar] [CrossRef]
- Fisher, A.; Flood, N.; Danaher, T. Comparing Landsat water index methods for automated water classification in eastern Australia. Remote Sens. Environ. 2016, 175, 167–182. [Google Scholar] [CrossRef]
- McFeeters, S.K. The use of the Normalized Difference Water Index (NDWI) in the delineation of open water features. Int. J. Remote Sens. 1996, 17, 1425–1432. [Google Scholar] [CrossRef]
- Rogers, A.S.; Kearney, M.S. Reducing signature variability in unmixing coastal marsh thematic mapper scenes using spectral indices. Int. J. Remote Sens. 2004, 25, 2317–2335. [Google Scholar] [CrossRef]
- Gond, V.; Bartholomé, E.; Ouattara, F.; Nonguierma, A.; Bado, L. Surveillance et cartographie des plans d’eau et des zones humides et inondables en régions arides avec l’instrument VEGETATION embarqué sur SPOT-4. Int. J. Remote Sens. 2004, 25, 987–1004. [Google Scholar] [CrossRef]
- Kiage, L.M.; Walker, N.D.; Balasubramanian, S.; Baras, J. Application of Radarsat-1 synthetic aperture radar imagery to assess hurricane-related flooding of coastal Louisiana. Int. J. Remote Sens. 2005, 26, 5359–5380. [Google Scholar] [CrossRef]
- Henry, J.-B.; Chastanet, P.; Fellah, K.; Densos, Y.-L. Envisat multipolarized ASAR for flood mapping. Internation. J. Remote Sens. 2006, 27, 1921–1929. [Google Scholar] [CrossRef]
- Orengo, H.A.; Krahtopoulou, A.; Garcia-Molsosa, A.; Palaiochoritis, K.; Stamati, A. Photogrammetric re-discovery of the hidden long-term landscapes of western Thessaly, central Greece. J. Archaeol. Sci. 2015, 64, 100–109. [Google Scholar] [CrossRef]
- Ministry of Environment and Energy of Greece. Available online: http://www.ypeka.gr/Default.aspx?tabid=37&locale=en-US (accessed on 29 December 2017).
- Earth Explorer. Available online: https://earthexplorer.usgs.gov/ (accessed on 18 October 2017).
- Copernicus Open Access Hub. Available online: https://scihub.copernicus.eu/ (accessed on 20 October 2017).
- Harris Geospatial Solutions. Available online: http://www.harrisgeospatial.com/docs/QUAC.html (accessed on 5 November 2017).
- Rouse, J.W.; Haas, R.H.; Schell, J.A.; Deering, D.W. Monitoring the Vernal Advancement and Retrogradation (Green Wave Effect) of Natural Vegetation; NASA/GSFC Type III Final Report; NASA: Washington, DC, USA, 1974; p. 371. [Google Scholar]
- Greek Agricultural Insurance Organization. Available online: http://www.elga.gr/ (accessed on 29 November 2017).
Figure 1.
The study area located in Central Greece, with its principal geomorphological and hydrological characteristics (Coordinate System: Greek Grid).
Figure 1.
The study area located in Central Greece, with its principal geomorphological and hydrological characteristics (Coordinate System: Greek Grid).

Figure 2.
Flow-chart of the implemented methodology.

Figure 3.
The four implemented water indices, (a) MNDWI, (b) TCW, (c) DVW and (d) RSWIR.

Figure 4.
The land use/cover classified map with the overlapping of the extracted flooded area.

Publisher’s Note: MDPI stays neutral with regard to jurisdictional claims in published maps and institutional affiliations. |
© 2018 by the authors. Licensee MDPI, Basel, Switzerland. This article is an open access article distributed under the terms and conditions of the Creative Commons Attribution (CC BY) license (https://creativecommons.org/licenses/by/4.0/).
Share and Cite
MDPI and ACS Style
Zoka, M.; Psomiadis, E.; Dercas, N. The Complementary Use of Optical and SAR Data in Monitoring Flood Events and Their Effects. Proceedings 2018, 2, 644. https://doi.org/10.3390/proceedings2110644
AMA Style
Zoka M, Psomiadis E, Dercas N. The Complementary Use of Optical and SAR Data in Monitoring Flood Events and Their Effects. Proceedings. 2018; 2(11):644. https://doi.org/10.3390/proceedings2110644
Chicago/Turabian StyleZoka, Melpomeni, Emmanouil Psomiadis, and Nicholas Dercas. 2018. "The Complementary Use of Optical and SAR Data in Monitoring Flood Events and Their Effects" Proceedings 2, no. 11: 644. https://doi.org/10.3390/proceedings2110644