Defining Economic Level of Losses in Shadow: Identification of Parameters and Optimization Framework †


1
Faculty of Civil Engineering University of Ljubljana, 1000 Ljubljana, Slovenia
2
Faculty of Economics, University of Ljubljana, 1000 Ljubljana, Slovenia
*
Author to whom correspondence should be addressed.
†
Presented at the 3rd EWaS International Conference on “Insights on the Water-Energy-Food Nexus”, Lefkada Island, Greece, 27–30 June 2018.
Proceedings 2018, 2(11), 599; https://doi.org/10.3390/proceedings2110599
Published: 7 August 2018
(This article belongs to the Proceedings of EWaS3 2018)
Abstract
:Water losses are in focus of water supply management in last decades. Basic and widely accepted indicator is ILI Index, but is insufficient, when water resources are abundant, treatment costs low and energy consumption miniscule due to gravity. In such situation several authors introduced more detailed analysis defining “Economic Level of Leakage” (ELL) in short run. This analysis provides an insight into shadow market of leakages that is defined by marginal cost of water supplied on supply side and by marginal cost of repairs to mitigate water loss on demand side and provide empirical example based on real water supply system (WSS) data.
Published: 7 August 2018
1. Introduction
Management of water losses in general represents one of the main task of water suppliers either being public or private. Although water represents a precious resource, water distribution networks lose on average approximately half of the input resource. In the EU, 21% of water to households, public buildings and businesses is provided by public networks [1]. Industry, on the other hand, has different water abstraction rights. Years of underinvestment have led to deteriorated public water supply networks with substantial water leakage. According to Egenhofer and others, the losses in selected EU countries encompasses almost 50% in Bulgaria, followed by Slovenia with 40% and Hungary, Ireland, Czech Republic and Romania with 30% of losses in distribution networks. On the other hand, Germany and Denmark report less than 10% of losses, in US about 16% of clean drinking water is wasted daily [2,3]. If we consider that water is supplied through a pumping station and that water shall be purified, water losses have an enormous economic value and their recovery requires considerable investments. EU “Blueprint to Safeguard Europe’s Waters”, focusing on water availability and resource sustainability, represents an increasing pressure on efficient water management due to increasing water demand and competition between users. As being highlighted in the literature, improving water efficiency will affect a number of sectors: public water supply network, end-users (households), agriculture, energy and manufacturing sector [2]. Therefore, it is important to use cost-benefit analysis that includes also the long-term sustainability and viability of water supply systems in order to identify the “efficient” level of leakage. However, we should be aware that water leakage represents only one side of the cost-benefit analysis. Therefore, we should ask ourselves to what extent water loss reduction is appropriate.
This paper represents the evaluation of the economic level of losses (ELL) in the biggest, state owned, water supply (WSS) company in Slovenia, a mountain country where water resources are in general abundant and of high quality. However, Slovenia is one of EU countries with highest share of water losses in distribution networks. Thus the ELL analysis is of specific importance. The applied theoretical background will be discussed, and some practical experience on real data demonstrated. We aim to develop characteristic form of total costs’ curve enabling identification of generalized behaviour of actors in this shadow market.
2. Literature Review
Among the literature that covers the issue of water loss, only few are based on a theoretical approach. For example, Pearson and Trow estimate the optimum “economic levels of leakage” by comparing costs of providing clean water in network with costs of active leakage control [4]. They argue in their work that if producing water is less costly than investing in activities that reduce leakage, water utilities should produce more water (extract water) to compensate the amount of water lost through leaks. The marginal cost of water is estimated by the difference in cost of producing one more unit of water in terms of power (energy), chemicals (for treatment) and labor. The total costs resemble the cost of leakage control plus cost of water production. These costs are high in the case of low level of leakage due to the fact that it is very costly to achieve low levels of leakage. The U-shaped total costs curve indicates that we can identify the short run economic level of leakage where marginal costs of leakage detection activity will be equal to the marginal cost of water.
Garcia and Thomas [5] compare the marginal cost of labor applied to the infrastructure replacement (as most replacements are highly labor-intensive) and the marginal cost of pumping water (which consists mainly of energy costs) to decide whether or not to invest in leakage reduction. Due to the fact that marginal costs of main replacement are much higher if compared to marginal costs of pumping additional water they conclude that “joint production” of water loss and service output has a cost advantage. Based on their work Martins et al. [6] estimate an empirical cost function with two outputs; water loss (yl) and service output (ys) to observe the effect of reducing water losses on the water utility performance in terms of cost effectiveness. They compare the cost of producing water loss and the cost of producing serviced water. The conclusion is that the marginal cost of yl is greater than the marginal cost of ys representing an incentive for reducing water losses. Based on their model Zschille and Walter [7] assessed the cost efficiency of the German WS utilities reporting that incentives to reduce costs and corresponding prices are still missing.
Usually the literature suggests cost-benefit analysis to establish the economic level of leakage (ELL) based on comparing the cost of repairing the leakage with the benefits of saving water or costs with developing additional supplies elsewhere. However, an important issue whether leakage undermines sustainability remained unanswered and very dependent on methodology (level of water scarcity, the impact on environment, consumers’ perception). The existing evaluation practices don’t reflect long-term sustainability of the water environment, nor social (Social considerations mostly refer to (1) unsustainable resort to scarce water resources; (2) carbon emissions from increased energy consumption in the process of drinking water provision; (3) risk of contamination due to poor infrastructure [8]) or financial considerations. There were some attempts to include externalities and concept of SELL (Sustainable Economic Level of Leakage) has been developed [9,10].
Water loss could be divided into two main groups: real losses and apparent losses [11]. Real losses refer to physical losses of water due to leakage, while apparent losses include illegal water use, customer meter under-registration and billing errors. In order to assess water losses, it is crucial to estimate the component of apparent losses. There are three common methods for component estimation process: Minimum Night Flow Analysis (MNF), Bursts and Background Estimates (BABE) and the Top-Down Water Balance. Al-Washali and others [12] summarized advantages and drawbacks of all three methods that estimate the main components of apparent and real losses. Minimum night flow analysis remains the only method that provides valuable actual measurements but requires intensive field work, sophisticated equipment and advanced technical awareness of the network components. This method requires that measurements are conducted regularly throughout the year and several representative DMAs. BABE concept, on the other hand, breaks down real losses into sub-components and brings better understanding of the nature and types of leaks in the network. However, Al-Washali and others [12] stress that BABE concept use intensive assumptions from specific cases that could not be generalized for other water supply networks. Water losses, estimated by using the BABE concept, are underestimated and should be used as a supplementary tool to breakdown the volume of real losses (Methods of assessment of customer meter inaccuracies and other components of apparent losses are presented in [13,14,15,16,17,18,19]). The third concept, the Top-Down Water Balance, is a cost-effective assessment but lack an objective methodology for estimating unauthorized consumption. For European utilities, Lambert and others recommended default values of apparent losses [20]. However, there is a need for more objective assumptions of apparent losses especially for developing countries and devising practical methods to estimate unauthorized consumption.
From an economic point of view, the impact of leakages is substantial. It increases operating costs that relates to treatment and transportation. The estimated global cost of water losses is around US $14 billion per year [21]. Moreover, it has been estimated that the level of daily leakage in the world in 2006 could serve 200 million people’s needs for drinking water representing a significant portion of opportunity costs [21]. Investment decision at the firm level is based on future revenues and costs that are associated with investment. As water supply is a subject to price regulation, the actual decision on investment is basically being driven by regulators and objective functions of politicians and owners of water utilities (private or public). Moreover, the need for significant investment in water networks has represented an important argument in privatization of public utilities in France and UK when local authorities lacked technical and financial resources to comply with new European quality standards [22]. Similar policies were promoted by the World Bank also in Latin America. Cavaliere and others [23] analyzed optimal investments to reduce water losses in a regulated water industry with perfectly inelastic demand and private information about local investment efficiency. The theoretical analysis, supported by a calibration and simulation exercise, demonstrated that the incentive to invest is affected by ownership, financial structure and revenue cap. Overinvestment (that showed up as additional cost of capital at the firm level) is accounted differently. In public firms: (i) the effect of the revenue cap is diluted and investments distortions with respect to a benevolent social planner are negligible; (ii) information rents are valued according to the marginal cost of public funds; (iii) the distortionary taxation and a price inelastic demand drive local politicians to maximize water revenues to finance investments and to increase municipal fiscal gains.
3. The case of Water Leakage in WSS Company VO-KA Ljubljana
The main purpose of this paper is to apply the approach of Pearson and Trow in practice and define the ALC curve, both qualitatively and quantitatively [4]. Empirical approach is usually based on identification of points along the curve that resemble historical data of leakages and associated prevention costs. Rehabilitation and substitution investments (like adoption of new technologies for leaks detection) imply significant long run costs but induce decrease of variable costs (i.e., energy consumption) and social damages. However, pushing infrastructure investment to zero leaks is usually not economically justified.
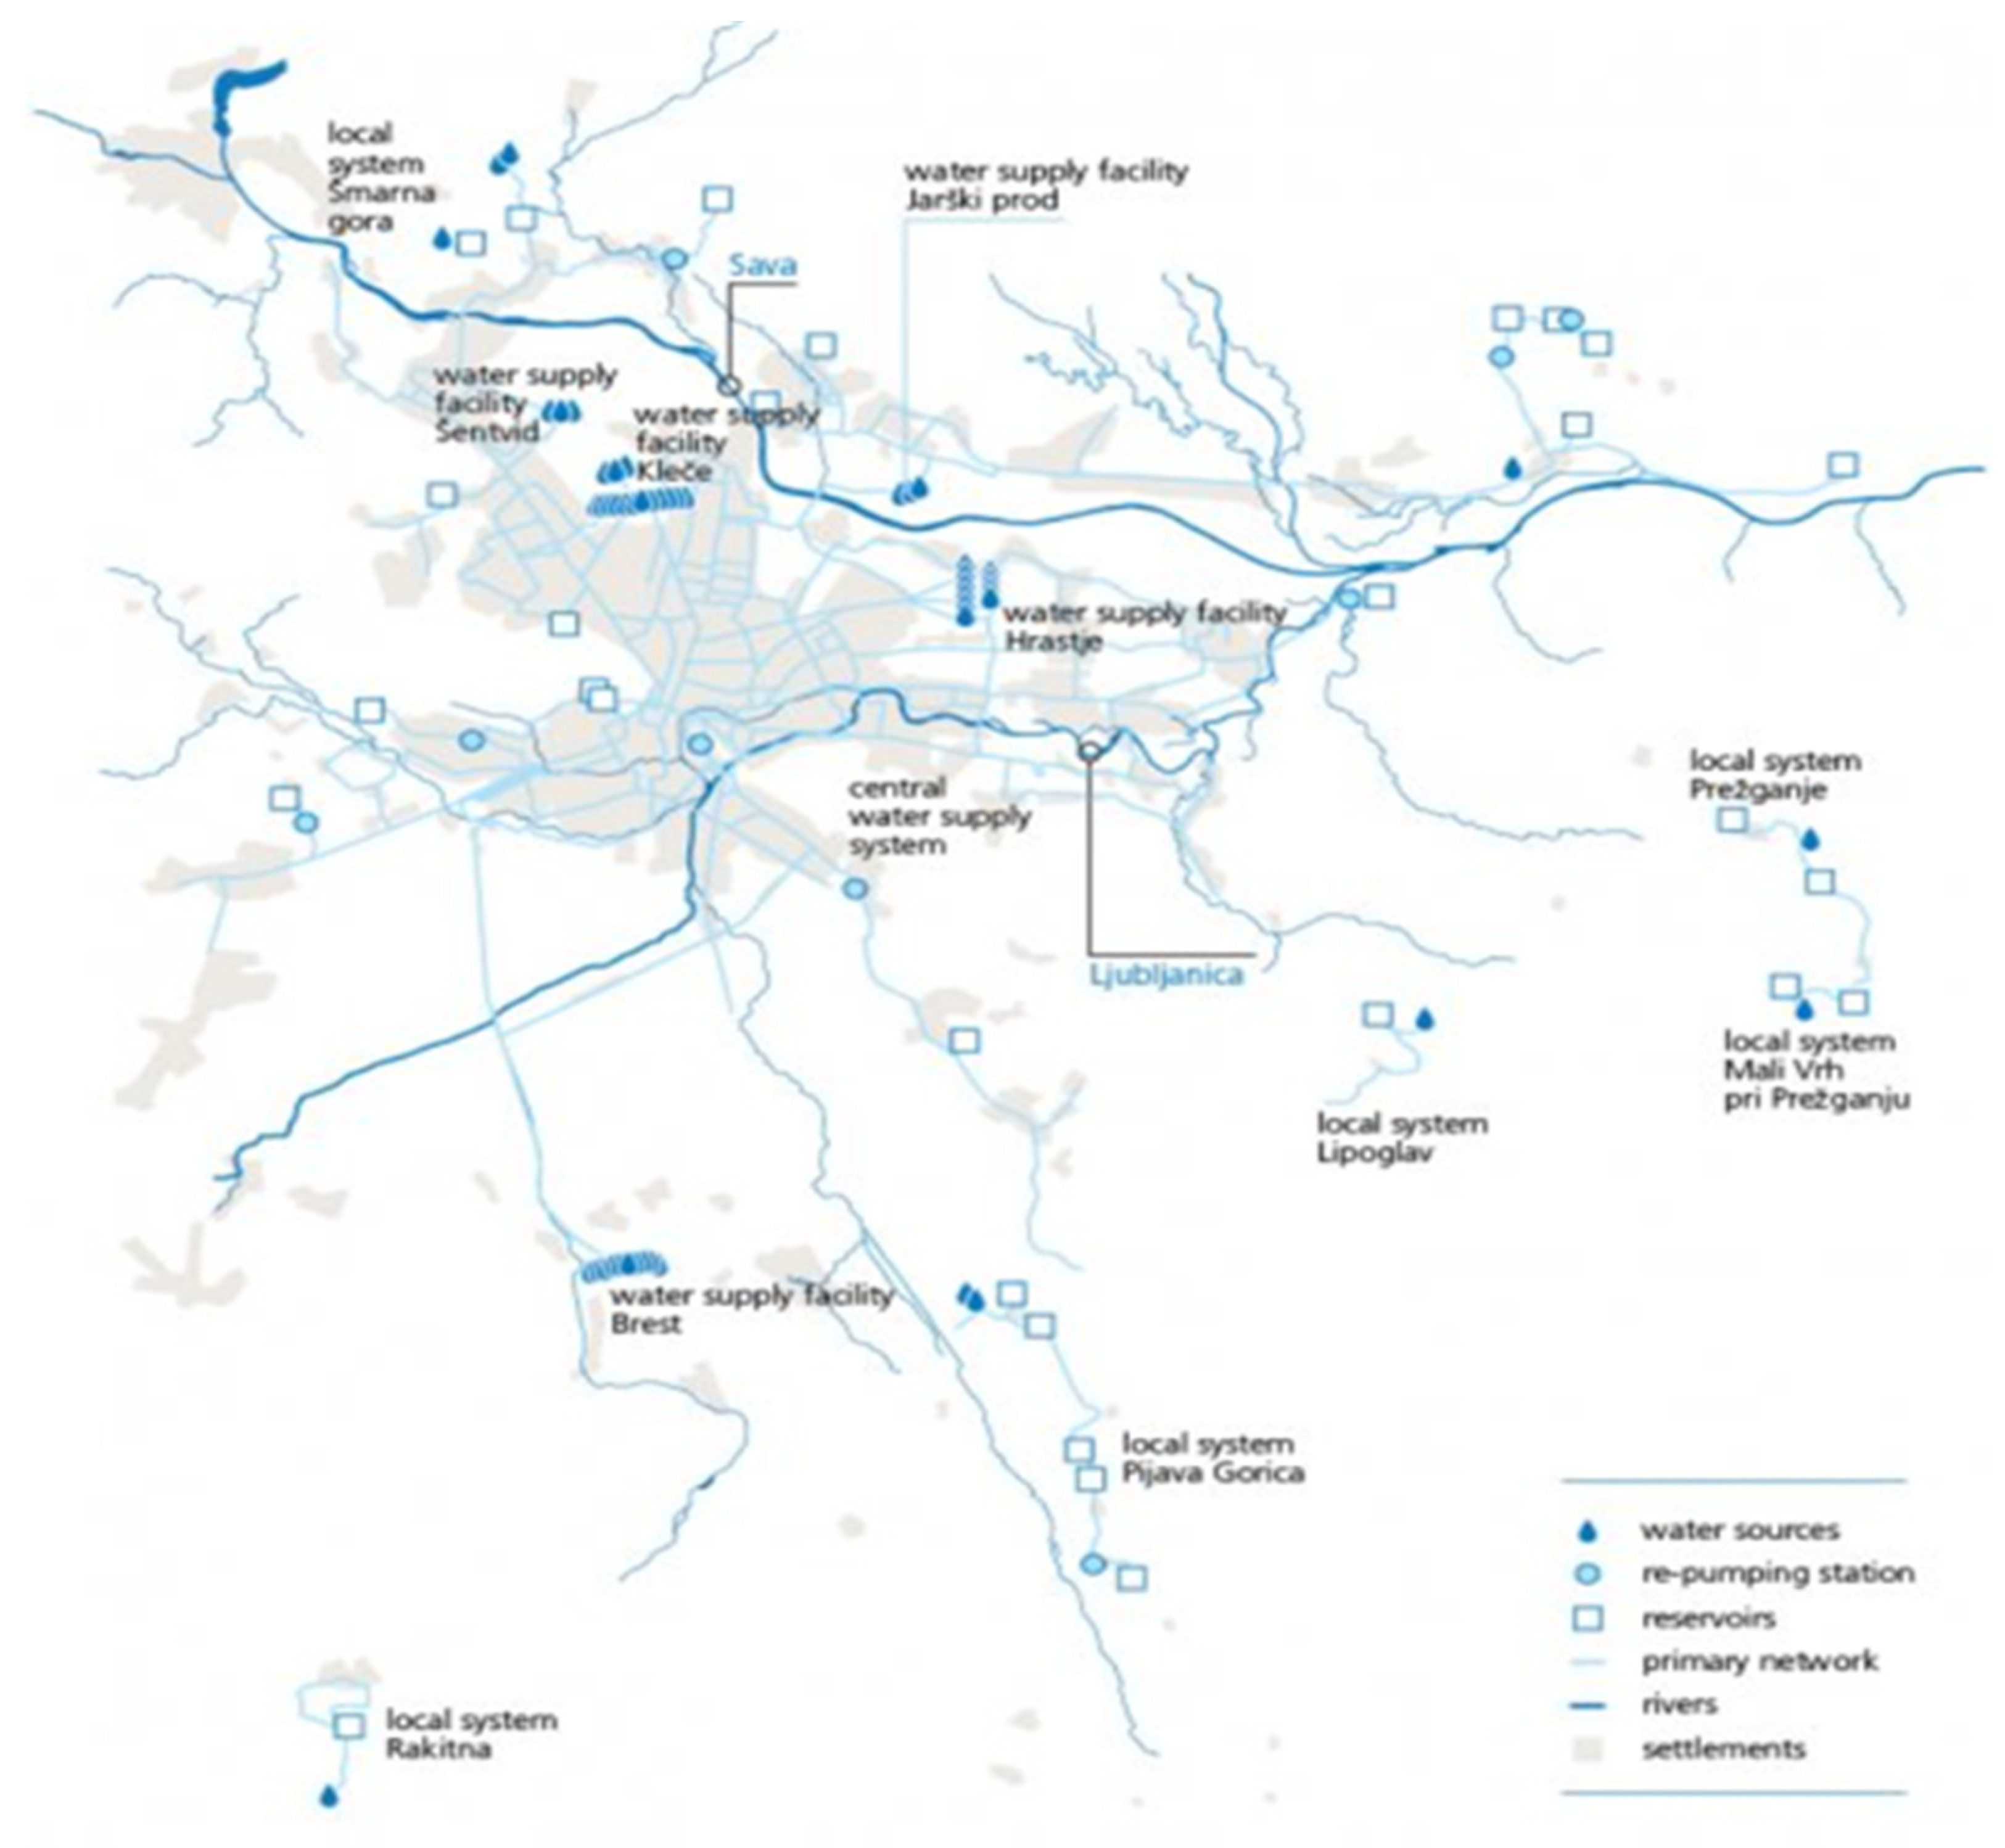
Public company VO-KA Ljubljana is the largest company in Slovenia in terms of the drinking water supply system as it has the largest number of users and serves several municipalities: Ljubljana, Brezovica, Dobrova–Polhov Gradec, Dol pri Ljubljani and Škofljica. The company is a part of holding (Javni Holding Ljubljana) which is 100 percent state owned company. The company was founded in 1890. Each user consumes between 115–150 L of drinking water per day. The central water supply system and six local systems comprise 1100 km of the water supply networks, supplying 315,000 users through 40,500 connections (Figure 1). The water source of the central system is the groundwater of the sand and gravel aquifers of Ljubljansko polje and Ljubljansko barje, where groundwater is pumped in five WSS facilities: Kleče, Hrastje, Jarški prod, Šentvid and Brest. Drinking water runs via the WSS network to users from the natural environment, without any technical water preparation procedures, and is only chlorinated occasionally. For some specific areas (i.e., castle hill) a re-pumping station or a hydro station fir adequate and stable pressure conditions is included in the network.
The network of the Ljubljana WSS includes pipes made of steel, cast iron, polyethylene and polyvinyl chloride, spheroidal-graphite cast iron and asbestos cement. The oldest pipe networks are over 120 years old. The most commonly used material in renovation is spheroidal-graphite cast iron in general, but polyethylene for household connections. The functioning of WSS is supervised in the control center. Data on pumping, re-pumping and water storage are automated and controlled by a remote system. Drinking water consumption in all locations connected to WSS is measured by water gauges that are replaced every three to five years.
In this analysis we analyzed water leaks in central and three local WSS: Lipoglav, Rakitna and Pijava Gorica. In 2016, the local Pijava Gorica system supplied 3154 inhabitants, while the length of primary and secondary waterworks totaled 31.9 km and the number of water connections was 1.078. The local water supply system Rakitna supplied 753 inhabitants, while the length of primary and secondary waterworks totaled 9.7 km, and the number of water connections was 385. Lipoglav is the smallest system among the studied. In 2016, the local water supply system Lipoglav supplied 596 inhabitants, while the length of primary and secondary pipe networks totaled 16.3 km and the number of water connections was 230. VO-KA has managed to decrease non-revenue water in the period of 2006–2016 by 37%, from 12.8 to 8.0 mio m3/year.
In general VO-KA uses three ways to detect potential leakages:
- Improving the control of the plumbing system (establishing permanent measuring points): From constant monitoring stations, where flows are measured in the measuring areas 24 h a day, the data is transmitted to the control center wirelessly or via fiber (where these connections are already built and accessible). The recommendations of the profession are taken into account in order to control from 30 to 50 km of water supply network with individual measuring points. Continuous monitoring of flow data at individual measuring points enables a considerable reduction of time to detect failure, shortening of time from occurrence to elimination of failure, and thus faster reduction of leaks.
- Pressure reduction: During the last five years, three pressure regulators have been built. The expected effects are a 15 to 25 percent reduction in current water losses in the area where the pressure will be reduced by pressure reduction devices. Due to lower pressures and smaller pressure fluctuations, which are otherwise dependent on the daily dynamics of water consumption in the water supply system and the way of operating water bodies, it is also expected to reduce the number of damages on the water supply network and water supply connections. Positive effects of pressure reduction will not only affect the reduction of existing water losses, but also reduce the frequency of faults on the water supply network, where pressure regulators will be installed. This will produce additional positive effects, which are difficult to be financially evaluated before the implementation of the measures (An interested reader could find more evidence on that in [24,25,26,27,28,29]).
- Active detection of faults-direct work: A prerequisite for effective detection of failures (fast response time, rapid detection of failure) with a relatively small number of employees is the establishment of permanent monitoring stations. The measuring point allows the immediate detection of the wider location of the failure. The exact location must be found with the appropriate team on the ground, which requires the use of modern tools and good technical and expert knowledge of fault seekers. The minimum range of appropriately qualified and trained personnel, who daily deals exclusively with the detection of losses in the area of the Ljubljana water supply system, is estimated to at least 4 people. The cost of one worker for one year is estimated at between EUR 25,000 and EUR 30,000. Every year, about 200 L per second of leakages are detected and removed by means of measuring points and a measuring car (data from the quality indicator). They have 22 permanent measuring areas (DMA). Based on 130 to 150 flow measurements and detailed data analysis, about 300 faults of water supply systems are detected and eliminated every year.
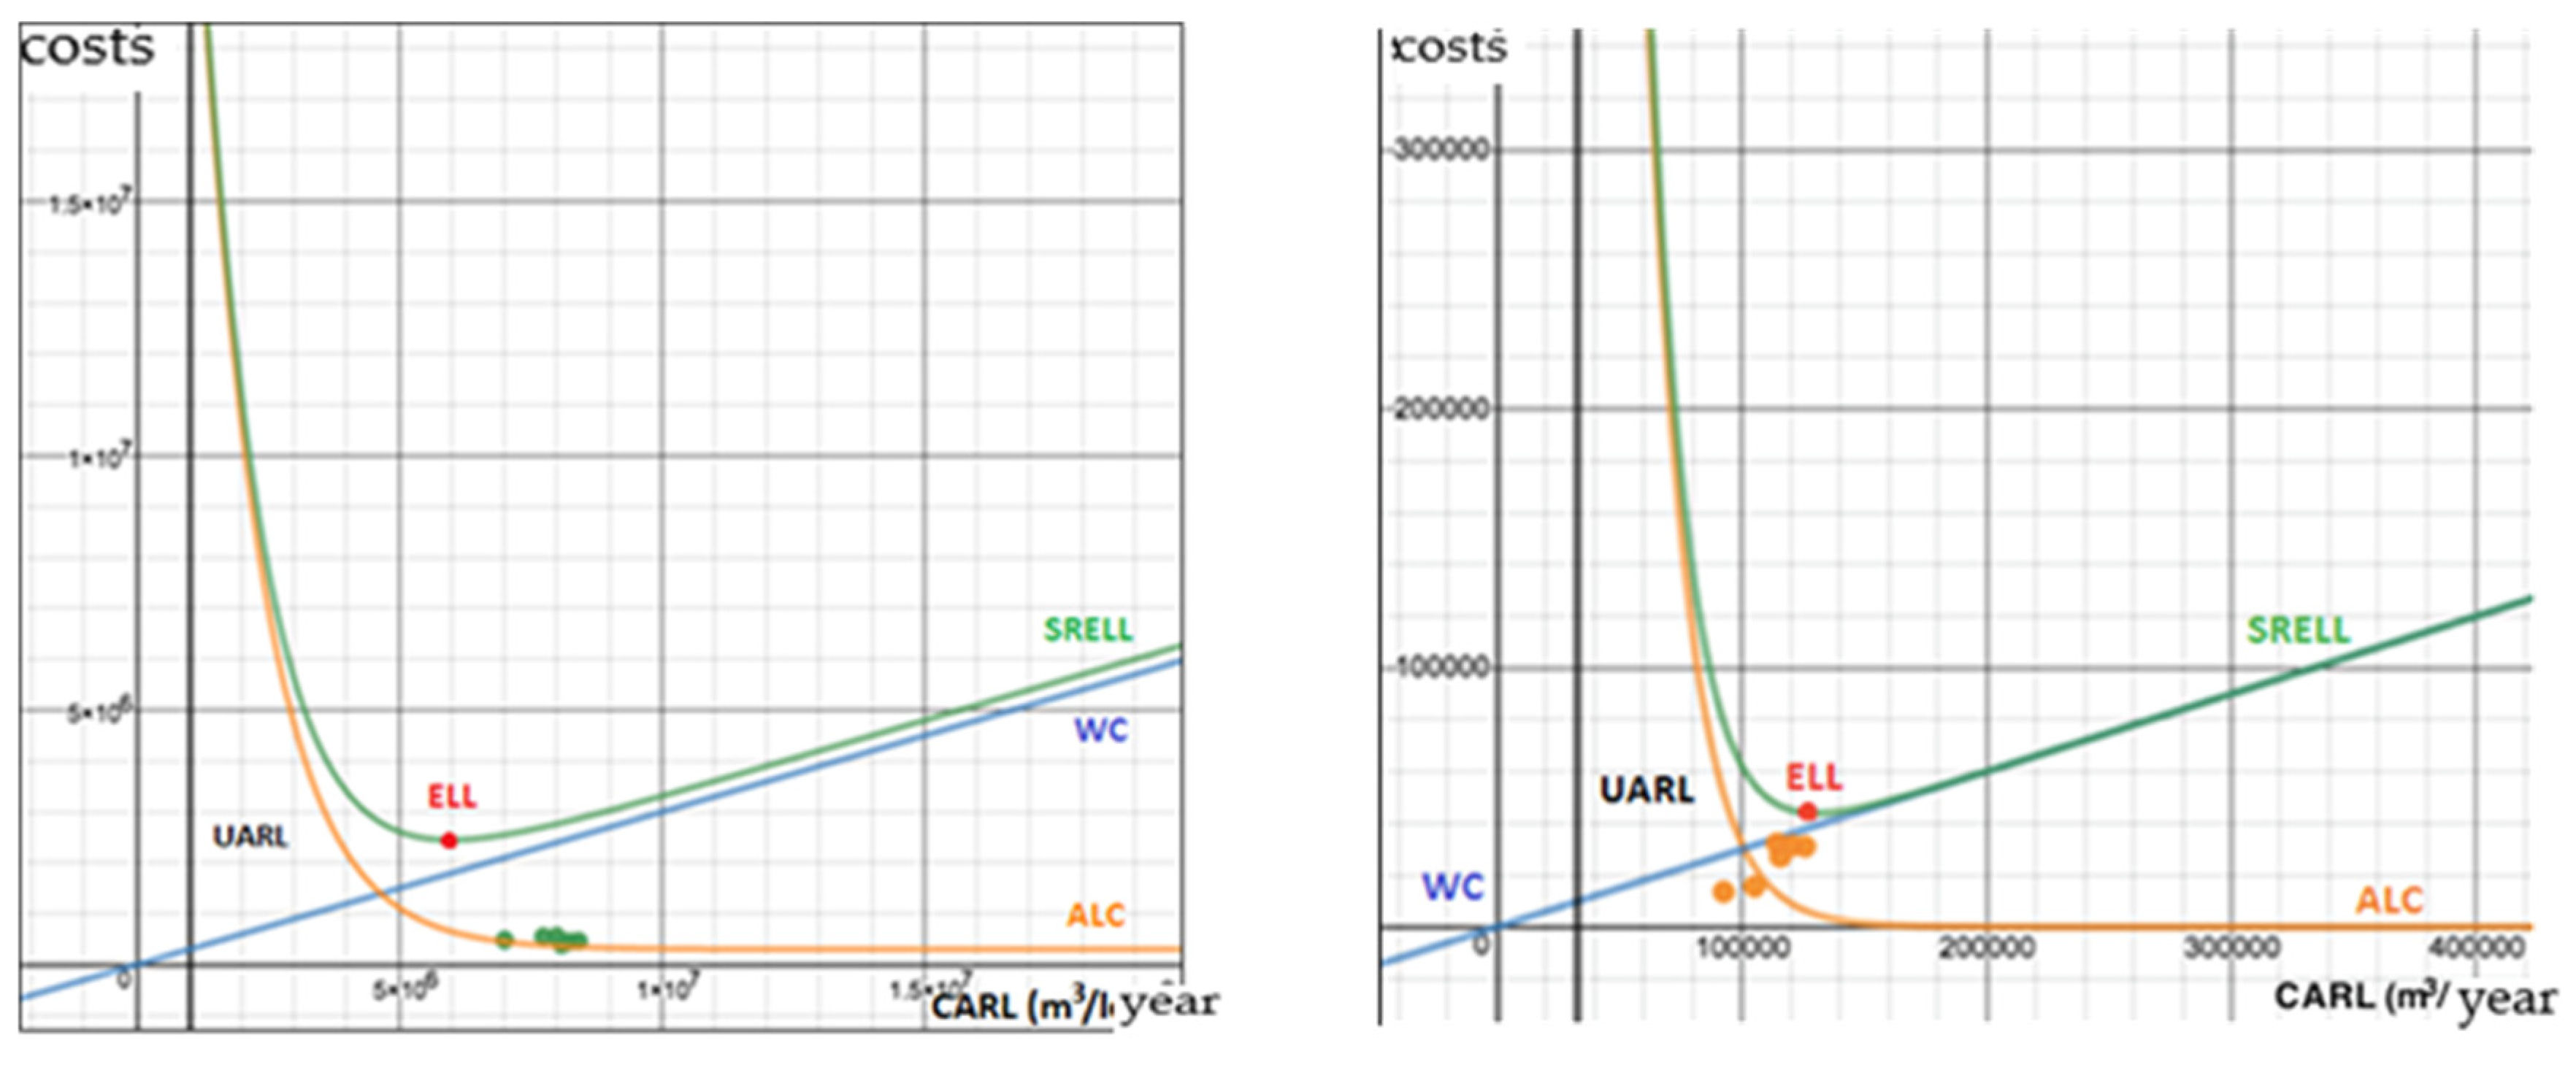
Short-term economically acceptable water losses (SRELL) depend on the current variable water costs, the cost of active leakage control and the rate of increase in undesired leaks. The short-term model is roughly divided into three parts. The first is the vertical line UARL, which represents theoretically the smallest water loss possible in the current system. Reduction of water losses under UARL would imply excessive costs and technical complexity. The second is the rising curve of variable costs (VC), which shows the cost of lost (unnecessarily pumped) water, which does not come to the consumer due to leakage. This cost includes all the costs of variable resources and production facilities that are needed in the process of obtaining water such as electricity, labor costs, water preparation, depreciation, interest, etc. The next is the ALC curve, which shows the cost of finding and eliminating water losses. It shows, among other things, that the costs, associated with finding and eliminating any further cubic meter of lost water, are increasing. The sum of VC and ALC leads to the SRELL curve, which shows the total cost of searching and repairing damages and the cost of lost water due to leakages. The minimum of this curve represents the optimal water loss for which the total cost to the company is minimized. The weakness of the presented model is that it does not take into account environmental factors and externalities, such as environmental damage due to unnecessary consumption of water, additional wear and consequently shorter service life of the pipelines, causing additional environmental damage. Due to the sufficient quantity of water in Slovenia, these environmental factors were not taken as crucial in our analysis.
4. Results and Discussion
ALC in years under consideration were calculated by summing up total costs per failure (excavation and sinking of the construction pit, restoring initial conditions, the cost of material for repairs), monitoring costs (approximated by the share of particular pipe length in the system) and labor costs per day, approximated by gross earnings and average number of working hours. The estimation of working hours is based on diameter size (i.e., usually repair of pipe line with 100 mm DS demands 2 workers and 2 working hours while pipe line with 600 mm diameter size demands 4 workers and 3 working hours). As there were changes in input system volumes in analyzed years we took the value for 2016. Based on share of leakages in the period of 2011–2016 we estimated current annual real losses (CARL) under the assumption of unchanged input system volume. Using regression analysis’ approach we identified the curve that fitted data in best possible way.
Variable costs (WC) were calculated based on costs with preparation and distribution of drinking water. We included also investment and operational costs that relate to water supply system (depreciation (Cost of depreciation (EUR/m3) is calculated as a ratio between total depreciation and system input volume per year. The quotient amounts to 0.1614 indicating that depreciation costs amount to 0.1614 EUR for each m3 of input water), costs of electricity and tax on water reimbursement that amounts to 0.08 EUR per m3). Data on electricity consumption, which are also an integral part of the cost of water, were obtained directly from the company and calculated the average energy consumption (kWh/m3). We multiplied this by the average industrial price of electricity per kWh, obtained from the Eurostat database for Slovenia in the period 2007 to 2016 and the total cost was 0.079 EUR/m3. Costs of water (WC) is different in different parts of WSS due to different energy consumption. The marginal cost of water in central system amounts to 0.28 EUR per m3, in Lipoglav and Pijava Gorica 0.35 EUR per m3 and Rakitna 0.30 EUR per m3.
Based on marginal water costs and estimating parameters of ALC we could derive SRELL curve for all four service areas that were analyzed in this paper. Minimum of the curve depicts economic level of leakages (ELL). In order to perform sensitivity analyses we assumed that costs of electricity might vary for 20% in negative or positive way. Moreover, we also assumed variability in the section of active leakage control as frequency of leakages, costs of material or labor might vary.
Figure 2 and Figure 3 illustrate the estimated curves and identification of optimal level of water leakages (ELL) in terms of SRELL curve. In the central system (Figure 2, left picture) CARL varies between 5.5 mio m3/year and 6.4 mio m3/year or ILI between 5.39 and 6.33 if we imply 20 percent of change in price of electricity or water costs. Current losses are higher than optimal, so it would be optimal from economic standpoint to decrease water leakages in the central system.
In Pijava Gorica (Figure 2, left picture) CARL varies between 121,526 m3/year and 134,431 m3/year or ILI between 3.68 and 4.07 if we imply 20 percent of change in price of electricity or water costs. Current data shows that the company is currently operating this economically justified level of leakages.
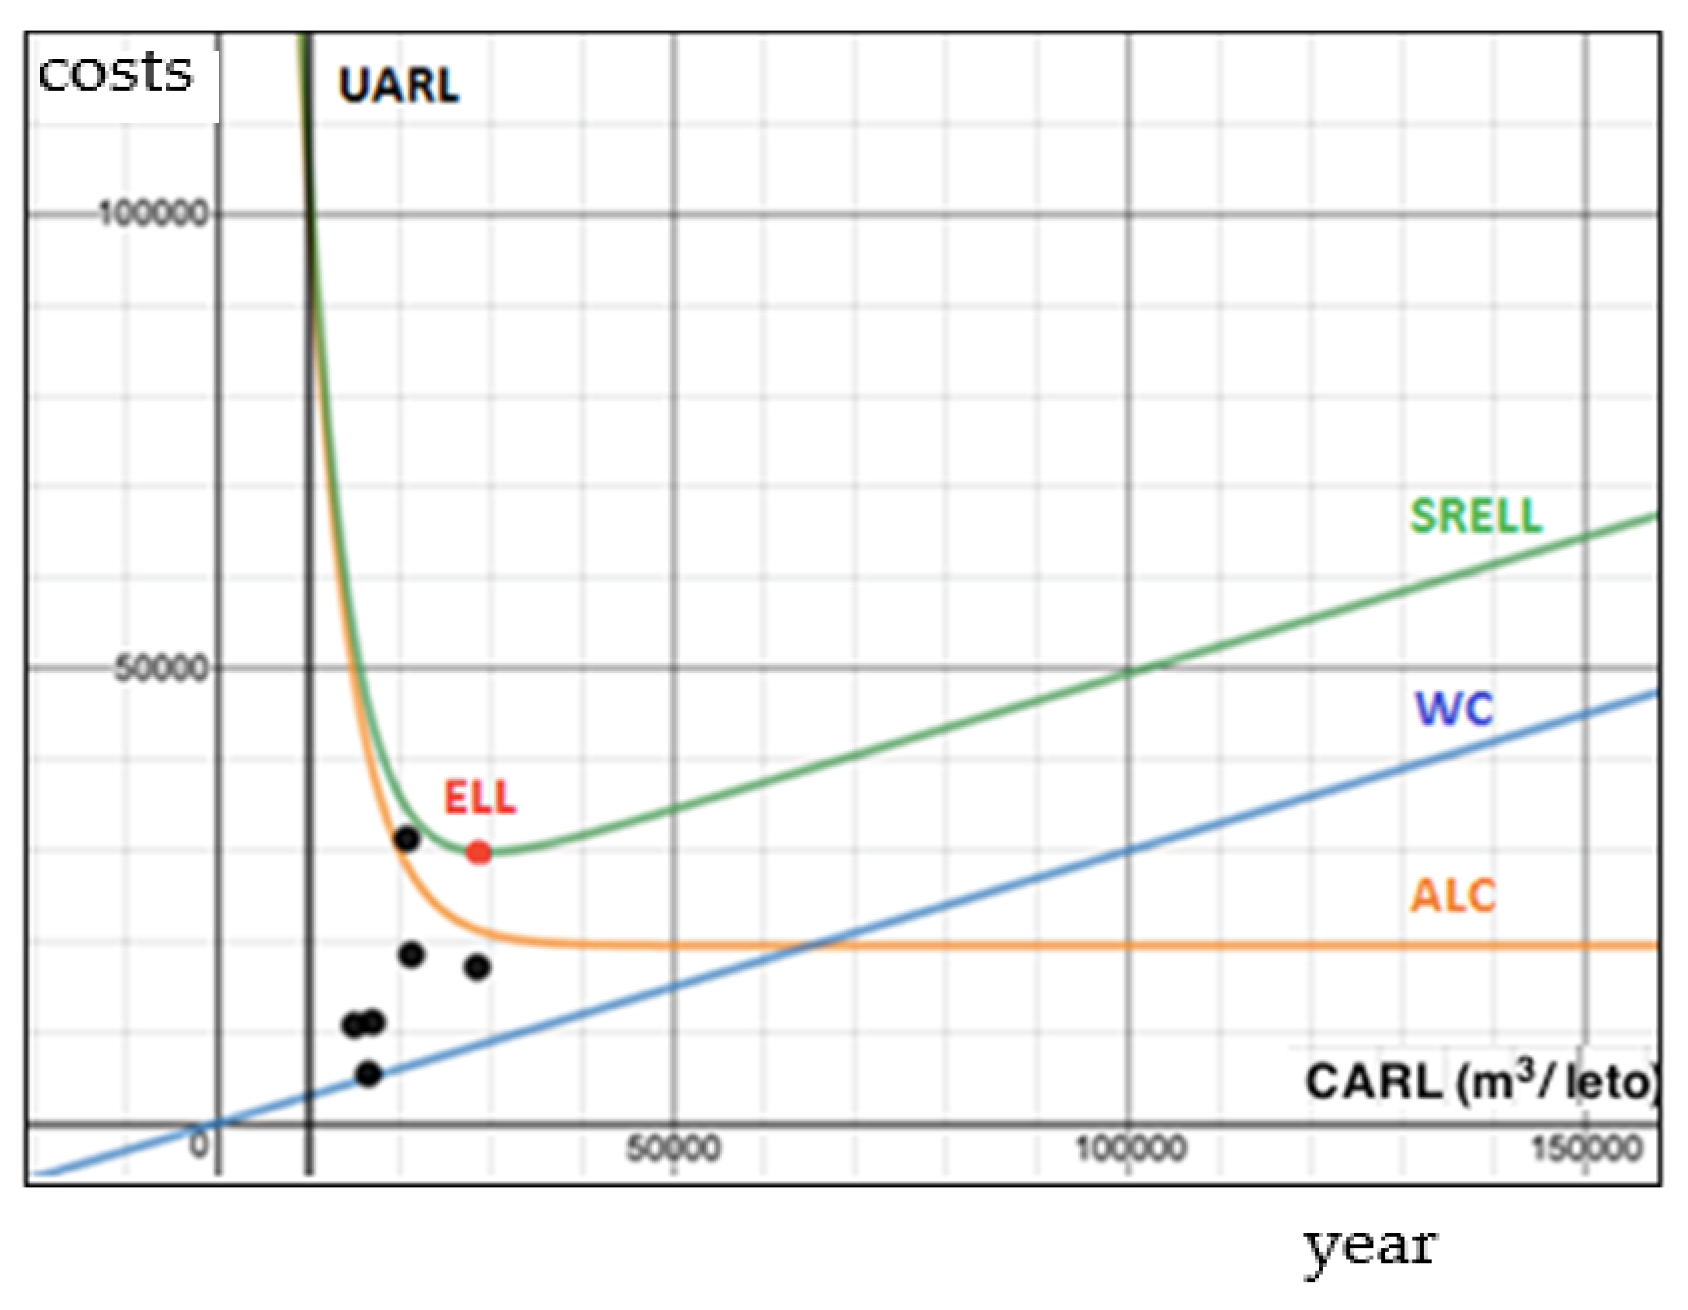
In Pijava Gorica (Figure 3, left picture) CARL varies between 28,852 m3/year and 30,752 m3/year or ILI between 2.66 and 3.05 if we imply 20 percent of change in price of electricity or water costs. Current data shows that the company is currently operating this economically justified level of leakages. In Rakitna it was not possible to calculate ALC as there were only 10 repairs in 5 years under study. ILI factor in 2016 was estimated to 0.3 and as such it raises serious doubts in the measured quality.
Based on the estimation of crucial parameters and actual values of ILI factors, reported in Table 1, we can conclude that VO-KA Company is challenged by decreasing water leakages in the central system while the other three analyzed areas are in line with suggested interval.
5. Conclusions
Reducing water leaks in the distribution networks represents one of the most important issues in water industry around the world as it constitutes waste both of water and energy/carbon. However, there is no system without any leakages. The global average of water loss is 35% of produced water [17]. In France actual losses amounted to 25% on average but in few regions it amounted to more than 50% [5]. As mentioned in introduction, the average leakage from public distribution networks in European countries amount to 20% of water supplies but there is high variability between the states. There are many factors that influence leakage, including age and maintenance levels of the system, the total length of mains, the number of connections, the local topography and resulting hydraulic and pressure characteristics, the soil and climatic conditions, as well as the manner in which water is valued by society [29]. In our paper we estimated parameters of total costs’ functions being related with water costs on one side and costs of repairs on the other. Detailed analysis on firm’s level data in the period of 2011 and 2016 identified that the main challenge is related to the central system of WSS in VO-KA company.
Acknowledgments
This work is elaborated through a project “Po kreativni poti do praktičnega znanja”, co-funded by Ministry of Education, Slovenia. The authors are indebted to Marko Gspan, VO-KA, for valuable comments and Amadeja Lamovšek, David Demšar, Jan Porenta, Jure Mlekuž, Nina Zadnik, Rebeka Rošer and Urša Maček for excellent research assistance.
Conflicts of Interest
The authors declare no conflict of interest.
References
- EEA (European Environment Agency). Territorial Cohesion: Analysis of Environmental Aspects of the EU Cohesion Policy in Selected Countries; EEA Technical Report, No. 10/2009; EEA: Copenhagen, Denmark, 2009. [Google Scholar]
- Egenhofer, C.; Alessi, M.; Teusch, J.; Ferrer, J.N. Which Economic Model for a Water-Efficient Europe? CEPS Task Force Report; CEPS: Brussels, Belgium, 2012. [Google Scholar]
- EPA (Environmental Protection Agency). National Public Water Systems Compliance Report; EPA: Washington, DC, USA, 2013. Available online: https://www.epa.gov/sites/production/files/2015-06/ documents/ sdwacom2013.pdf (accessed on 11 April 2018).
- Pearson, D.; Trow, S.W. Calculating Economic Levels of Leakage. Leakage, Conference Proceedings. 2015. Available online: http://rash.apanela.com/tf/leakage/Calculating%20Economic%20Levels%20of%20Leakage.pdf (accessed on 11 April 2018).
- Garcia, S.; Thomas, A. The Structure of Municipal Water Supply Costs: Application to a Panel French Local Communities. J. Prod. Anal. 2001, 16, 5–31. [Google Scholar] [CrossRef]
- Martins, R.; Coelho, F.; Fortunato, A. Water Losses and Hydrographical Regions Influence on the Cost Structure of the Portuguese Water Industry. J. Prod. Anal. 2012, 38, 81–94. [Google Scholar] [CrossRef]
- Zschille, M.; Walter, M. The Performance of German Water Utilities: A (Semi)-Parametric Analysis. Appl. Econ. 2012, 44, 3749–3764. [Google Scholar] [CrossRef]
- Xu, Q.; Liu, R.; Chen, Q.; Li, R. Review on water leakage control in distribution networks and the associated environmental benefits. J. Environ. Sci. 2014, 26, 955–961. [Google Scholar] [CrossRef]
- Ofwat (Water Services Regulation Authority for England and Wales). Water Supply and Demand Policy; Ofwat: Birmingham, UK, 2008. [Google Scholar]
- DEFRA (Department of Environment, Food and Rural Affairs). Water for Life; HM Government: London, UK, 2011. [Google Scholar]
- Wu, Z.Y.; Farley, M.; Turtle, D.; Kapelan, Z.; Boxall, J.; Mounce, S.; Dahasahasra, S.; Mulay, M.; Kleiner, Y. Water Loss Reduction, 1st ed.; Bentley Institute Press: Exton, PA, USA, 2011. [Google Scholar]
- Al-Washali, T.; Sharma, S.; Kennedy, M. Methods of Assessment of Water Losses in Water Supply Systems: A Review. Water Res. Manag. 2016, 30, 4985–5001. [Google Scholar] [CrossRef]
- Claudio, K.; Couallier, V.; Leclerc, C.; Gat, Y.L.; Saracco, J. Consumption estimation with a partial automativ meter reading deployment. Water Sci. Technol. Water Supply 2015, 15, 50–58. [Google Scholar] [CrossRef]
- Mutikanga, H. Water Loss Management: Tools and Methods for Developing Countries. Ph.D. Dissertation, Delft University of Technology and UNESCO–IHE: Delft, The Netherlands, 2012. [Google Scholar]
- AWWA (American Water Works Association). Manual of Water Supply Practices; AWWA: Denver, CO, USA, 2009. [Google Scholar]
- Criminisi, A.; Fontanazza, C.M.; Freni, G.; La Loggia, G. Evaluation of the Apparent Losses Caused by Water Meter Under-Registration in Intermittent Water Supply. Water Sci. Technol. 2009, 6, 2371–2382. [Google Scholar] [CrossRef] [PubMed]
- Farley, M.; Wyeth, G.; Ghazali, Z.; Istandar, A.; Singh, S. The Manager’s Non-Revenue Water Handbook: A Guide to Understanding Water Losses; United States Agency for International Developing and Ranhill Utilities: Washington, DC, USA, 2008. [Google Scholar]
- Thornton, J.; Sturm, R.; Kunkel, G. Water Loss Control Manual; The McGraw Hill: New York, NY, USA, 2008. [Google Scholar]
- Seago, C.; Bhagwan, J.; McKenzie, R. Benchmarking Leakage from Water Reticulation Systems in South Africa. Water SA 2004, 30, 25–32. [Google Scholar] [CrossRef]
- Lambert, A.; Charalambous, B.; Fantozzi, M.; Kovac, J.; Rizzo, A.; St John, S.G. 14 years’ experience of using IWA best practice water balance and water loss performance indicators in Europe. In Proceedings of the IWA Specialized Conference (Water Loss 2014), Vienna, Austria, 20 March–2 April 2014. [Google Scholar]
- Kingdom, B.; Liemberger, R.; Marin, P. The Challenge of Reducing Non-Revenue Water in Developing Countries: How the Private Sector Can Help: A Look at Performance-Based Service Contracting; Water Supply and Sanitation Sector Board Discussion Paper, Series Paper No. 8; The World Bank Group: Washington, DC, USA, 2006. [Google Scholar]
- Dore, M.H.I.; Kushner, J.; Zumer, K. Privatization of water in the UK and France: What can we learn? Util. Policy 2004, 12, 41–50. [Google Scholar] [CrossRef]
- Cavaliere, A.; Maggi, M.; Stroffolini, F. Water losses and optimal network investments: Price regulation effects with municipalization and privatization. Water Res. Econ. 2017, 18, 1–19. [Google Scholar] [CrossRef]
- Kanakoudis, V.; Gonelas, K. Non-revenue water reduction through pressure management in Kozani’s water distribution network: From theory to practice. Desalin. Water Treat. 2016, 57, 11436–11446. [Google Scholar] [CrossRef]
- Kanakoudis, V.; Gonelas, K. Applying pressure management to reduce water losses in two Greek cities’ Water Distribution Systems: Expectations, problems, results and revisions. Procedia Eng. 2014, 89, 318–325. [Google Scholar] [CrossRef]
- Kanakoudis, V.; Gonelas, K. The joint effect of water price changes and pressure management, at the economic annual real losses level, on the system input volume of a water distribution system. Water Sci. Technol. Water Supply 2015, 15, 1069–1078. [Google Scholar] [CrossRef]
- Kanakoudis, V.; Gonelas, K. Assessing the results of a virtual pressure management project applied in Kos Town water distribution network. Desalin. Water Treat. 2016, 57, 11472–11483. [Google Scholar] [CrossRef]
- Kanakoudis, V.; Gonelas, K. Reaching Economic Leakage Level through Pressure Management. Water Sci. Technol. Water Supply 2016, 16, 756–765. [Google Scholar]
- EUREAU (European Union of National Associations of Water Suppliers and Waste Water Services). Leakage Reduction in Addressing Water Scarcity and Drought; Position Paper; EUREAU: Brussels, Belgium, 2011; Available online: http://www.eureau.org/administrator/components/com_europublication/pdf /512529ce328a156bbc74af3a4ec269cf-2011.06.15_EAREAU_PP_Leakage.pdf (accessed on 11 April 2018).
Figure 1.
Drinking water supply system operated by VO-KA.

Figure 2.
Parameters of short term economic losses in VO-KA company (central system in left, Pijava Gorica in the right picture). Source: Calculation based on company’s data.
Figure 2.
Parameters of short term economic losses in VO-KA company (central system in left, Pijava Gorica in the right picture). Source: Calculation based on company’s data.

Figure 3.
Parameters of short term economic losses in VO-KA company (Lipoglav). Source: Calculation based on company’s data.
Figure 3.
Parameters of short term economic losses in VO-KA company (Lipoglav). Source: Calculation based on company’s data.


Table 1.
Comparison of ILI factors in the period of 2011–2016.
| Area | 2011 | 2012 | 2013 | 2014 | 2015 | 2016 | Suggested Interval |
|---|---|---|---|---|---|---|---|
| Central system | 10.9 | 8.8 | 8.4 | 7.8 | 7.6 | 6.9 | 5.39–6.33 |
| Lipoglav | NA | 1.2 | 1.6 | 1.2 | 1.7 | 2.8 | 2.66–3.05 |
| Pijava Gorica | NA | 3.6 | 4.2 | 3.7 | 3.9 | 3.5 | 3.68–4.07 |
| Rakitna | NA | 0.7 | 0.7 | 0.6 | 0.6 | 0.3 | NA |
Publisher’s Note: MDPI stays neutral with regard to jurisdictional claims in published maps and institutional affiliations. |
© 2018 by the authors. Licensee MDPI, Basel, Switzerland. This article is an open access article distributed under the terms and conditions of the Creative Commons Attribution (CC BY) license (https://creativecommons.org/licenses/by/4.0/).
Share and Cite
MDPI and ACS Style
Banovec, P.; Domadenik, P. Defining Economic Level of Losses in Shadow: Identification of Parameters and Optimization Framework. Proceedings 2018, 2, 599. https://doi.org/10.3390/proceedings2110599
AMA Style
Banovec P, Domadenik P. Defining Economic Level of Losses in Shadow: Identification of Parameters and Optimization Framework. Proceedings. 2018; 2(11):599. https://doi.org/10.3390/proceedings2110599
Chicago/Turabian StyleBanovec, Primož, and Polona Domadenik. 2018. "Defining Economic Level of Losses in Shadow: Identification of Parameters and Optimization Framework" Proceedings 2, no. 11: 599. https://doi.org/10.3390/proceedings2110599