Inspired by the Atmosphere. See the Invisible †


School of Architecture and Design “Eduardo Vittoria”, University of Camerino, 62032 Camerino, Italy
*
Author to whom correspondence should be addressed.
†
Presented at the International and Interdisciplinary Conference IMMAGINI? Image and Imagination between representation, communication, education and psychology, Brixen, Italy, 27‒28 November 2017.
Proceedings 2017, 1(9), 906; https://doi.org/10.3390/proceedings1090906
Published: 24 November 2017
(This article belongs to the Proceedings of Proceedings of the International and Interdisciplinary Conference IMMAGINI? Brixen, Italy, 27–28 November 2017.)
Abstract
:This paper is proposed to investigate procedures which can deal with graphic formalize of numeric data relating to climatic and environmental conditions. In a scientific domain characterised by prevalence of mathematical models and statistical surveys, the possibility of making images as such becomes an additional tool for morphological research of architectural solutions influenced by environmental conditions. This methodology, along with new augmented reality technology, actually, promotes new way of dealing with the project immediately highlighting defects and weaknesses: as architectural pre-visualization has always been the architect’s domain, today, pre-visualization of environmental data becomes a useful tool for design.
1. Introduction
This paper is proposed to investigate procedures which can deal with graphic formalize of numeric data relating to climatic and environmental conditions. In a scientific domain characterised by prevalence of mathematical models and statistical surveys, the possibility of making images as such becomes an additional tool for morphological research of architectural solutions influenced by environmental conditions in the urban context.
Inspired by the atmosphere is a procedural protocol for the definition of a meta-project based on atmospheric force: solar radiation and the wind field; it does not provide the architects with definitive solutions, but recommendations for rapid conscious design.
The protocol develops and displays multiple solutions arranged in an orderly list based on the energy balance. The best solution cannot consider all the important aspects for the architect, who has to critically analyse all the results before the design process.
In the past architects and men of science, as Yona Fridman, Nicholas Negroponte, Thomas Maver, Robin Th’ng e Malcolm Davies [1,2,3,4,5,6] had get the potential that technology provided and have been conducting experiments to answer questions about conscious design: despite the obvious limitations that computers had in the past century, pioneers have been able to develop software that can generate different spatial configurations and estimate energy consumption by providing numerical reference values.
Given the high level of abstraction, this kind of information could only be understood by mathematicians who could interpret them.
The evolution of today’s computing and hardware models allow us to carry out this experiment by pushing beyond the raw numerical data to generate images that reveal the hidden aspects of the project.
In recent years, environmental issues have become increasingly crucial in the architectural design process, conditioning it to such an extent as to being a fundamental part of architectural research: “It is shifting from metric design to thermal design, from structural thinking to climate-oriented thinking, from narrative thought processes to meteorological thought processes”.
Philippe Rahm, in these words encapsulates the essence of this way of designing. Who taken up this philosophy usually use very sophisticated tools that still produce numbers and graphics but are manually reinterpreted in images only in the final stages of design to explain the design choices adopted.
The opportunity to see with eyes data and urban statistics that they usually are difficult to communication, opens up to us a new scenario in which, through the image created by those same numbers, we can address the proper design already in the preliminary phase.
2. Concept
From the beginning the idea was to provide designers with a tool that could display a set of information on the climatic aspects of the site and energy aspects of the building considering the weather conditions and the effects of local climate change: although the impacts of climate change are certainly global, its manifestations and consequences begin locally. Architectural design is becoming an increasingly complex process that has to take into account a multitude of aspects and often the less visible aspects in the preliminary stages are related to energy: the challenge was to bring out these energy aspects and visualize them in such a way to be aware of them.
This tool interfaces with the user through a hardware part consisting of: a camera that will read the position of some markers, and a viewer (a compatible Google cardboard), and a PC running the software developed in the Grasshopper development environment [7].
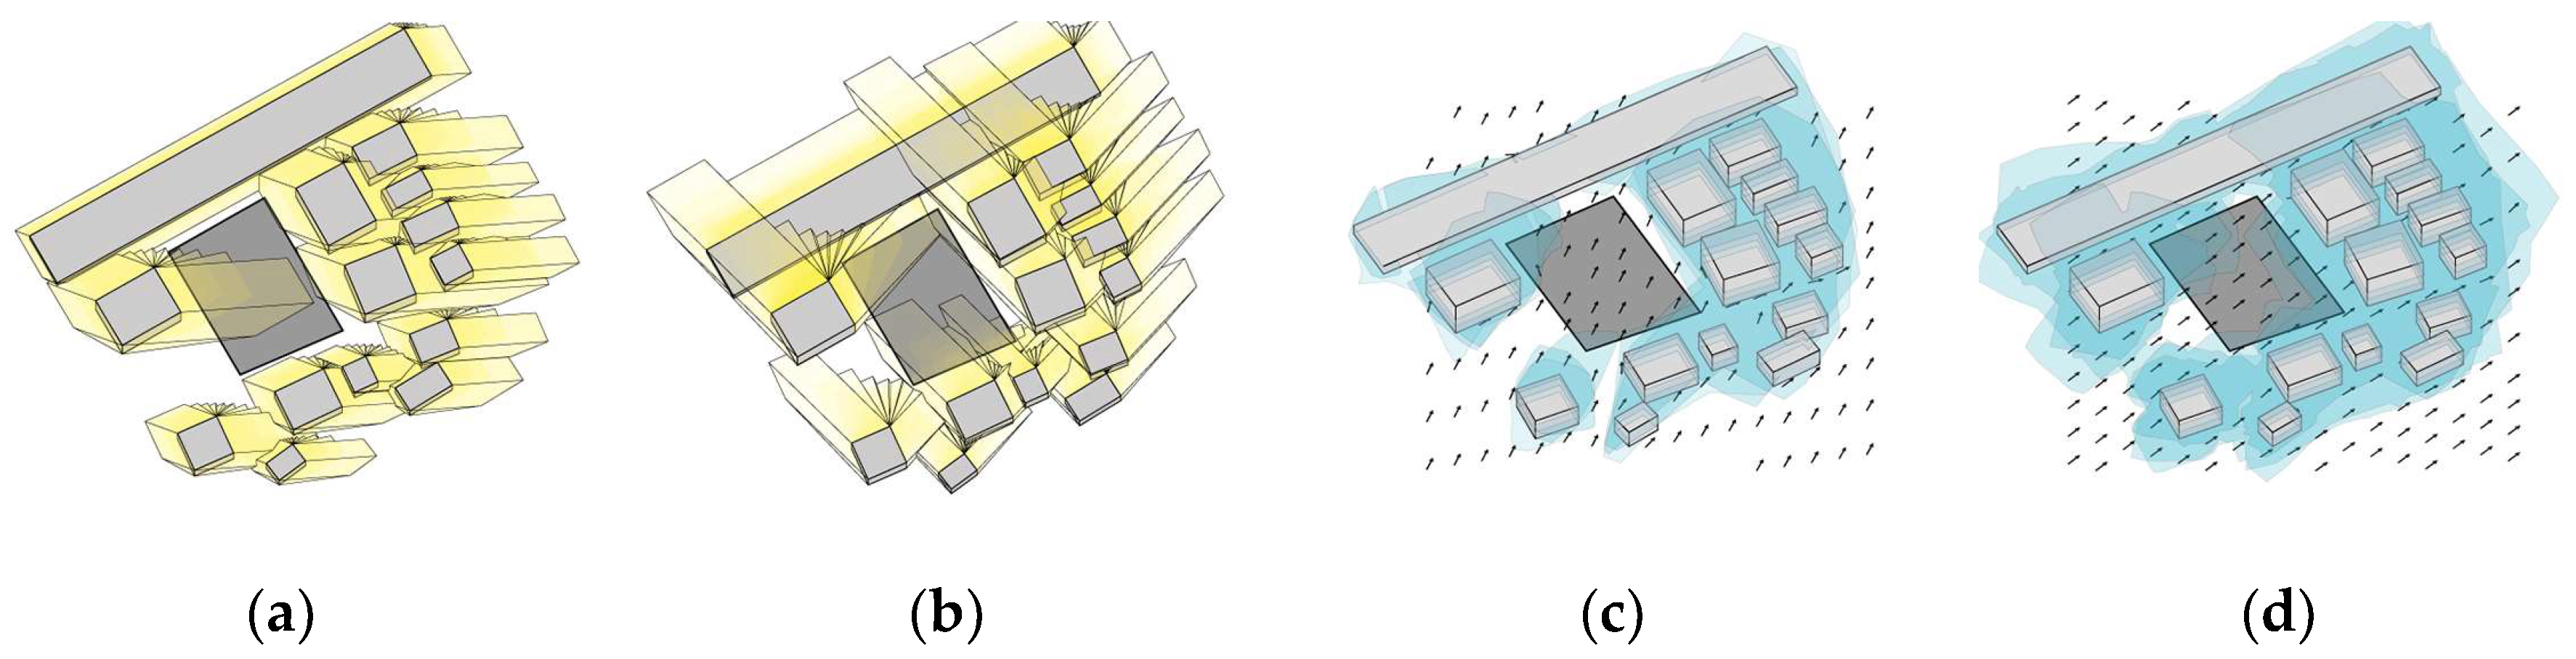
The use of this tool offers the user, step by step, the vision of different information we can identify in two layers: the first is the representation of the atmospheric data by highlighting how the sun and the fluid operate in relation to the context and the second is the representation of a suggestion to start designing as Figure 1; This reference then provides useful information for the conscious definition of the initial concept.
3. Looking Back
In the second half of the last century several architects and men of science have experienced the interaction between man and machine to obtain primordial schematic results which are, however, rich in meaning; They did not have large computing resources, and it was easier for them to report numerically the results of their calculations: in their work did not emerge the role of the image as that the role of the imagination.
3.1. First Attempts of Automated Morphogenesis of Architecture
Among the earliest, in 1967, architect Yona Friedman believed that through a computer, any individual have could design the ideal plan of their home; she had conceived the concept for a program called “Flatwriter” in which, through simple numeric/textual input, it could return a simplified scheme of what could be the plan of the apartment. The software was subsequently developed in 1973 at the Massachusetts Institute of Technology (MIT) in Cambridge calling it “YONA”.
In those years, Nicholas Negroponte and his research team (Architecture Machine Group) were also designing software that allowed users to create their own projects, it was inspired by Friedman’s ideas. The program was based on the same graphic theory conceived by Friedman, but diversified from how this interacts with the user. Unlike the first one that produced a rational iteration, Negroponte proposes a fluid and perceptual dialogue: the user was required to draw a plan with his own pen; through special algorithms, the drawing was interpreted, schematized and redrafted by the machine, which proposed to the user its revision [1].
In view of this, in our case, in order to make the user’s experience more “fluid”, the user can manually move the position of the buildings and the context on a prepared maquette: a camera can read movements and interpret the result directly by showing it the augmented reality on the maquette.
3.2. From Simple Generation of Forms to Energy Optimization
One of the first experiments to remember about energy analysis tools is P.A.C.E. (Package for Architectural Computer Evaluation) developed in 1970 by Thomas Maver at the University of Strathclyde (Glasgow) within the ABACUS group.
It was defined as “an assessment system for the energy assessment of the architectural project”: unlike other instruments, it considered and optimized a wide set of parameters; it measured room management costs by optimizing building shape ratios over these [2,5].
Reporting each cost optimization calculation, P.A.C.E., unfortunately it was designed to return only numeric and graphical tables.
In the years to come, architects Robin Th’ng and Malcolm Davies, also researchers within ABACUS, developed a tool called S.P.AC.E.S. which based the results of their own optimizations on schematic layouts, which were then proposed to the user by accosting drawing graphic elements near numbers: in this case the output was not only numeric but also visual with an image formed by simple rectangles to schematize the building [2,6].
4. The Idea That Moves the Project: The Latent Image
Always design means having the ability to imagine a different reality, pushing beyond the actual reality, knowing how to improve it and the project is the result of this vision. Designing an architecture is an act that will have to be exposed to the buyer who will appreciate the effort that, from the very beginning, will focus on the representation of the project idea: of course, in addition to the quality of the project, so that it can convince the client, it must be represented in the clearest possible way. Over time (although the tools and the computer technology at the disposal of designers for the presentation of their ideas have become increasingly sophisticated by providing synthetic images capable not only of telling the project but of carrying the individual within it) the free handheld design on simple paper has been and will be the quickest tool to communicate.
“The most important thing in an architect’s work is to give an idea: an idea that demonstrates a certain superiority over the sketch just poured out of him, or the annotation taken accidentally. The architecture arises from an image, a precise image that has fallen deep down inside us and that translates, exactly in drawing, in construction. The most important moment is really the idea of architecture. Only when you have this idea you can begin to draw it and consequently to perfect it.” [8]. Like this Aldo Rossi described the primordial gesture of imprinting the idea on a sheet.
Inspired by the atmosphere does not want to replace the designer and his intuition, but he wants to accompany this exactly as the pioneers made with simple schematic geometries.
Maurizio Unali explains how contemporary virtuality is strengthened and reinvented by computer science and is not an escape from reality, but must be read as an enhancement to it: “Virtual, in this context, means above all “broadening the vision”. Even in terms of habitable architectural space, there are no contrasts between the so-called real space and digital space, but simply field extensions and sense hybridization. In this context, the system used of augmented reality is matched well with these concepts because it enhances the user experience by making apparent through animated snapshots of hidden reality through snapshots.
The creativity and the experience that architects can get from contemporary virtualization is, therefore, first of all the amplification of the vision and perception of the “real world look”. Magnification amplification, sometimes unexpected and alternate, of “invisible” information in our eyes but present in the DNA of real things” [9]. In this context, the system used of augmented reality is matched well with these concepts because it enhances the user experience by making apparent through animated snapshots of hidden reality through snapshots.
5. The Importance of Real-Time Graphical Output
Nowadays, the quality and quantity of digital simulation opportunities for performance research mean that these represent an important technological foundation for performative architecture. The analytical calculation techniques based on the finite volume method in which the geometric model is discretized in small, uniform and interconnected mass volumes are able to give the simulation result accurately. Managing this calculation becomes more and more complicated and the software tries to process graphic output as well as numeric. These graphical interpretations often arrive only in the advanced stage of design to verify performance, risking to overturn the designer’s expectations.
As Kristina Shea explained: “generating new forms while also having instantaneous feedback on their performance from different perspectives (space usage, structural, thermal, lighting, fabrication, etc.) would not only spark the imagination in terms of deriving new forms, but guide it towards forms that reflect rather than contradict real design constraints”. As a structural engineer, she taken as example traditional techniques for designing membrane structures (of which Frei Otto was a pioneer) as the closest example of generating performance-driven architectural forms: the shape of the membrane is dynamically influenced by the forces change that they act on the model. She observes that the techniques of research in structural engineering forms are generally limited to pure compression or pure tension structures, and it promotes the need to develop digital tools that can generate mixed structural forms [5].
In the same way our work focused on the search for a tool that reconciled the architectural needs with the atmospheric variables.
6. The Method
In our method, architectural analysis is performed with a parametric 3D algorithm divided into three main parts: input, calculation and output. All initial information about the specific geolocation of the collected project is put into system: the algorithm studies all the atmospheric parameters and finds multiple solutions of forms according to the given input. The generated 3D model is analyzed using non-stationary energy software (EnergyPlus 8.6) and all openings and other geometric properties of the building are modified and optimized [10] using Grasshopper to obtain the best energy balance solution [11].
Much importance has been given to the user’s experience that, in addition to the classic screen interface, can take advantage of the viewer to build and display a virtual maquette. Thanks to a camera placed above the work plane, each user-made shift in the composition of some planar markers will be automatically mapped and will feature the virtual maquette. From the first studies conducted in the sixties of the last century by Ivan Sutherland, modern society has come into contact with the technologies of virtual reality and augmented reality; Several decades later, thanks to the miniaturization of the technology, it was possible to use smaller and smaller viewers to use a common smartphone as a viewer.
The actions required by the user are simple and are explained in detail: Firstly, markers must be arranged that define the position and orientation of the context volumes and may represent buildings or screening of various nature; then a set of initial parameters (referring to geometries and other contour conditions) will have to be set up and you will immediately receive a screen feedback and one in the viewer where you can see the virtual model grow and modify. Once this first pass has been completed, the calculation of irradiated zones and wind-exposed areas begins; the architect will see the results on the screen (and consequently in the viewer) on the screen, which he can then navigate and filter according to the data concerned.
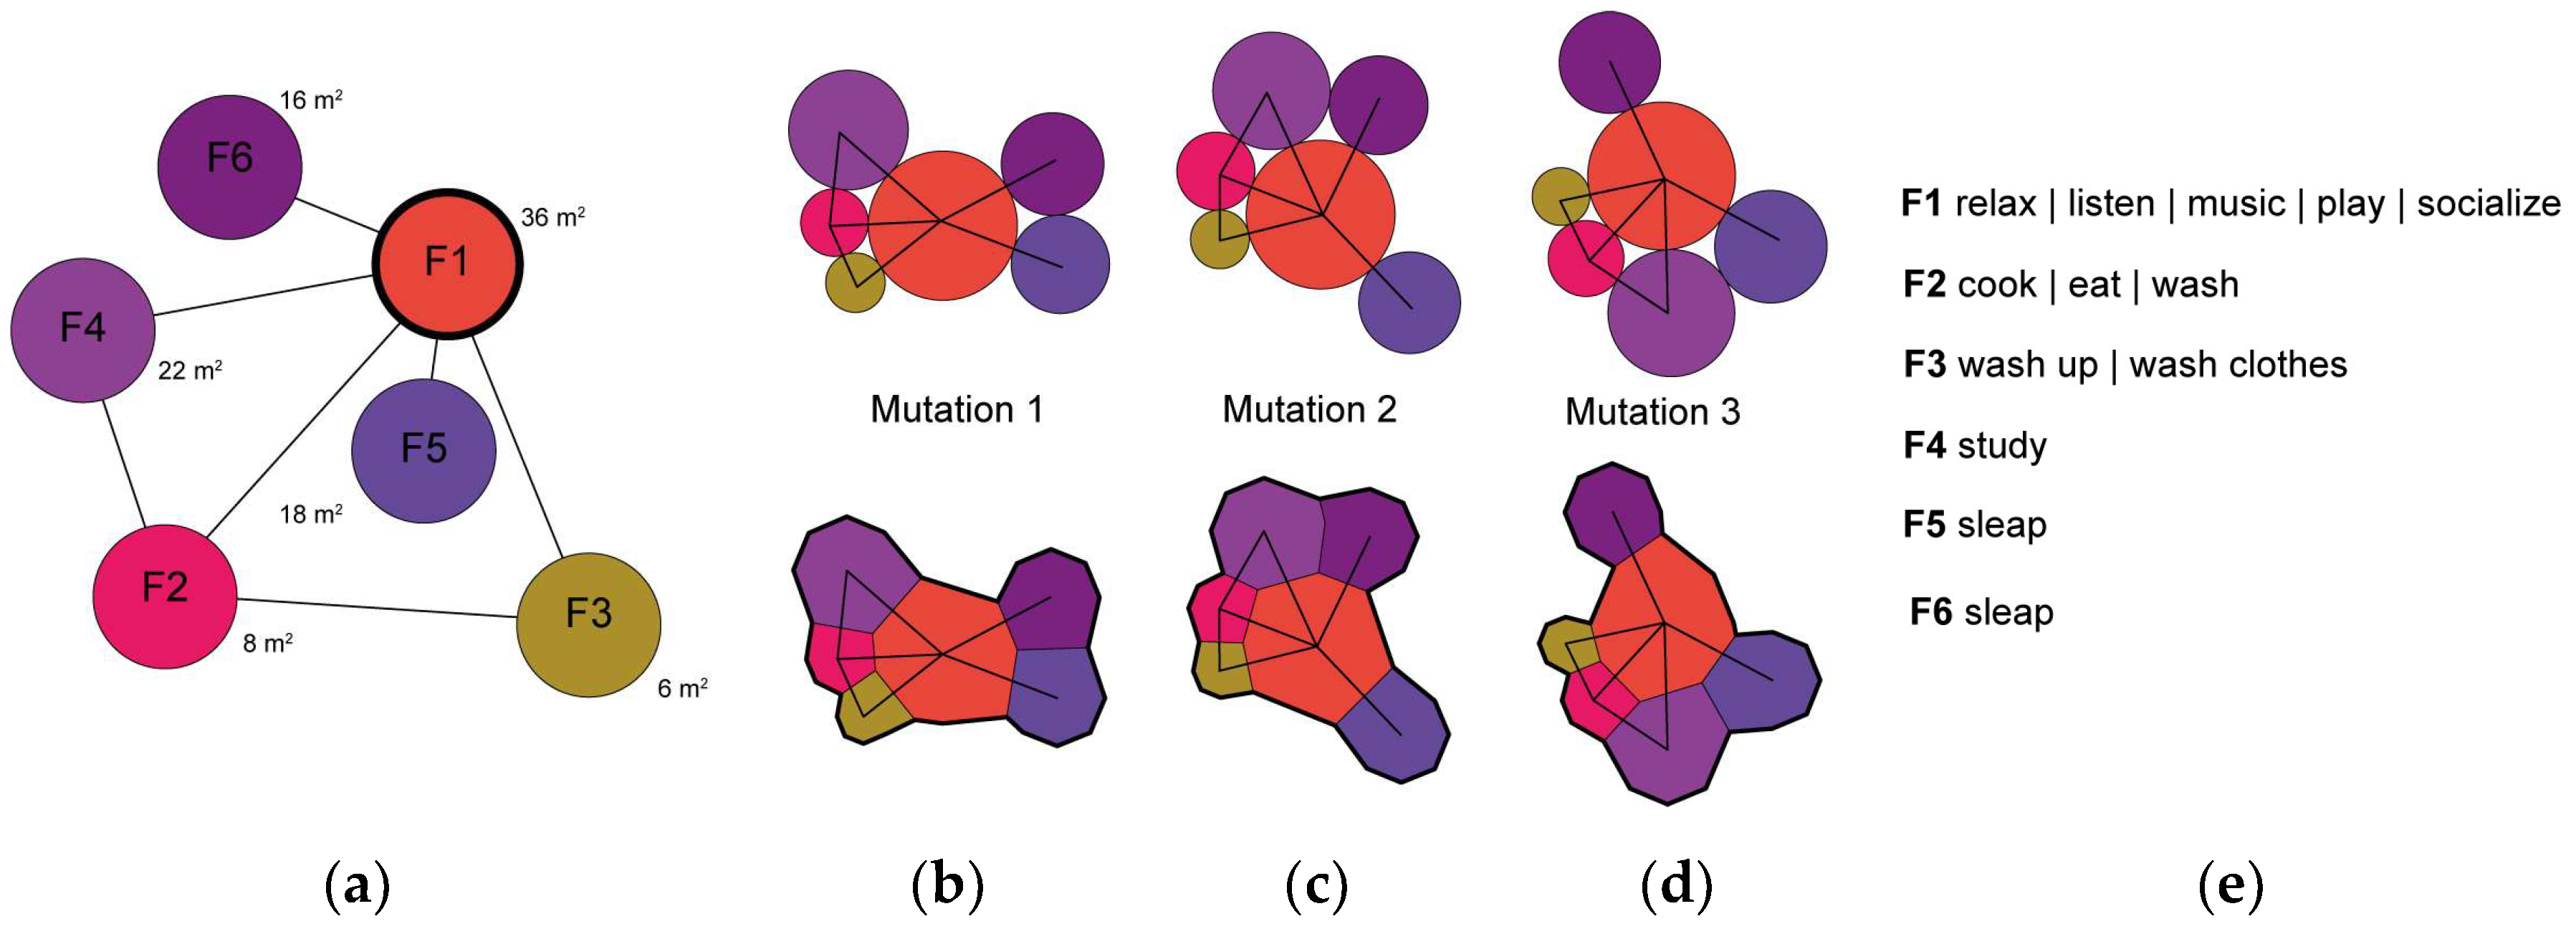
At this stage, to recreate the closest reality condition, you can move the markers. This will lead to the recalculation of microclimatic effects that will be immediately visible to the architect. The second phase involves the insertion of the dimensional-functional characteristics of the architecture that you want to build: it will be required to define a number of functions that will have to be carried out within the building, how much space it will have to be dedicated to these relationships spatial linkages and the preferential orientation of one for each level of the building as Figure 2. The algorithm, acquired this information, generates a rose of cases by positioning the different “mutations” both in exposed parts of the sun and wind, and where they are absent As Figure 3; optimization based on energy balance assessment, for each mutation, will handle the position and amount of openings as Figure 4.
Even the results of this last calculation can be displayed and filtered on screen rather than navigated in augmented reality mode.
7. The Visual Experience of the User
The tool proposed in this article is born with the will to be able to “talk” with the machine as smoothly as possible by describing the objects in the scene as volumes placed on the work surface.
Essential, for the realization of the whole, was the use of a visual programming and parametric modeling tool such as Grasshopper. This approach is increasingly being used to solve complex problems because it allows direct and mutable controlled workflow [12]. In this is possible to manage communication between our software and other third-party software (i.e., Energyplus) on the same platform communicating, simultaneously, with the cardboard viewer, which is disconnected from the other equipment, allowing the user a personalized 360° experience into the virtual space.
7.1. Images in Input Steps
By positioning the markers describing the bullet volumes, the composition of the scene is gradually growing. Each object is described in a different color so that it can be easily distinguished both in the cardboard viewer and the screen as Figure 5. As a preliminary tool, a very simple graphic design has been chosen that cannot “overwrite” the user’s vision.
7.2. Images in Output Steps
Completed the first step of context composition is being proposed to the user the first result which is the location of shadows and wind calm areas. These two atmospheric forces are graphed clearly outlining a more complete view of the scenario as Figure 6.
In the next step, after the user has described the architectural features of the building and the calculation phase also ended, the user can choose between the different morphological results which originate from the initial logic schemes [13]. These patterns are then turned into metaball geometries (it is impossible to define them as “architecture”) and they will have to be interpreted:
- orientation of rooms;
- the amount of openings;
- the overhang of a level compared to the previous one.
8. Conclusions
“Inspired by the atmosphere” is a protocol that allows you to consider the energy and environmental aspects from the initial phase of the architectural project.
If the tips and suggestions provided at this stage are properly observed, energy-efficient buildings can be obtained. The potential of this approach also does not end with the realization of a single building: it is possible to extend it to aggregate multiple buildings in order to generate urban agglomerations in which you can control the levels of used energy and comfort or solving the problem of energy renewal of the environmental recovery of existing real estate assets by, for example, studying envelopes optimized and visually evaluated even in immersive mode.
This methodology, along with new augmented reality technology, actually, promotes new way of dealing with the project immediately highlighting defects and weaknesses: as architectural pre-visualization has always been the architect’s domain, today, pre-visualization of environmental data becomes a useful tool for design.
Author Contributions
D.R. and R.C.G. verified the analytical methods and supervised the findings of this work. G.M. wrote the chapter 6, M.R. wrote the chapter 7. G.M. and M.R. conceived the original idea. All authors discussed the results and contributed to the final manuscript.
Conflicts of Interest
The authors declare no conflict of interest
References
- Bihanic, D. Empowering Users through Design: Interdisciplinary Studies and Combined Approaches for Technological Products and Services, 1st ed.; Springer International Publishing: Cham, Switzerland, 2015; pp. 28–32. ISBN 978-3-319-13017-0. [Google Scholar]
- Cross, N.B. L’architetto automatizzato, 3rd ed.; Liguori Editore: Napoli, Italia, 1985; ISBN 9788820711719. [Google Scholar]
- Negroponte, N. The Architecture Machine: Toward a More Human Environment, 1st ed.; The MIT Press: Cambridge, MA, USA, 1973; ISBN 13: 9780262640107. [Google Scholar]
- Negroponte, N. Soft Architecture Machines, 1st ed.; The MIT Press: Cambridge, MA, USA, 1976; ISBN 13: 9780262140188. [Google Scholar]
- Kolarevic, B.; Malkawi, A. Performative Architecture: Beyond Instrumentality, 1st ed.; Spon Press: New York, NY, USA; London, UK, 2005; ISBN 13: 978-0415700832. [Google Scholar]
- Th’ng, R.; Davies, M. SPACES: An integrated suite of computer programs for accommodation scheduling, layout generation and appraisal of schools. Comput.-Aided Des. 1975, 7, 112–118. [Google Scholar] [CrossRef]
- Grasshopper 3d. Available online: http://ww-w. grasshopper3d.com (accessed on 1 September 2017).
- Faroldi, E.; Vettori, M.P. Dialoghi di Architettura, 2nd ed.; Alinea Editrice: Firenze, Italia, 2004; pp. 115–116. ISBN 88-8125-816-1. [Google Scholar]
- Unali, M. Altlante Dell’abitare Virtuale: Il Disegno Della Città Virtuale, fra Ricerca e Didattica; Gangemi Editore: Roma, Italy, 2014; p. 30. ISBN 978-88-492-7829-3. [Google Scholar]
- Rutten, D. Evolutionary Principles applied to Problem Solving. In Proceedings of the AAG10 Conference, Vienna, Austria, 21 September 2010. [Google Scholar]
- Roudsari, M.S.; Pak, M. Ladybug: A parametric environmental plugin for grasshopper to help designers create an environmentally-conscious design. In Proceedings of the BS 2013: 13th Conference of the International Building Performance Simulation Association, Le Bourget Du Lac, France, 25–30 August 2013. [Google Scholar]
- Khabazi, Z. Generative Algorithms (Using Grasshopper).
- Available online:. Available online: http://morphogenesism.com/wp/generative-algorithms (accessed on 1 September 2017).
- Nourian, P.; Rezvani, S.; Sariyildiz, S. Syntactic architectural design methodology: Integrating real-time space syntax analysis in a configurative architectural design process. In Proceedings of the Ninth International Space Syntax Symposium, Seoul, Korea, 31 October–3 November 2013. [Google Scholar]
Figure 1.
View atmospheric forts: (a) Shadows in summer time scenario; (b) Shadows in winter time scenario; (c) Wind field in summer time scenario; (d) Wind field in winter time scenario.
Figure 1.
View atmospheric forts: (a) Shadows in summer time scenario; (b) Shadows in winter time scenario; (c) Wind field in summer time scenario; (d) Wind field in winter time scenario.

Figure 2.
The example of variation keeping the same logical scheme: (a) The logical scheme; (b) First mutation; (c) Second mutation; (d) Third mutation; (e) The list of function.
Figure 2.
The example of variation keeping the same logical scheme: (a) The logical scheme; (b) First mutation; (c) Second mutation; (d) Third mutation; (e) The list of function.

Figure 3.
An example of positioning in the wind calm zone: (a) First floor; (b) Second floor; (c) Third floor; (d) The composition of all levels.
Figure 3.
An example of positioning in the wind calm zone: (a) First floor; (b) Second floor; (c) Third floor; (d) The composition of all levels.

Figure 4.
The energy balance result. Each solution matches a score: (a) First case with a score of 5.5; (b) T First case with a score of 10; (c) First case with a score of 9.3; (d) First case with a score of 9.9.
Figure 4.
The energy balance result. Each solution matches a score: (a) First case with a score of 5.5; (b) T First case with a score of 10; (c) First case with a score of 9.3; (d) First case with a score of 9.9.

Figure 5.
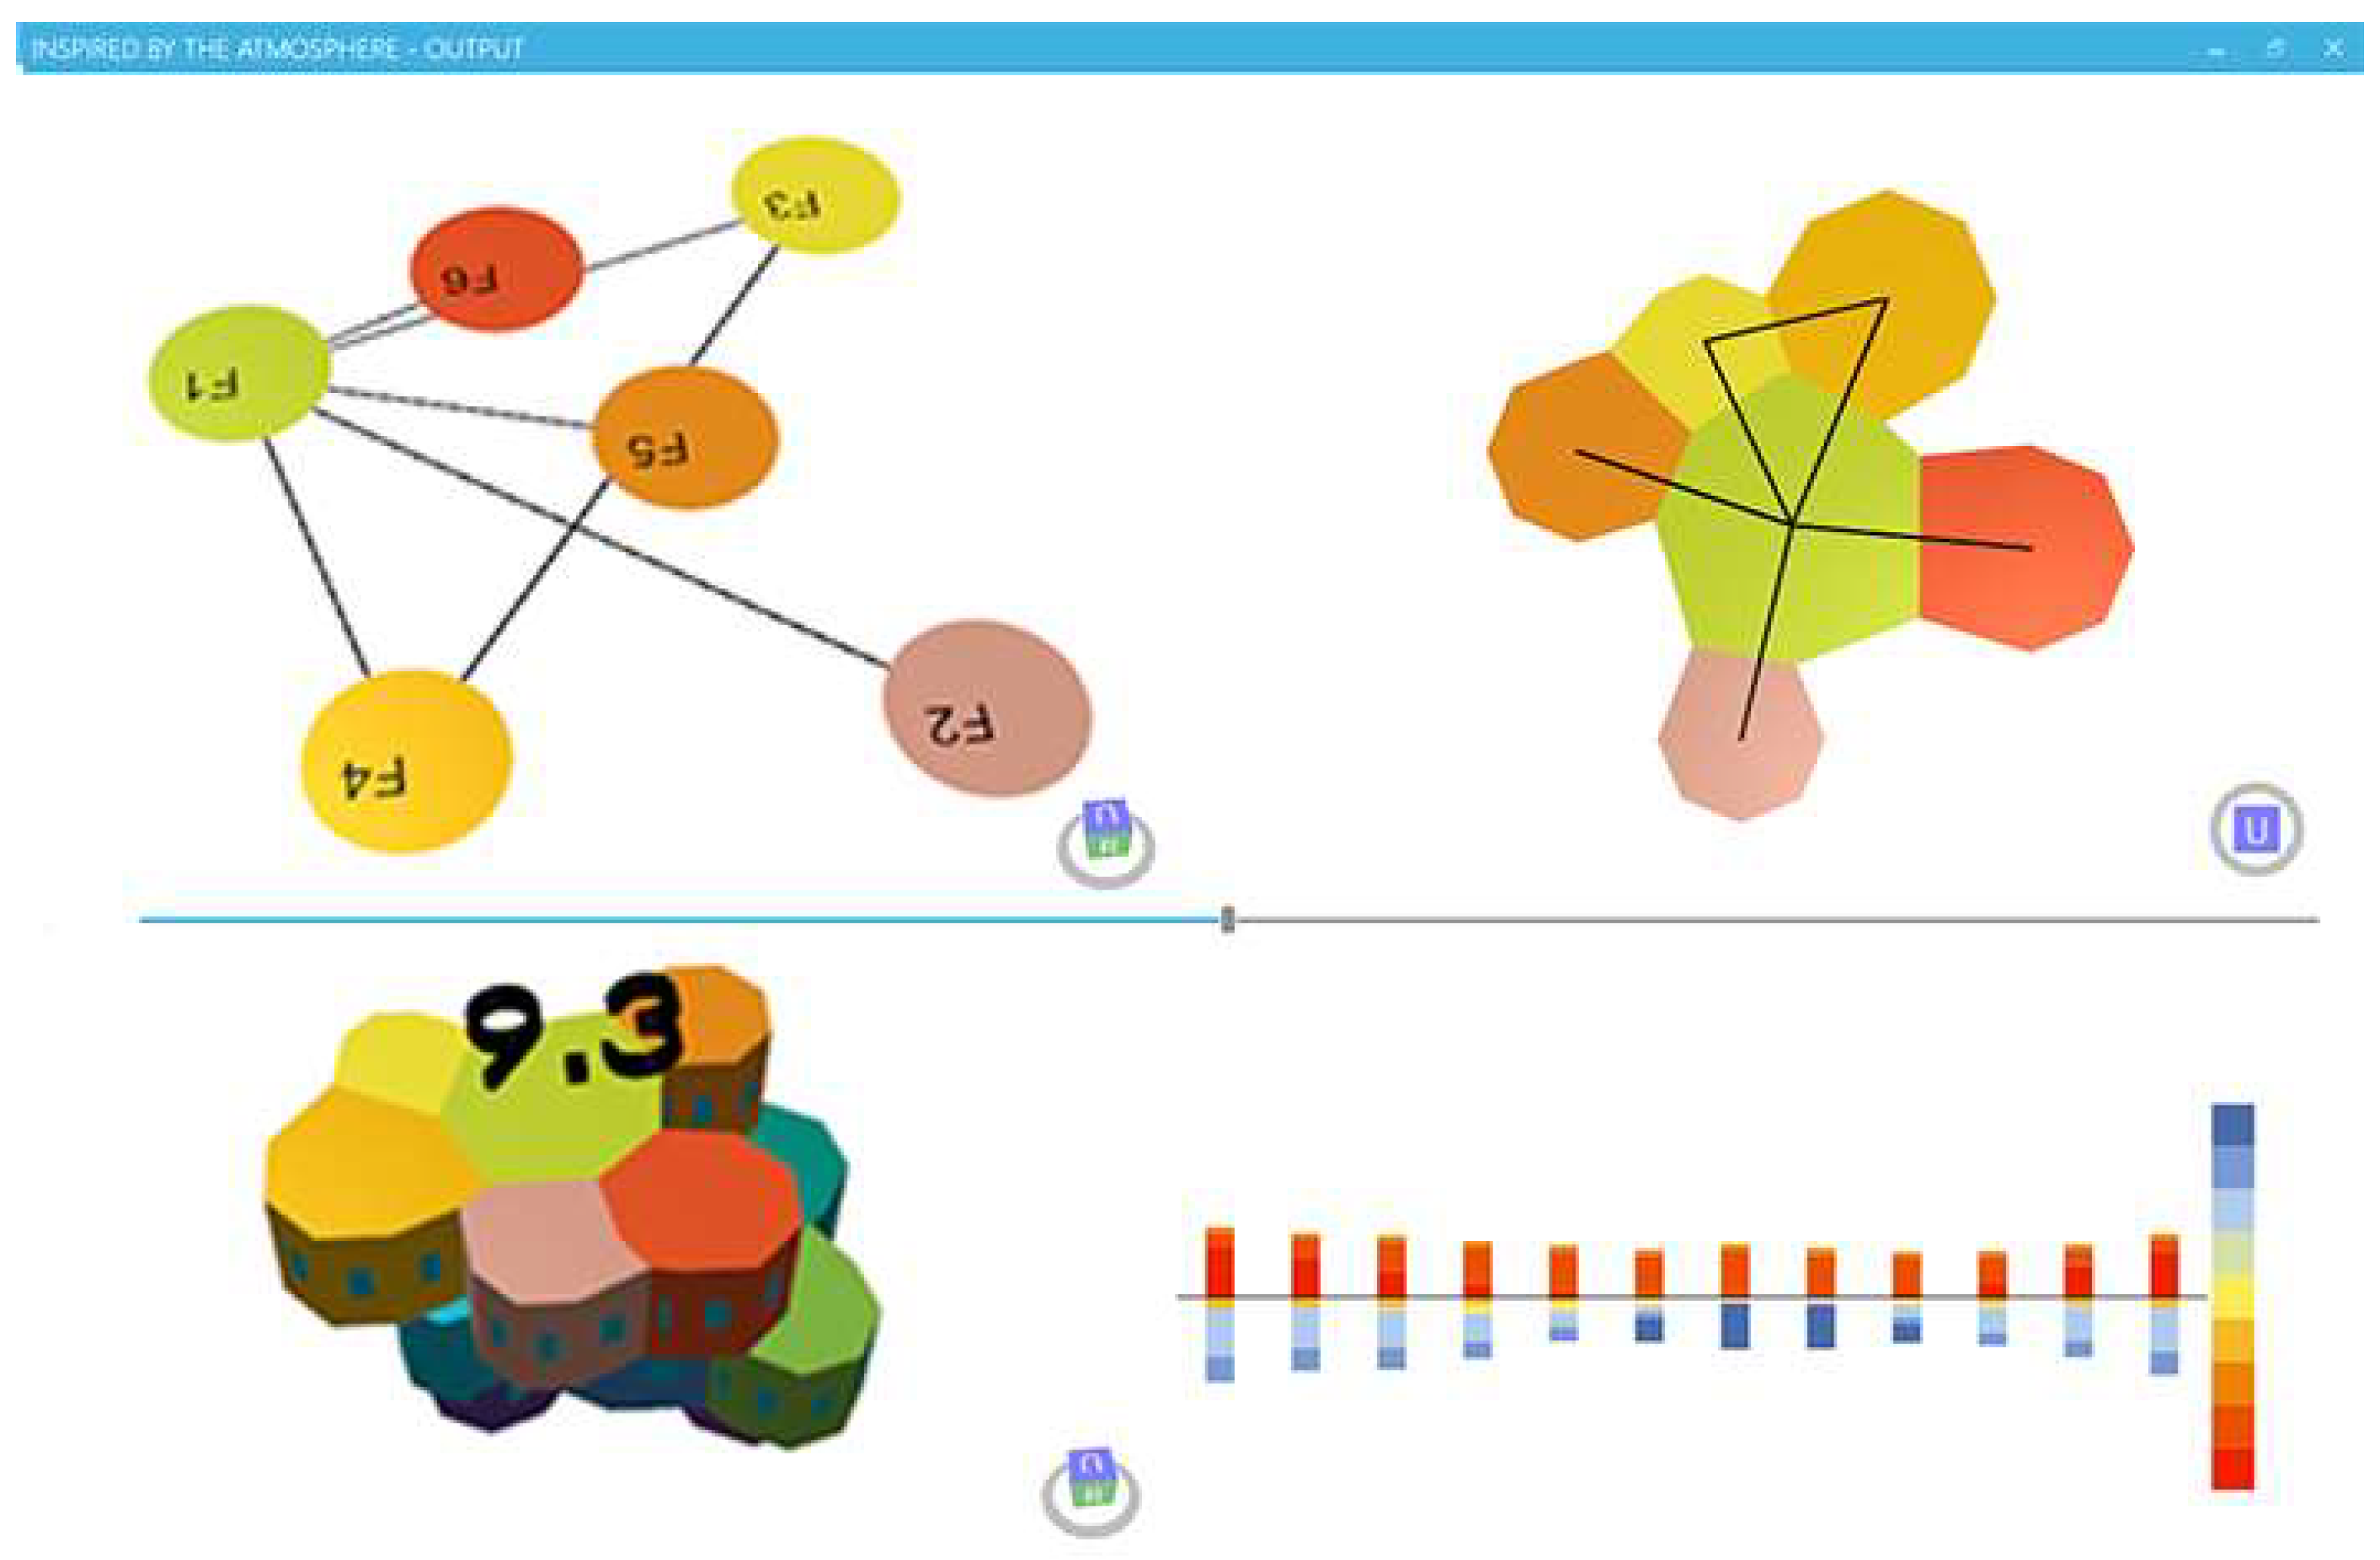
The visual interface: displaying of proposed mutations and Energy Balances.

Figure 6.
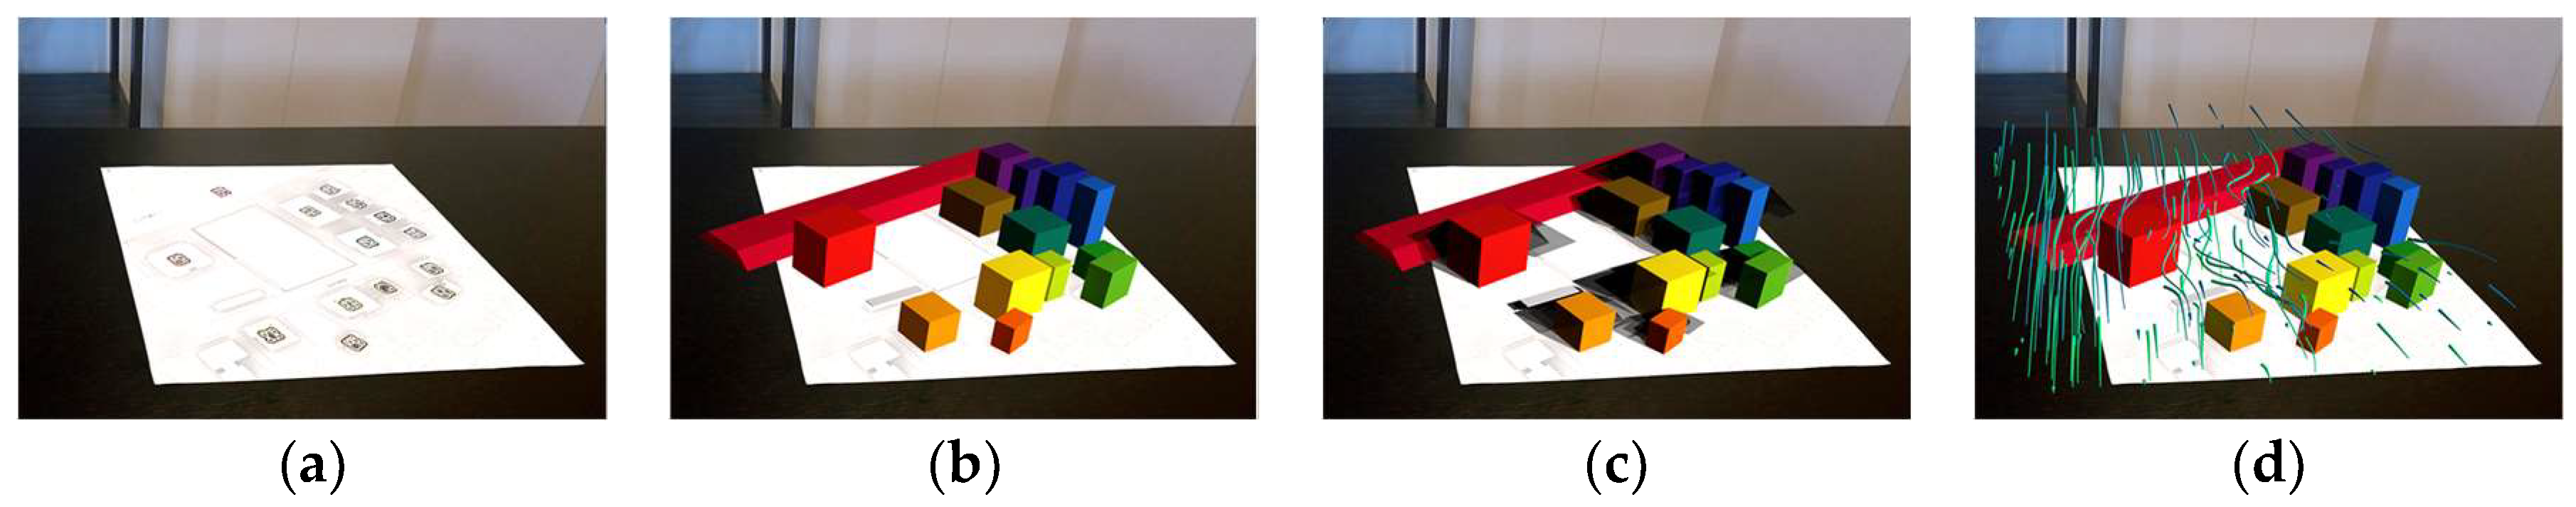
The augmented reality visualization: (a) Only the printed masterplan scheme on the table with markers; (b) The volumes are overlaid to the print; (c) Shadows are displayed; (d) Airflow is displayed.
Figure 6.
The augmented reality visualization: (a) Only the printed masterplan scheme on the table with markers; (b) The volumes are overlaid to the print; (c) Shadows are displayed; (d) Airflow is displayed.

Publisher’s Note: MDPI stays neutral with regard to jurisdictional claims in published maps and institutional affiliations. |
© 2017 by the authors. Licensee MDPI, Basel, Switzerland. This article is an open access article distributed under the terms and conditions of the Creative Commons Attribution (CC BY) license (https://creativecommons.org/licenses/by/4.0/).
Share and Cite
MDPI and ACS Style
Rossi, D.; Grifoni, R.C.; Marchesani, G.E.; Rosa, M. Inspired by the Atmosphere. See the Invisible. Proceedings 2017, 1, 906. https://doi.org/10.3390/proceedings1090906
AMA Style
Rossi D, Grifoni RC, Marchesani GE, Rosa M. Inspired by the Atmosphere. See the Invisible. Proceedings. 2017; 1(9):906. https://doi.org/10.3390/proceedings1090906
Chicago/Turabian StyleRossi, Daniele, Roberta Cocci Grifoni, Graziano Enzo Marchesani, and Marco Rosa. 2017. "Inspired by the Atmosphere. See the Invisible" Proceedings 1, no. 9: 906. https://doi.org/10.3390/proceedings1090906