The Generation and Maintenance of Hollow PV Towers in a Forced Primitive Equation Model †

Department of Physics and Astronomy, College of Charleston, Charleston, SC 29424, USA
†
Presented at the 2nd International Electronic Conference on Atmospheric Sciences, 16–31 July 2017; Available online: http://sciforum.net/conference/ecas2017.
Proceedings 2017, 1(5), 156; https://doi.org/10.3390/ecas2017-04149
Published: 17 July 2017
(This article belongs to the Proceedings of Proceedings of the 2nd International Electronic Conference on Atmospheric Sciences)
Abstract
:Diabatic heating from deep moist convection in the hurricane eyewall produces a towering annular structure of elevated potential vorticity (PV), known as a hollow PV tower. For sufficiently thin annular structures, eddies can extract energy from the mean flow, leading to hollow tower breakdown with significant changes in vortex structure and intensity. A forced primitive equation model in isentropic coordinates is used to understand the role of diabatic heating in the generation, maintenance, and breakdown of the hurricane PV tower. It is shown that diabatic heating produces a strengthening and thinning PV tower in time due to the combined effects of the diabatic heating and the radial PV advection by the induced secondary circulation. If the forcing makes the eyewall thin enough, then the PV tower can become dynamically unstable and cause air parcels with high PV to be mixed preferentially into the eye at lower levels, where unstable PV wave growth rates are largest. The breakdown of the hollow PV tower leads to a transient break in vortex intensification, a decrease in minimum central pressure, and an inward shift and tilt of absolute angular momentum surfaces. It is shown that the maintenance of the PV tower structure depends on the strength of the heating-induced secondary circulation.
1. Introduction
It has been shown that internal asymmetric
processes (such as vortex Rossby wave propagation and wave-mean flow
interaction; generation and evolution of vertical hot towers; and eyewall
replacement cycles) can be very important for intensity and structural
variability for tropical cyclones (TCs). The dynamical evolution of the TC inner
core region can be examined using a potential vorticity (PV) framework. For
fully three-dimensional nonhydrostatic motions with diabatic and frictional
effects, the Rossby-Ertel PV equation is
where is the material derivative, is the specific volume, is the absolute vorticity vector, is the potential temperature, is the diabatic heating rate, and is the frictional force per unit mass. Within the hurricane inner core, the absolute vorticity vector tends to point upward and radially outward. Since tends to maximize at midtropospheric levels, air
parcels flowing inward at low levels and spiraling upward in the eyewall
experience a material increase in PV due to the diabatic heating term. Large
values of PV are advected vertically into the upper troposphere, producing a
hollow tower structure in the PV field that extends from the lower to middle
troposphere. Since the radial structure of the hollow PV tower satisfies the
Charney-Stern necessary condition for combined barotropic-baroclinic
instability, the hollow tower structure may break down, causing PV mixing
between the eyewall and the eye.
It has been shown that internal asymmetric processes (such as vortex Rossby wave propagation and wave-mean flow interaction; generation and evolution of vertical hot towers; and eyewall replacement cycles) can be very important for intensity and structural variability for tropical cyclones (TCs). The dynamical evolution of the TC inner core region can be examined using a potential vorticity (PV) framework. For fully three-dimensional nonhydrostatic motions with diabatic and frictional effects, the Rossby-Ertel PV equation is xperience a material increase in PV due to the diabatic heating term. Large values of PV are advected vertically into the upper troposphere, producing a hollow tower structure in the PV field that extends from the lower to middle troposphere. Since the radial structure of the hollow PV tower satisfies the Charney-Stern necessary condition for combined barotropic-baroclinic instability, the hollow tower structure may break down, causing PV mixing between the eyewall and the eye.
The instability of the eyewall, its breakdown, and the subsequent PV mixing has been examined extensively in idealized numerical modeling frameworks that are unforced [1,2,3,4,5,6,7,8,9,10]. These studies provided a basic understanding of barotropic instability and vorticity mixing in the inner core, but diabatic effects were ignored in these studies. On the other end of the spectrum, full-physics modeling studies have also been conducted examining eyewall evolution with the inclusion of diabatic and frictional effects [11,12,13,14,15,16,17,18]. Wu et al. [15] investigated the role of condensational heating and surface friction on the eyewall evolution for a landfalling typhoon and they found that friction helps to keep the PV annulus narrow by the stretching deformation during the heating. Nguyen et al. [16] examined the structural and intensity variability associated with the symmetric-to-asymmetric transitions in a simulation of Hurricane Katrina (2005). While these studies are more realistic, it is more difficult to understand the essential dynamics because of the complexity of these simulations. In addition to the full-physics modeling studies, observational and experimental studies have also been conducted which underscores the complex nature of eyewall mesovortices and eye-eyewall mixing in the real atmosphere [19,20,21,22,23,24].
The studies of Rozoff et al. [25] and Hendricks et al. [26] bridged the gap between the idealized unforced studies and the forced full-physics modeling studies. Rozoff et al. [25] performed idealized experiments examining hurricane evolution in a forced nondivergent barotropic model, where diabatic heating was parameterized as a vorticity forcing term. Their main conclusion was that barotropic instability and subsequent vorticity mixing is a transient intensification brake during symmetric intensification; however, the transport of high-vorticity air into the eye from the eyewall eventually produces a higher-intensity vortex than one that did not undergo this internal mixing mechanism. This was the dual nature of potential vorticity mixing noted in their study. Hendricks et al. [26] extended the study of Rozoff et al. [25] by examining hurricane evolution in a forced shallow-water model, where diabatic heating was parameterized as an annular mass sink. Their study demonstrated that diabatic heating produces a strengthening and thinning PV ring due to the combined effects of the mass sink and radial PV advection by the induced divergent circulation (leading to dynamical instability and vortex breakdown), whereas friction is shown to help stabilize the PV ring by reducing the eyewall PV and the unstable-mode barotropic growth rate.
The purpose of the present study is to extend the study of Hendricks et al. [26] to the next level of complexity toward the real atmosphere by using a forced primitive equation model in isentropic coordinates. Although there is a close mathematical and physical analogy between the shallow water model and the isentropic primitive equation model, the vertical structure of this model permits heating-induced vertically propagating inertia-gravity waves that can be excited by the heating in the model and the existence of vertically propagating vortex Rossby waves that can be excited during the subsequent hollow PV tower breakdown. Furthermore, the role of the secondary circulation in the breakdown of the hollow PV tower can be assessed using this multi-layer model. The paper will be organized as follows. In Section 2, the primitive equation model (along with the initial conditions and forcing function) used in this study is presented. In Section 3, the nonlinear evolution of the control experiment is presented and discussed. In Section 4, the azimuthal mean diagnostics (along with the wave-mean flow interaction) are presented in order to understand the relative roles of mean and eddy processes in the vortex structure and change. Conclusions are given in Section 5.
2. Dynamical Model
2.1. The Governing Equations
The model is based upon the vorticity-divergence
form of the primitive equations in isentropic coordinates, similar to [9]. The governing equations are
Here, is the zonal velocity, is the meridional velocity, is the isentropic relative vorticity, is the isentropic divergence, is the pseudodensity, is the Montgomery streamfunction, is the geopotential, is the Exner function, is the diabatic heating rate, is the kinetic energy, are the components of the frictional force, and is the diabatic heat source. Note that can be expressed in terms of the velocity potential and the streamfunction as
Furthermore, note that all variables are functions of and all horizontal derivatives and time
derivatives are taken on isentropic surfaces.
The model is vertically discretized using the Charney-Phillips (CP) grid with vorticity and divergence defined on 19 integer levels and pressure defined on the associated half-integer levels [27]. The top boundary is assumed to be both an isentropic and isobaric surface with and . The lower boundary is assumed to be the isentropic surface , along which the pressure is varies as a function of . The potential temperatures on the 19 integer levels are evenly spaced from to and then is stretched up to , which gives the finest vertical resolution in the
lower troposphere where the most intense PV mixing and the largest material
increase of PV occurs.
The horizontal discretization is based on a double Fourier pseudospectral method having equally spaced collocation points on a doubly periodic horizontal domain of size , which results in 1.67 km spacing between points. Because there is a potential enstrophy cascade to the highest resolved wavenumbers during PV mixing, hyperdiffusion terms , , and have been included in the model. A third-order
Adams-Bashforth explicit scheme with a time step of 0.75 s is used for the time
discretization needed in Equations (2)–(4).
2.2. The Initial Condition and Heating Function
The goal of this study is to examine how a tropical storm-like vortex evolves into a hollow PV tower structure. Similar to [26], the isentropic relative vorticity is given the separable form , where the radial structure is constructed as a
smoothed Rankine vortex
and the vertical
structure is constructed to give a baroclinic structure
Here, , , and , is a cubic shape function that provides smooth transition zones, and is set to a small negative value so that the domain-averaged vorticity vanishes. Note that the peak winds at are approximately .
To initialize the field, we first solve the isentropic coordinate version of the nonlinear balance equation as a two-dimensional Poisson equation for
where is the streamfunction associated with the axisymmetric part of the vorticity field. The solution of Equation (10), obtained at each integer level in the vertical, gives the initial Montgomery potential to within an additive function of . This additive function was determined so that the horizontal area average of over the domain resulted in a vertical thermodynamic profile in agreement with the Jordan mean sounding [28]. With determined in this way, can be obtained from .
To parameterize the effects of eyewall diabatic
heating, an axisymmetric, annular heating ring is specified with the following
form:
where the radial structure function is given by
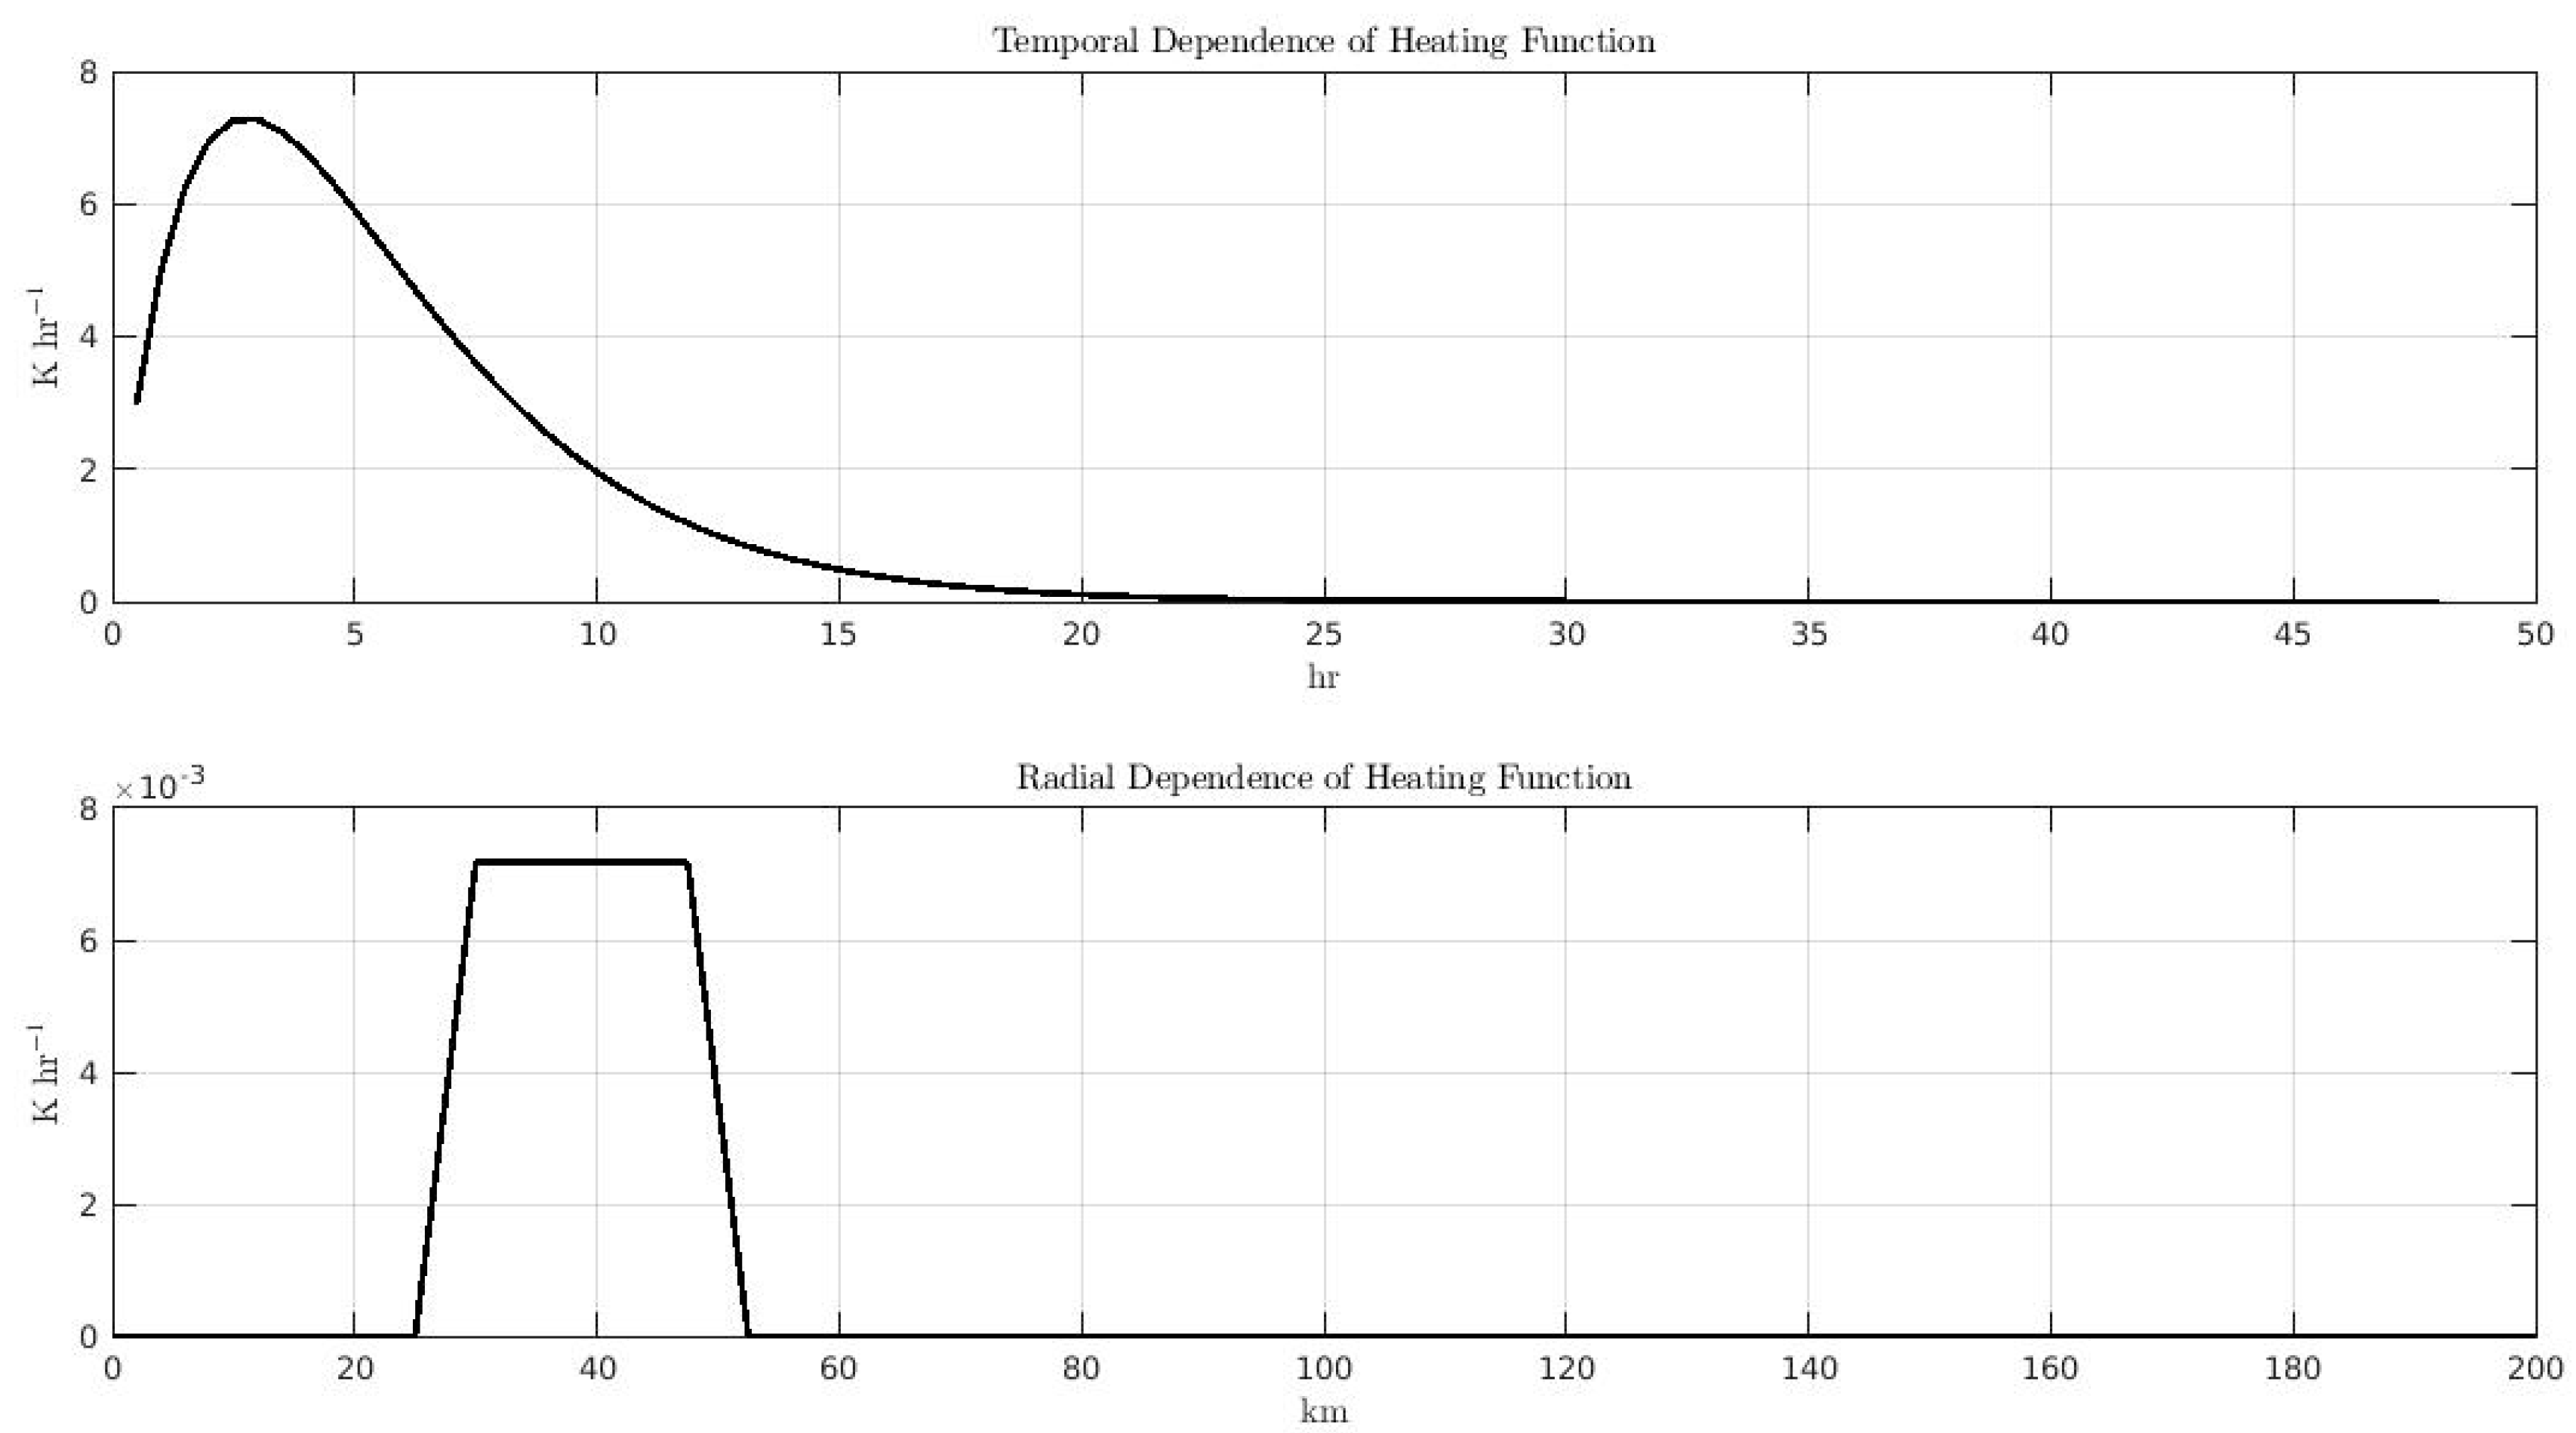
where denotes the radius; are the radii defining the annulus; is the magnitude of the diabatic heating, and is the same shape function used in Equation (8). For our control experiment, a thick heating ring has been chosen in which km. The vertical structure of the heating ring is
given by
where is a constant that determine the vertical location of the maximum diabatic heating. Choosing places the maximum heating near 500 mb, which
proves to be a good approximation to the observed vertical latent heat profile
of hurricanes [29].
The constant is determined using the same procedure found in [26]. By considering the transition zones to be very
narrow, integrating Equation (11) over area and time gives
where and . In order to make the right hand side of Equation (14) independent of , and , has been chosen as
where the constants, and , have been chosen for consistency with the satellite-derived, inner-core latent heating rates found by [30]. The temporal structure of the heating function is controlled by the constant , which is chosen to be for this experiment. The temporal and radial
structure of the heating function is given in Figure 1.
3. Results
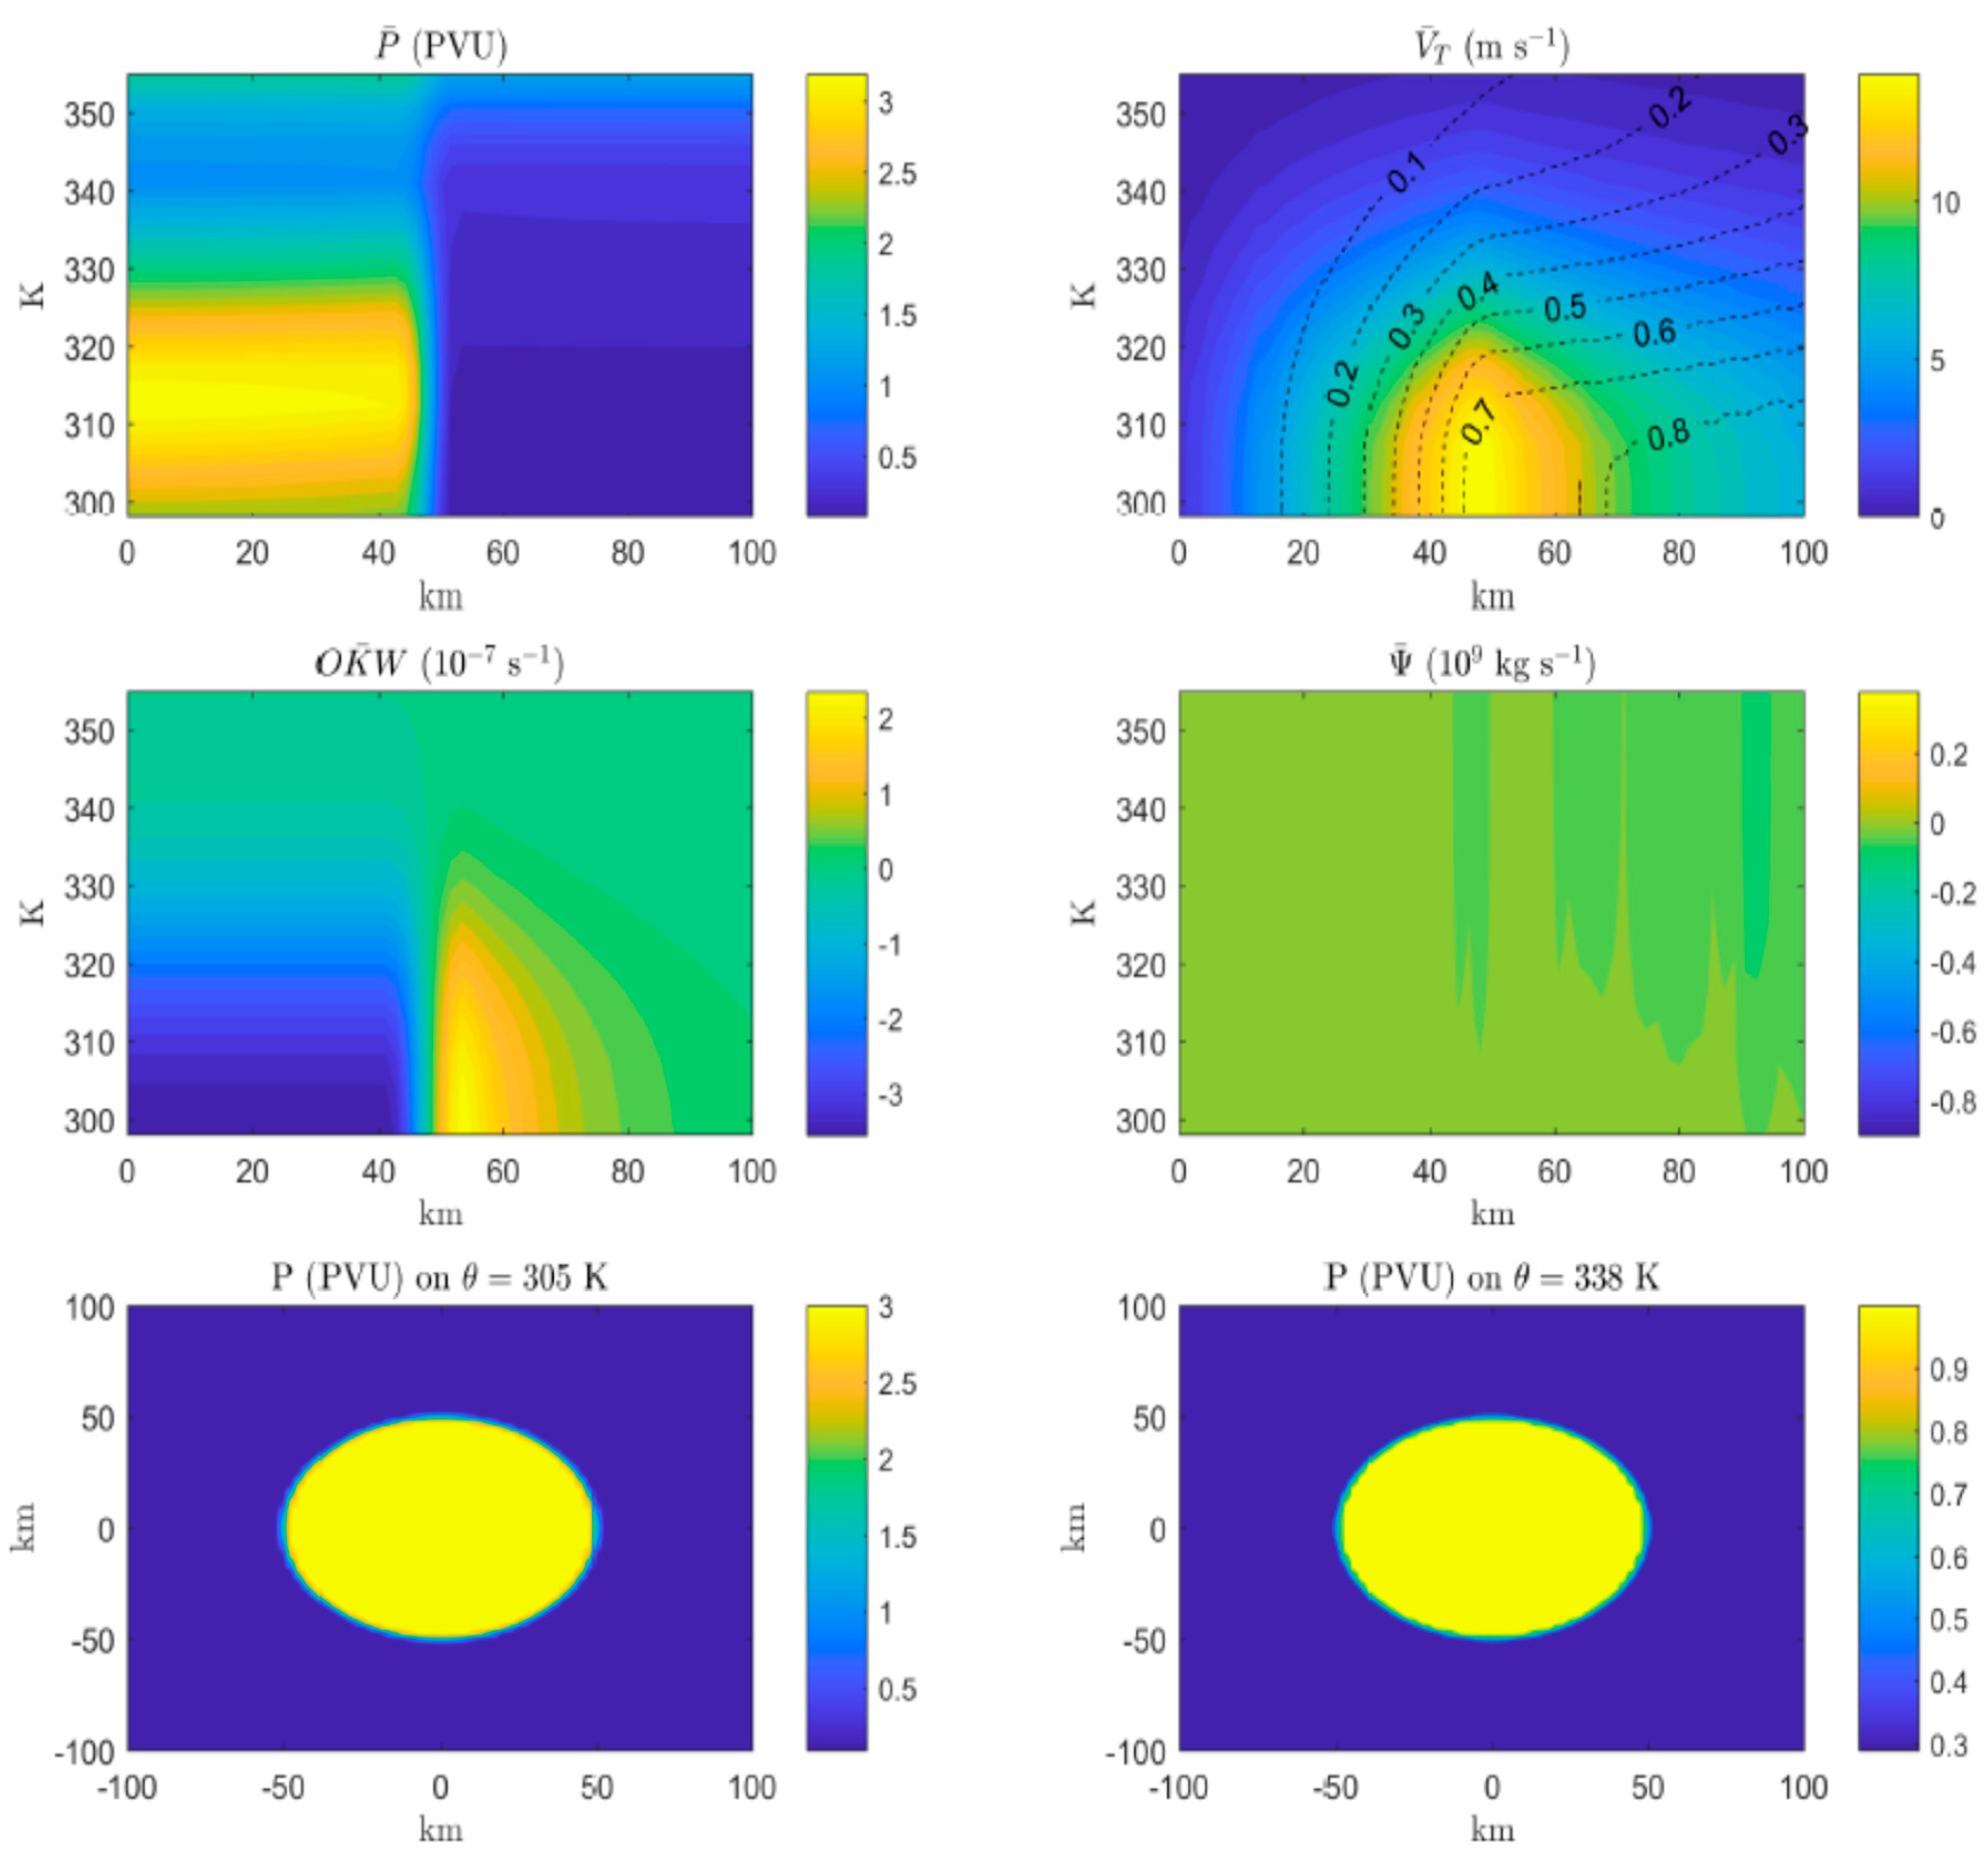
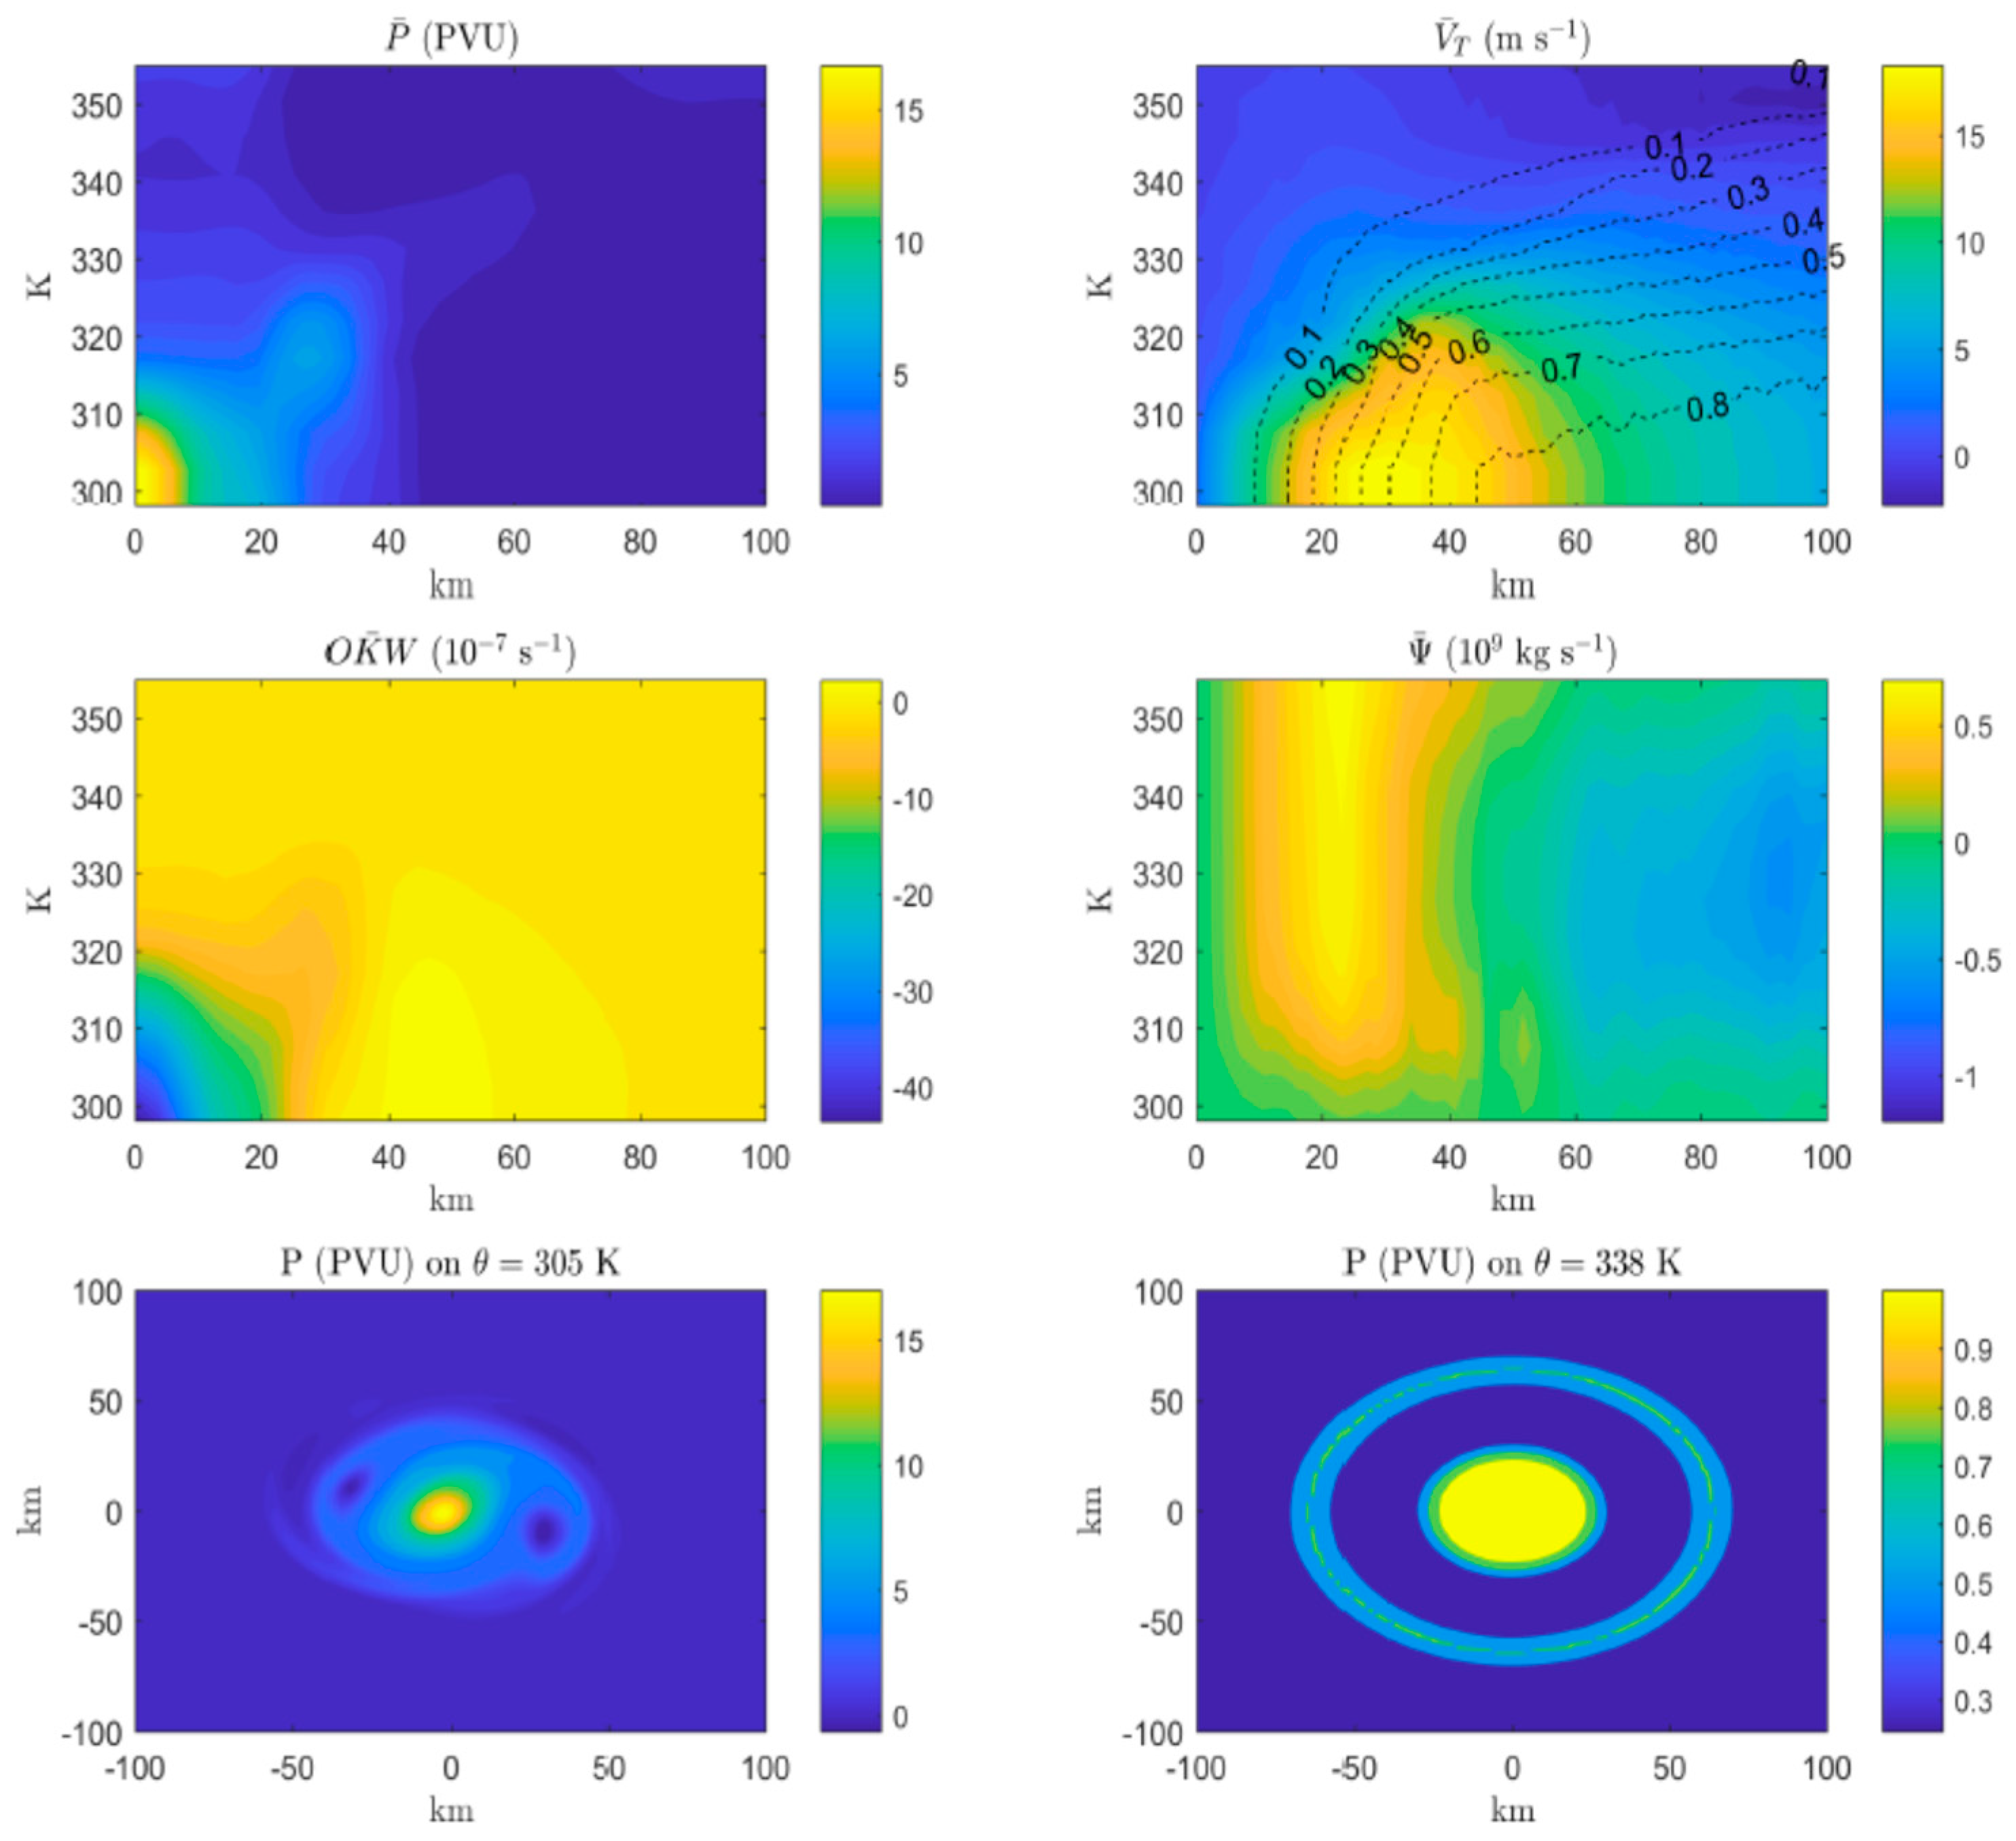
The initial condition for the tropical storm-like vortex is shown in Figure 2. The radial structure of the azimuthal PV exhibits a Rankine-like vortex as discussed in the previous section and maximizes at 312 K because of the balanced pseudodensity field, which has increased static stability above the surface. The Okubo-Weiss parameter (, where is the stretching deformation and is the shearing deformation) is positive outside the radius of maximum wind and negative inside. Moreover, the OKW parameter is very small at upper levels, which indicates that eddy formation and mixing is more likely to occur in the lower-troposphere. This is also consistent with the linear analysis of [1], which indicates that unstable PV growth rates are largest near the surface. To analyze the impact of the secondary circulation on the construction and breakdown of the hollow PV tower, an isentropic mass streamfunction has been introduced which satisfies the basic
conditions
where the overbar exhibits the ordinary azimuthal average of the variable. Because the initial condition contains no divergent flow, exhibits no radial or vertical gradients, as
expected.
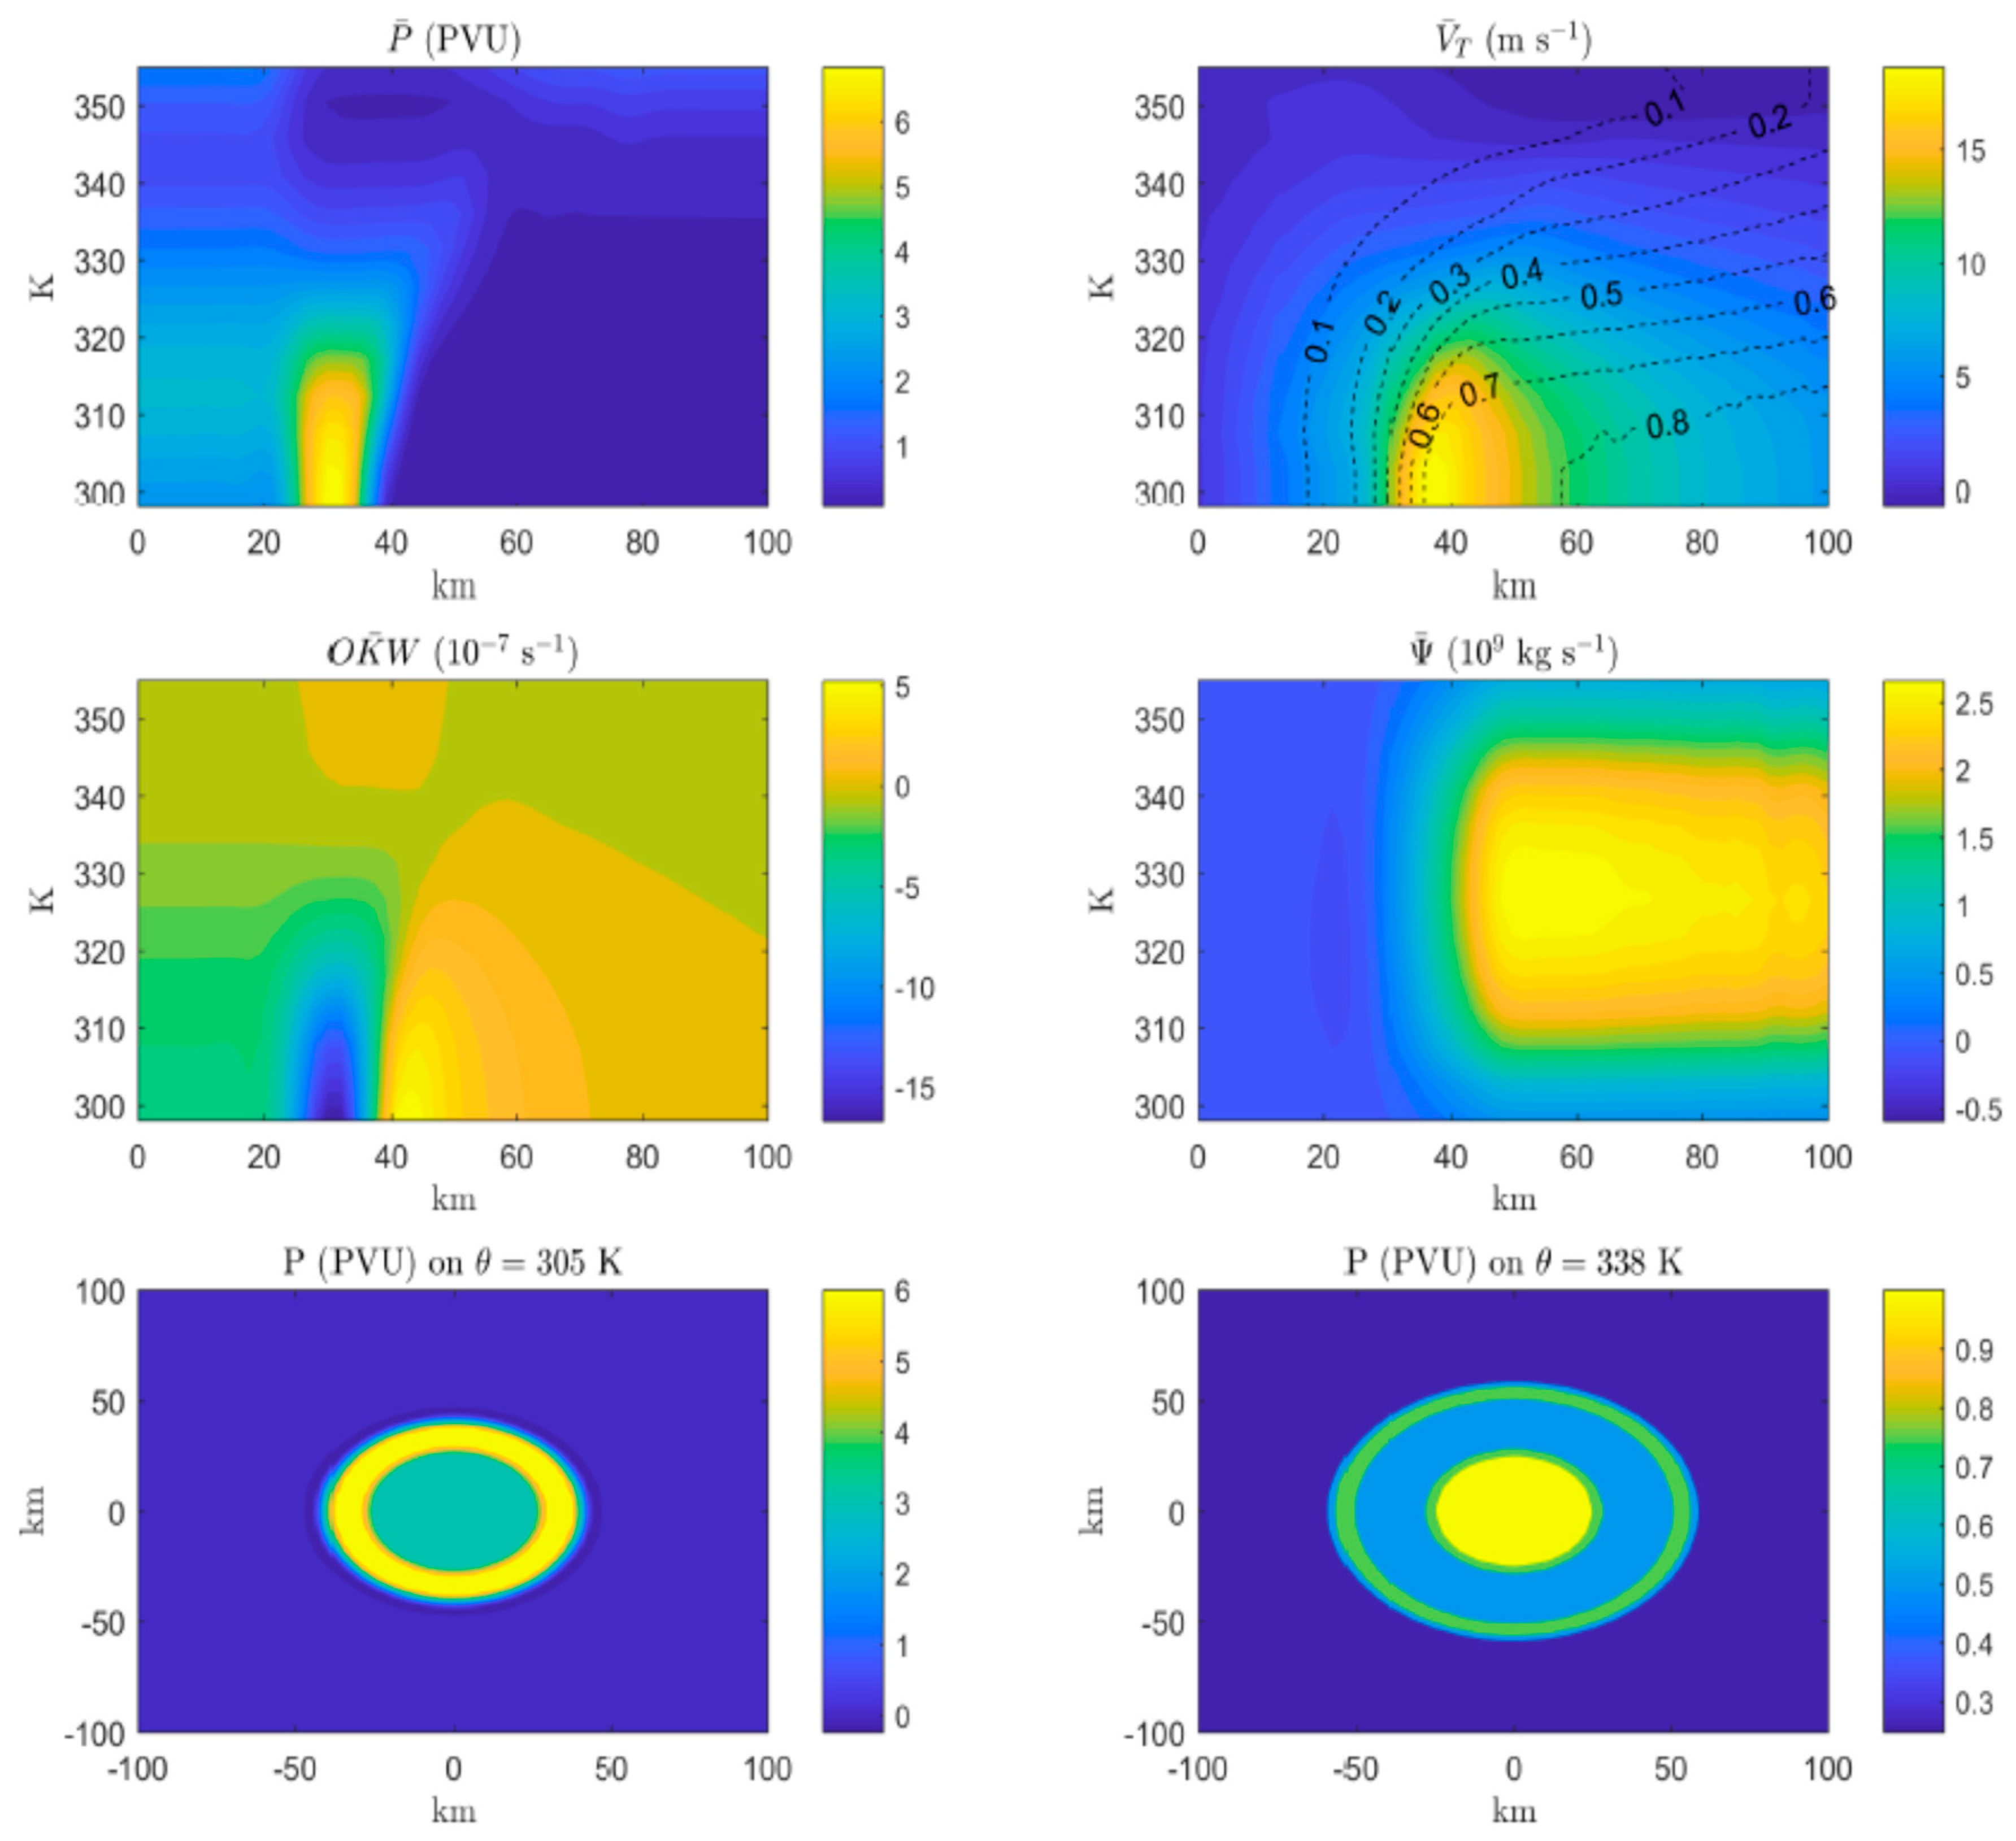
Figure 3 shows the evolution of the vortex at , which is the approximate time when the heating function reaches its maximum intensity according to Figure 1. The diabatic heating results in material increases (decreases) in azimuthal mean PV in the lower (upper) troposphere. The diabatic heating forces isobaric surfaces downward (not shown) below the level of maximum diabatic heating, creating locally lower pressure in the lower troposphere. From a balanced vortex framework, diabatic heating will cause a local increase in cyclonic vorticity tendency, which induces low-level convergence and upper-level divergence. During the simulation, the high-deformation region becomes larger (both radially and vertically) as the radius of maximum wind shrinks near the surface in response to the contracting outer radius of the lower-level PV ring near the surface. Conversely, the diabatic heating produces an annular region of divergence in the upper troposphere, and as the outer radius of the vortex expands, the OKW parameter is positive everywhere. Therefore, the outer radius of the vortex in the upper-troposphere expands. Therefore, the high-deformation region shrinks as the upper portion of the vortex expands. This leads to a well-defined tilt in the angular momentum surfaces for the hollow PV tower. These structural and intensity changes are directly connected to the heating-induced secondary circulation (as represented by in Figure 3).
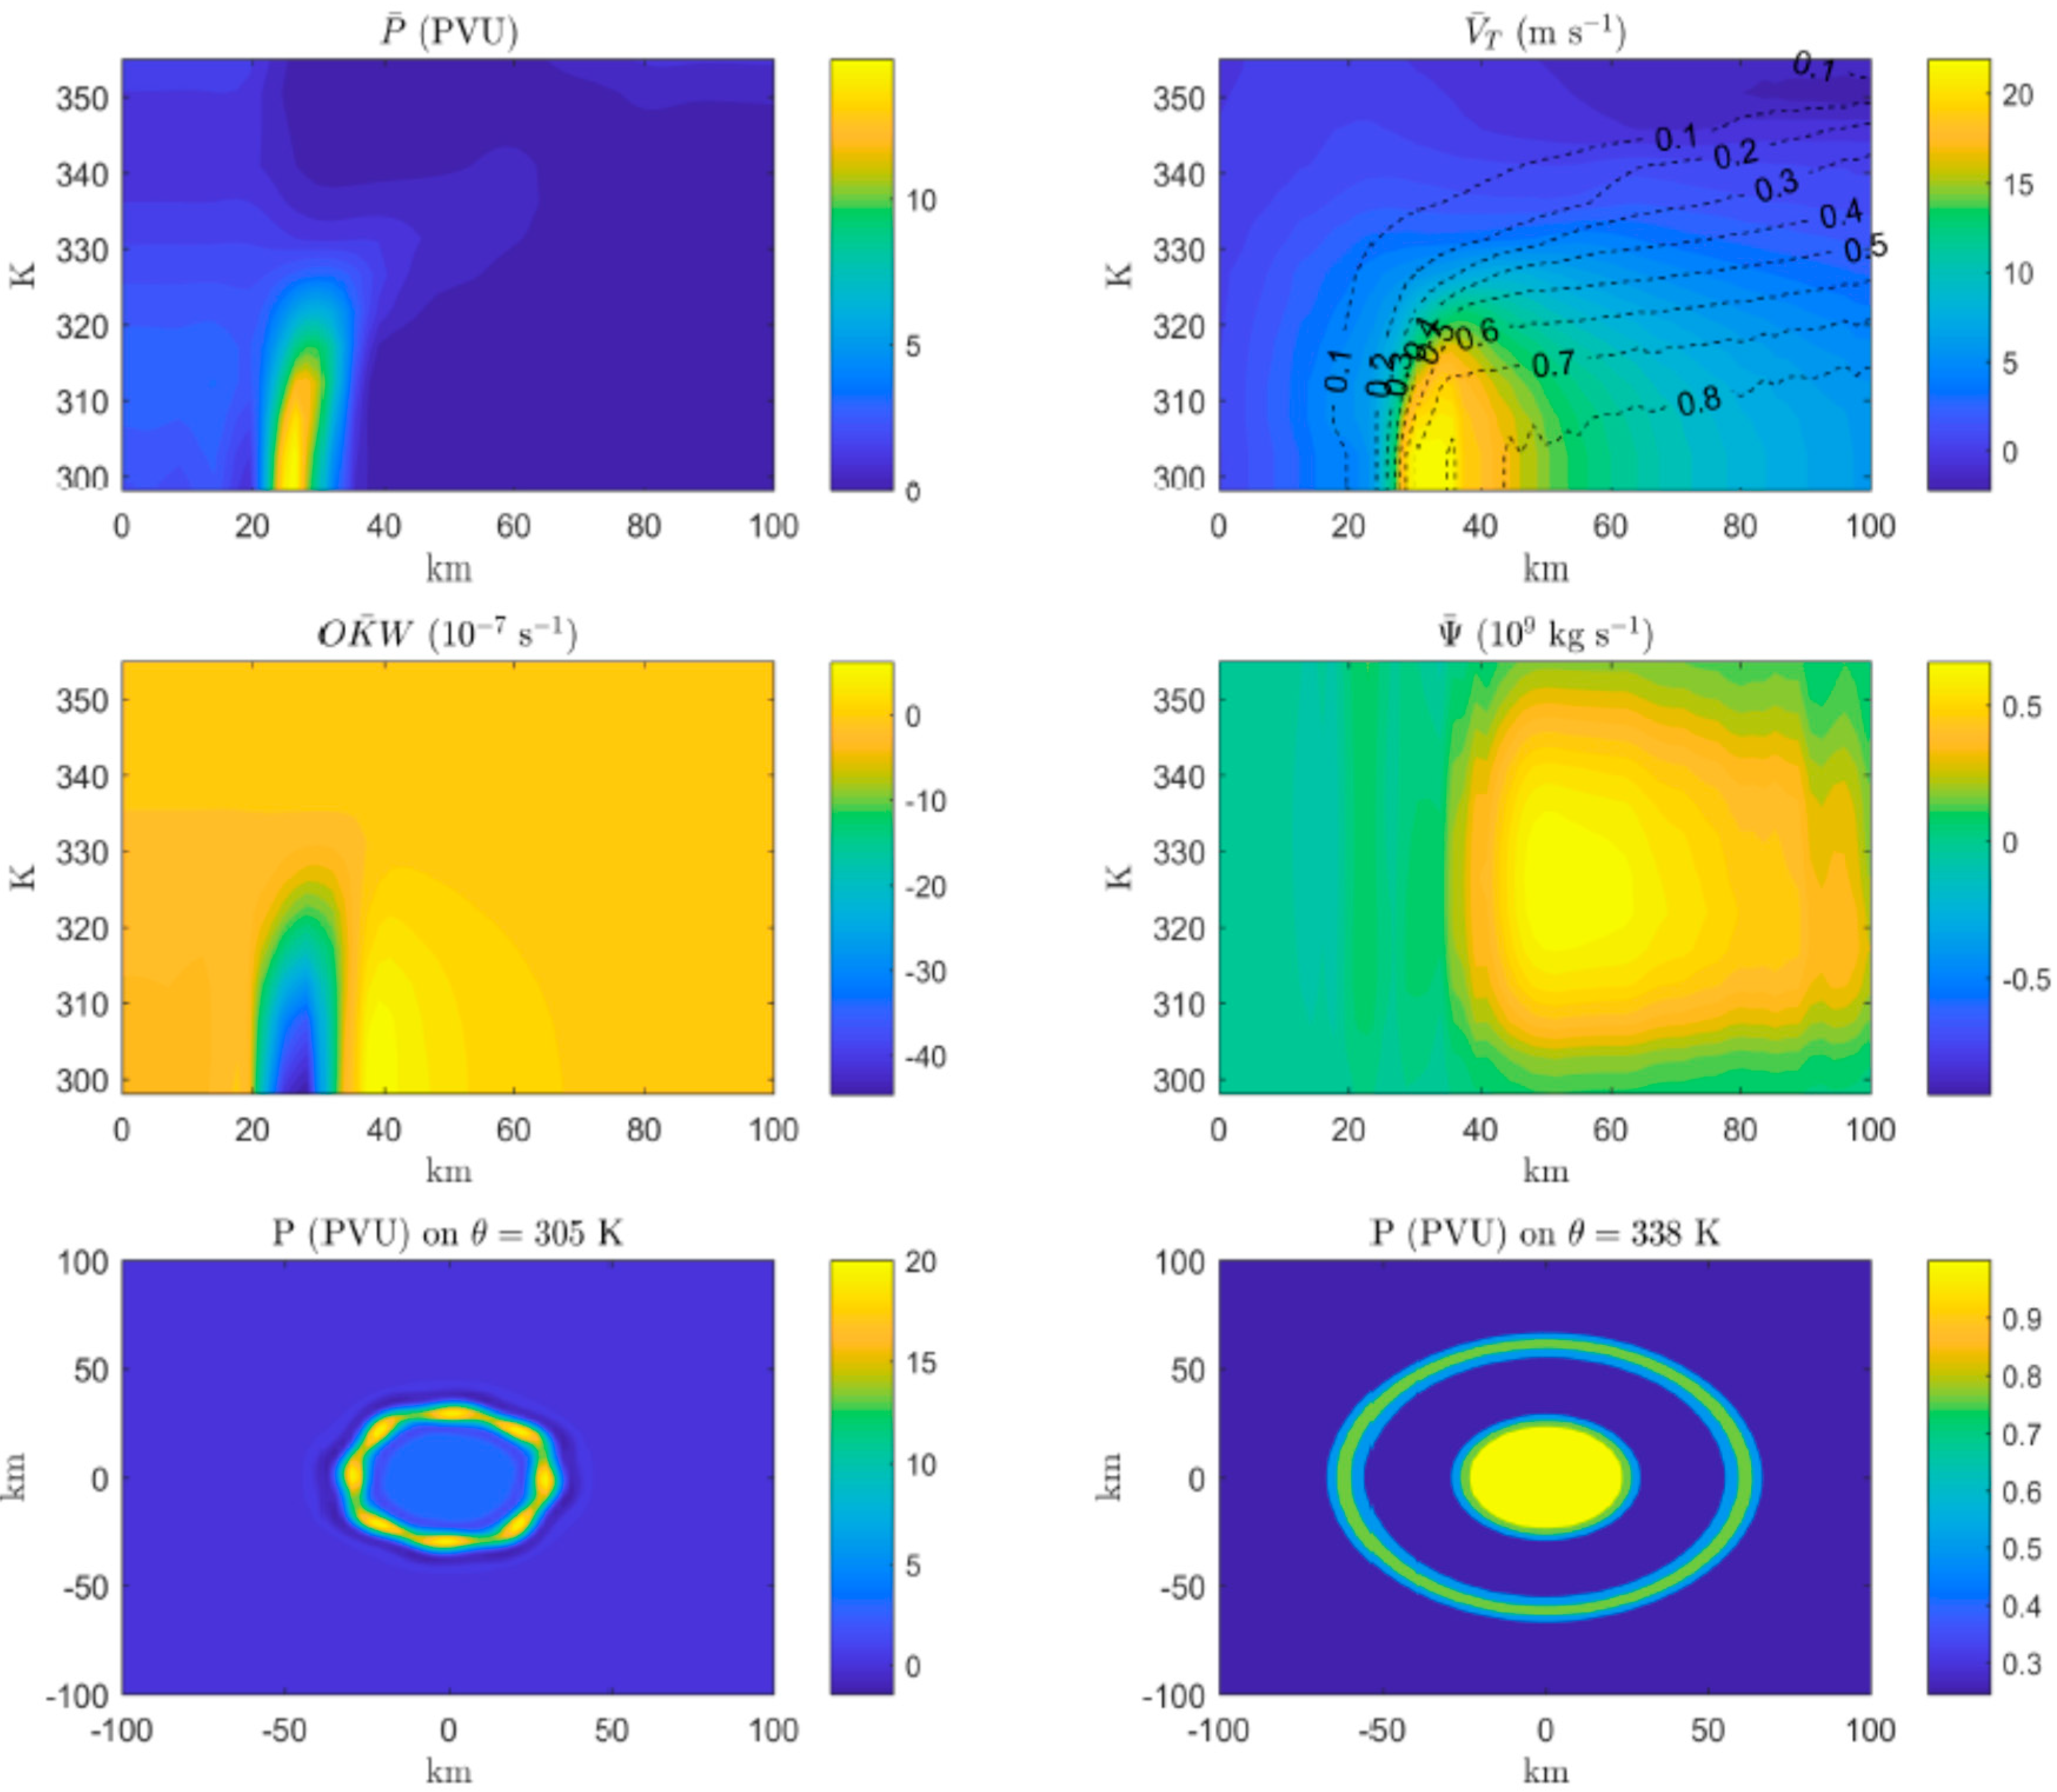
Figure 4 shows the evolution of the vortex at . Comparing Figure 4
to Figure 3, we observe that radial PV
gradients near the radius of maximum winds have increased; the azimuthal
velocity has intensified and contracted further inward; the secondary
circulation has weakened (due to weaker diabatic heating during this time); and
the high-deformation region continues to expand. The diabatic heating results
in sharp radial PV gradients near the radius of maximum wind, leading to a thin
PV tower structure. At t = 10 h, the low-level PV ring has rolled up
into multiple mesovortices, whereas the upper-level PV ring maintains an
annular shape. During the evolution of the vortex, the low level mesovortices
rapidly merge into a monopole structure. The instability progresses more slowly
at middle levels because the average inner-core PV at this level is smaller. In
response to the rapid PV mixing at lower levels, a prominent PV bridge has
formed across the eye, and the entire PV tower now tilts outward from lower to
upper levels. A significant spin-up of the low level outer eye has also
occurred in response to the lower tropospheric PV mixing, and angular momentum
surfaces tilt outward with height.
At 48 h, the PV rings within the lower troposphere
have symmetrized into monopoles, as shown in Figure 5. The azimuthal mean PV now has monopolar radial profiles from the
surface to 315 K, indicating that PV mixing has occurred between the eye and
eyewall within the lower troposphere. Contrary to [9],
PV mixing does not occur throughout the depth of the troposphere because the
unstable PV growth rates are much smaller in the upper-troposphere. The PV
bridge that formed earlier still exists across the eye at 305 K. The azimuthal
mean tangential velocity is similar to what it was at t = 10 h, but spin-up has now also occurred at middle
levels as the midlevel PV rings rolled up.
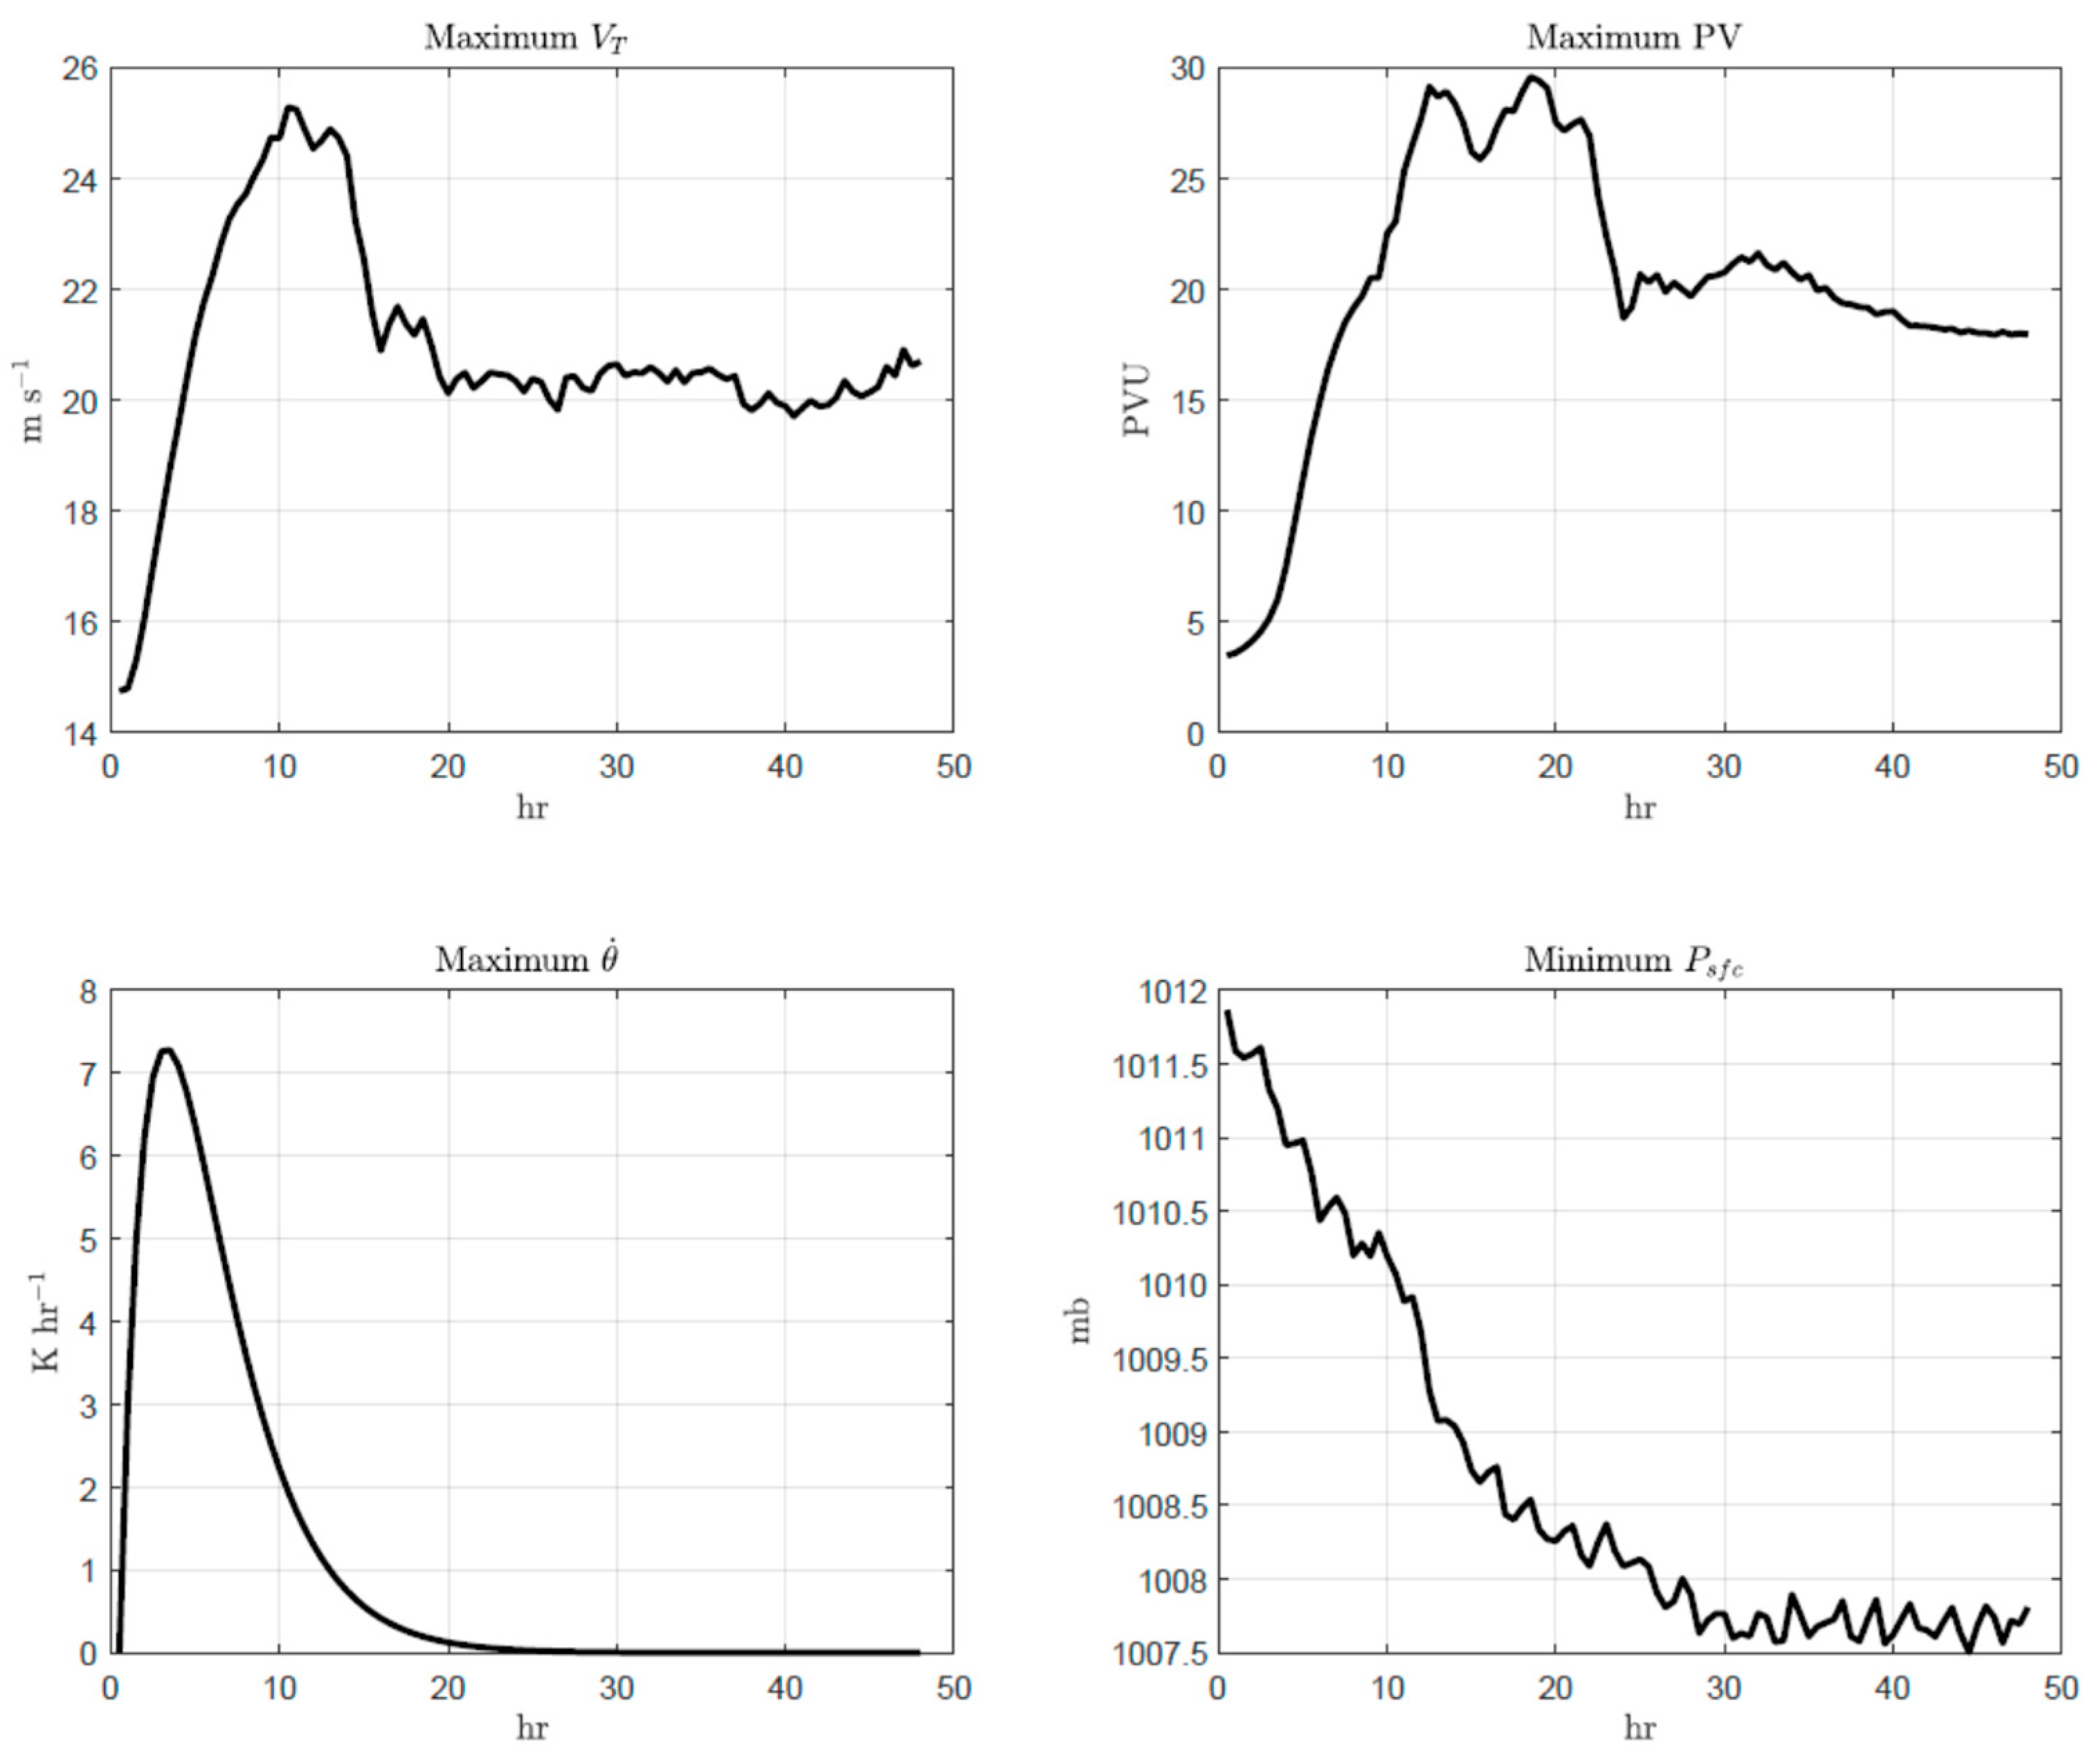
The initial intensification phase of the vortex
leads to a gradual increase in azimuthal velocity along with a decrease in
minimum central pressure, as shown in Figure 6.
During the vortex breakdown phase, there is a transient break in vortex
intensification; however, the PV mixing process continues to reduce the minimum
central pressure of the vortex throughout the model simulation. In the
following sections, the physical mechanisms and processes that cause structural
and intensity variability of the vortex will be discussed.
4. Discussion
In this section, budget analyses are performed to
assess the relative roles of mean and eddy processes in the vortex structural
changes due to heating and PV mixing. Since it has been shown in the previous
section that the symmetric and asymmetric processes occur as the vortex
evolves, it is expected that eddy and mean processes will play a significant
role to the total change in the vortex.
4.1. Azimuthal Mean Potential Vorticity Budget Analysis
We now focus on the role of diabatic heating during
the construction and breakdown of the hollow PV tower. PV budget analyses are
conducted to investigate the mechanism that helps to maintain the hollow PV
structure. The PV evolution equation in cylindrical and isentropic coordinates
is given by [31]:
The terms on the right
hand side of Equation (17) correspond to the radial advection of PV,
azimuthal advection of PV, vertical advection of PV, the vertical diabatic
heating term, the shear diabatic heating term, and the frictional term,
respectively.
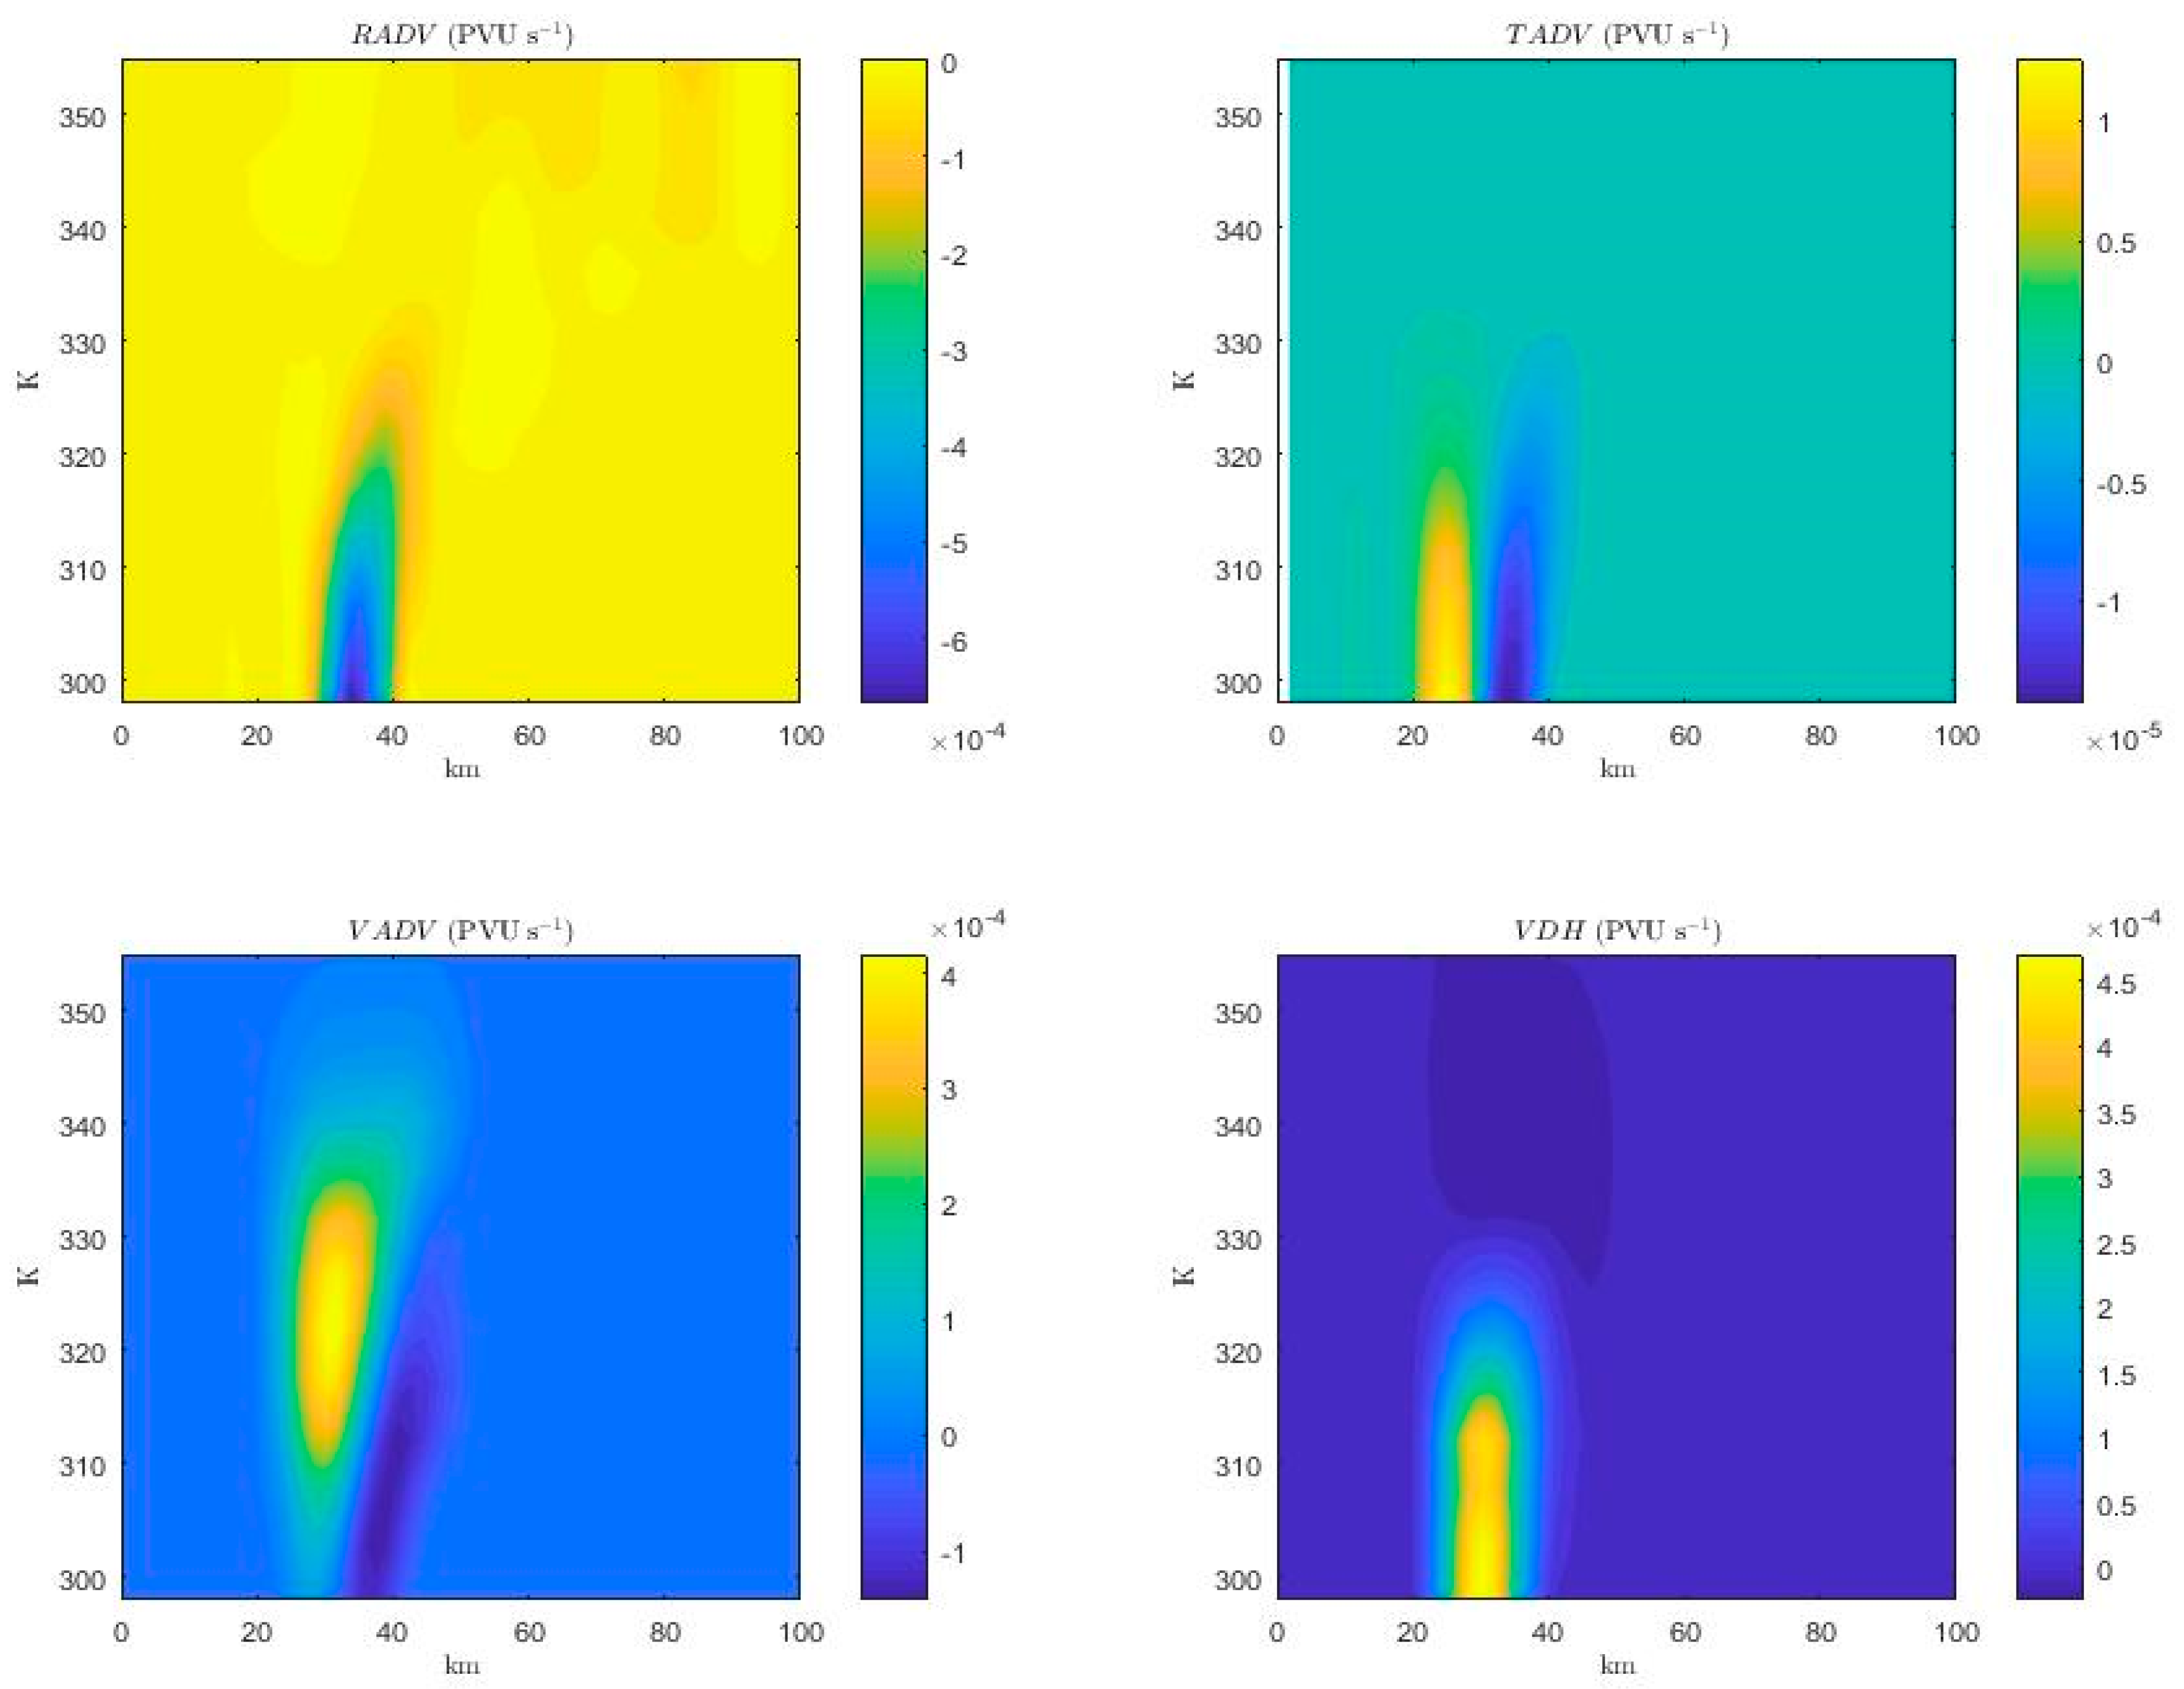
The PV budget terms during the initial intensification
phase is shown in Figure 7 (the shear
diabatic term and friction term are neglected in the figure because they are
negligible compared to the other terms). During the spin-up phase, the local PV
change is primarily governed by the radial advection term, the vertical
advection term, and the vertical diabatic heating term. Below the region of
maximum heating, the heating term is continually producing PV whereas above the
region of maximum heating, the heating term is depleting PV. The heating produces
a secondary circulation that advects lower-PV fluid inward, thus reducing PV at
the outer edge of the heating region. The inward advection is favored in the
outer region where the inertial stability is weaker, while the PV production is
favored in the region where the PV is larger. Furthermore, the secondary
circulation advects higher-PV fluid upwards, creating a hollow tower structure.
In the simulation, the lower-level PV rings become thinner in time with the
maximum PV production occuring near the inner radius of the heating annulus due
to the radial advection term. Therefore, axisymmetric forcing produces a
strengthening and thinning of the PV annulus in time, with a maximum value at
the inner radius of the heating. Conversely, the induced radial PV advection
causes an expansion of the upper-level rings.
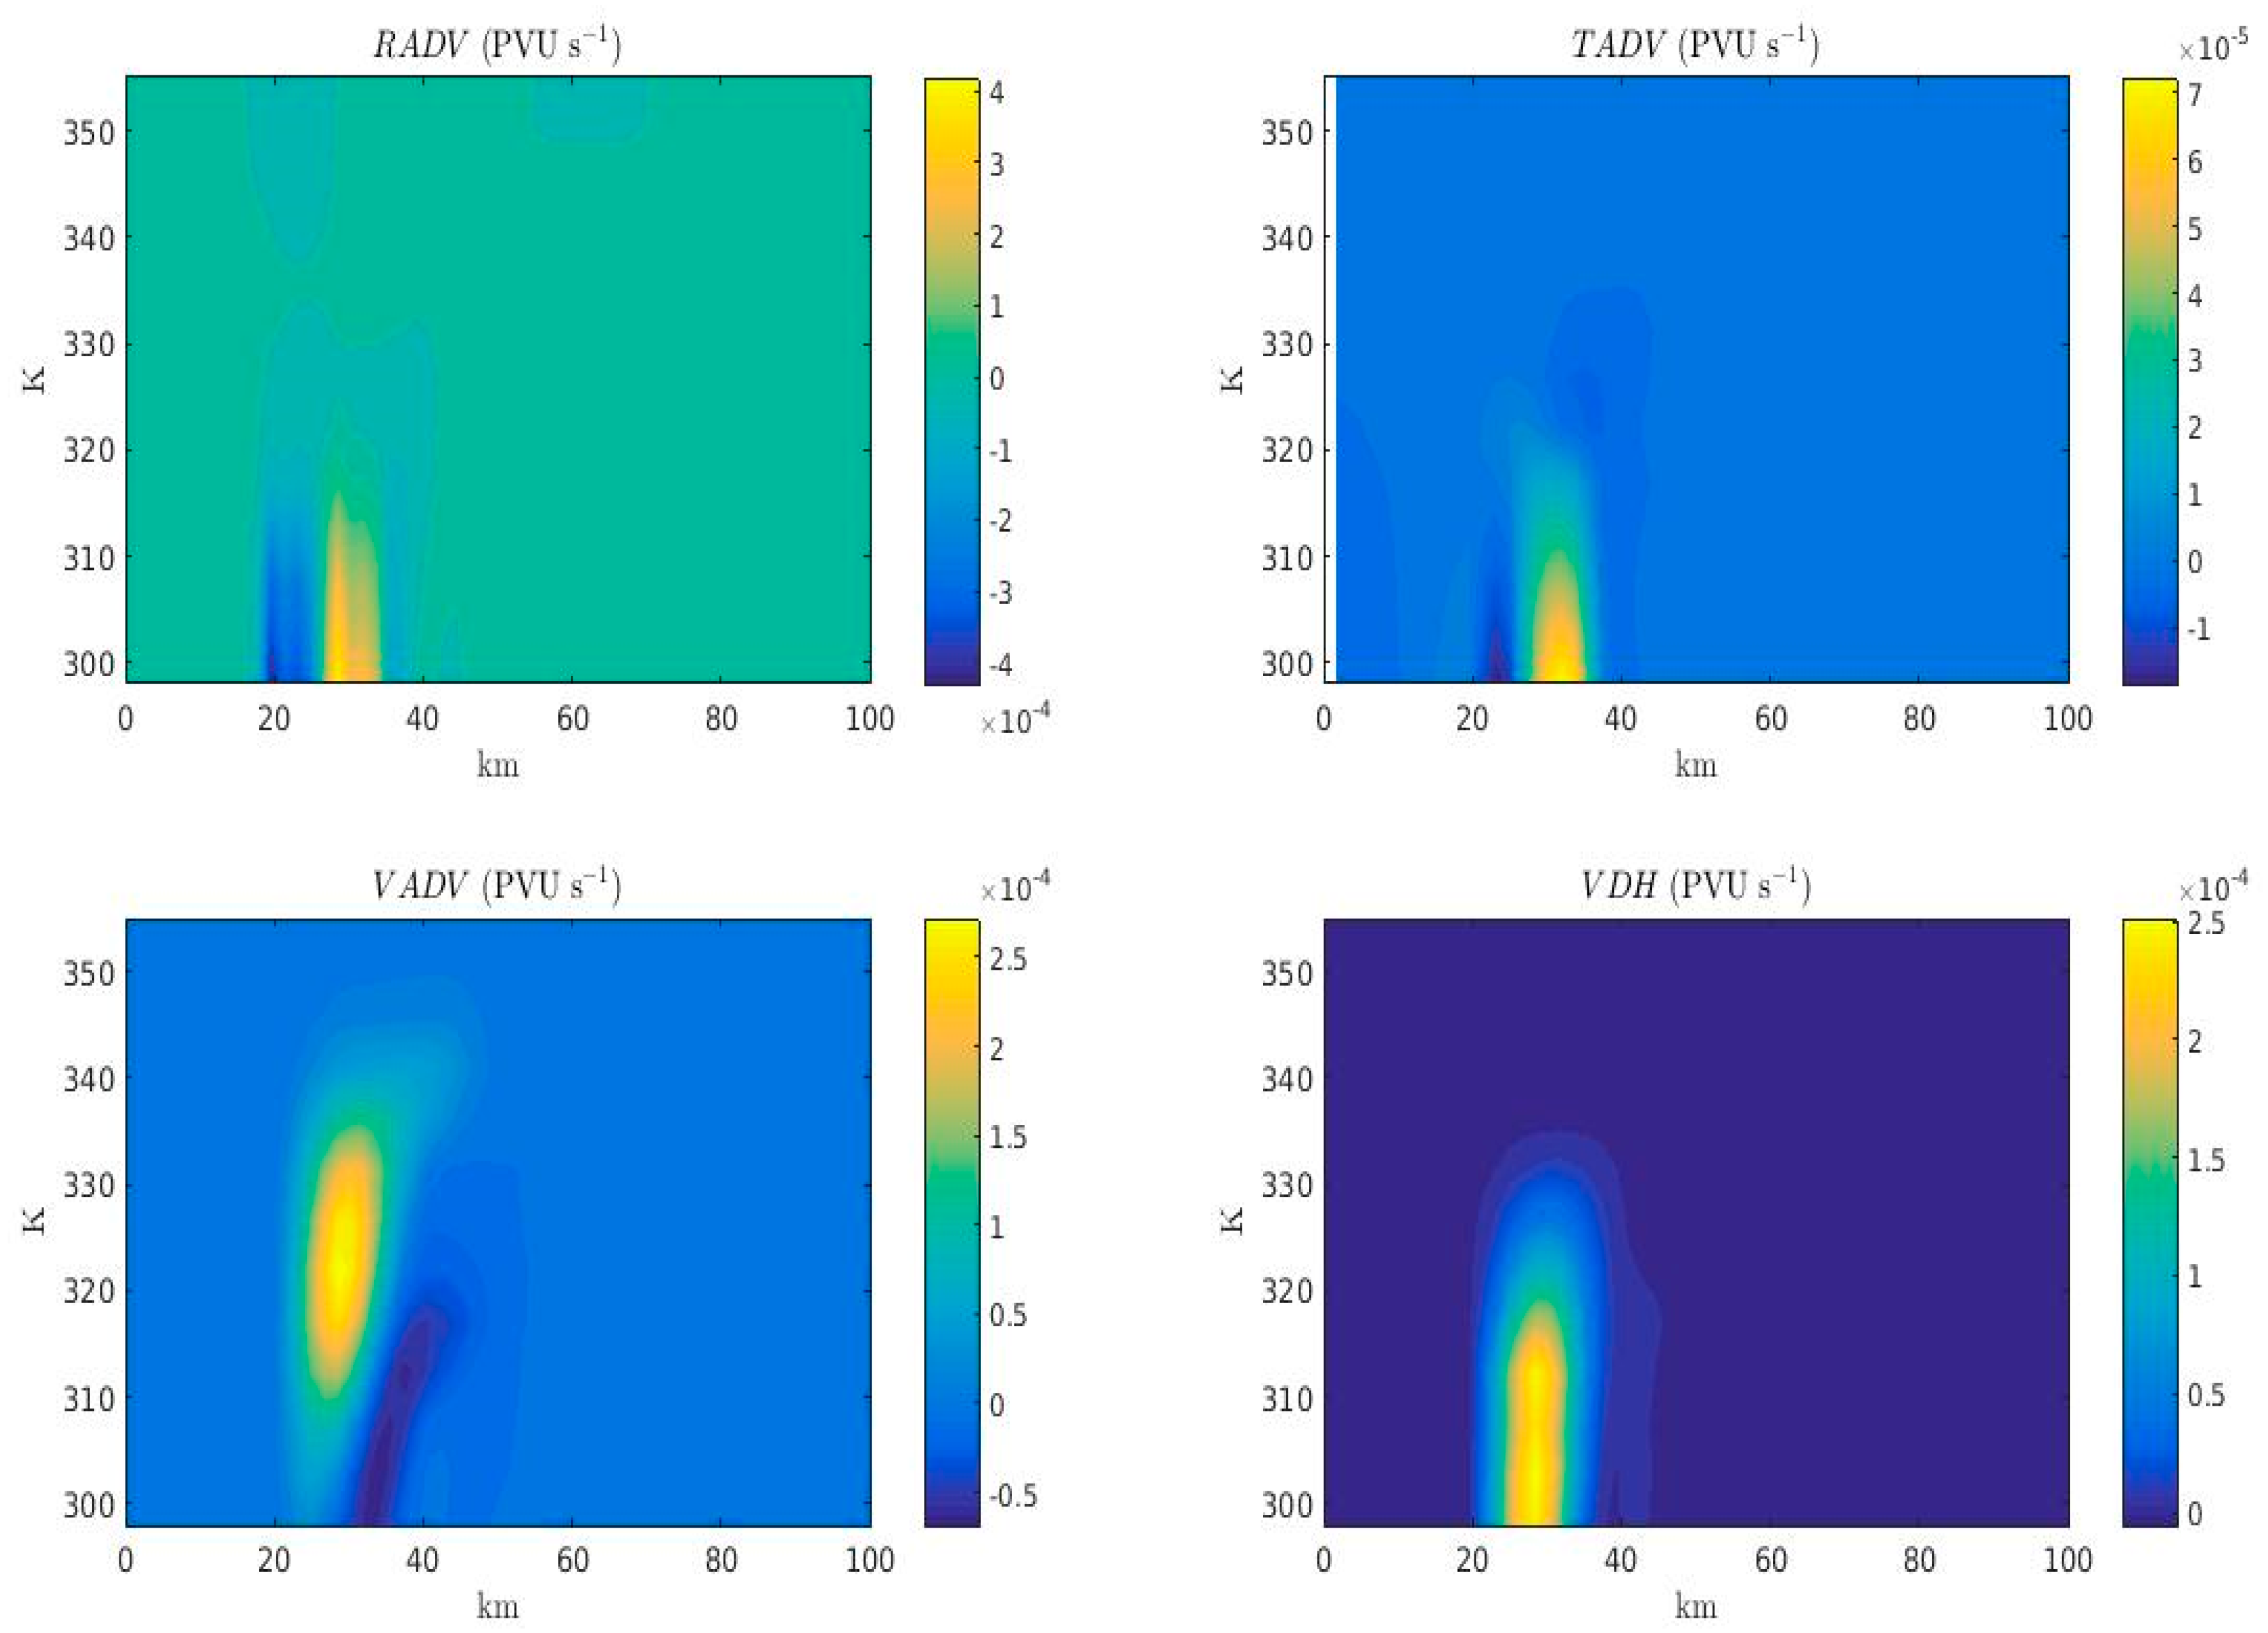
It is important to note that hollow tower structure does not breakdown during the initial intensification period, although the linear stability analysis of [1] indicates that vortex at satisfies the necessary condition of Charney-Stern instability. However, as the secondary circulation weakens, the vortex begins to breakdown at as shown in Figure 4. The PV budget terms during the breakdown phase of the vortex is shown
in Figure 8. During the breakdown phase,
note that vertical diabatic heating and vertical advection terms decrease by a
factor of 2 and the azimuthal advection term plays a more significant role. The
growth of the azimuthal advection term is likely connected to the development of
vortex Rossby waves during vortex breakdown, which mixes higher-PV fluid within
the eyewall into the eye region.
This result indicates that although the heating
induces the hollow tower structure, the secondary circulation may be the
mechanism which prevents vortex breakdown. This illustrates that hollow tower
breakdown relies on a delicate balance between the strength of the
heating-induced secondary circulation and the unstable PV growth rates along
the hurricane eyewall. This helps to explain why full-physics models (which
includes condensational heating) rarely show full hollow tower breakdown.
4.2. Azimuthal Mean Angular Momentum Budget
Absolute angular momentum budgets were computed for
the evolution of this vortex. It can be shown that the equation for absolute
angular momentum in cylindrical and isentropic coordinates can be written as [9]:
where the starred variables are deviations from the mass-weighted average: and . The terms on the right hand side of Equation (18) correspond to the radial transport of angular momentum by the mean flow, the vertical transport of angular momentum by the mean flow, the vertical transport of angular momentum by the eddies, and the flux divergence of angular momentum by the eddies, respectively.
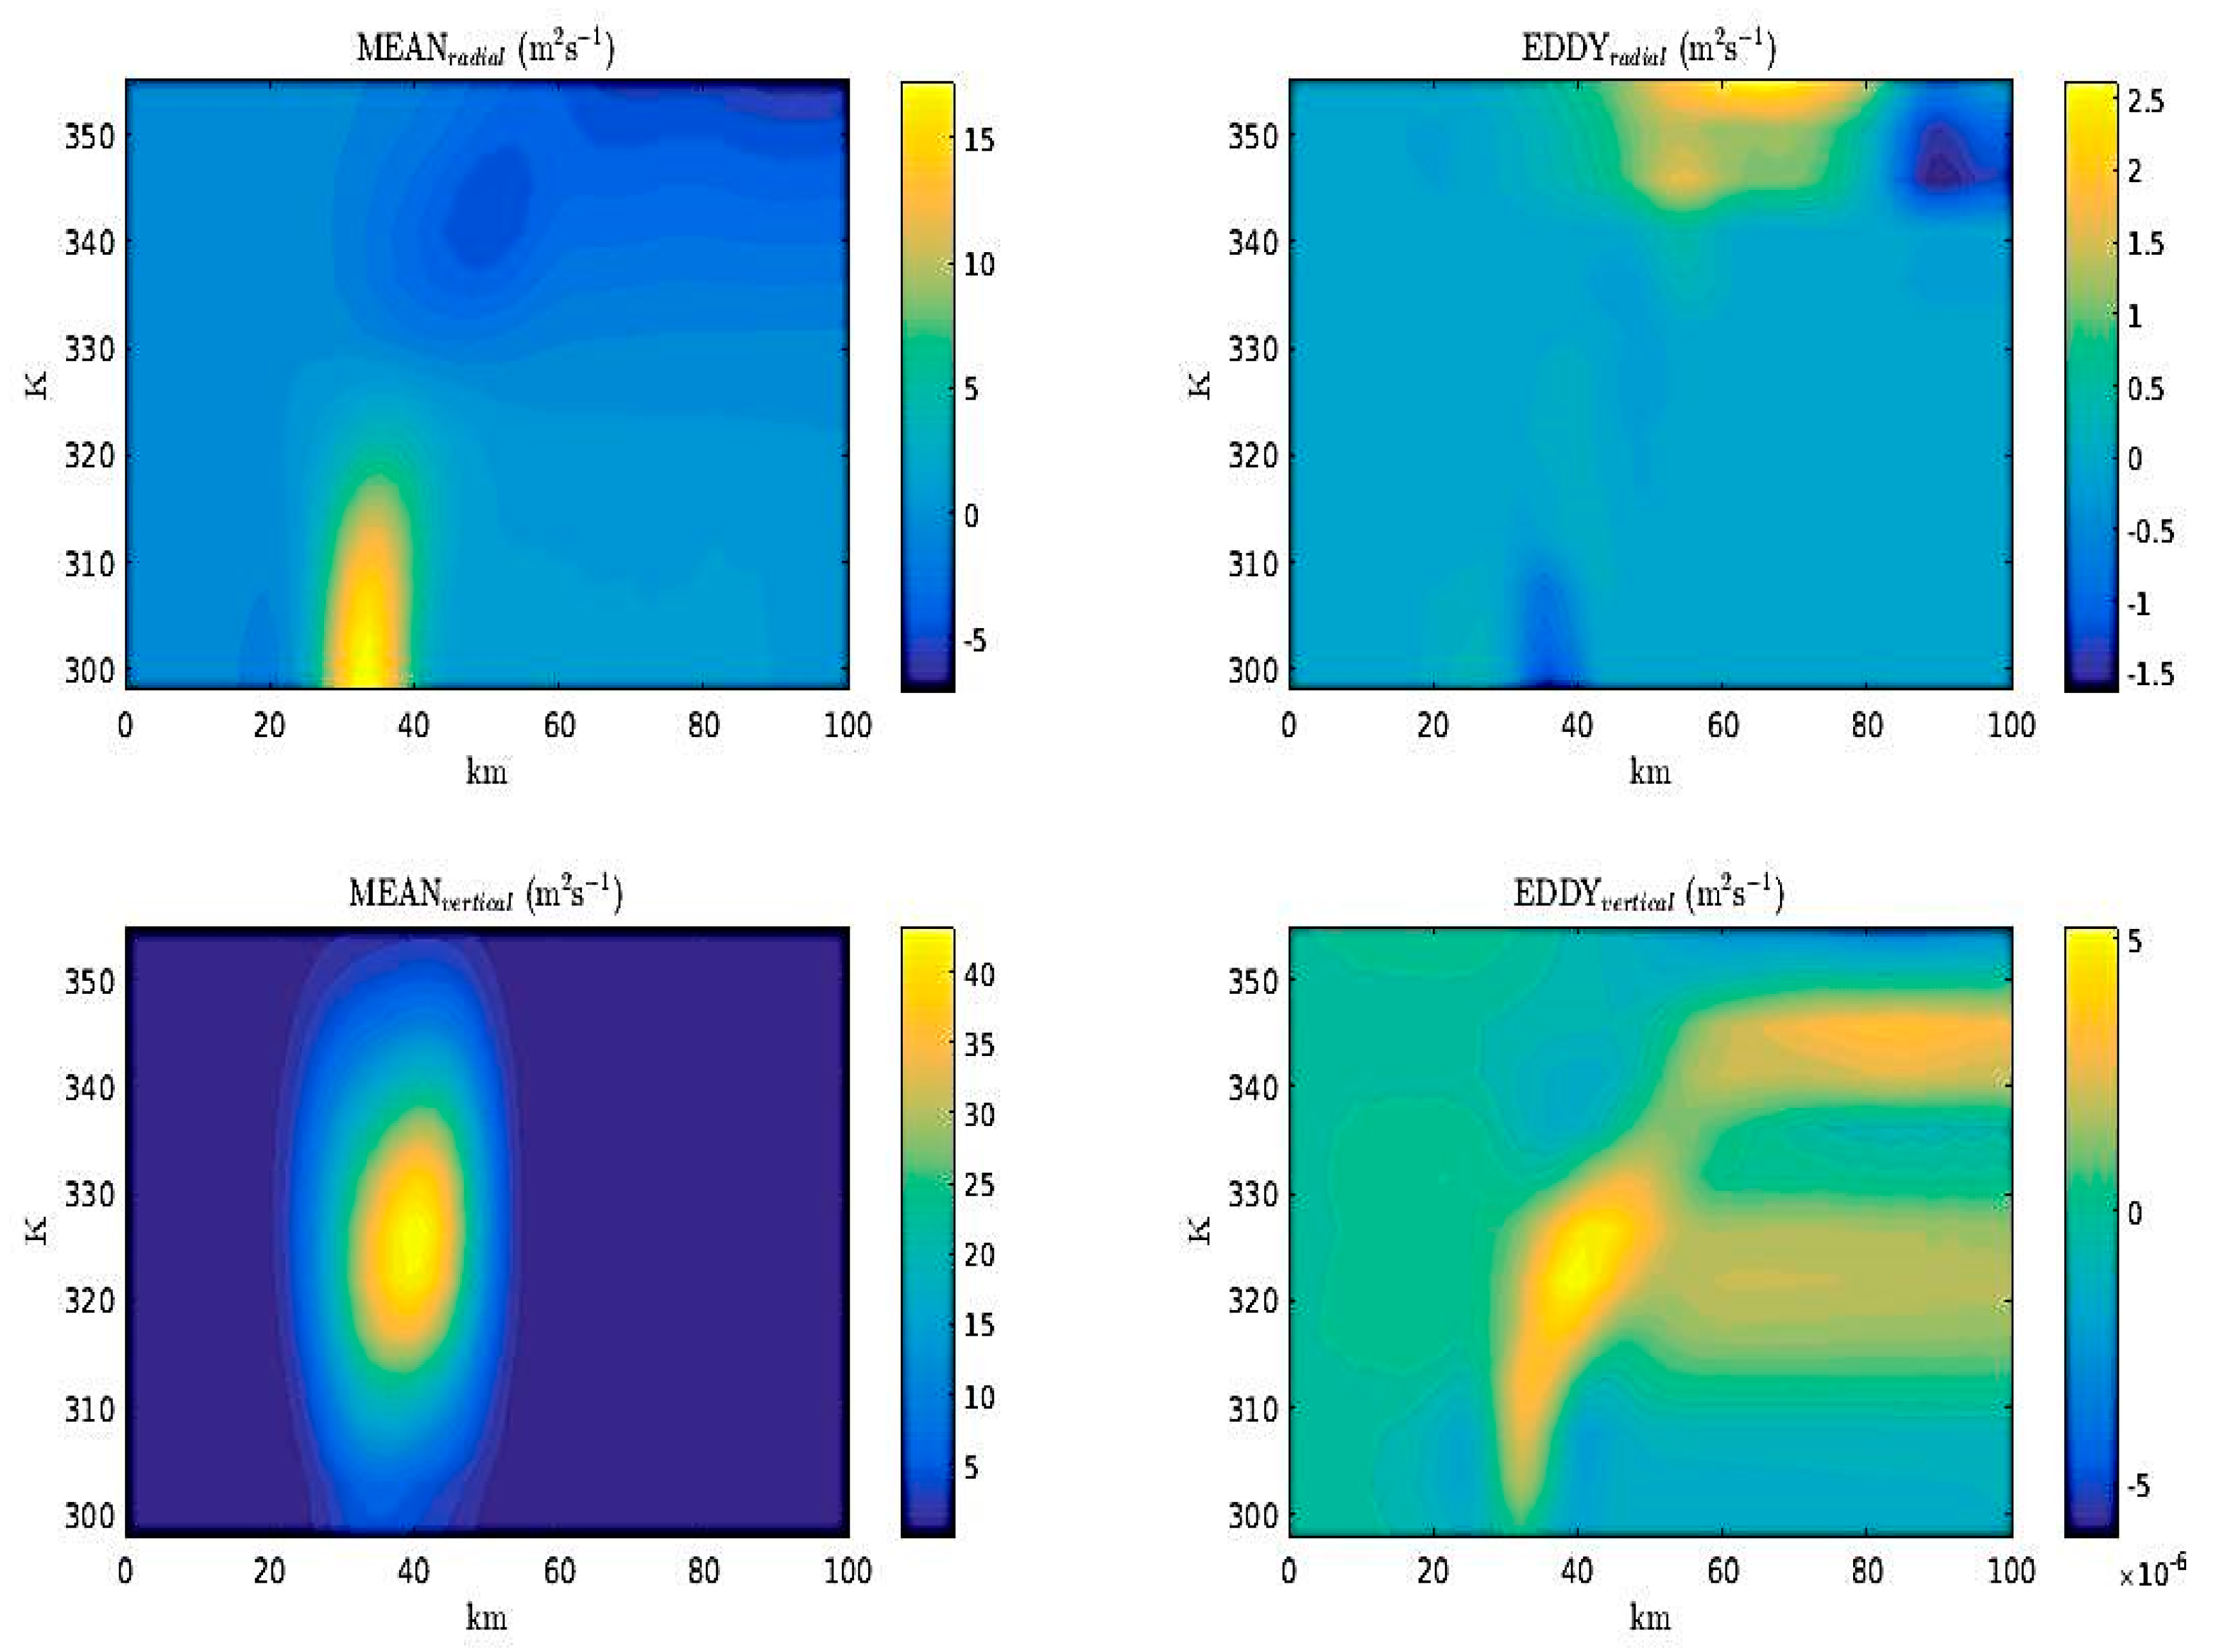
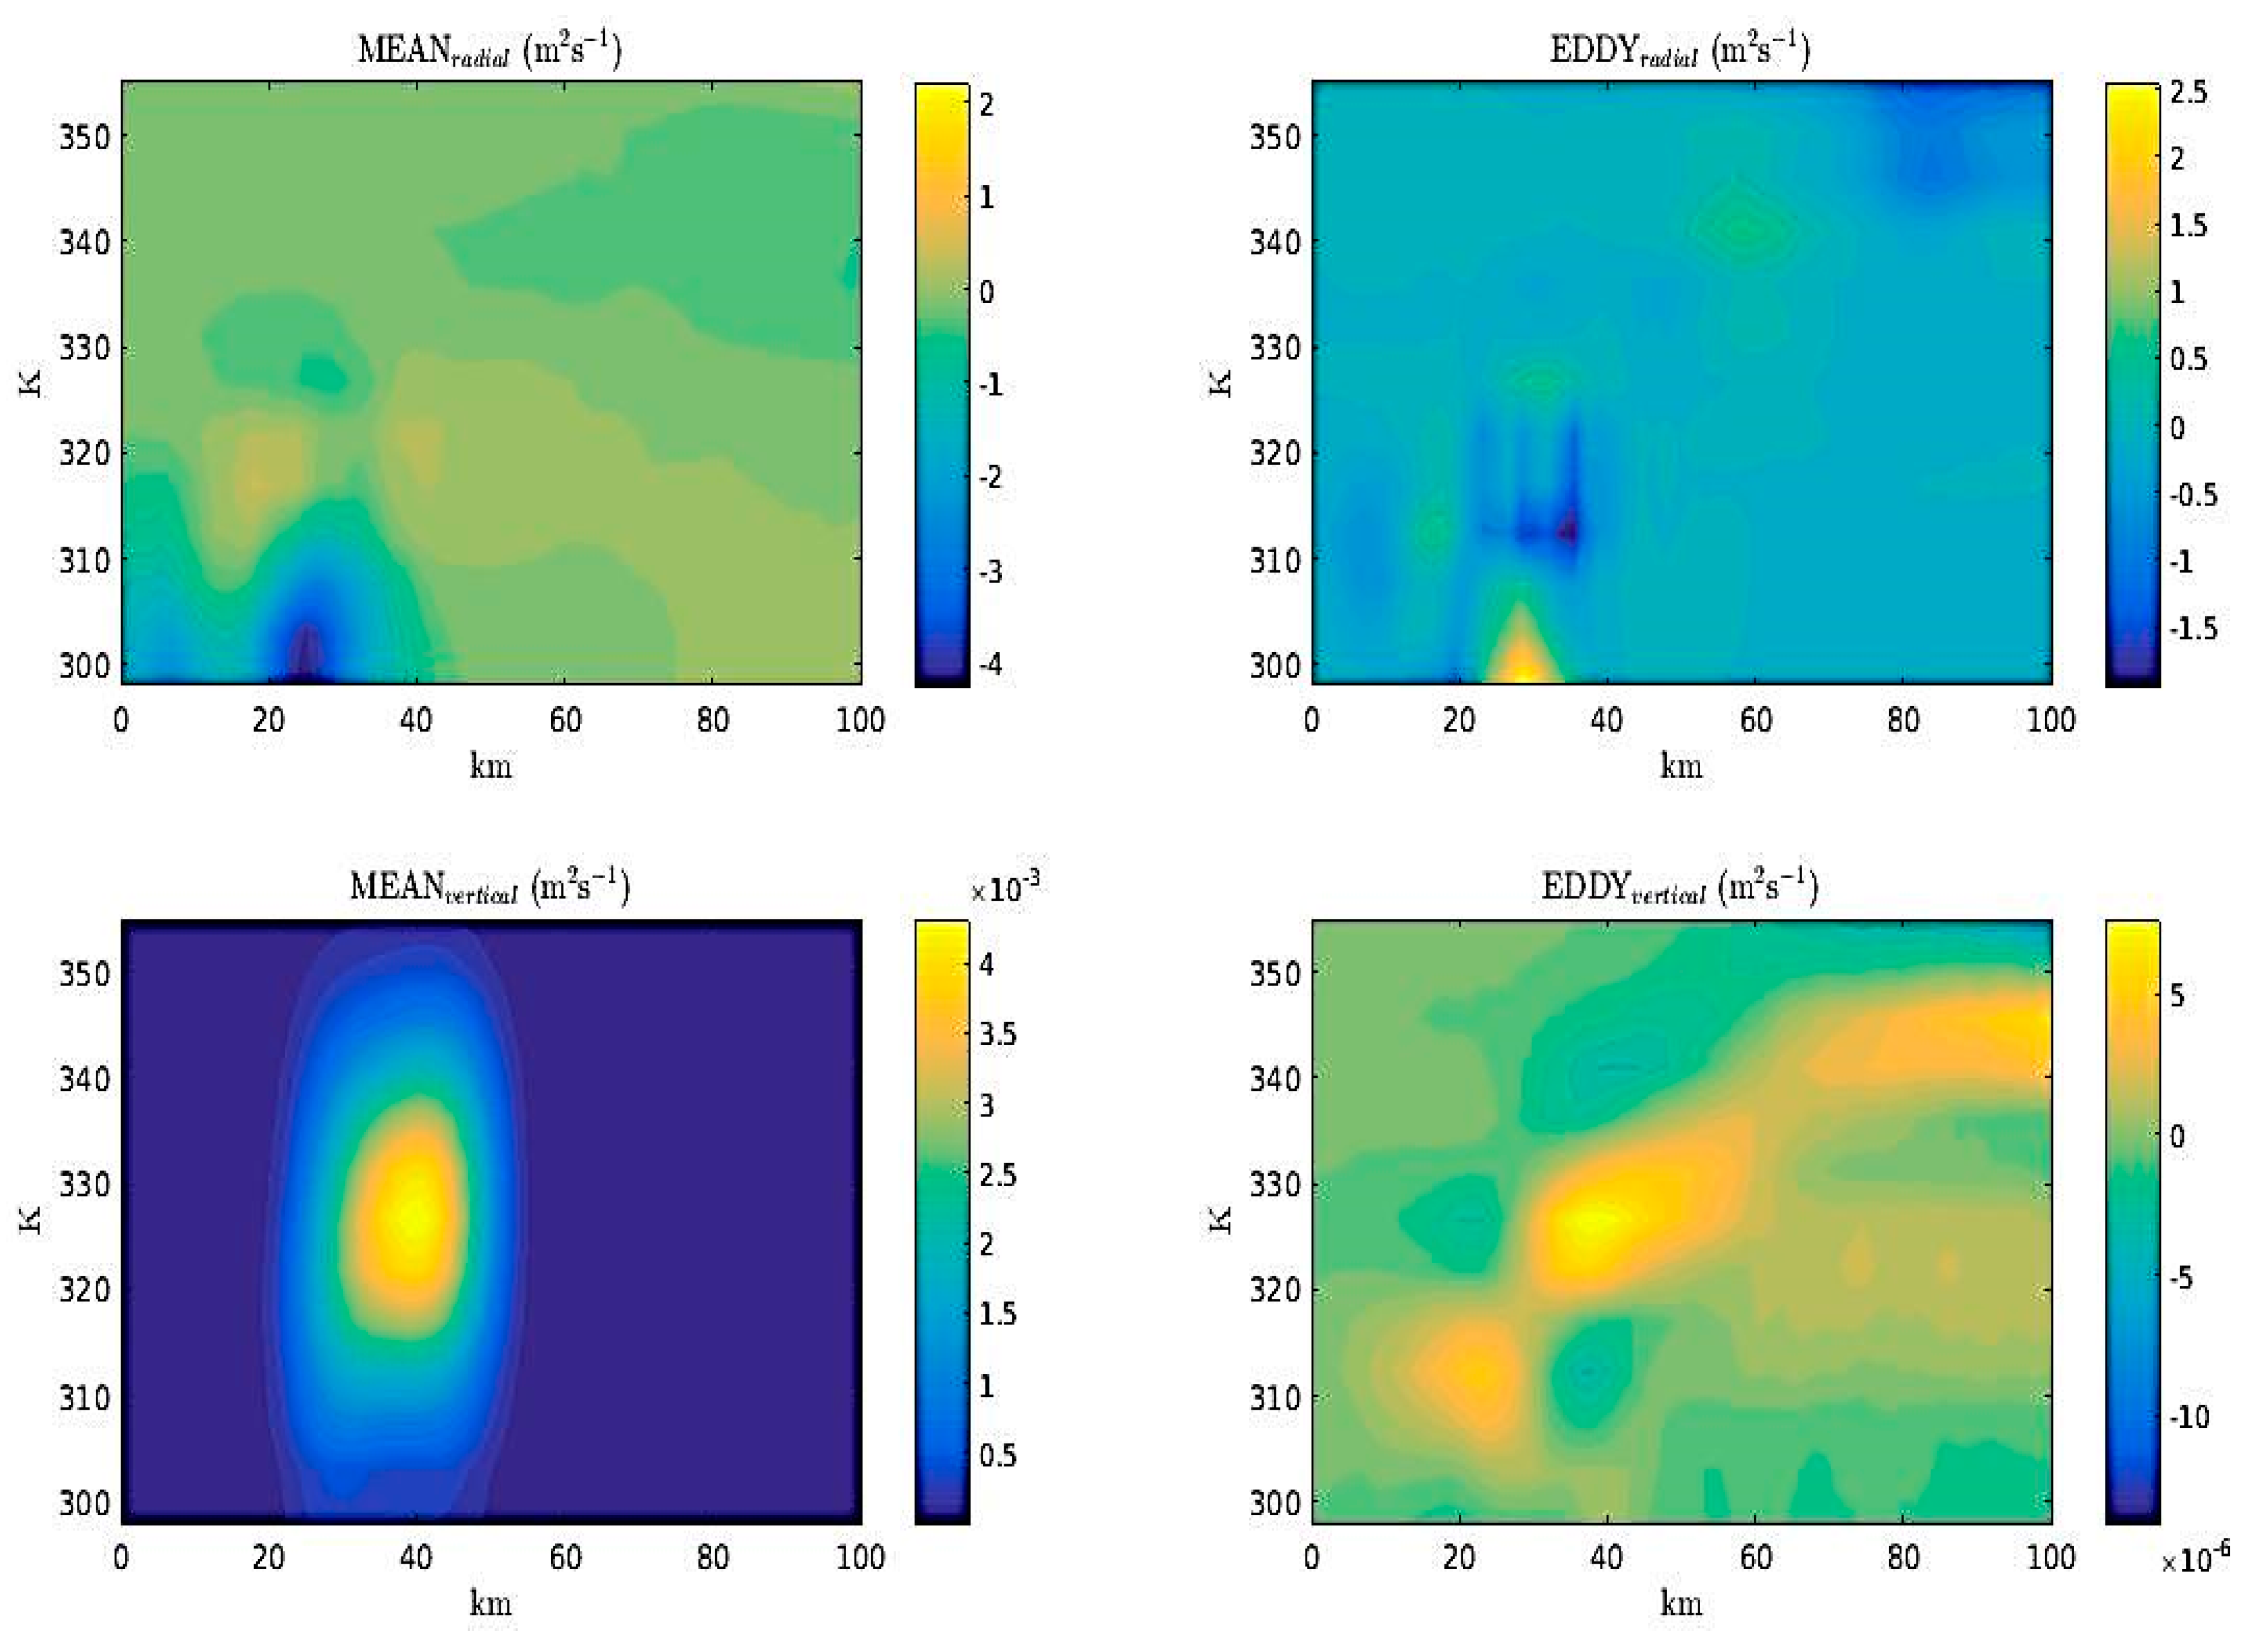
Figure 9 gives the time integrated angular momentum budget terms during the initial intensification phase. During the spin-up phase, the local increase in absolute angular momentum is primarily governed by the mean radial term and the mean vertical term. The relative weakness of the eddy terms indicate that the heating-induced secondary circulation is driving the local increase in angular momentum. Moreover, the local increase in absolute angular momentum is largely concentrated within the lower-troposphere. As the vortex begins to breakdown, the mean terms become small everywhere, wheras the eddy transport terms begin to dominate as shown in Figure 10. However, it should be noted that the vertical eddy term remains relatively small throughout the entire model simulation, indicating that eddy transport remains largely a barotropic process across isentropic surfaces. The most significant contribution to the mean angular momentum budget is at km and . The radial eddy transport term shows a spin down in the region km and K, and a spin-up in the region km and K.
Ref. [9] demonstrated that the eddy term in Equation (18) can be re-written in terms of the divergence of the Eliassen-Palm (EP) flux vector: , where , given by:
By definition, the radial component of is connected to radial transport of eddy cyclonic angular momentum, whereas the vertical component of is analogous to a radial eddy heat flux term in pressure coordinates. Therefore, when points outward (inward), eddies transport cyclonic angular momentum inward (outward), whereas when points upward (downward), eddy heat is transported radially inward (outward). The EP flux divergence represents the impact of both eddy angular momentum and eddy heat flux on the azimuthal-averaged angular momentum. It is interpreted as an eddy forcing on the mean flow and can be computed to estimate the wave—mean flow interaction. Based on relative weakness of the vertical transport terms to the radial transport terms as shown in Figure 10, the EP flux divergence is dominated by eddy angular momentum transport rather than eddy heat flux, illustrating that the re-arrangement of PV within the vortex is largely driven by adiabatic dynamics within the TC inner core region.
This has important implications for understanding the nature of PV mixing associated with our experiment. Figure 9 demonstrates that axisymmetric heating has a dominant contribution to the mean term in the heating region. As the diabatic heating produces PV and initiates convergence, the azimuthal circulation is increased in this region, as shown in Section 3. Outside of the heating region, the increase is not as significant due to the axisymmetric inward radial advection of lower-PV fluid. Essentially, the vorticity is increased (decreased) in the inner (outer) region of the diabatic heating due to the combination of the diabatic heating and radial PV advection. Therefore, as the vortex breaks down during barotropic instability, PV is fluxed in an asymmetric manner from the eyewall to the eye. Thus, the wave-mean flow interaction here results from the divergence of radial eddy angular momentum flux.
As PV is mixed from the eyewall to the eye during the breakdown phase, the outer eye is spun up at the expense of the eyewall. Therefore, the net effect of the forced evolution and instability is to increase the tangential momentum in a large region in the inner core first through axisymmetric heating and then through flux convergence by the eddies. The heating-induced secondary circulation increases the angular momentum for as shown in Figure 2 and Figure 3, as contours of absolute angular momentum are drawn inward, whereas the radial eddy transport continues to contours of absolute angular momentum inward.
4.3. Azimuthal Mean Radial Velocity Budget
The influence of the induced secondary circulation can be further understood by examining the radial velocity budget. It can be shown that the equation for the azimuthally mean radial velocity in cylindrical coordinates and isentropic coordinates is given by [9]
where . The terms on the left hand side of Equation (20) correspond to the mean radial velocity tendency, radial advection of the azimuthal mean radial velocity, vertical advection of the azimuthal mean radial velocity, and the agradient force associated with the mean flow, respectively. The right hand side has been grouped together as the eddy terms. From our analysis of the azimuthal mean absolute angular momentum budget, it is expected that the last term on the right hand side of Equation (20) will be negligible compared to other terms.
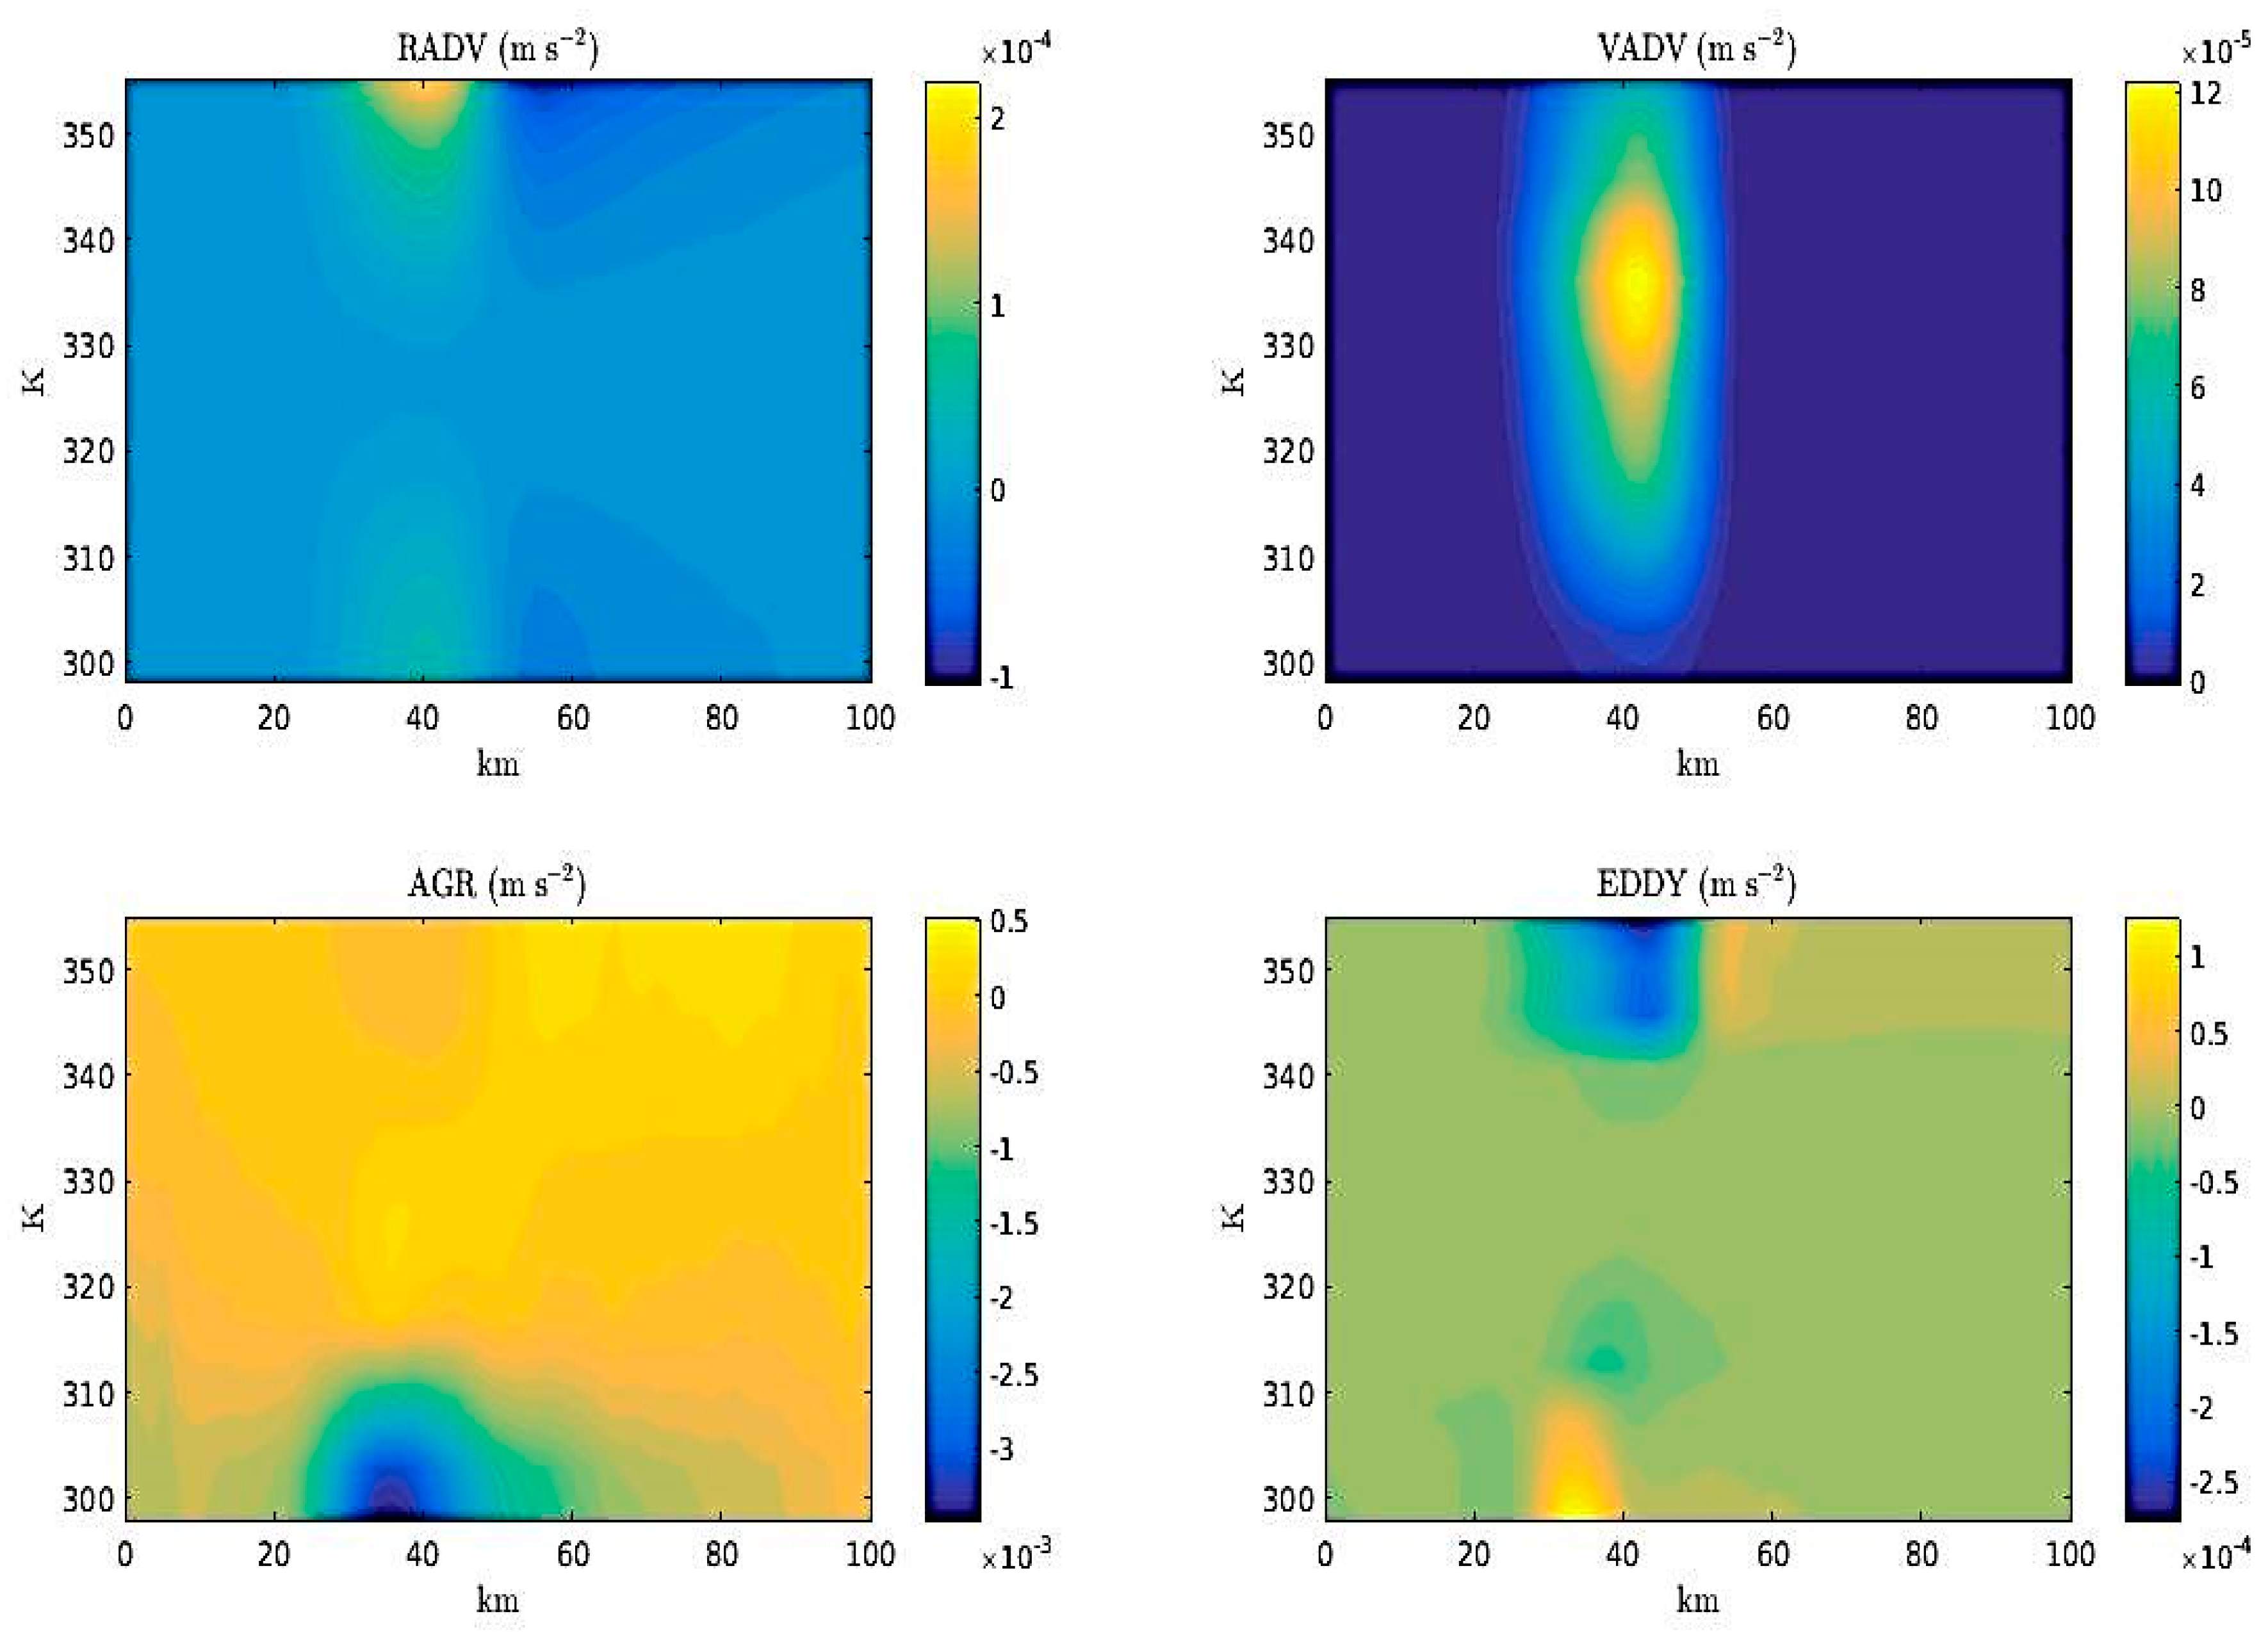
Figure 11 gives the time integrated azimuthally-averaged radial velocity budget terms during the initial intensification phase. Consistent with our previous analysis, the local increase in radial velocity is primarily governed by the mean terms in the budget analysis. In particular, the agradient force produces a deceleration of air parcels within the lower troposphere, which causes low-level convergence within the vortex. As air parcels approach the eyewall, they are advected upwards as illustrated by the strength of the vertical advection term within the midtroposphere in Figure 11. In the upper troposphere, radial advection of the azimuthal-mean radial velocity is largely offset by eddy flux divergence within the same region.
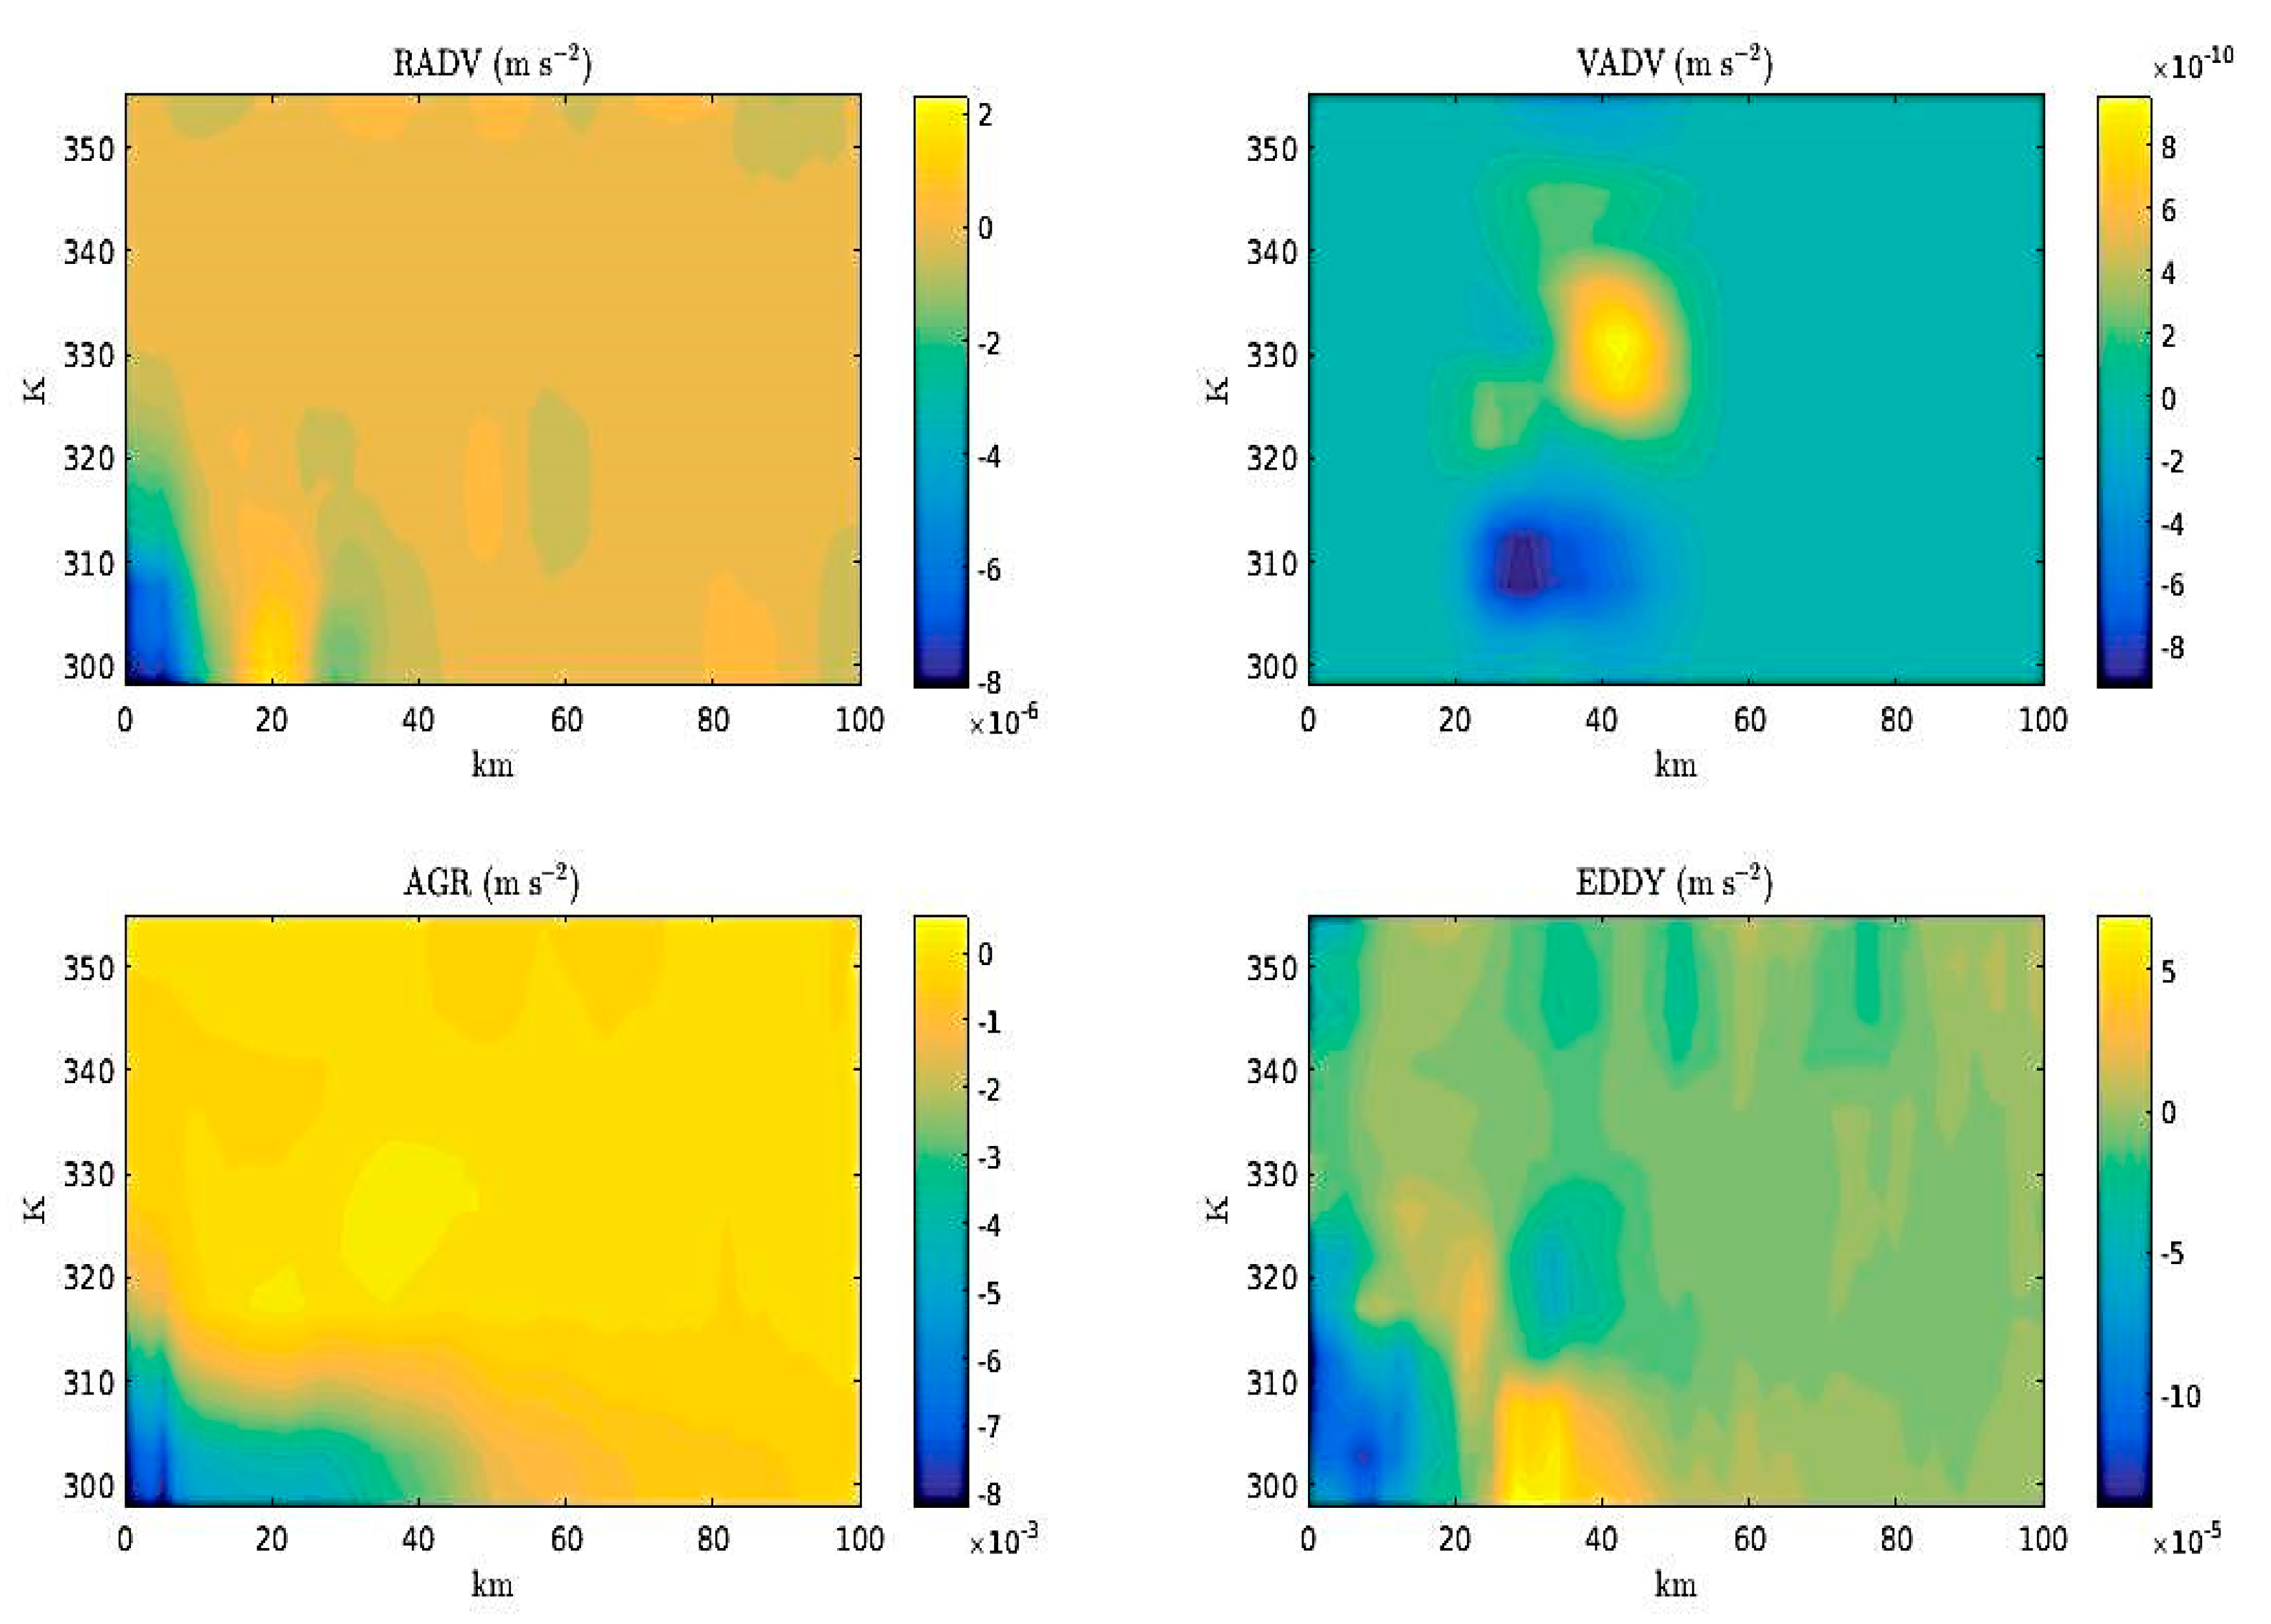
During the breakdown phase, the local change in azimuthal-mean radial velocity is dominated by the agradient force term and the eddy term, as shown in Figure 12. Within the region K, the eddy term is positive for km and negative for km. Comparing Figure 12 to Figure 10, we see that the eddies continue to flux higher-PV inward towards the eye of the vortex, with vertical transport playing a negligible role. As mentioned previously, the inward eddy flux of PV helps to spin-up the vortex within the eye region.
4.4. Azimuthal Mean Eddy Kinetic Energy Budget
To further illustrate the role of eddy processes in the evolution of the vortex, we can examine the eddy kinetic energy budget. By analyzing the eddy kinetic energy budget, one can indicate the flow of kinetic energy between the mean flow and the eddies. In addition, a direct comparison between the barotropic and the baroclinic energy conversion terms further allows us to determine the nature of the dominant energy exchange process. Following [31], the azimuthally averaged eddy kinetic energy budget equation in cylindrical and isentropic coordinates is given by
The terms on the right hand side of Equation (21) correspond to the flux divergence of by the mean flow; the flux divergence of by the eddies; the barotropic energy conversion from the mean vortex that is associated with the azimuthal mean flow; the barotropic energy conversion associated with the mean radial flow; the baroclinic energy conversion associated with the mean azimuthal flow and mean radial flow; and the eddy potential energy conversion, respectively.
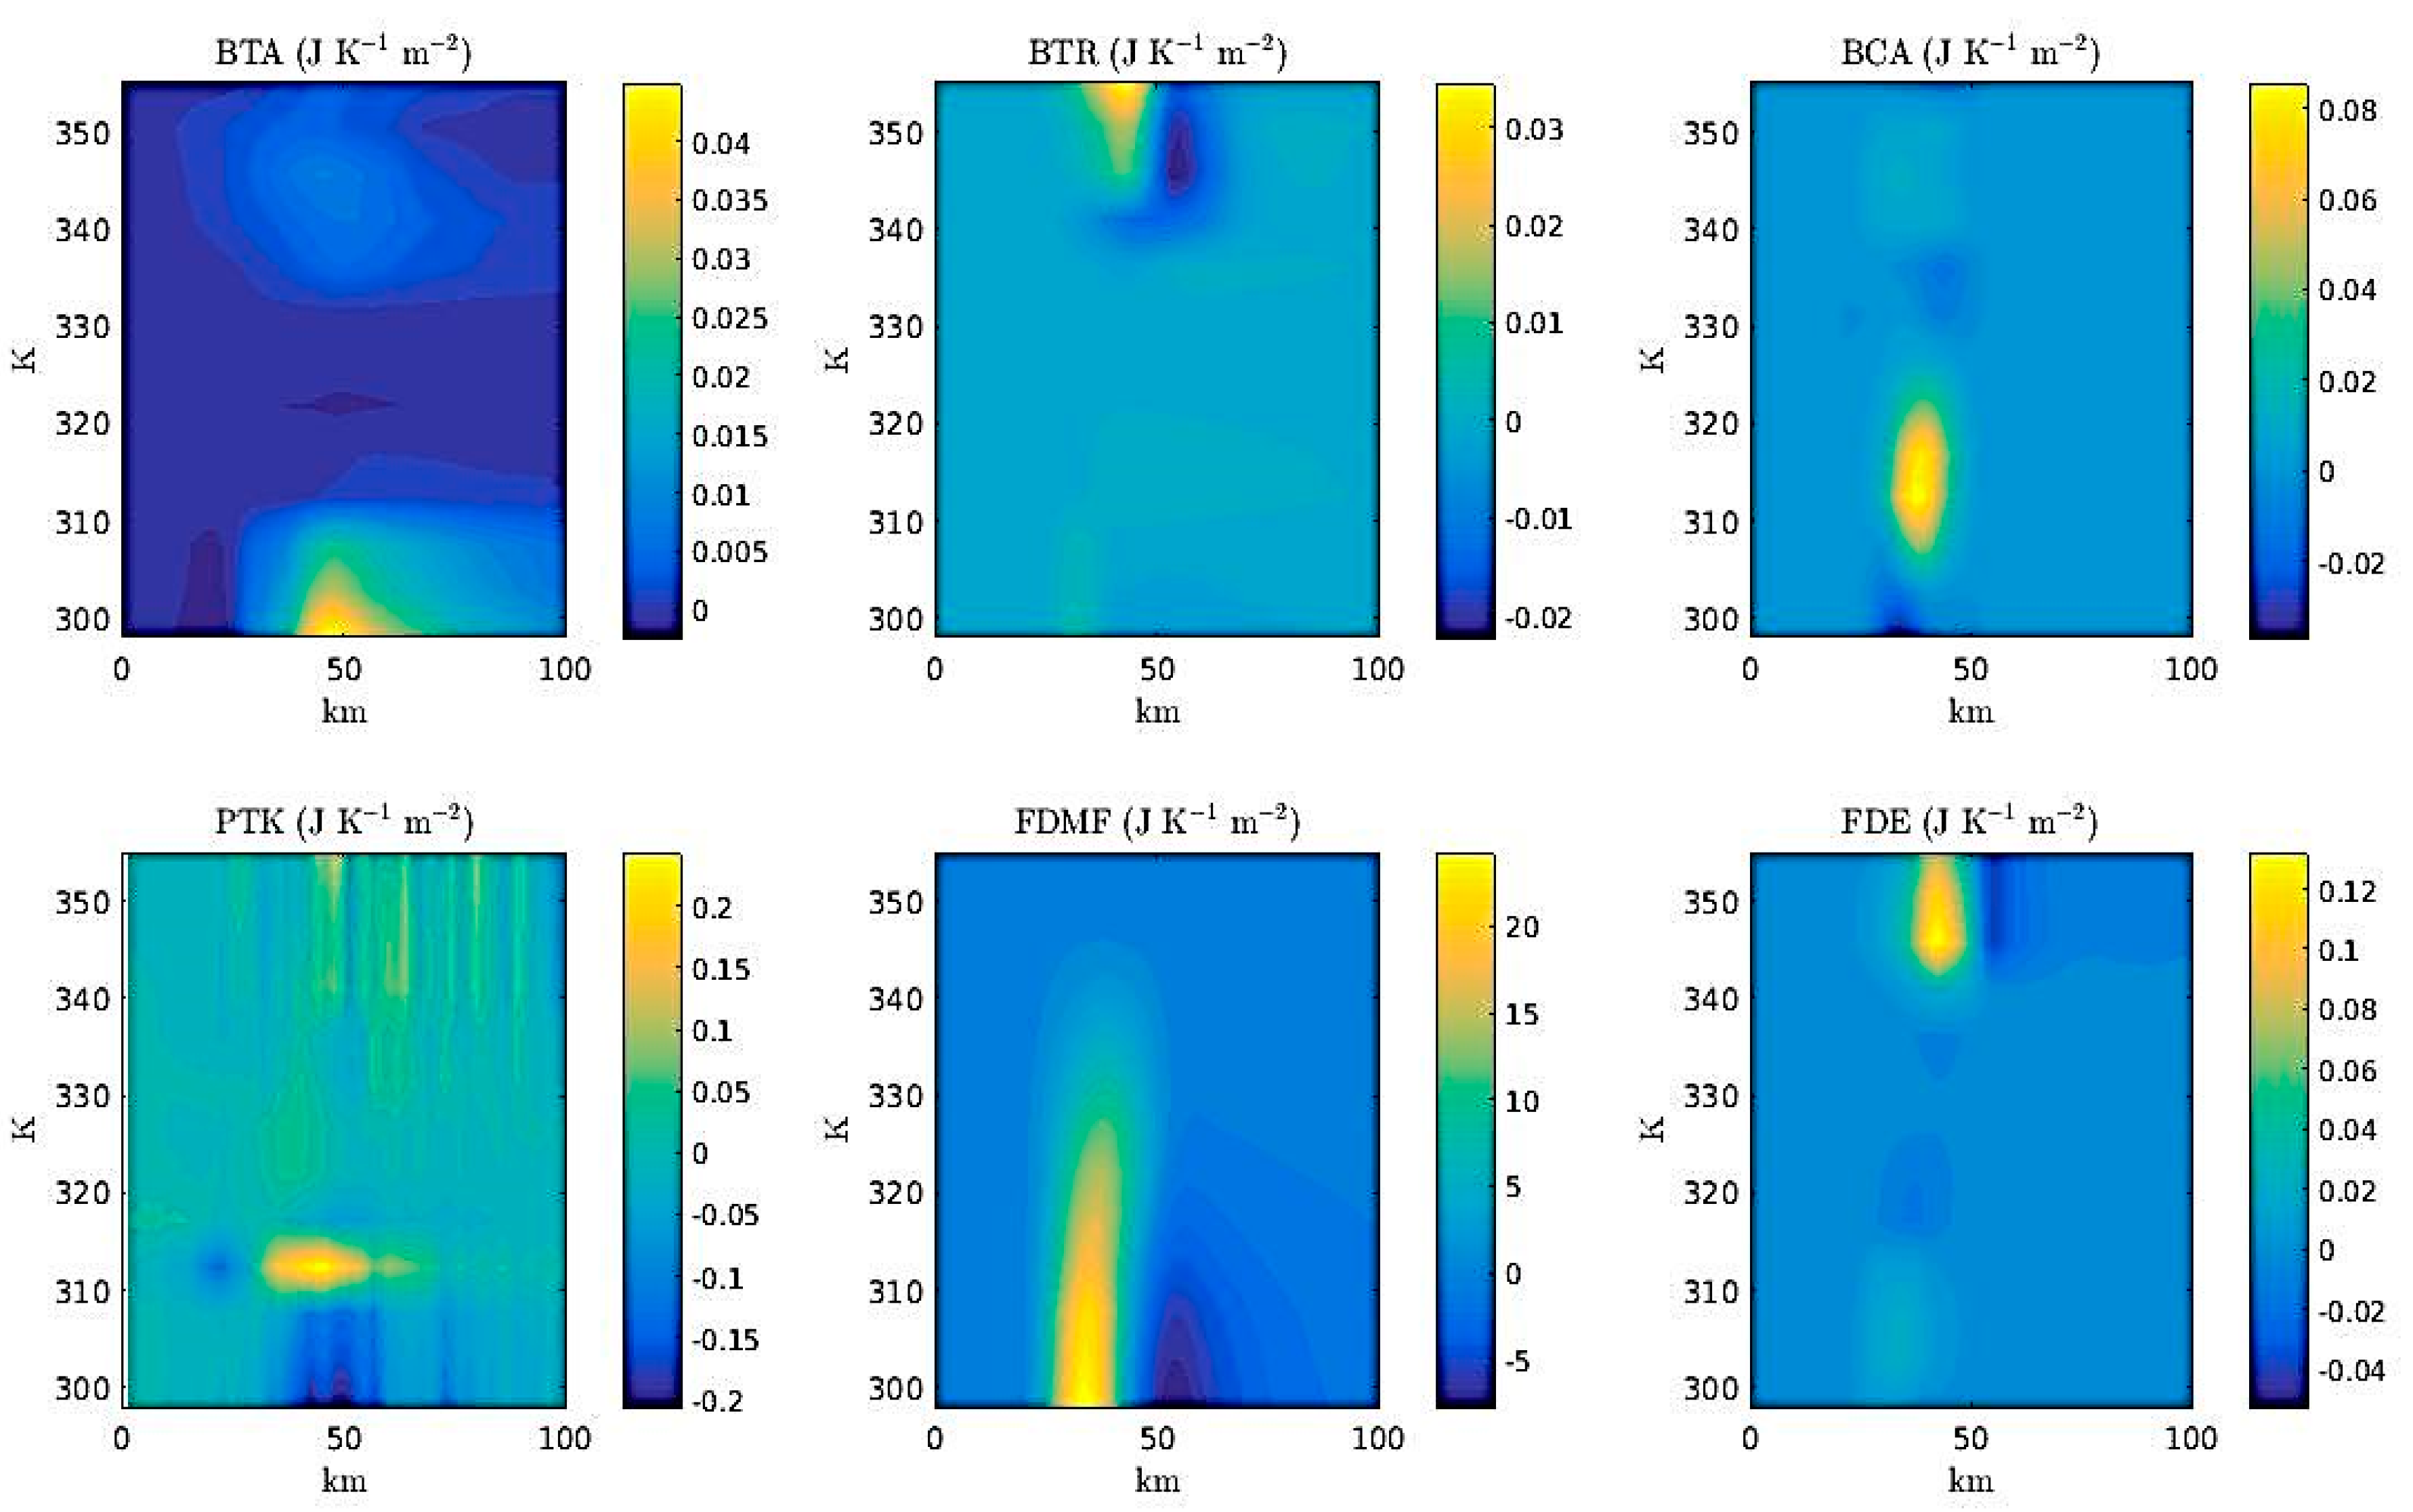
During the initial intensification stage of the vortex, the primary sources for eddy kinetic energy come from FDMF term and the PTK term, as shown in Figure 13. In the mid-lower troposphere, flux divergence of eddy kinetic energy due to the azimuthal mean vortex transports eddy kinetic energy inward from outside the radius of maximum winds, whereas the eddies transport eddy kinetic inward in the upper-troposphere. Within the lower-troposphere, the conversion of eddy kinetic energy to eddy potential energy is more than offset by the flux divergence of . It should also be notes that barotropic energy conversion by the mean vortex dominates over baroclinic energy conversion within the lower troposphere. However, within the mid-troposphere, baroclinic energy conversion, which is connected to heating-induced secondary circulation discussed previously.
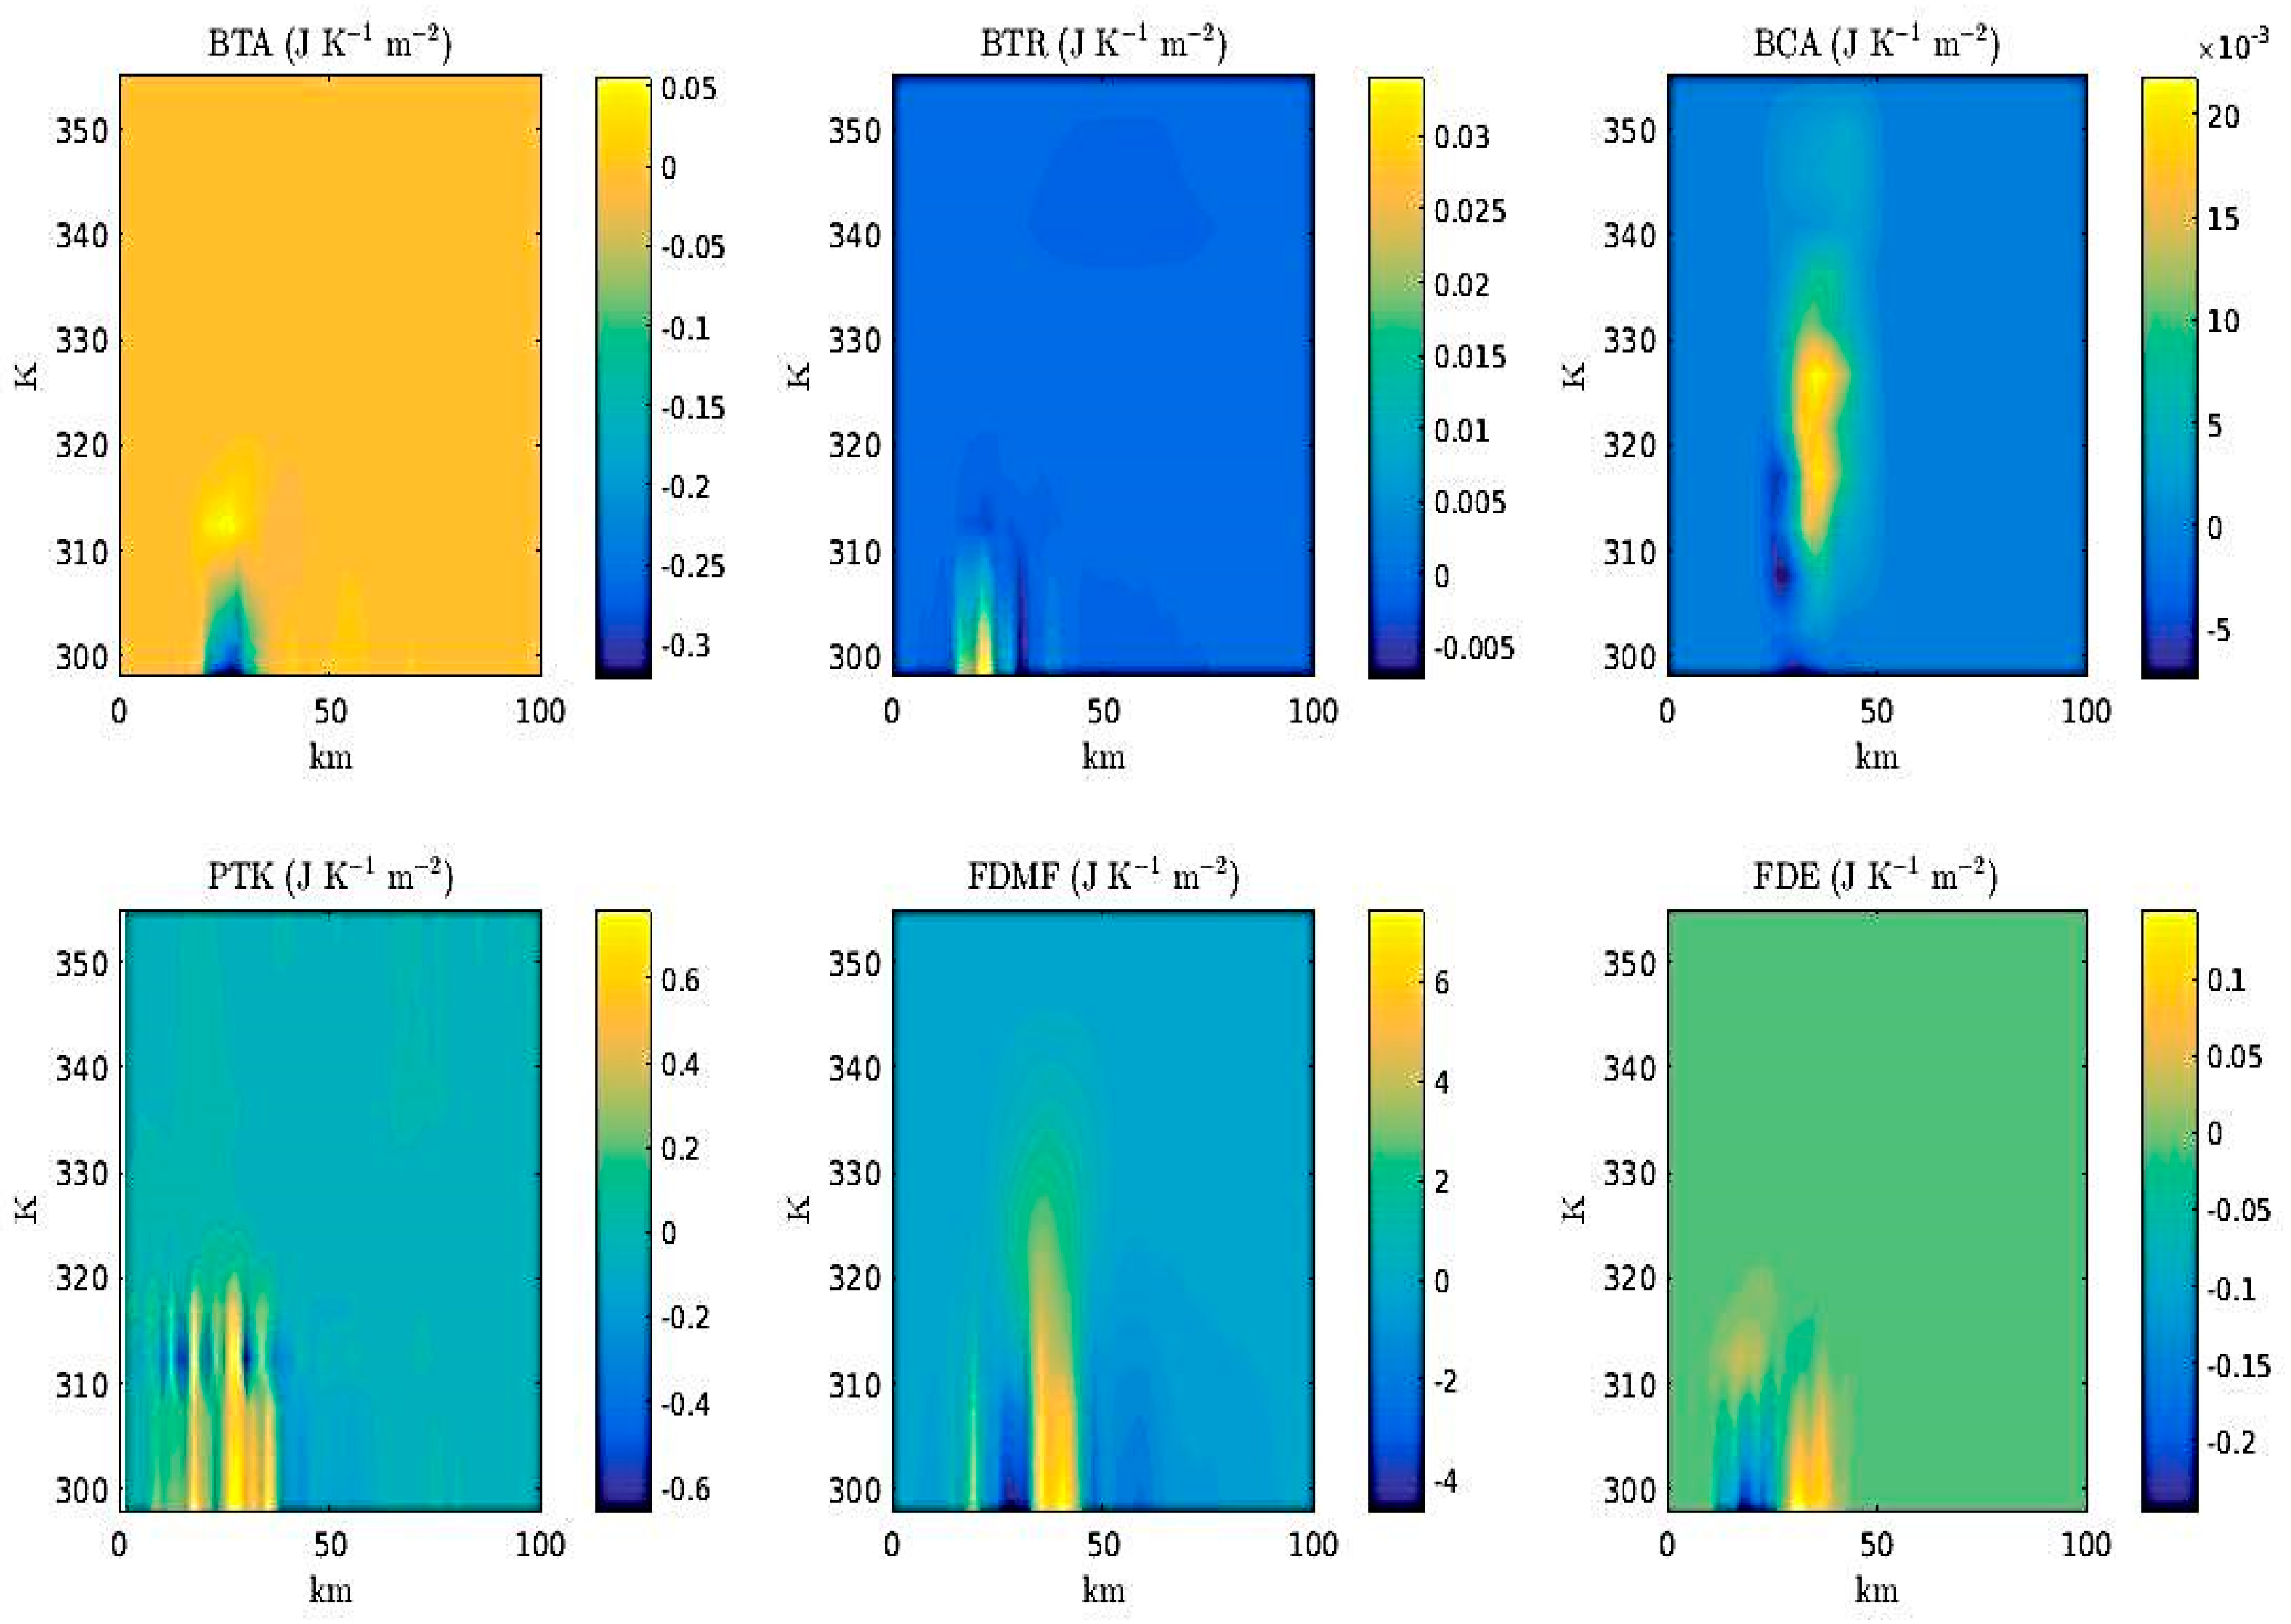
During the breakdown of the vortex, the eddy kinetic energy corresponds to the kinetic energy associated with vortex Rossby wave propagation. As discussed previously, flux divergence of the eddy kinetic energy (due to both the azimuthal flow and the eddies themselves) transports eddy kinetic energy inward and eddy potential energy conversion continues to remain an important energy source. However, the eddy kinetic energy budget is very different during vortex breakdown as shown in Figure 14. In the lower troposphere, eddies give their kinetic energy to the mean vortex through barotropic conversion, which damps the eddies. The large eddy damping in the lower levels is consistent with the fact that the strongest horizontal shear of the mean azimuthal flow occurs at the surface. Furthermore, the PTK term is largely positive over this region, indicating that eddy potential energy is an important source of maintaining the energy for vortex Rossby waves during vortex breakdown. Moreover, the baroclinic processes are not as important as the barotropic processes in converting kinetic energy during vortex breakdown. It can be said that the energy stored in the mean vortex during the initial intensification phase is released during vortex breakdown and the axisymmetrization of the vortex damps the energy associated with the vortex Rossby waves over time. This further confirms that the vortex breakdown is largely driven by barotropic processes, whereas the maintenance of the vortex structure is largely driven by axisymmetric dynamics.
5. Conclusions
In this paper, we have examined the nonlinear evolution of a tropical storm-like vortex under parameterized diabatic heating. The primary results of this study are as follows:
- Annular heating produces a strengthening and thinning PV tower structure due to the combined effects of the heating and radial PV advection by the induced secondary circulation. Analyzing the PV budget shows that the contribution of diabatic heating to the local PV budget is largely offset by both radial and vertical PV advection (i.e., the induced secondary circulation. The secondary circulation advects low-PV fluid inward, eroding the PV at the outer edge of the heated region, consistent with [18,26].
- Although the diabatic heating creates the PV tower structure, the presence of diabatic heating in the eyewall plays an important role in maintaining the hollow PV tower. Analyzing the PV budget shows that diabatic heating generates positive PV within and outside of the heating region, providing suitable conditions for the maintenance of the PV tower. This may help to explain how mature TCs are able to maintain their hollow tower structure, consistent with [18].
- The breakdown of the hollow PV tower depends on a balance between unstable PV wave growth rates and the strength of the secondary circulation. If the PV tower can become thin enough, inner and outer counter-propagating vortex Rossby waves interact, leading to barotropic instability and hollow tower breakdown.
- The secondary circulation contracts the outer radius of the PV tower structure, causing absolute angular momentum surfaces to move inward. Moreover, absolute angular momentum surface tilt in response to PV mixing that occurs preferentially at lower levels, where unstable PV waves grow most rapidly. This produces a PV bridge across the hurricane eye as proposed by [9].
- Analysis of the eddy kinetic energy budget suggests that barotropic energy conversion dominates during the PV mixing process in the lower-troposphere since the radial shear of the azimuthal wind are largest in this region. Furthermore, the energy stored in the mean vortex during the intensification process is extracted during barotropic instability and the axisymmetrization process damps the eddy kinetic energy during vortex break down.
- Absolute angular momentum and radial velocity budgets indicate that eddies flux PV inward and that this eddy-induced radially inward PV flux is the dominant process in spinning up the vortex in the lower-troposphere inside the initial radius of maximum wind. This illustrates that PV mixing events complement the symmetric vortex intensification process.
Although this paper extends the study of [26] to the next level of complexity toward the real atmosphere, this idealized experiment remains an oversimplification of the real atmosphere. Future work will first focus on three important areas. First, future work will examine the impact of the type of parameterization for diabatic heating. Balanced vortex theory suggests that there should be a positive feedback between convective heating and vorticity tendency, which implies that the temporal structure of the forcing function is not independent of the vortex structure. Future work will examine how the radial, vertical, and temporal structure of the prescribed diabatic heating influences vortex evolution and hollow tower breakdown. Moreover, since diabatic heating can be asymmetric for a developing TC, future work will also examine the differences between symmetric and asymmetric vortex intensification in this model.
Second, future work will examine the impact of frictional processes on vortex evolution. The results from [15,26] indicate that friction should have a stabilizing effect of hollow tower breakdown by reducing the unstable PV growth rates and by altering the stretching deformation during the heating. Future work will examine how surface friction, horizontal diffusion, and vertical diffusion will impact the mean and eddy processes associated with vortex resolution. Finally, future work will examine the impact of baroclinity on vortex evolution. The vertical structure of the initial vortex (along with the vertical structure of the heating function) can impact how wave energy is transported during the breakdown of a vortex. Recent work has shown that excited vortex Rossby waves can either be trapped vertically and behave similar to barotropic donditions or effectively propagate upward with suppressed radial propagation based upon the specific structure of the vortex basic-state baroclinicity and the heating function [32]. Future work will examine how the internal asymmetric processes will evolve during hollow tower breakdown.
Acknowledgments
The calculations were made on a Linux workstations generously provided from the College of Charleston. The funding from this work comes from the Collge of Charleston.
Conflicts of Interest
The author declares no conflict of interest.
Abbreviations
The following abbreviations are used in this manuscript:
| MDPI | Multidisciplinary Digital Publishing Institute |
| DOAJ | Directory of open access journals |
| TLA | Three letter acronym |
| LD | linear dichroism |
Appendix A. Derivation of Azimuthal Mean Eddy Kinetic Energy Equation
The horizontal momentum equations and the mass continuity equation can be written in cylindrical coordinates and isentropic coordinates as
where is the radial velocity and is the azimuthal velocity. The kinetic energy, azimuthal mean kinetic energy, and eddy kinetic energy are defined, respectively, as
Multiplying (A1) by , multiplying (A2) by , and adding the resulting equations gives
Using the mass continuity equation, (A5) can be written as
Azimuthally averaging the momentum equations and then following the same procedure described above, the evolution equation for the azimuthal mean kinetic energy is given by
Subtracting (A7) from (A6) and then azimuthally averaging the resulting equation gives the azimuthally averaged eddy kinetic energy equation
References
- Schubert, W.H.; Montgomery, M.T.; Taft, R.K.; Guinn, T.A.; Fulton, S.R.; Kossin, J.P.; Edwards, J.P. Polygonal eyewalls, asymmetric eye contraction, and potential vorticity mixing in hurricanes. J. Atmos. Sci. 1999, 56, 1197–1223. [Google Scholar] [CrossRef]
- Kossin, J.P.; Schubert, W.H. Mesovortices, polygonal flow patterns, and rapid pressure falls in hurricane-like vortices. J. Atmos. Sci. 2001, 58, 2196–2209. [Google Scholar] [CrossRef]
- Nolan, D.S.; Montgomery, M.T. The algebraic growth of wavenumber one disturbances in hurricane-like vortices. J. Atmos. Sci. 2000, 57, 3514–3538. [Google Scholar] [CrossRef]
- Nolan, D.S.; Montgomery, M.T. Nonhydrostatic, three-dimensional perturbations to balanced, hurricane-like vortices. Part I: Linearized formulation, stability, and evolution. J. Atmos. Sci. 2002, 59, 2989–3020. [Google Scholar] [CrossRef]
- Terwey, W.D.; Montgomery, M.T. Wavenumber-2 and wavenumber-m vortex Rossby wave instabilities in a generalized three-region model. J. Atmos. Sci. 2002, 59, 2421–2427. [Google Scholar] [CrossRef]
- Rozoff, C.M.; Schubert, W.H.; McNoldy, B.D.; Kossin, J.P. Rapid filamentation zones in intense tropical cyclones. J. Atmos. Sci. 2006, 63, 325–340. [Google Scholar] [CrossRef]
- Kwon, Y.; Frank, W.M. Dynamic instabilities of simulated hurricane-like vortices and their impacts on the core structure of hurricanes. Part I: Dry experiments. J. Atmos. Sci. 2005, 62, 3955–3973. [Google Scholar] [CrossRef]
- Hendricks, E.A.; Schubert, W.H.; Taft, R.K.; Wang, H.; Kossin, J.P. Lifecycles of hurricane-like vorticity rings. J. Atmos. Sci. 2009, 66, 705–722. [Google Scholar] [CrossRef]
- Hendricks, E.A.; Schubert, W.H. Schubert Adiabatic rearrangement of hollow PV towers. J. Adv. Model. Earth Syst. 2010, 2, 1–19. [Google Scholar] [CrossRef]
- Menelaou, K.; Yau, M.K.; Martinez, Y. Impact of asymmetric dynamical processes on the structure and intensity change of two-dimensional hurricane-like annular vortices. J. Atmos. Sci. 2013, 70, 559–582. [Google Scholar] [CrossRef]
- Chen, Y.; Yau, M.K. Spiral bands in a simulated hurricane. Part I: Vortex Rossby wave verification. J. Atmos. Sci. 2001, 58, 2128–2145. [Google Scholar] [CrossRef]
- Yau, M.K.; Liu, Y.; Zhang, D.-L.; Chen, Y. A multiscale numerical study of Hurricane Andrew (1992). Part VI: Small-scale inner-core structures and wind streaks. Mon. Weather Rev. 2004, 132, 1410–1433. [Google Scholar] [CrossRef]
- Kwon, Y.; Frank, W.M. Dynamic instabilities of simulated hurricane-like vortices and their impacts on the core structure of hurricanes. Part II: Moist experiments. J. Atmos. Sci. 2008, 65, 106–122. [Google Scholar] [CrossRef]
- Yang, B.; Wang, Y.; Wang, B. The effect of internally generated inner-core asymmetries on tropical cyclone potential intensity. J. Atmos. Sci. 2007, 64, 1165–1188. [Google Scholar] [CrossRef]
- Wu, C.-C.; Cheng, H.-J.; Wang, Y.; Chou, K.-H. A numerical investigation of the eyewall evolution of a landfalling typhoon. Mon. Weather Rev. 2009, 137, 21–40. [Google Scholar] [CrossRef]
- Nguyen, C.M.; Reeder, M.J.; Davidson, N.E.; Smith, R.K.; Montgomery, M.T. Inner-core vacillation cycles during the intensification of Hurricane Katrina. Q. J. R. Meteorol. Soc. 2011, 137, 829–844. [Google Scholar] [CrossRef]
- Menelaou, K.; Yau, M.K.; Martinez, Y. On the origin and impact of a polygonal eyewall in the rapid intensification of Hurricane Wilma (2005). J. Atmos. Sci. 2013, 70, 3839–3858. [Google Scholar] [CrossRef]
- Wu, C.-C.; Wu, S.-N.; Wei, H.-H.; Abarca, S.F. The Role of Convective Heating in Tropical Cyclone Eyewall Ring Evolution. J. Atmos. Sci. 2016, 73, 319–330. [Google Scholar] [CrossRef]
- Montgomery, M.T.; Vladimirov, V.A.; Denissenko, P.V. An experimental study on hurricane mesovortices. J. Fluid Mech. 2002, 471, 1–32. [Google Scholar] [CrossRef]
- Reasor, P.D.; Montgomery, M.T.; Marks, F.D.; Gamache, J.F. Low-wavenumber structure and evolution of the hurricane inner core observed by airborne dual-Doppler radar. Mon. Weather Rev. 2000, 128, 1653–1680. [Google Scholar] [CrossRef]
- Kossin, J.P.; Eastin, M.D. Two distinct regimes in the kinematic and thermodynamic structure of the hurricane eye and eyewall. J. Atmos. Sci. 2001, 58, 1079–1090. [Google Scholar] [CrossRef]
- Kossin, J.P.; McNoldy, B.D.; Schubert, W.H. Vortical swirls in hurricane eye clouds. Mon. Weather Rev. 2002, 130, 3144–3149. [Google Scholar] [CrossRef]
- Kossin, J.P.; Schubert, W.H. Mesovortices in Hurricane Isabel. Bull. Am. Meteorol. Soc. 2004, 85, 151–153. [Google Scholar] [CrossRef]
- Hendricks, E.A.; McNoldy, B.D.; Schubert, W.H. Observed inner-core structural variability in Hurricane Dolly (2008). Mon. Weather Rev. 2012, 140, 4066–4077. [Google Scholar] [CrossRef]
- Rozoff, C.M.; Kossin, J.P.; Schubert, W.H.; Mulero, P.J. Internal control of hurricane intensity: The dual nature of potential vorticity mixing. J. Atmos. Sci. 2009, 66, 133–147. [Google Scholar] [CrossRef]
- Hendricks, E.A.; Schubert, W.H.; Chen, Y.-H.; Kuo, H.-C. Hurricane Eyewall Evolution in a Forced Shallow-Water Model. J. Atmos. Sci. 2014, 71, 1623–1643. [Google Scholar] [CrossRef]
- Hsu, Y.-J.G.; Arakawa, A. Numerical modeling of the atmosphere with an isentropic vertical coordinate. Mon. Weather Rev. 1990, 118, 1933–1959. [Google Scholar] [CrossRef]
- Jordan, C.L. Mean soundings for the West Indies area. J. Atmos. Sci. 1958, 15, 91–97. [Google Scholar] [CrossRef]
- Rodgers, E.B.; Olson, W.S.; Karyampudi, V.M.; Pierce, H.F. Satellite-derived latent heating distribution and environmental influences in Hurricane Opal (1995). Mon. Weather Rev. 1998, 126, 1229–1247. [Google Scholar] [CrossRef]
- Hoskins, B.J.; McIntyre, M.E.; Robertson, A.W. On the use and significance of isentropic potential vorticity maps. Q. J. R. Meteorol. Soc. 1985, 111, 877–946. [Google Scholar] [CrossRef]
- Menelaou, K.; Lau, M.K. On the role of asymmetric convective bursts to the problem of hurricane intensification: Radiation of vortex Rossby waves and wave-mean flow interactions. J. Atmos. Sci. 2014, 71, 2057–2058. [Google Scholar] [CrossRef]
- Gao, C.; Zhu, P. Vortex Rossby wave propagation in baroclinic tropical cyclone-like vortices. Geophys. Res. Lett. 2016, 43, 12578–12589. [Google Scholar] [CrossRef]
Figure 1.
The heating function for the control experiment. (Top) The radial structure of the heating function profile ; (Bottom) The temporal structure of the heating function .
Figure 1.
The heating function for the control experiment. (Top) The radial structure of the heating function profile ; (Bottom) The temporal structure of the heating function .

Figure 2.
The initial condition for the tropical storm-like vortex. The upper left panel shows the azimuthal mean PV (in PVU where ). The upper right panel shows the azimuthal mean azimuthal velocity with isosurfaces of absolute angular momentum (in units of ). The middle left panel shows the azimuthal mean Obuko-Weiss parameter. The middle right panel shows the azimuthal mean isentropic mass streamfunction (in units of ). The lower left panel shows the PV on the surface. The lower right panel shows the PV on the surface.

Figure 3.
Same as Figure 2, except for .
Figure 3.
Same as Figure 2, except for .

Figure 4.
Same as Figure 2, except for .
Figure 4.
Same as Figure 2, except for .

Figure 5.
Same as Figure 2, except for .
Figure 5.
Same as Figure 2, except for .

Figure 6.
The time evolution of the maximum azimuthal velocity (upper left panel), maximum PV (upper right panel), maximum diabatic heating rate (lower left panel), and minimum central pressure (lower right panel) from to h.
Figure 6.
The time evolution of the maximum azimuthal velocity (upper left panel), maximum PV (upper right panel), maximum diabatic heating rate (lower left panel), and minimum central pressure (lower right panel) from to h.

Figure 7.
PV budget terms at . RADV stands for radial advection, TADV stands for azimuthal advection, VADV stands for vertical advection, and VDH stands for vertical diabatic heating term. All terms are given in units of .
Figure 7.
PV budget terms at . RADV stands for radial advection, TADV stands for azimuthal advection, VADV stands for vertical advection, and VDH stands for vertical diabatic heating term. All terms are given in units of .

Figure 8.
Same as Figure 7, except for .
Figure 8.
Same as Figure 7, except for .

Figure 9.
Azimuthal mean absolute angular momentum terms at . corresponds to radial mean term ; corresponds to the vertical mean term , corresponds to the radial eddy term ; and corresponds to the vertical eddy term .
Figure 9.
Azimuthal mean absolute angular momentum terms at . corresponds to radial mean term ; corresponds to the vertical mean term , corresponds to the radial eddy term ; and corresponds to the vertical eddy term .

Figure 10.
Same as Figure 9, except for .
Figure 10.
Same as Figure 9, except for .

Figure 11.
Azimuthal mean radial velocity budget at . corresponds to the radial advection of azimuthal mean radial velocity by the mean flow. corresponds to the vertical advection of azimuthal mean radial radial velocity by the mean flow. corresponds to the agradient force. corresponds to the summation of all eddy terms as given in Equation (20).

Figure 12.
Same as Figure 10, except from h.
Figure 12.
Same as Figure 10, except from h.

Figure 13.
Azimuthal-mean eddy kinetic energy at h. BTA corresponds to barotropic energy conversion associated with the azimuthal flow, BTR corresponds to barotropic energy conversion associated with the radial flow, BCA corresponds to baroclinic energy conversion associated with the azimuthal and radial flow, PTK corresponds to the transfer of eddy potential energy into eddy kinetic energy, FDMF corresponds to the flux divergence of by the mean flow, and FDE corresponds to the flux divergence of by the eddies.

Figure 14.
Same as Figure 13, except for h.
Figure 14.
Same as Figure 13, except for h.

Publisher’s Note: MDPI stays neutral with regard to jurisdictional claims in published maps and institutional affiliations. |
© 2017 by the author. Licensee MDPI, Basel, Switzerland. This article is an open access article distributed under the terms and conditions of the Creative Commons Attribution (CC BY) license (https://creativecommons.org/licenses/by/4.0/).
Share and Cite
MDPI and ACS Style
Williams Jr., G.J. The Generation and Maintenance of Hollow PV Towers in a Forced Primitive Equation Model. Proceedings 2017, 1, 156. https://doi.org/10.3390/ecas2017-04149
AMA Style
Williams Jr. GJ. The Generation and Maintenance of Hollow PV Towers in a Forced Primitive Equation Model. Proceedings. 2017; 1(5):156. https://doi.org/10.3390/ecas2017-04149
Chicago/Turabian StyleWilliams Jr., Gabriel J. 2017. "The Generation and Maintenance of Hollow PV Towers in a Forced Primitive Equation Model" Proceedings 1, no. 5: 156. https://doi.org/10.3390/ecas2017-04149