Detection of Self-Mixing Interferometric Fringes of a Laser Sensor Using Matched Filter †

1
Riphah International University, Islamabad, Pakistan
2
LAAS-CNRS, Universite de Toulouse, CNRS, INPT, Toulouse, France
*
Author to whom correspondence should be addressed.
†
Presented at the Eurosensors 2017 Conference, Paris, France, 3–6 September 2017.
Proceedings 2017, 1(4), 590; https://doi.org/10.3390/proceedings1040590
Published: 18 August 2017
(This article belongs to the Proceedings of Proceedings of Eurosensors 2017, Paris, France, 3–6 September 2017)
Abstract
:Self-Mixing (SM) is a promising technique for sensing vibration, distance, velocity etc. To retrieve accurate metric measurements from an acquired SM signal, it is necessary to correctly detect all interferometric fringes. Traditionally, SM fringes are detected by a derivative based threshold (DBT) scheme. However, such a scheme gives correct results only for SM signals with high signal-to-noise ratio (SNR) and moderate optical feedback regime. So, in this paper, a better fringe detection method, based on Matched Filter (MF), is proposed which has provided correct SM fringe detection even in case of low SNR and weak optical feedback regime. The proposed approach has resulted in fringe detection accuracy of 100% for a low SNR SM signal belonging to the weak feedback regime.
1. Introduction
Self-mixing (SM) or optical feedback interferometry technique [1] has become an attractive area for the sensing of vibration [2] and biomedical applications [3]. For high precision displacement retrieval using SM sensor, one can one of many phase unwrapping methods (PUMs) [4,5,6,7]. These PUMs all are based on correct detection of all SM fringes contained in the acquired SM signal. Thus, SM fringe detection becomes a fundamental step which is later built upon by these PUMs. Usually, simple derivative based threshold (DBT) method is sufficient to detect SM fringes [4,5]. However, such a simple approach fails in case of either low signal to noise ratio (SNR). So, other methods such as customized wavelets [8] have been previously proposed. However, the performance of standard SM fringe detection approaches such as DBT method degrades in case of low SNR which lead to degraded displacement measurement results. In this paper, a new technique, based on the use of Matched Filter (MF) technique, is being proposed which has resulted in correct detection of all SM fringes belonging to a noisy SM signal with low SNR.
2. Self-Mixing Interferometry
SM effect is observed when the optical beam is back-scattered by a remote target into the active laser cavity thus modifying spectral characteristics of the laser diode. The variations in the optical output power of the laser diode (t) caused by this optical feedback can be written as [1]:
where Po is the emitted optical power under free-running conditions, m is the modulation index and xF(t) is the laser output phase in the presence of feedback, given by:
where (t) is the target displacement.
The emission wavelength subject to feedback (t) is given by the phase equation [1]
where α is thelinewidth enhancement factor, and x0(t) is the laser output phase in the absence of feedback, obtained by
where λ0 is the laser diode wavelength in the absence of optical feedback.
C is the optical feedback coupling factor that determines the SM operating regime [1]. Often, SM displacement sensing is performed in the moderate feedback regime due to apparently simple fringe shape belonging to such a regime [9]. Previous research work has demonstrated that, by avoiding speckle phenomenon [10] it is possible to robustly maintain the operating feedback regime e.g., by using adaptive optics [6]. For the present work, SM signals belonging to moderate as well as weak feedback regime have been tested (for values of C as low as 0.5) while assuring that all fringes have been correctly detected.
3. MF Based Fringe Detection
Selection of MF Templates
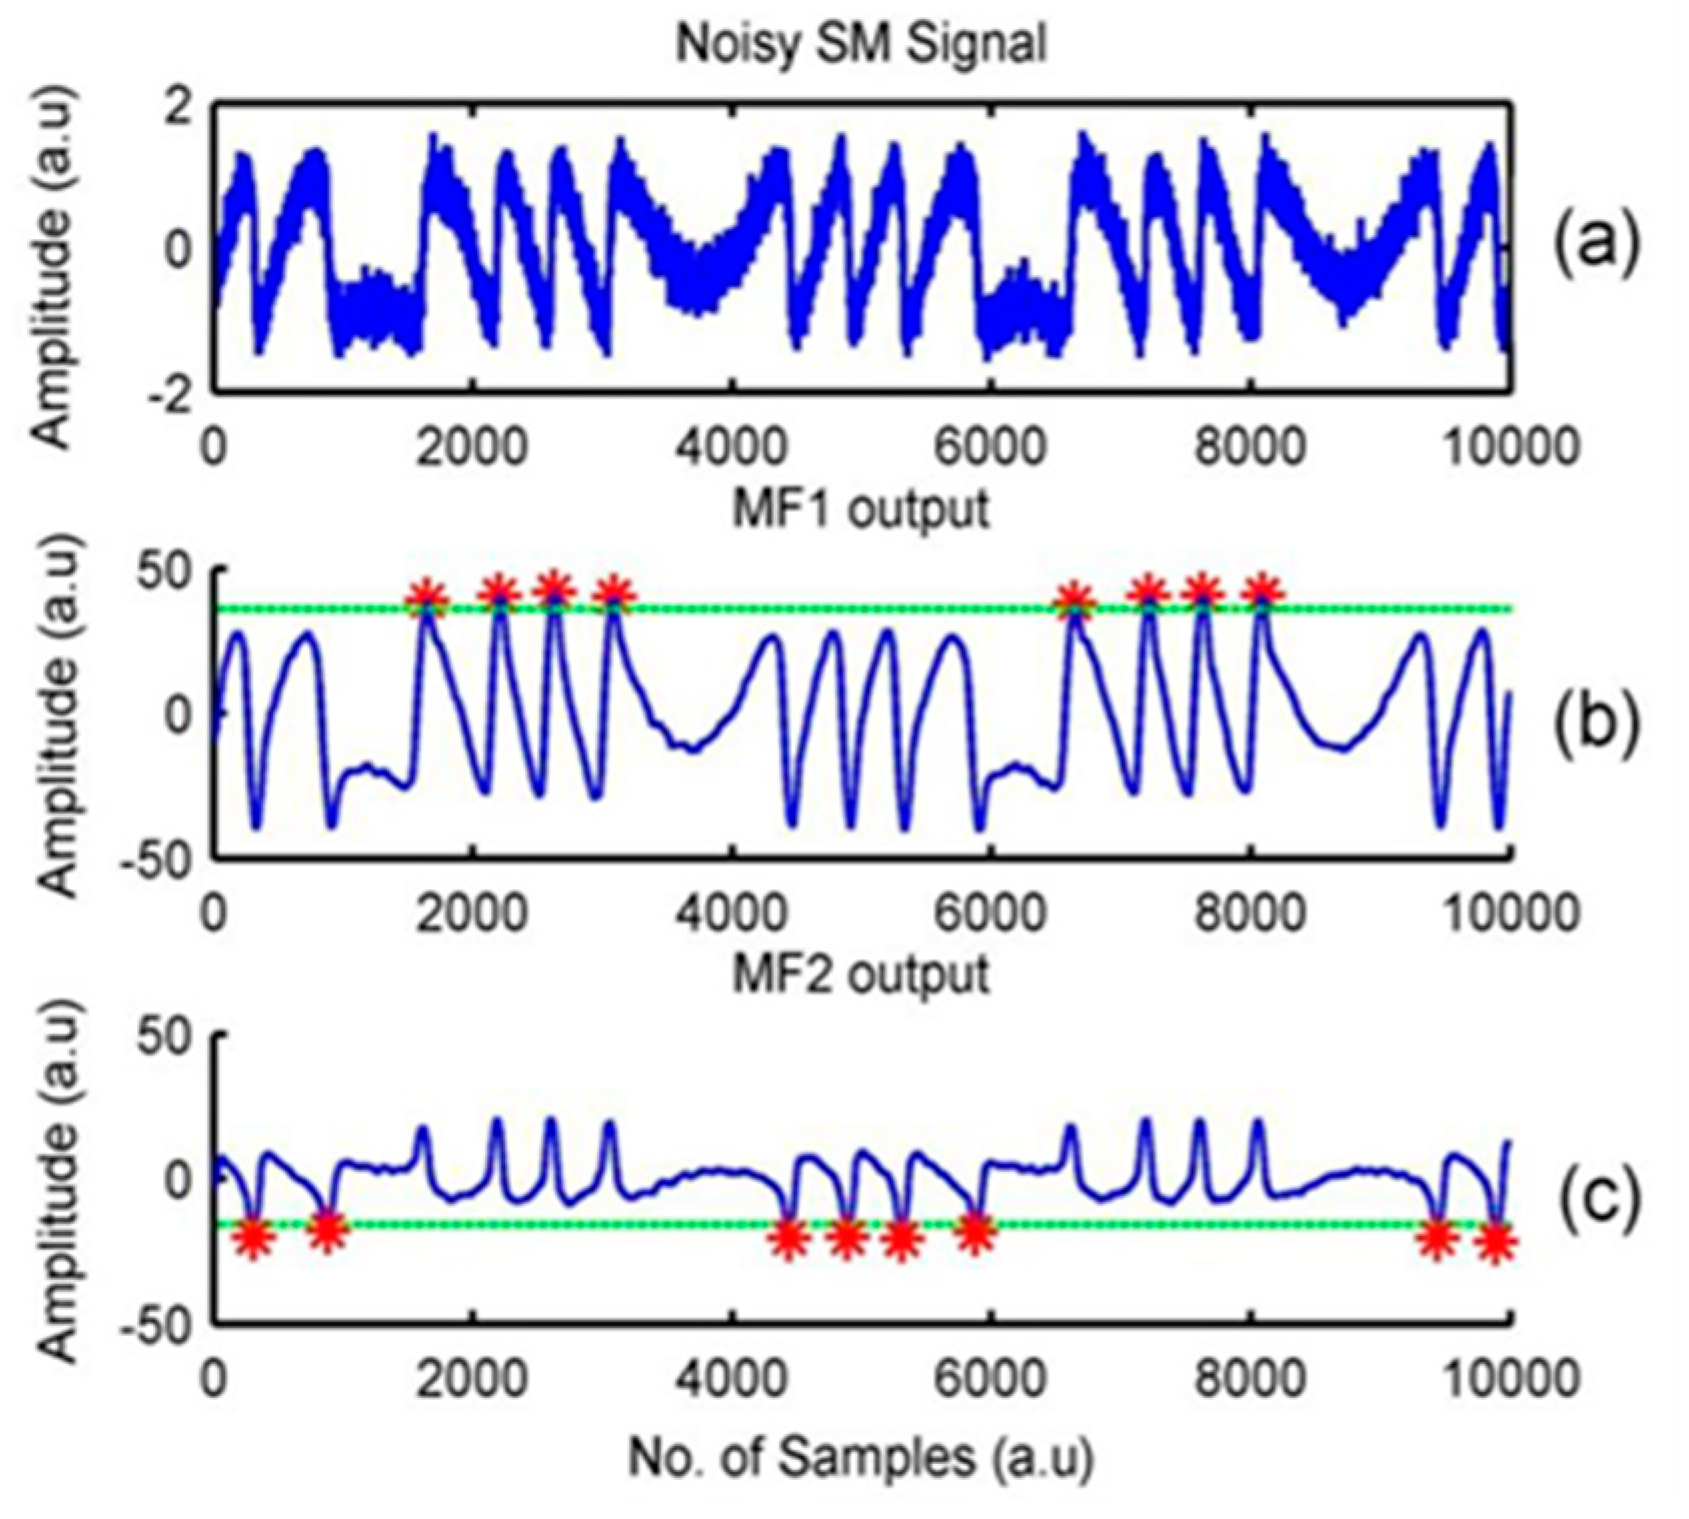
In our approach, the first step consists of making two templates h1(n) and h2(n) which are used to detect forward and backward fringes respectively. Later, time-reversed versions of these templates become impulse response for both MFs which are convolved with the acquired SM signal x(n). Each template is extracted from Noiseless SM signal which is then taken as impulse response for respective MF which is convolved with the acquired SM signal x(n). The detection threshold was selected based on the ROC curve; this value was manually selected (at the turning point of the curve). Since the detection threshold was calculated based on a trade-off between the (True Positive Rate) TPR and number of (False Positives) FPs, by selecting different thresholds there will be a difference in performance. A MF maximizes the SNR of a signal [11]. Therefore, if forward fringes occur in a given period then the output of MF1 will be greater than output of MF2 and likewise if backward fringes occur in a given period then the output of MF2 will be greater than output of MF1 whereas the output of MF is absolute value with greater magnitude.
4. Results
Noisy SM signal is shown in Figure 1a which is the input signal to both MFs. When input SM signal convolves with impulse response of MF1 it gives high amplitudes where forward fringes occur in input SM signal on same time axis as shown in Figure 1b, whereas high amplitudes are obtained at the output of MF2 wherever backward fringes occur in input SM signal as shown in Figure 1c. However it is worth-mentioning that the shown output of MF2 is actually inverted as it is a requirement of phase unwrapping methods [4,5,6,7].
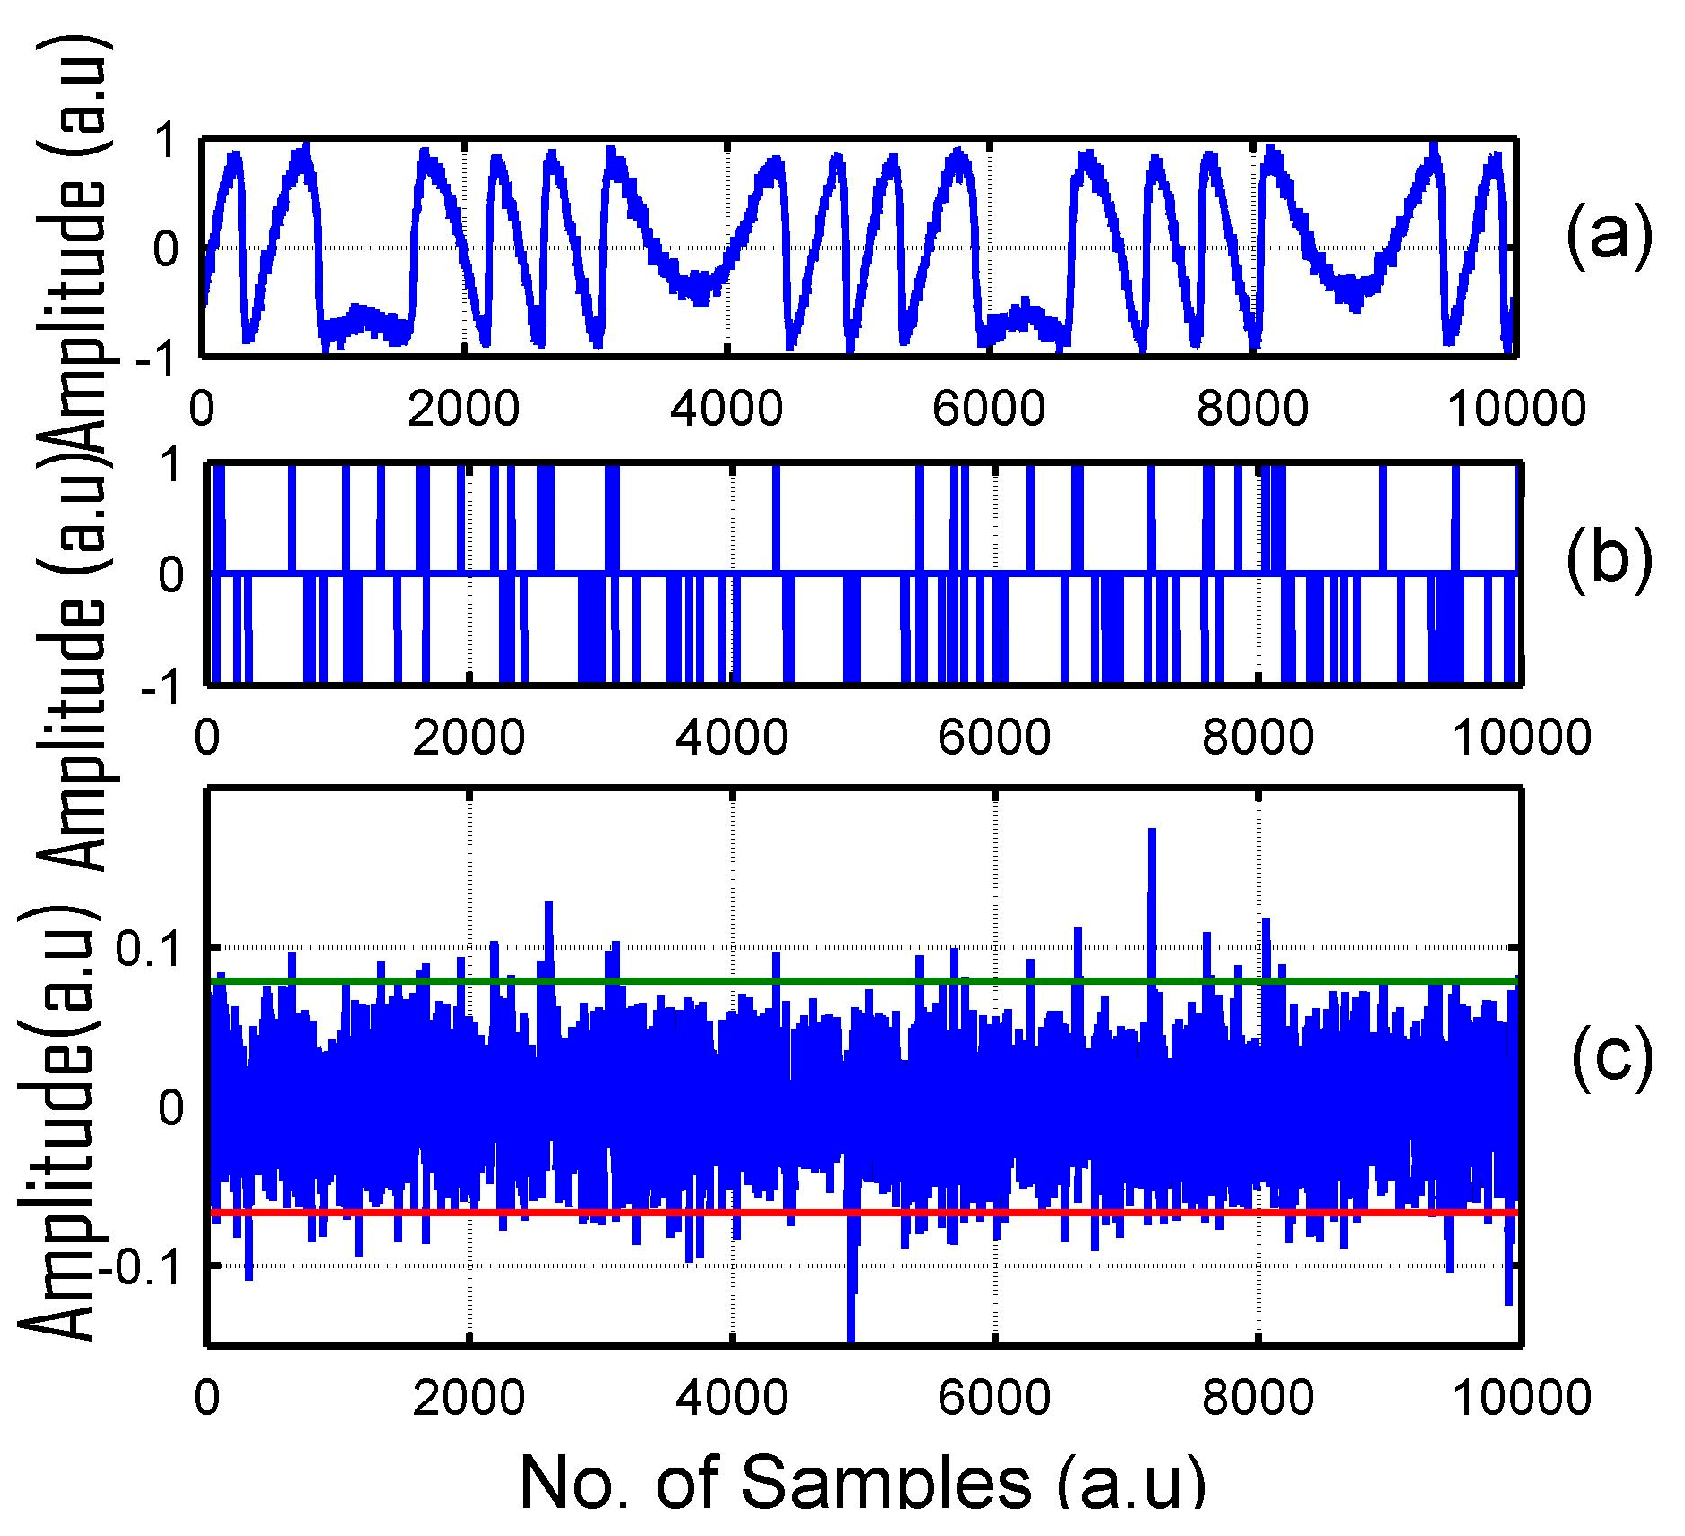
A nice performance of DBT method significantly degrades for a low SNR SM signal (presented in Figure 2a). It is illustrated in Figure 2b that multiple false SM fringe detections occur in case of low SNR SM signal. Such a degraded performance of DBT method is to be expected because of presence of noise within the derivated SM signal (see Figure 2c (blue curve)) which makes it impossible to correctly apply thresholds (green and red straight lines). It may be noted that the SNR of SM signal of Figure 2a is higher than the SNR of SM signal of Figure 1a. Yet, for a higher SNR signal, DBT method fails in fringe detection.
5. Conclusions
In this paper, it has been shown that SM fringes can be detected even in case of low SNR by using appropriate MFs. It has been shown that noise has adverse effect on the amplitude and shape of SM fringes, which is primary reason of variations in the incoming SM signal. Conventional method of derivative based threshold for SM fringe detection fails in case of low SNR. The use of MF has made it possible to detect all the SM fringes correctly with TPR of 100%.
Conflicts of Interest
The authors declare no conflict of interest.
References
- Taimre, T.; Nikolić, M.; Bertling, K.; Lim, Y.L.; Bosch, T.; Rakic, A.D. Laser feedback interferometry: A tutorial on the self-mixing effect for coherent sensing. OSA 2015, 7, 570–631. [Google Scholar] [CrossRef]
- Khan, Z.A.; Zabit, U.; Bernal, O.D.; Ullah, M.O.; Bosch, T. Adaptive Cancellation of Parasitic Vibrations Affecting a Self-Mixing Interferometric Laser Sensor. IEEE Trans. Instrum. Meas. 2017, 66, 332–339. [Google Scholar] [CrossRef]
- Donati, S.; Norgia, M. Self-Mixing Interferometry for Biomedical Signals Sensing. IEEE J. Sel. Top. Quantum Electron. 2014, 20, 104–111. [Google Scholar] [CrossRef]
- Bes, C.; Plantier, G.; Bosch, T. Displacement measurements using a self-mixing laser diode under moderate feedback. IEEE Trans. Instrum. Meas. 2006, 55, 1101–1105. [Google Scholar] [CrossRef]
- Zabit, U.; Bernal, O.D.; Bosch, T. Self-mixing Sensor for Real-time Measurement of Harmonic and Arbitrary Displacements. In Proceedings of the 2012 IEEE International Instrumentation and Measurement Technology Conference (I2MTC), Graz, Austria, 13–16 May 2012; pp. 754–758. [Google Scholar]
- Bernal, O.; Zabit, U.; Bosch, T. Robust method of stabilization of optical feedback regime by using adaptive optics for a self-mixing microinterferometer laser displacement sensor. IEEE J. Sel. Top. Quantum Electron. 2015, 21, 1–8. [Google Scholar] [CrossRef]
- Arriaga, A.L.; Bony, F.; Bosch, T. Real-time algorithm for versatile displacement sensors based on self-mixing interferometry. IEEE Sens. J. 2016, 16, 195–202. [Google Scholar] [CrossRef]
- Bernal, O.D.; Seat, H.C.; Zabit, U.; Surre, F.; Bosch, T. Robust Detection of Non Regular Interferometric Fringes from a Self-Mixing Displacement Sensor using Bi-Wavelet. Transform. IEEE Sens. J. 2016, 16, 7903–7910. [Google Scholar] [CrossRef]
- Bernal, O.D.; Zabit, U.; Bosch, T. Classification of laser self-mixing interferometric signal under moderate feedback. Appl. Opt. 2014, 53, 702–708. [Google Scholar] [CrossRef] [PubMed]
- Atashkhooei, R.; Royo, S.; Azcona, F.; Zabit, U. Analysis and control of speckle effects in self-mixing interferometry. Proc. IEEE Sens. 2011. Available online: http://ieeexplore.ieee.org/document/6127054/ (accessed on 23 June 2017).
- Kay, S.M. Deterministic Signals. In Fundamentals of Statistical Signal Processing: Detection Theory, 1st ed.; Oppenheim, A.V., Ed.; Prentice Hall: Upper Saddle River, NJ, USA, 1998; Volume 2, pp. 94–101. [Google Scholar]
Figure 1.
(a) Noisy SM signal (b) Output of matched filter 1 (MF1) designed for detecting forward SM fringes (c) Output of matched filter 2 (MF2) designed for detecting backward SM fringes (dotted green horizontal line represents threshold while red stars represent fringe detection).
Figure 1.
(a) Noisy SM signal (b) Output of matched filter 1 (MF1) designed for detecting forward SM fringes (c) Output of matched filter 2 (MF2) designed for detecting backward SM fringes (dotted green horizontal line represents threshold while red stars represent fringe detection).

Figure 2.
Performance of DBT method in case of: (a) noisy SM signal, and (b) incorrect fringe detections because (c) presence of noise within the derivated noisy SM signal (blue curve) makes it impossible to correctly apply thresholds (green and red straight lines).
Figure 2.
Performance of DBT method in case of: (a) noisy SM signal, and (b) incorrect fringe detections because (c) presence of noise within the derivated noisy SM signal (blue curve) makes it impossible to correctly apply thresholds (green and red straight lines).
Publisher’s Note: MDPI stays neutral with regard to jurisdictional claims in published maps and institutional affiliations. |
© 2017 by the authors. Licensee MDPI, Basel, Switzerland. This article is an open access article distributed under the terms and conditions of the Creative Commons Attribution (CC BY) license (https://creativecommons.org/licenses/by/4.0/).
Share and Cite
MDPI and ACS Style
Akmal, M.; Zabit, U.; Bernal, O.D.; Bosch, T. Detection of Self-Mixing Interferometric Fringes of a Laser Sensor Using Matched Filter. Proceedings 2017, 1, 590. https://doi.org/10.3390/proceedings1040590
AMA Style
Akmal M, Zabit U, Bernal OD, Bosch T. Detection of Self-Mixing Interferometric Fringes of a Laser Sensor Using Matched Filter. Proceedings. 2017; 1(4):590. https://doi.org/10.3390/proceedings1040590
Chicago/Turabian StyleAkmal, Muhammad, Usman Zabit, Olivier D. Bernal, and Thierry Bosch. 2017. "Detection of Self-Mixing Interferometric Fringes of a Laser Sensor Using Matched Filter" Proceedings 1, no. 4: 590. https://doi.org/10.3390/proceedings1040590