Binary Zone Plate Infrared Spectrometer for Dissolved Gas Analysis in High Voltage Equipment †

Department of Electrical and Computer Engineering, University of Manitoba, Winnipeg, MB, Canada
*
Author to whom correspondence should be addressed.
†
Presented at the Eurosensors 2017 Conference, Paris, France, 3–6 September 2017.
Proceedings 2017, 1(4), 555; https://doi.org/10.3390/proceedings1040555
Published: 16 August 2017
(This article belongs to the Proceedings of Proceedings of Eurosensors 2017, Paris, France, 3–6 September 2017)
Abstract
:An IR spectrometer based on a Binary Zone Plate (BZP) is presented for dissolved gas analysis. The wavelength selective focal length of the BZP can effectively discriminate between wavelengths ranging from 800 nm to 8 μm, by adjusting the focus distance onto an aperture in the image plane from 19 mm to 200 mm. The aperture serves to pass focused radiation onto the detector. The BZP has a focal length of 50 mm for a design wavelength of 3 μm, with 400 zones. This design enables discrimination between all key fault gases present in oil impregnated high voltage equipment.
1. Introduction
Conductors in high voltage apparatus in the power industry are often insulated electrically and thermally from one another to prevent dangerous faults from occurring. Such faults can often be the cause of significant economic losses for the power industry [1]. One preventative measure for stopping these faults before they occur is to regularly assess the health of the insulation of the equipment. Mineral oil is often used as the insulating medium for high voltage equipment such as transformers and bushings [2]. Oil assessment can be performed by measuring the concentrations of dissolved gases. This process is known as dissolved gas analysis (DGA) [3]. There exist chemical and optical methods for performing DGA [3]. Optical methods are based on measuring the infrared (IR) radiation absorbed as a function of wavelength, and is more generally known as infrared spectroscopy. Fourier Transform Infrared Spectroscopy (FTIR) and Photoacoustic Spectroscopy (PAS) are two such spectroscopic methods. FTIR is a very precise way of performing IR spectroscopy but has shortcomings related to cost and complexity. PAS is a proven method for performing DGA in the field but requires multiple passband windows for spectral filtering which take up a lot of physical space. In this paper, a unique optical method for performing DGA is presented. It is a spectrometer based on a focal length dependent binary zone plate (BZP) for IR spectral discrimination. BZP lenses are commonly used in applications related to X-ray microscopy and X-ray tomography [4,5]. However, they have also been used in applications designed for the IR spectrum. In [6], BZP lenses were applied to the food processing industry for detecting ethylene, ammonia, and ethanol. The main purpose of the BZP is to utilize technology that is cheap, simple, and sufficient for performing DGA.
2. Gas Absorption
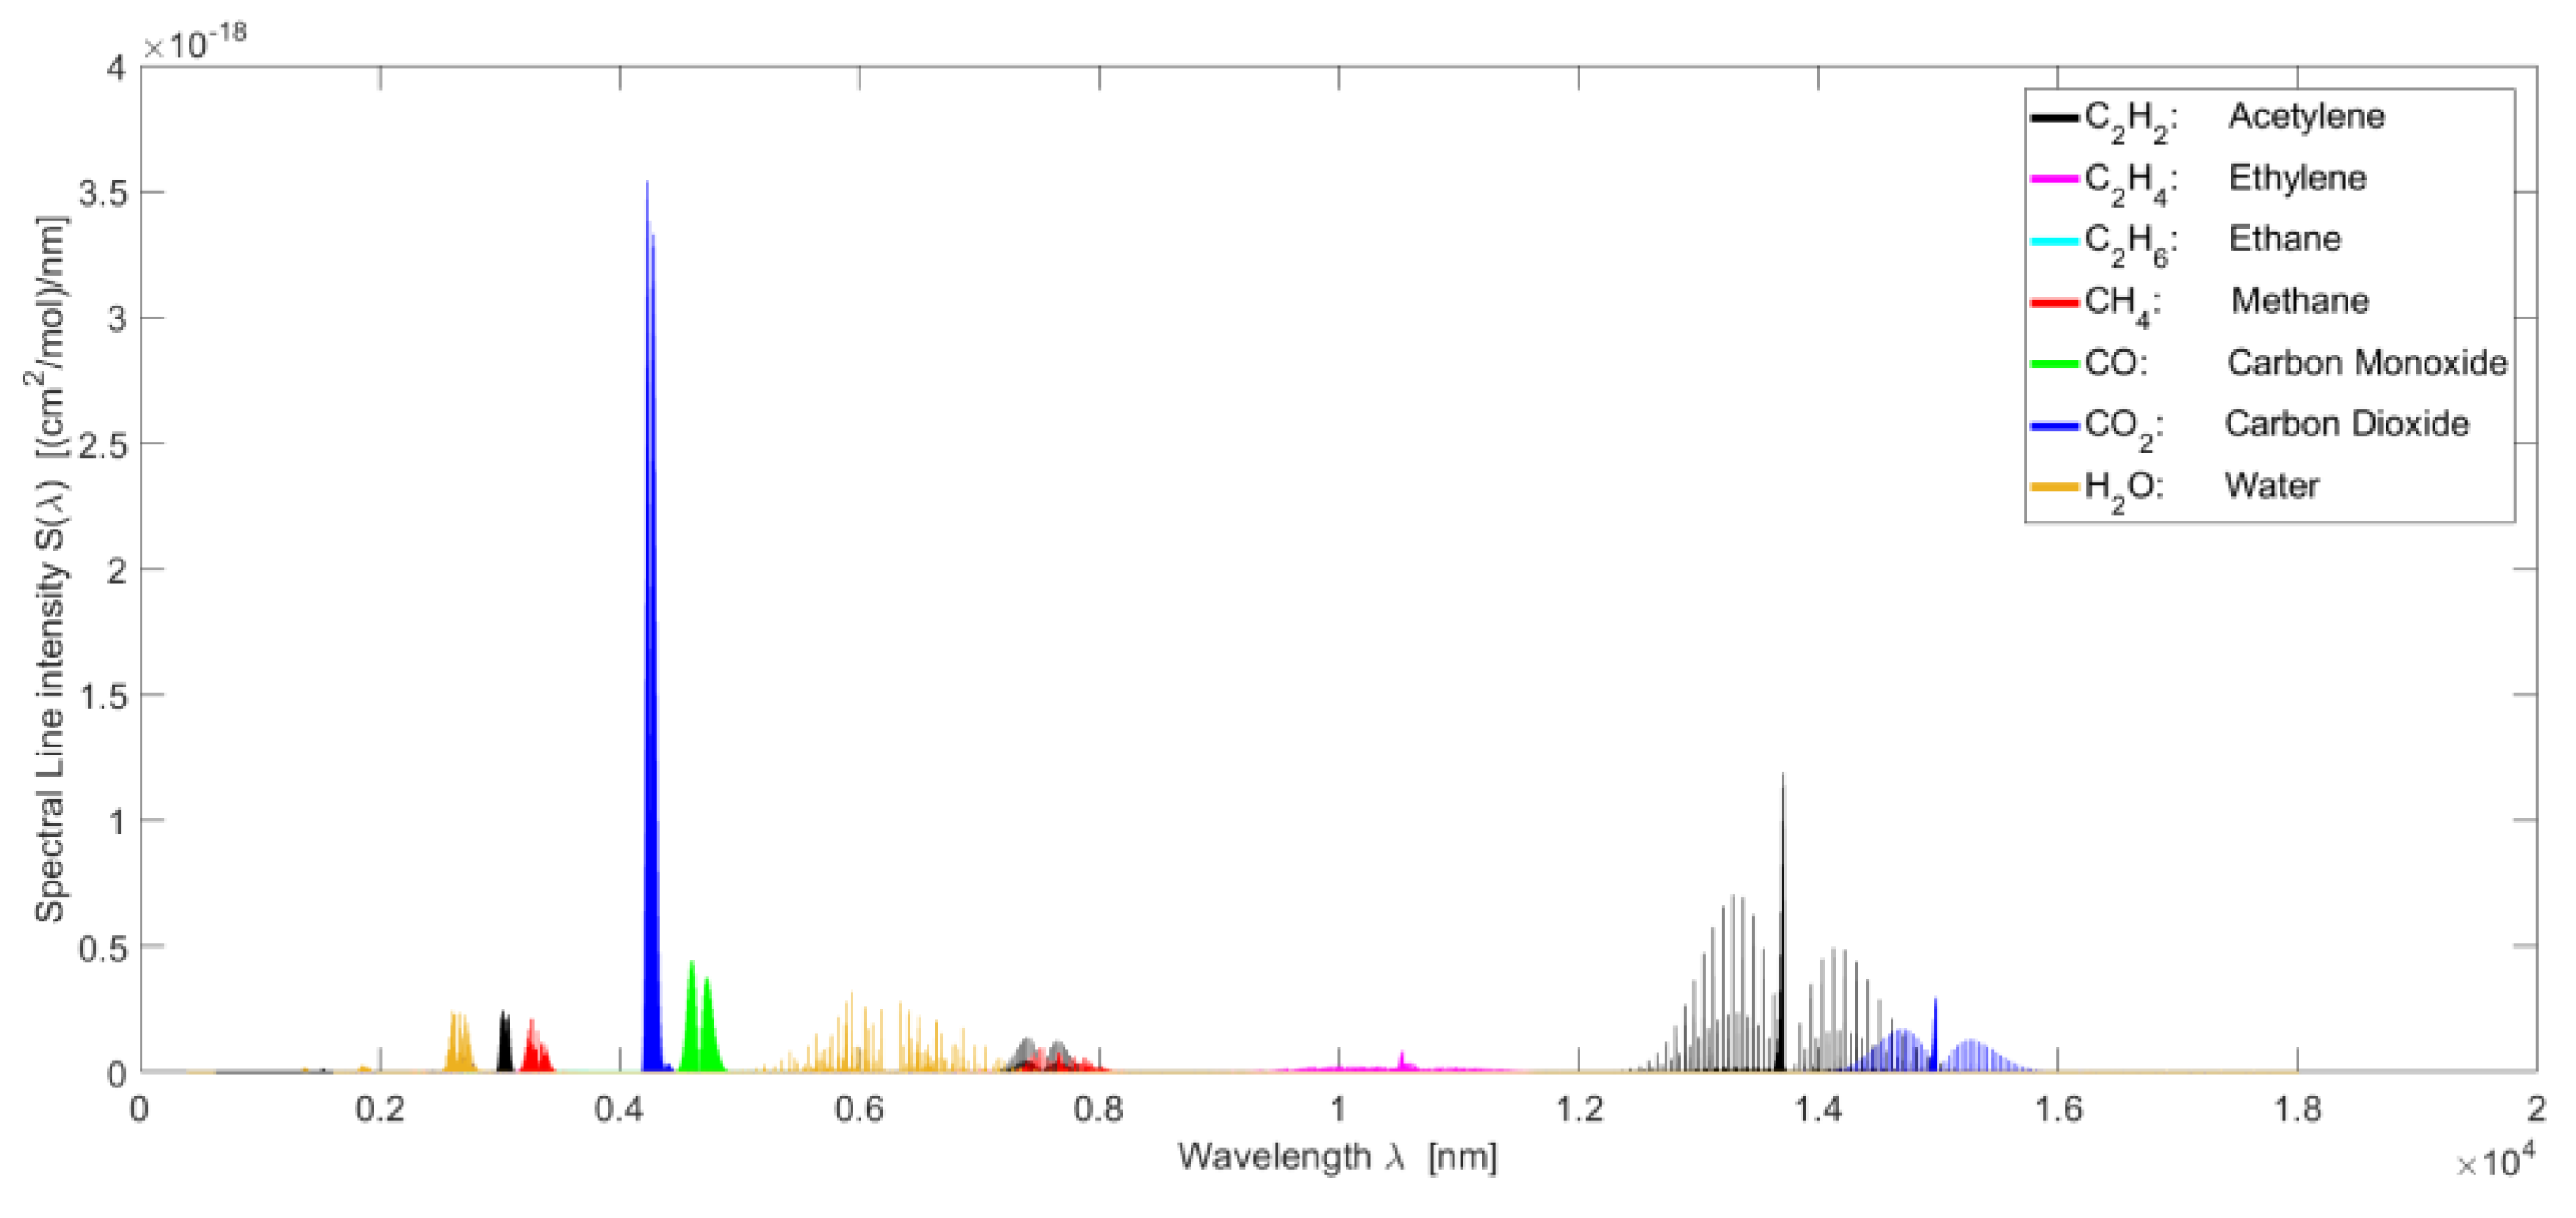
The standards used in DGA, namely IEEE C57.104-2008 and IEC 60599, calculate the concentrations of six key gases in order to predict possible faults in high voltage equipment [7]. These six key gases are acetylene, methane, ethane, ethylene, carbon monoxide, and carbon dioxide [3]. To determine the concentrations of each gas, the energy absorbed as a function of wavelength is calculated using the Beer-Lambert Law. This requires knowledge of the absorption coefficients of each gas, which are a function of wavelength. This information is provided by the high resolution transmission molecular absorption database (HITRAN), and is shown in Figure 1 [8]. It is clear from Figure 1 that in order to measure these gases, a spectral filter for each wavelength corresponding to the main IR absorption bands of each gas is needed.
3. Spectrometer Design
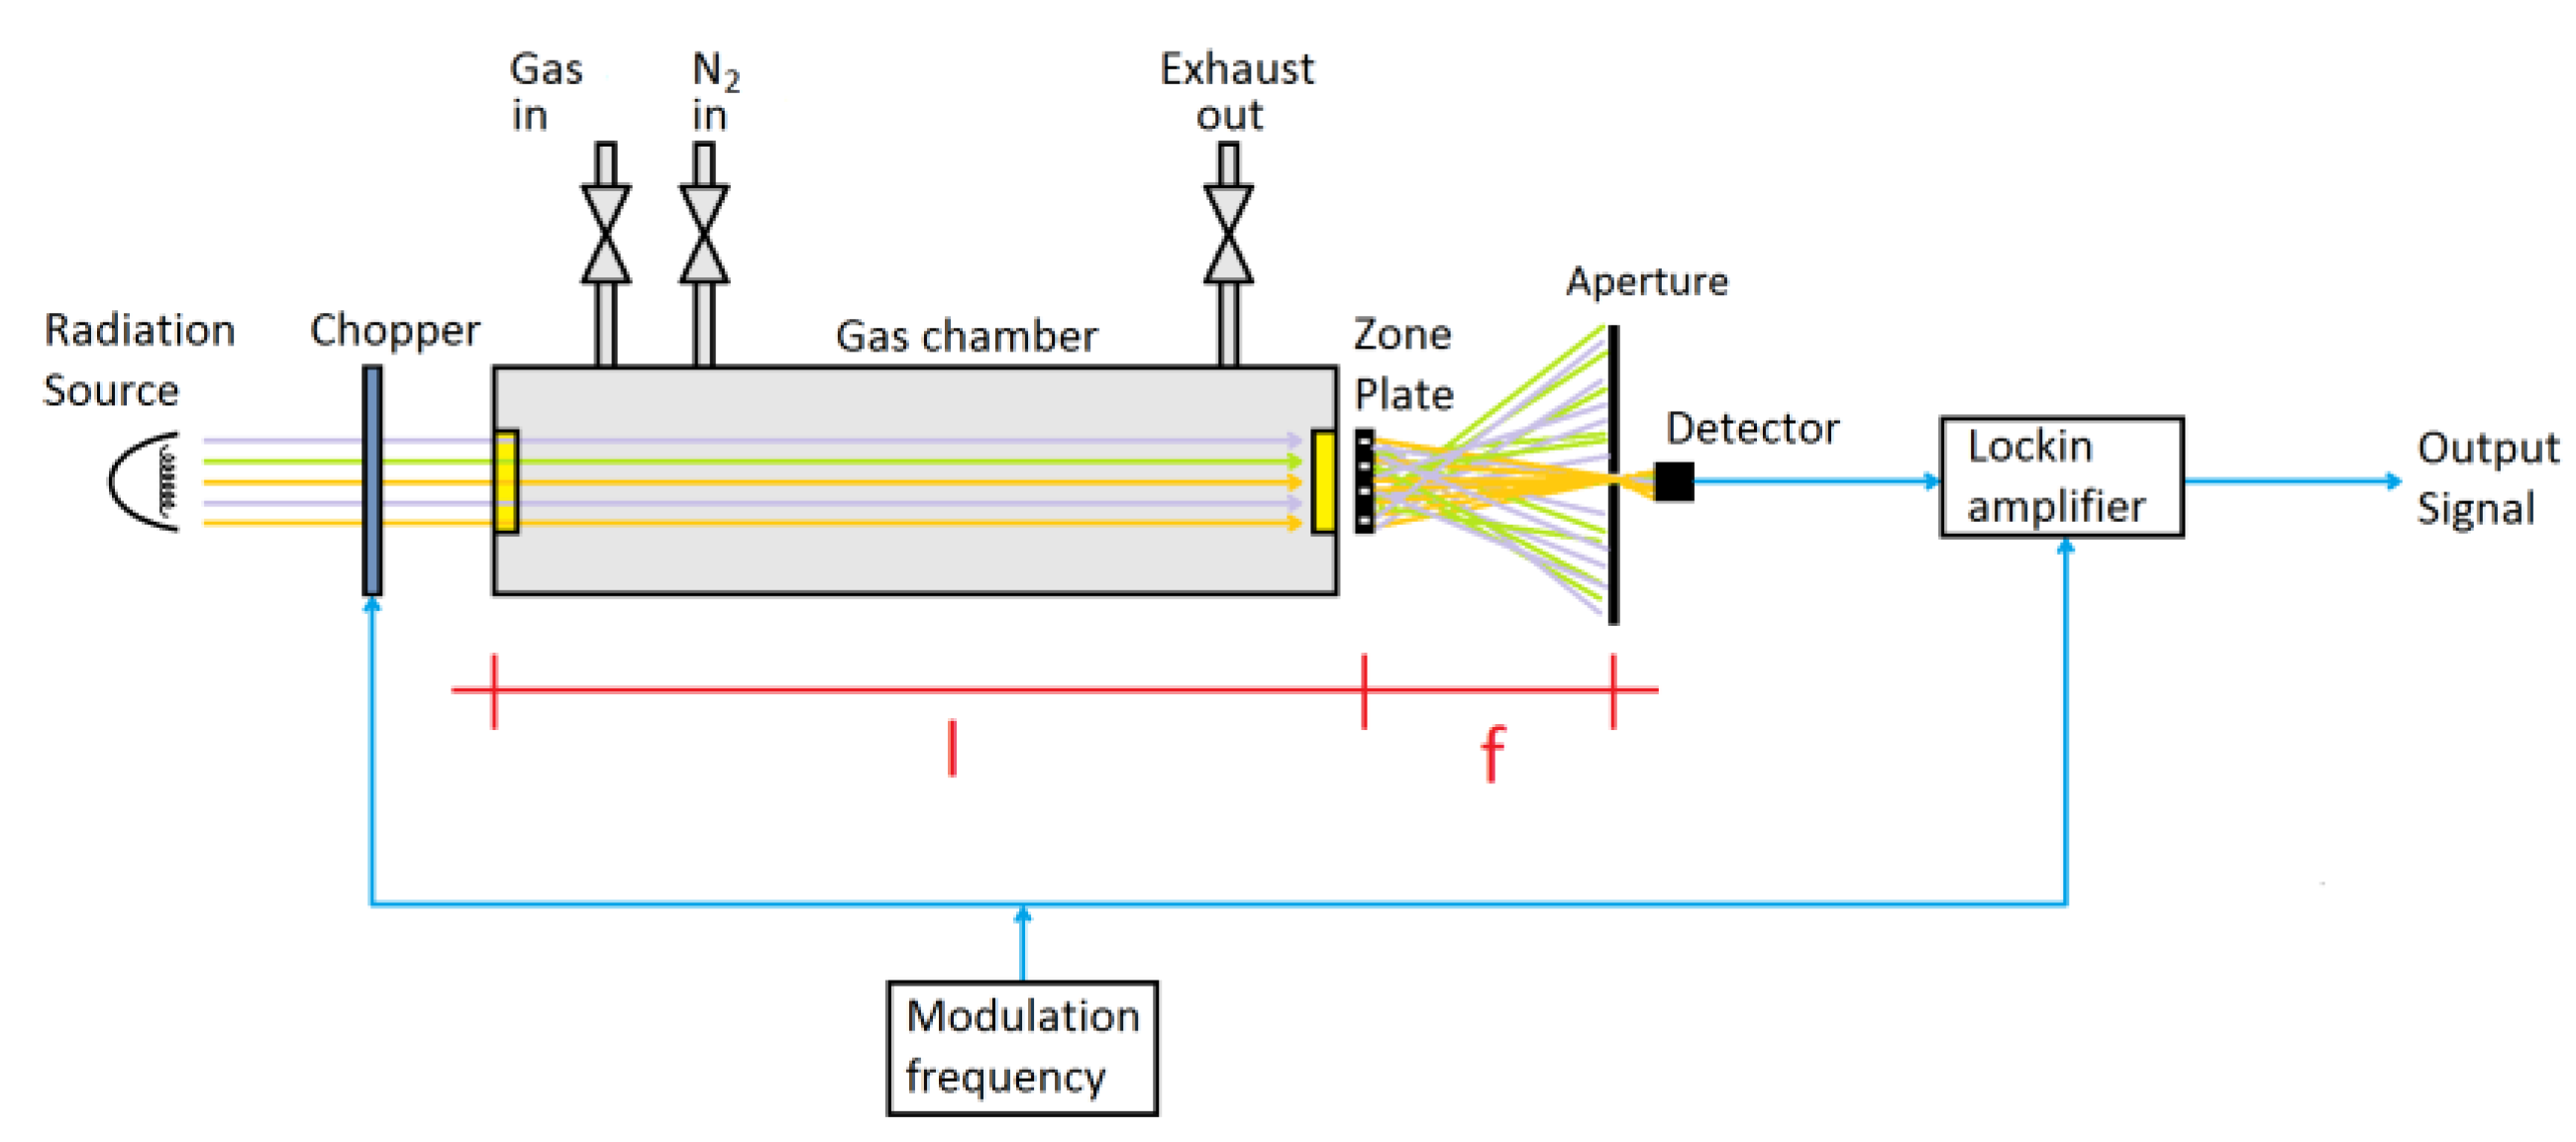
The block diagram for the proposed IR spectrometer is shown in Figure 2. Radiation from an infrared emitter is absorbed by key gases in a chamber, followed by spectral filtering using a BZP lens. Finally, an aperture and IR detector are used to measure the absorbed energy. The BZP lens can move linearly along the along optical axis, whose focal point f is wavelength dependent. As a result of moving the lens linearly, it is possible to selectively focus on all wavelengths of interest corresponding to the absorption profiles of the key gases. A chopper and lock-in amplifier are used to improve the sensitivity of the radiation detector after the exit aperture, as shown in Figure 2.
4. Lens Design
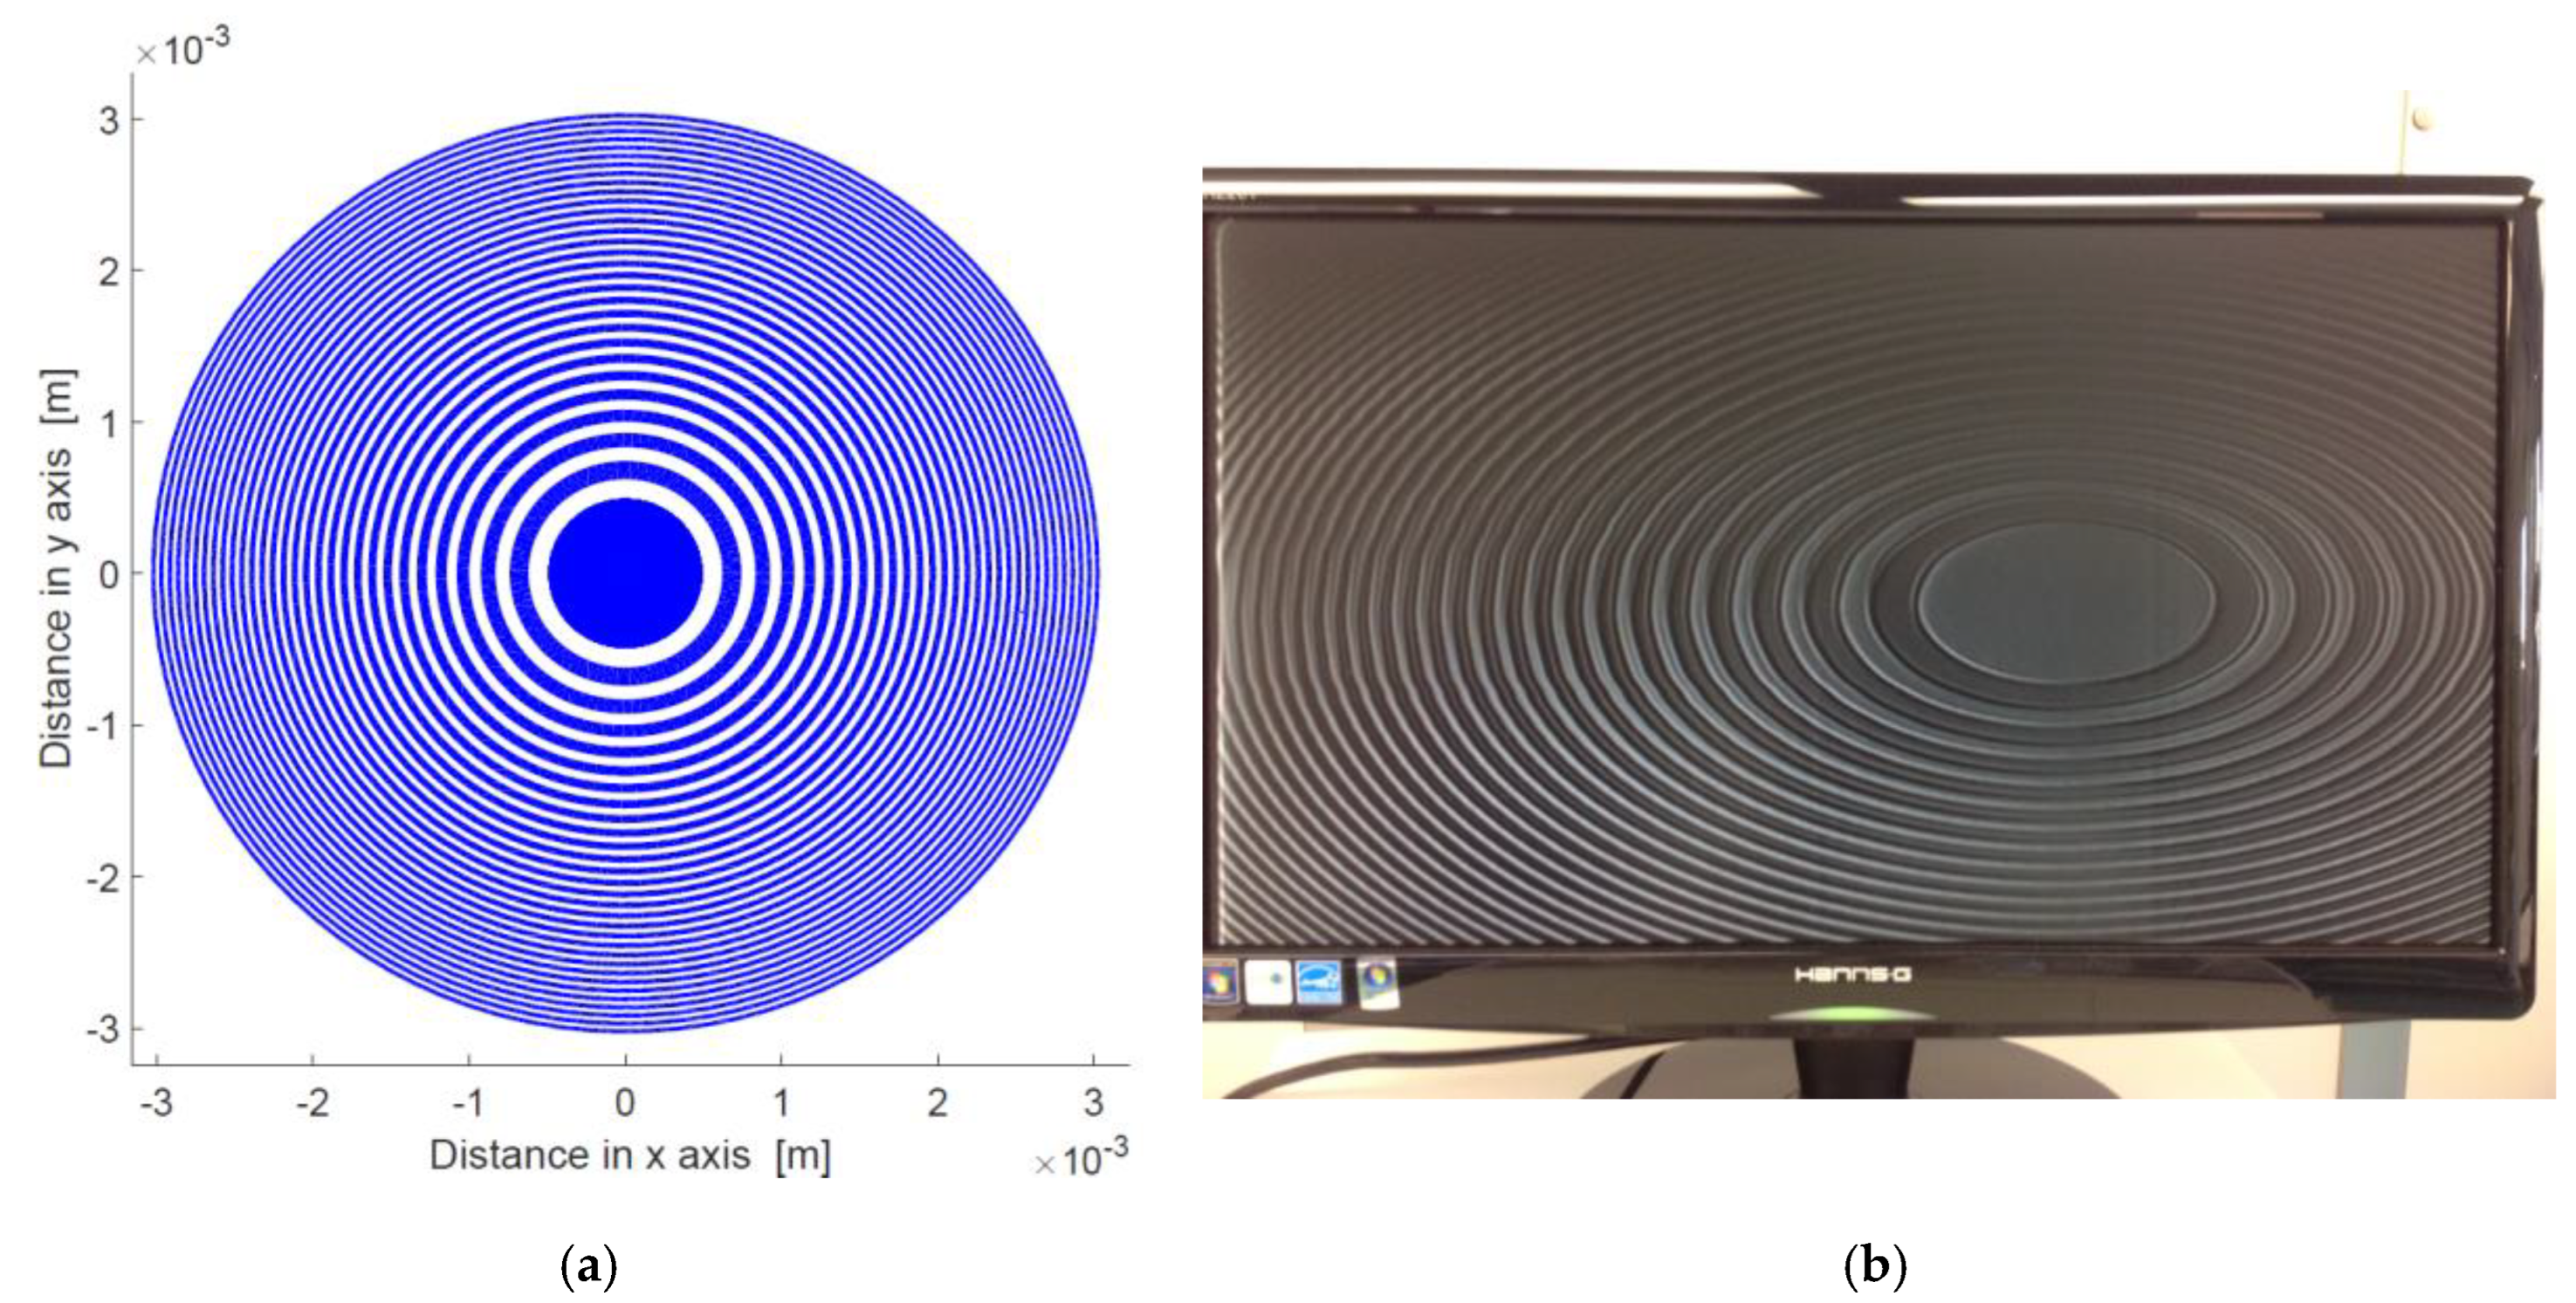
The MEMS BZP consists of a series of concentric rings whose far field diffraction profile corresponds to a design wavelength some foci away. It is manufactured using standard MEMS fabrication techniques on a 100 mm double sided polished silicon wafer. A 200 nm aluminum film was sputtered onto the wafer and etched into opaque rings to produce the appropriate diffraction patterns. The lens parameters were first simulated in MATLAB to determine all geometric properties such that its design requirements would be met. Some of these zones are shown in Figure 3a with the inner opaque circle having a radius of 485 μm. The lens was then fabricated in a cleanroom and whose geometrical features were within 5% of the simulation when measured with the Alpha-step profiler. Figure 3b shows these features when viewed under a microscope. The lens design consists of a number of factors to consider; including the number of zones, the design focal length for a particular wavelength, and the exit slit aperture diameter. The lens is designed to achieve constructive interference for a wavelength of 3 μm at a focal length of 50 mm. To achieve the sufficient spectral resolution needed to discriminate between gases, the lens employs 400 zones of concentric aluminum rings.
5. Lens Performance
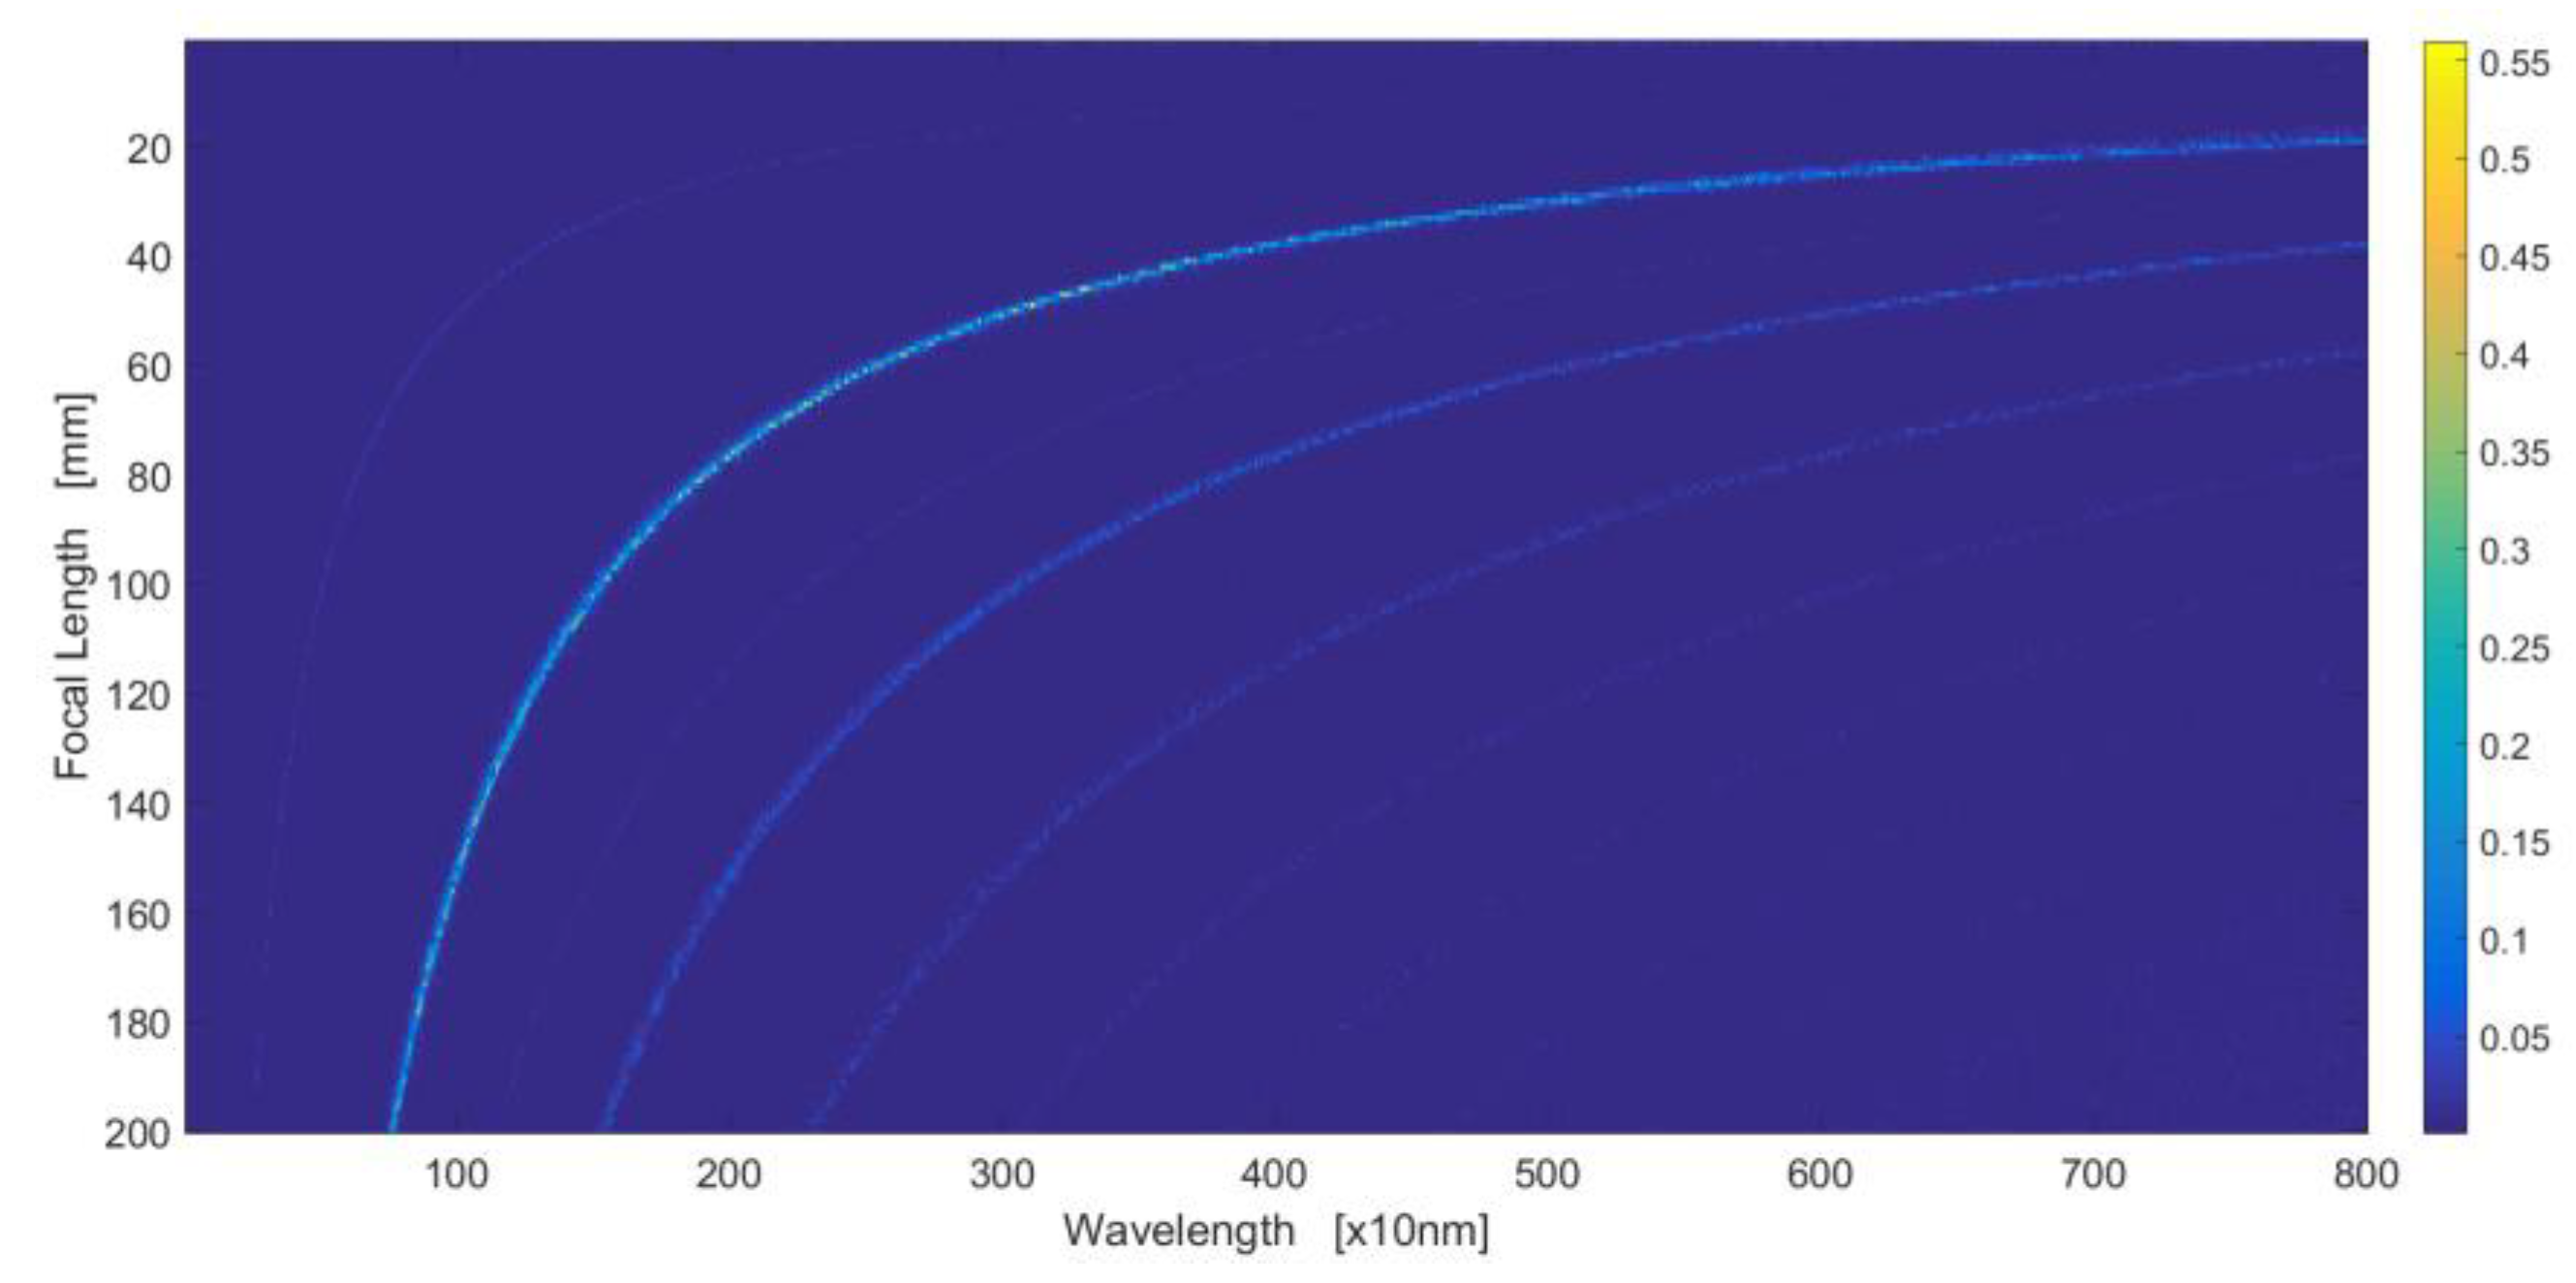
The ability of the lens to focus effectively on all key gas spectral bands individually was simulated in MATLAB. To determine how well the lens discriminates between individual spectral bands as a function of focal length, a new variable termed the Aperture Restricted Effective Spectral Radiosity (ARESR) is introduced. The ARESR is defined as the ratio of the incident radiation passing through the aperture to the total radiation at the aperture plane. As the focal length of the lens was adjusted from 2 mm–200 mm, the ARESR at every wavelength is plotted from 10 nm–800 nm in Figure 4.
It is apparent from Figure 1, Figure 2, Figure 3 and Figure 4 that the simulated BZP lens can focus in all wavelengths where the key gases absorb IR radiation. With regards to the ability of the lens to discriminate between individual key gases as a function of focal length, the normalized relative absorption of each gas with respect to all other gases was also simulated (see Figure 5). This was calculated by multiplying the ARESR data of Figure 4 with the absorption data of Figure 1 and normalizing it to 1.
Figure 5 demonstrates how well the absorption of each key gas can be discriminated from all other key gases. By adjusting the focal length from 33 mm to 51 mm, it is possible to focus the lens on every individual key gas absorption band, thereby proving its function as an effective swept wavelength filter used for DGA.
Acknowledgments
Authors would like to acknowledge Natural Sciences and Engineering Research Council (NSERC) of Canada for their financial support.
Conflicts of Interest
The authors declare no conflict of interest. The founding sponsors had no role in the design of the study; in the collection, analyses, or interpretation of data; in the writing of the manuscript, and in the decision to publish the results.
References
- Nishant, A.C. Failure Analysis of a Power Transformer using Dissolved Gas Analysis—A Case Study. Int. J. Res. Eng. Technol. 2014, 03, 300–303. [Google Scholar]
- Lee, E.; Meng, W. Dissolved Gas Analysis (DGA) of mineral oil used in transformers. The Singapore Engineer, May 2009; 4–5. [Google Scholar]
- Hamrick, L.; Dissolved Gas Analysis for Transformers. NETA World 2010. Available online: http://www.netaworld.org/sites/default/files/public/neta-journals/NWwtr09_Hamrick.pdf (accessed on 7 August 2017).
- Kirz, J.; Jacobsen, C.; Howells, M. Soft X-ray microscopes and their biological applications. Q. Rev. Biophys. 1995, 28, 33–130. [Google Scholar] [CrossRef] [PubMed]
- Young, M. Zone plates and their aberrations. J. Opt. Soc. Am. 1962, 62, 106–110. [Google Scholar] [CrossRef]
- Hildenbrand, J.; Wöllenstein, J.; Hartwig, S.; Eberhardt, A.; Halford, B.; Moreno, M.; Gràcia, I. A compact optical multichannel system for ethylene monitoring. Microsyst. Technol. 2008, 14, 637–644. [Google Scholar] [CrossRef]
- Ghoneim, S.; Shoush, K.A. Diagnostic Tool for Transformer Fault Detection Based on Dissolved Gas Analysis. IOSR J. Electr. Electron. Eng. 2014, 9, 20–26. [Google Scholar] [CrossRef]
- Rothman, L.S.; Gordon, I. E.; Babikov, Y.; Barbe, A.; Benner, D.C.; Bernath, P.F.; Campargue, A. The HITRAN2012 molecular spectroscopic database. J. Quant. Spectrosc. Radiat. Transf. 2013, 130, 4–50. [Google Scholar] [CrossRef]
Figure 1.
DGA key gas absorption coefficients as a function of wavelength [8].
Figure 1.
DGA key gas absorption coefficients as a function of wavelength [8].

Figure 2.
Block diagram of BZP-based spectrometer.

Figure 3.
(a) MATLAB Simulation of first few BZP zones. (b) BZP viewed under microscope.

Figure 4.
Lens ARESR plotted as function of wavelength.

Figure 5.
Relative absorption, ζ, of each key gas as function of focal length.

Publisher’s Note: MDPI stays neutral with regard to jurisdictional claims in published maps and institutional affiliations. |
© 2017 by the authors. Licensee MDPI, Basel, Switzerland. This article is an open access article distributed under the terms and conditions of the Creative Commons Attribution (CC BY) license (https://creativecommons.org/licenses/by/4.0/).
Share and Cite
MDPI and ACS Style
Glowacki, P.; Shafai, C. Binary Zone Plate Infrared Spectrometer for Dissolved Gas Analysis in High Voltage Equipment. Proceedings 2017, 1, 555. https://doi.org/10.3390/proceedings1040555
AMA Style
Glowacki P, Shafai C. Binary Zone Plate Infrared Spectrometer for Dissolved Gas Analysis in High Voltage Equipment. Proceedings. 2017; 1(4):555. https://doi.org/10.3390/proceedings1040555
Chicago/Turabian StyleGlowacki, Pawel, and Cyrus Shafai. 2017. "Binary Zone Plate Infrared Spectrometer for Dissolved Gas Analysis in High Voltage Equipment" Proceedings 1, no. 4: 555. https://doi.org/10.3390/proceedings1040555