Proceeding Paper

Characterization of Retinal Pigmented Epithelium Cells Density on a MicroElectrode Array Using Impedance Spectroscopy †

1
ESIEE—ESYCOM-Université Paris Est, Noisy-le-Grand, France
2
Institut de la Vision, Paris, France
*
Author to whom correspondence should be addressed.
Presented at the Eurosensors 2017 Conference, Paris, France, 3–6 September 2017.
Proceedings 2017, 1(4), 530; https://doi.org/10.3390/proceedings1040530
Published: 28 August 2017
(This article belongs to the Proceedings of Proceedings of Eurosensors 2017, Paris, France, 3–6 September 2017)

Abstract

:
This work is aiming at using impedance measurements on MicroElectrode Array (MEA) in order to evaluate the cellular density at its surface. As the context of these measurements is retinal implants, the retinal pigmented epithelium cells (RPE) are used as cellular model. We measured the impedance changes at 4 different locations of the MEA during 13 days (approximately one measure every two days) and the cell density by manually counting them by microscope imaging taken just after the impedance measurement. A correlation between the cell density and the impedance measurement’s change can be observed. The electrode interfaces and the biological cells are associated with an electrical model taking into account the ionic conduction (resistance) and polarization effects (capacitance).

1. Introduction

Based on microelectronic process, MultiElectrode Arrays are mainly used as neuron interfaces for recording or stimulation of neuronal activity [1]. The microelectrodes are used to connect the biological species to the electronic circuits. Microelectrodes can also be used as a way to monitor the biological tissue with bio-impedance measurement [2].
This work focus on planar retinal implants electrodes. Retinal implants electrodes are matrix-arranged and are placed beneath the retina to stimulate the neural circuits that are involved in vision. In the healthy subject such stimulation is achieved by the photoreceptor cells. In the case of photoreceptor loses, such implants electrode’s purpose is therefore to achieve the photoreceptor’s function. The information about the environing scene is filmed by a camera and transmitted to the electrodes in some way [3].
In this context, we used a porcine retinal pigment epithelium (RPE) cell model to perform in vitro cultures on a MicroElectrode Array (MEA). Electrodes used to stimulate the retinal cells are here used to monitor the environing tissues and cell growth over the MEA.

2. Materials and Methods

2.1. Cell Culture and Growth

We grew the RPE cells on the surface of two identical MEAs from Multi Channel Systems (MCS). Each MEA include 64 TiN electrodes that are distributed in a square shape. The electrodes diameter is 10 μm and the pitch is 100 μm. We performed impedance measurements on four different locations of the MEA (four quadrants). The measurements are made using a potentiostat (ZIVE SP1), with a 10 mVrms amplitude on a [10 Hz, 2 MHz] bandwidth.
During the whole experiment the MEA is kept inside a CO2 incubator (37 °C, 5% CO2), except for standard cell care and for microscopic imaging. Especially the impedance measurements are made while the MEA is inside the incubator. To connect the potentiostat to the four different locations of the MEA while keeping it inside the incubator, a number of external hand switches are used.
At day 1 the MEAs are cleaned and steam sterilized. At day 0 a porcine eyes dissection is performed and the RPE cells are extracted. After counting and dilution, a 1 mL solution containing 100,000 cells is prepared and put inside the MEAs well. The cells are then let to rest for about three hours. We measured the impedance between the numbered electrodes and their respective references constructed by connecting together the eight electrodes surrounding the measured one (Figure 1).
Measurement days are day 0, day 1, day 3, day 6, day 8, day 10 and day 13. When the cells medium has to be changed, the measurement is done either just before, either a few hours after, to let the medium settle into the CO2 atmosphere and heat up to the incubator’s temperature.
We also took microscope images every measurement day except at day 0. They are centered on the four measured electrodes. From those we manually counted the cells located inside the square defined by the eight reference electrodes.

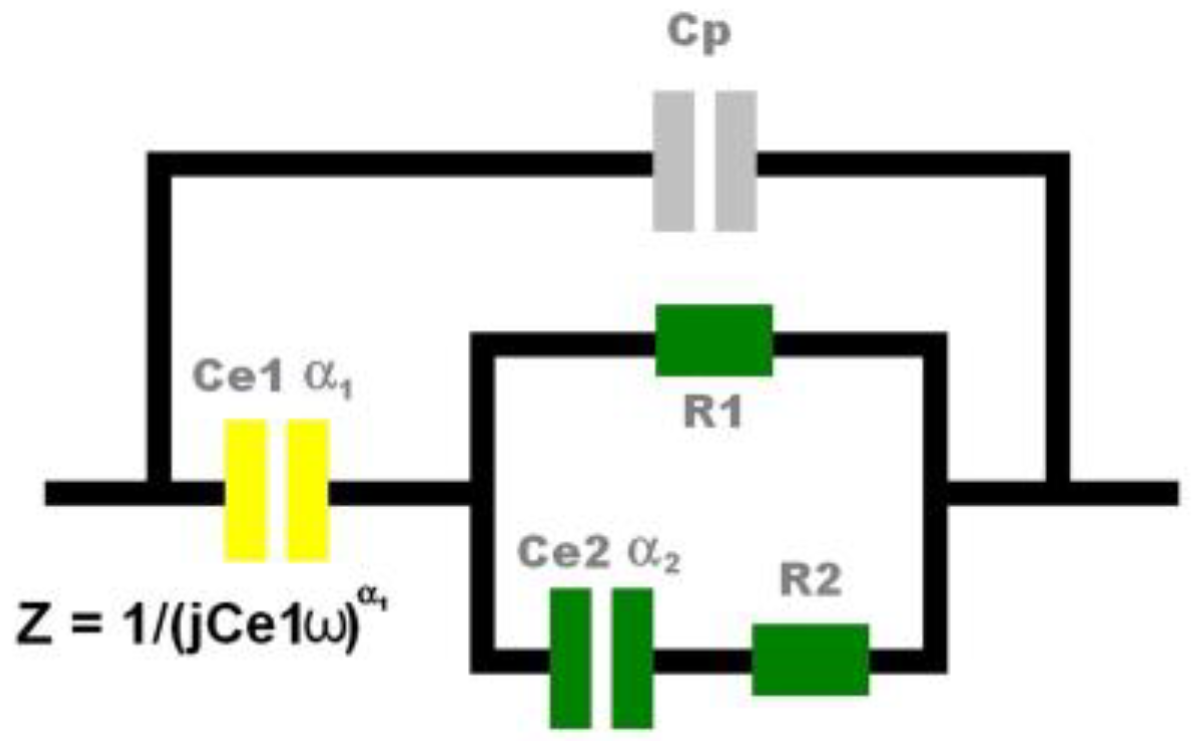
2.2. Electrical Model of the Cell Growth on MEA Device

The equivalent model circuit can be divided into three parts (Figure 2) the first part, based on a constant phase element (CPE), is related to the electrode/electrolyte interface (Ce1, α 1 ). It has been suggested that α 1 represents a distribution of time constants which reflects inhomogeneity of the electrode’s surface [4]. The second part is related to the biological medium, represented by the parameters R1, R2, and (Ce2, α 2 ). R1 represents the extracellular medium while (Ce2,   α 2 ) and R2 represent the cellular membrane and the intracellular medium respectively [5]. Finally, Cp represents the external parasitic capacitance. It is important to note that we have here neglected all component related to the diffusion of ions or to any type of chemical reactions. We did so because the lowest used frequency is high enough (10 Hz) and because the amplitude is small with respect to the standard reaction potential of water (10 mV versus 1.2 V).

3. Results

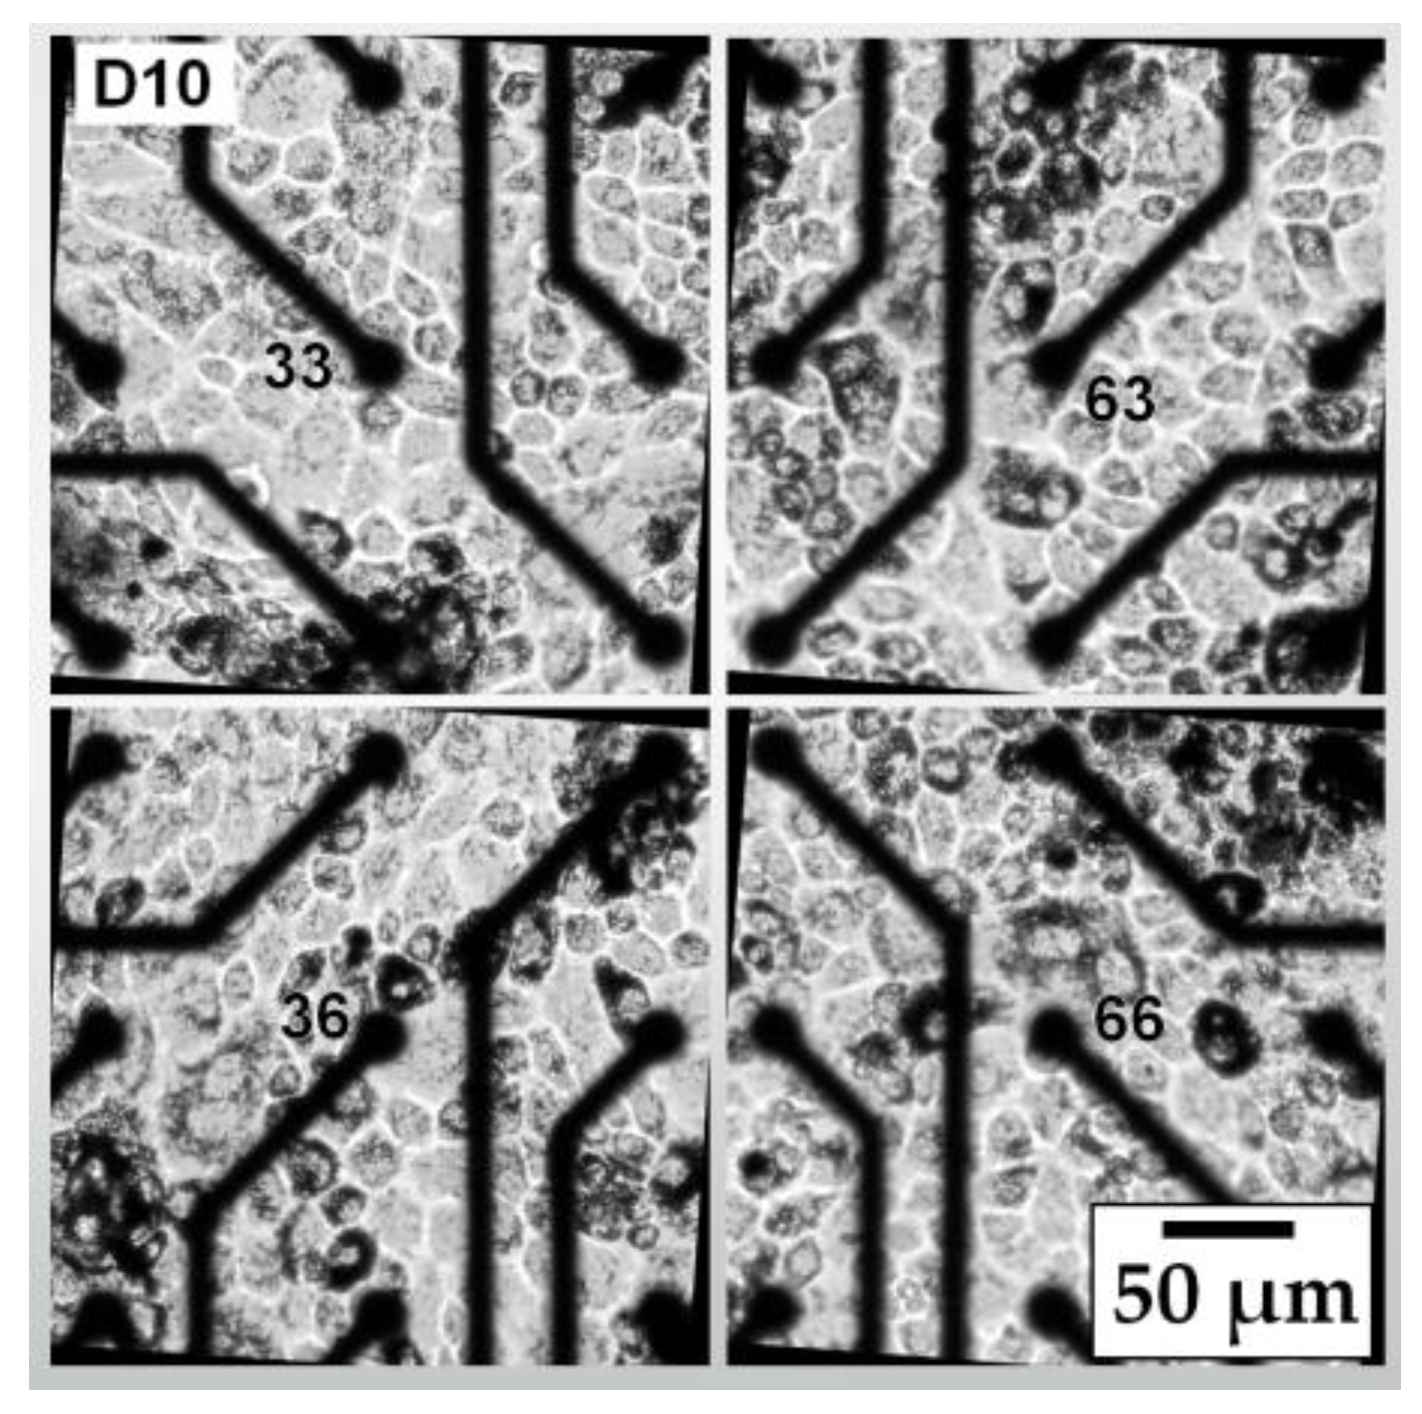
3.1. Cell Counting with Optical Measurement

At day 1, after the cells medium has been changed, we took the first batch of microscope images. We observed a clear difference in cell concentration on the two matrix. It is unlikely that the cell concentration at day 0 has been different between the two matrix as the cells have come from the same solution. Our hypothesis is that inside what we will call as of now “MEA 2”, a higher number of cells were washed out during this first medium changing process, with respect to MEA 1. Nevertheless, both cultures finally grew up to the point of covering the whole matrix (confluence state) without a problem to notice.
On the microscopic images we observed a densification of the cell layer as time passes. We counted the cells located inside the square shape defined earlier. The result is shown in Figure 4a. We observed the growth of cells and surprisingly starting day 6 the number of cells on MEA 2 was bigger than the one on MEA 1.
Figure 3. (a) Cell count over time. Dot is the mean number of all four quadrants and the error bar is the standard deviation; (b) Frequency of the maximum of the phase over time. Dot is the mean number of all four quadrants and the error bar is the standard deviation around the mean.
Proceedings 01 00530 g003
Figure 4. An impedance measurement example for electrode 33 MEA 2 at Day 1 (Black), Day 10 (Red) and without cells (Blue). Solid line = Modulus, Dotted line = Phase.
Proceedings 01 00530 g004

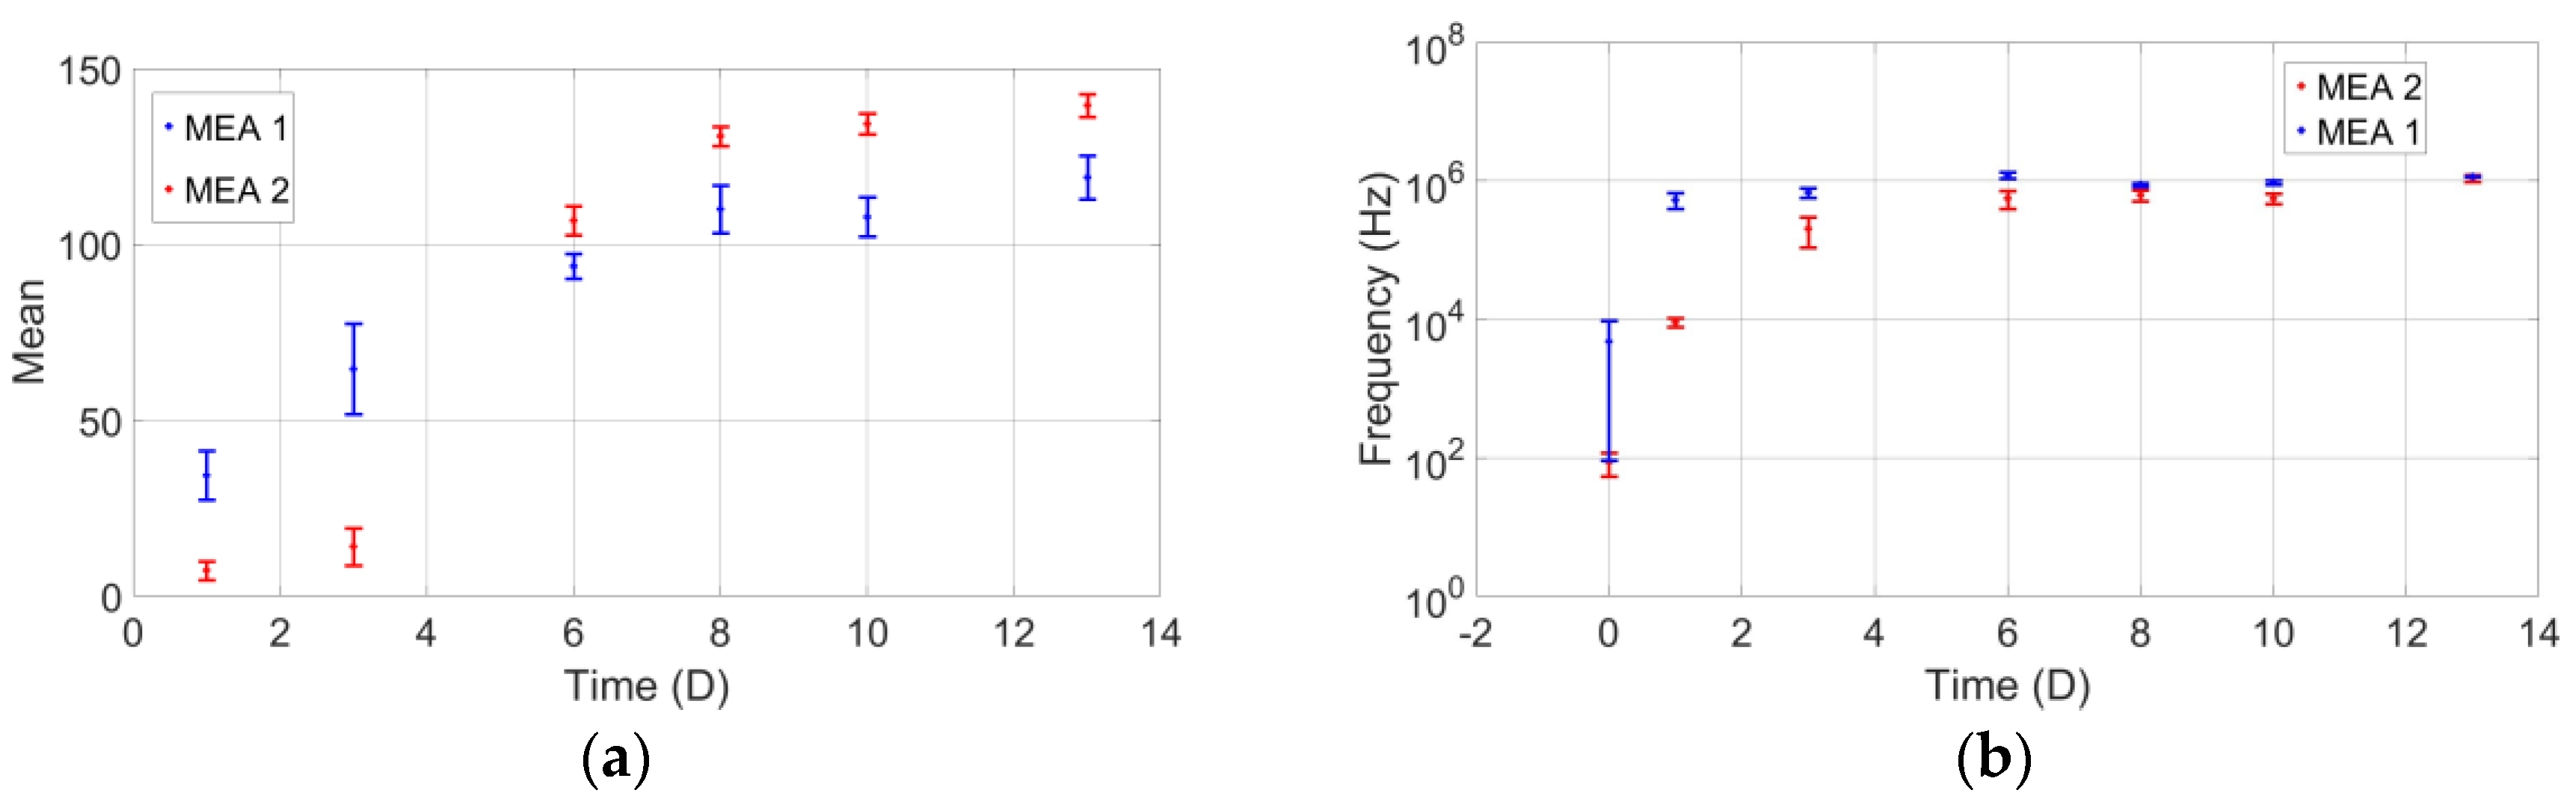
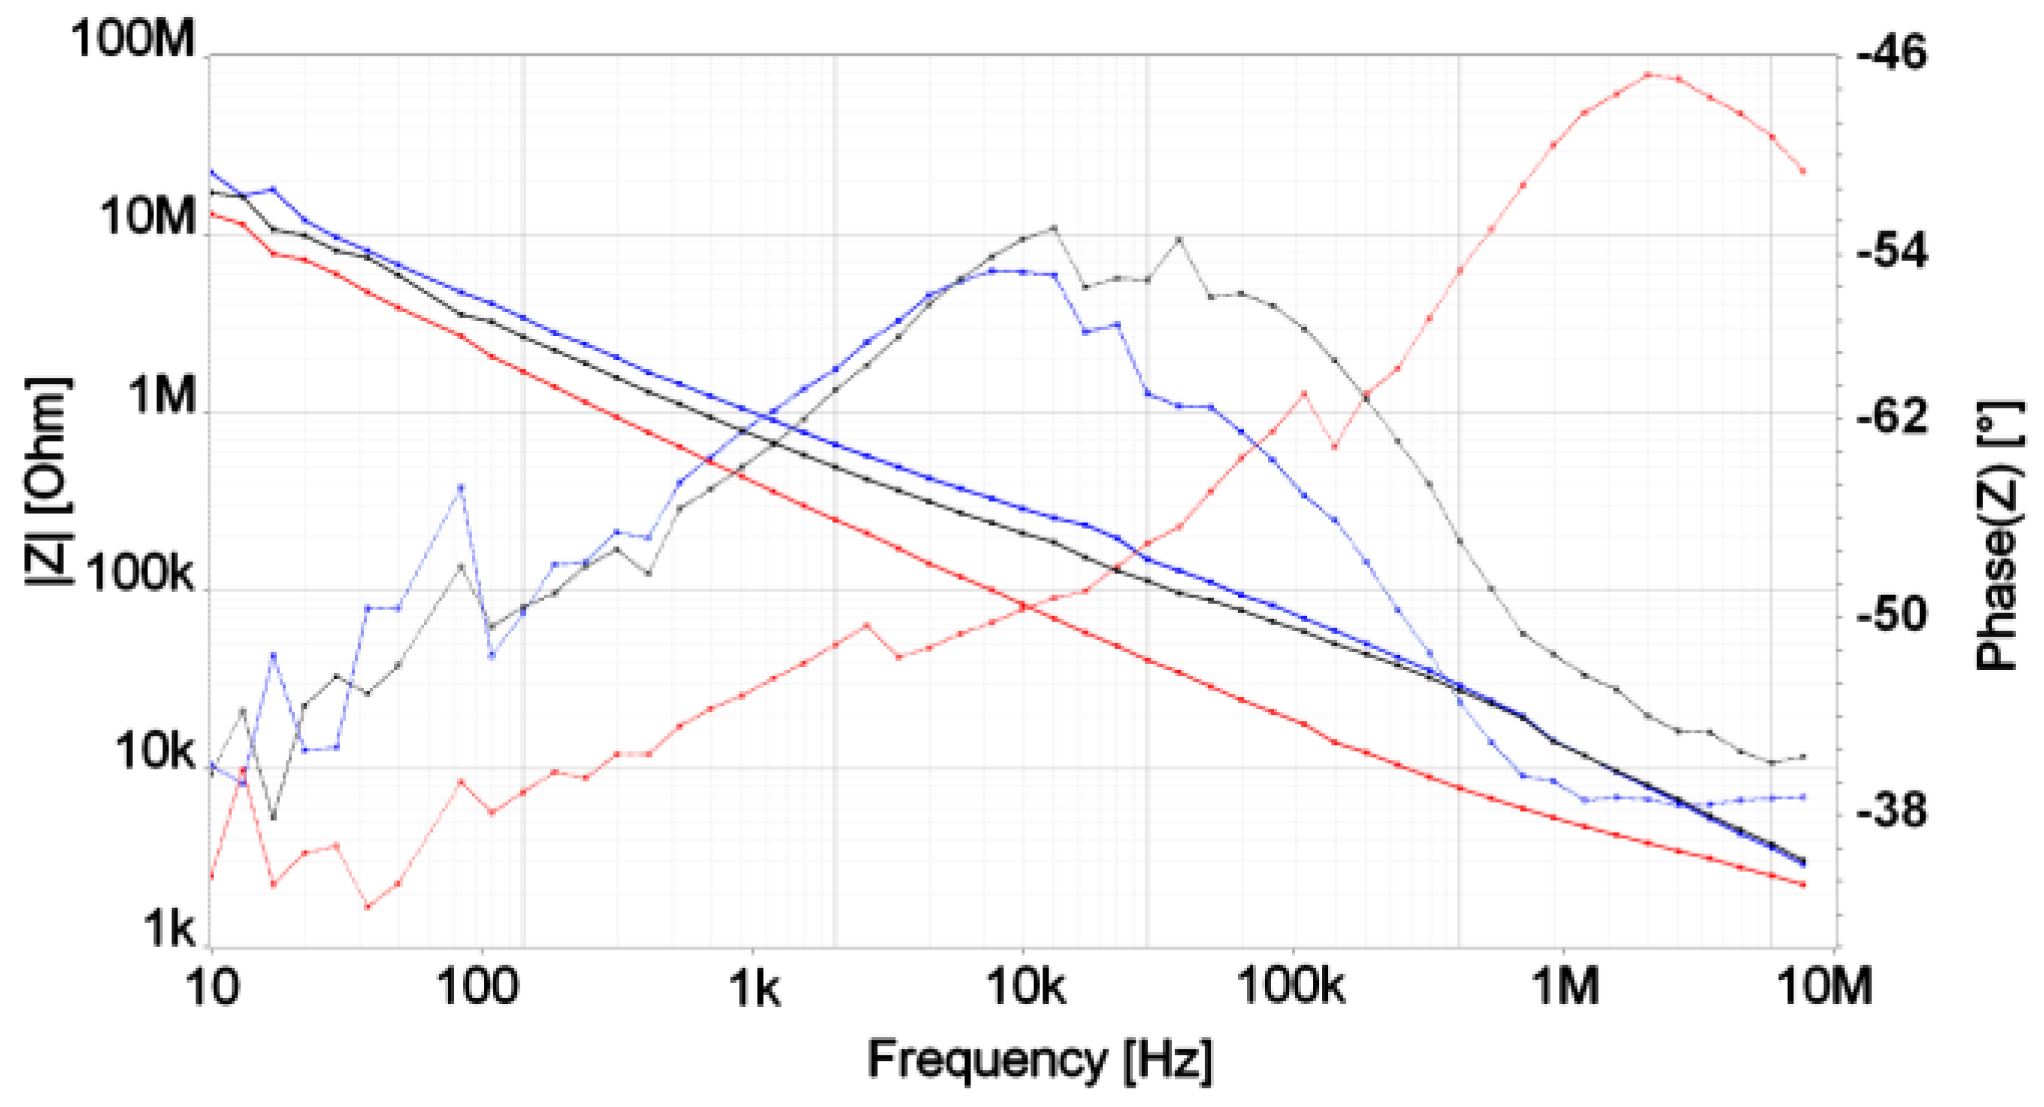
3.2. Electrical Measurements of Cell Growth

On the impedance measurements side we observed a hump shape for the phase’s impedance indicating a transition between low frequency capacitive behavior (electrode/electrolyte interface and extracellular medium) and high frequency capacitive behavior (cell membranes and intracellular medium). Figure 3 shows an example of an impedance measurement taken at day 1.

4. Discussion

While cells are growing, we observed a shift of the phase hump toward higher frequencies Figure 4. The shifting may reflect the densification of cell membrane as the global capacitance of the biological part should therefore drop (capacitors in series make a capacitance value smaller than one of the elements). But other work [6] suggest that the phase shift is toward low frequency. As such work was done with macro electrodes, the measures obtained should mainly reflect the cells. In our work, the electrodes are small so the impact of the electrodes themselves on the measurement is not negligible. The difference observed in our measurements may then be related to the effect of both the cells and electrodes in the case of microelectrodes. Another difference is that we measure the impedance between microelectrodes in the plane of the cells while [6] measures the impedance perpendicular to the cells plane. Looking at the impedance measurement and cell counting over time we observe a correlation between the cells growth on each MEA and its phase shift Figure 4. An interesting point is that the phase’s maximum frequency of MEA 2 is always lower than the one of MEA 1 Figure 4. However, the cell counting reveals that we cannot conclude on a relative cell density link between MEA 1 and 2 when looking at the impedance change. Indeed, Figure 4 shows that starting around day 6 cell amount on MEA 2 is higher of about 10% with respect to MEA 1. The perspective of this work would be to use such monitoring process in addition with different electrode materials and stimulation conditions to assess its performance in relation with cell viability.

Acknowledgments

J. Boutzen has a grant from the ENS Paris-Saclay PhD grant program.

Conflicts of Interest

The authors declare no conflict of interest.

References

  1. Frey, U.; Sedivy, J.; Heer, F.; Pedron, R.; Ballini, M.; Mueller, J.; Bakkum, D.; Hafizovic, S.; Faraci, F.D.; Greve, F.; et al. Switch-Matrix-Based High-Density Microelectrode Array in CMOS Technology. IEEE J. Solid State Circuits 2010, 45, 467–482. [Google Scholar] [CrossRef]
  2. Gamal, W.; Borooah, S.; Smith, S.; Underwood, I.; Srsen, V.; Chandran, S.; Bagnaninchi, P.O.; Dhillon, B. Real-time quantitative monitoring of hiPSC-based model of macular degeneration on Electric Cell-substrate Impedance Sensing microelectrodes. Biosens. Bioelectron. 2015, 71, 445–455. [Google Scholar] [CrossRef] [PubMed]
  3. Picaud, S.; Sahel, J.-A. Retinal prostheses: Clinical results and future challenges. Comptes R. Biol. 2014, 337, 214–222. [Google Scholar] [CrossRef] [PubMed]
  4. Hirschorn, B.; Orazem, M.E.; Tribollet, B.; Vivier, V.; Frateur, I.; Musiani, M. Determination of effective capacitance and film thickness from constant-phase-element parameters. Electrochim. Acta 2010, 55, 6218–6227. [Google Scholar] [CrossRef]
  5. Pliquett, U. Bioimpedance: A Review for Food Processing. Food Eng. Rev. 2010, 2, 74–94. [Google Scholar] [CrossRef]
  6. Savolainen, V.; Juuti-Uusitalo, K.; Onnela, N.; Vaajasaari, H.; Narkilahti, S.; Suuronen, R.; Skottman, H.; Hyttinen, J. Impedance Spectroscopy in Monitoring the Maturation of Stem Cell-Derived Retinal Pigment Epithelium. Ann. Biomed. Eng. 2011, 39, 3055. [Google Scholar] [CrossRef] [PubMed]
Figure 1. A selection of microscope images (magnification ×20) taken at day 10. Electrodes diameter is 10 μm.
Proceedings 01 00530 g001
Figure 2. The equivalent circuit model of the electrode (yellow) and biological medium (green). Z is the expression of the impedance of a CPE element.
Proceedings 01 00530 g002
Publisher’s Note: MDPI stays neutral with regard to jurisdictional claims in published maps and institutional affiliations.

