Proceeding Paper

Separation of Sensitivity Contributions in Tin Oxide Thick Film Sensors by Transmission Line Model Measurements at Isothermal and Thermally Modulated Operation †

1
Institute for Sensor and Information Systems, Karlsruhe University of Applied Sciences, 76133 Karlsruhe, Germany
2
Department of Chemistry and Food Chemistry, Dresden University of Technology, 01069 Dresden, Germany
*
Author to whom correspondence should be addressed.
Presented at the Eurosensors 2017 Conference, Paris, France, 3–6 September 2017.
Proceedings 2017, 1(4), 476; https://doi.org/10.3390/proceedings1040476
Published: 9 August 2017
(This article belongs to the Proceedings of Proceedings of Eurosensors 2017, Paris, France, 3–6 September 2017)

Abstract

:
Transmission line modelling (TLM) techniques were used to study the sensitivity behaviour to CO and propene in distinct regions of tin oxide thick film gas sensors operated in isothermal and thermo-cyclic mode. The sensitive layer showed an increased sensitivity to propene in the vicinity of the Pt electrodes at isothermal operation and pronounced specific features at thermo-cyclic operation. Simulation by Finite Element Analysis (FAE) gives insight into the electrical behaviour of the contact area and enables a detailed analysis of the thickness dependence of sensitivity effects.

1. Introduction

One of the great challenges in metal oxide gas sensor research is the spatially resolved estimation of sensitivity effects in dependence of the combination of electrode and gas sensing material. A metal oxide gas sensor needs to be considered as an (electro-)chemical reactor, whose gas response, the change in resistivity, is composed of contributions from different regions of the sensor element. By Transmission Line Modelling (TLM) [1], it is possible to distinguish between these contributions to the overall resistance and the corresponding sensitivity effects in the bulk material of the sensitive layer ( R s h ), the contact area ( R c ) and the modified layer in the vicinity of the electrodes ( R m s ). Additionally, as shown in previous works, thermo-cyclic operation of metal oxide gas sensors yields gas specific conductance over time profiles (CTP) which can be used for gas identification and analysis [2]. By combining both techniques a detailed analysis of the regional contributions to the sensor responses dependent on temperature rate, layer thickness and electrode material can be achieved.

2. Materials and Methods

2.1. Sensor Setup

The experiments were carried out using sensor chips specially designed for TLM measurements (Figure 1). To provide different electrode spacing on a single chip, six electrode fingers of gold or platinum with the dimensions given in Table 1 were realized on alumina chips with a resistive heater and a temperature sensor on the reverse side. The metallic micro-structures were prepared by thin-film PVD-techniques combined with usual photolithographic methods. Sensitive layers composed of nanocrystalline tin oxide dispersed in an organic paste were dispensed and sintered. The layer thicknesses achieved after sintering varied between 10 and 50 μm.

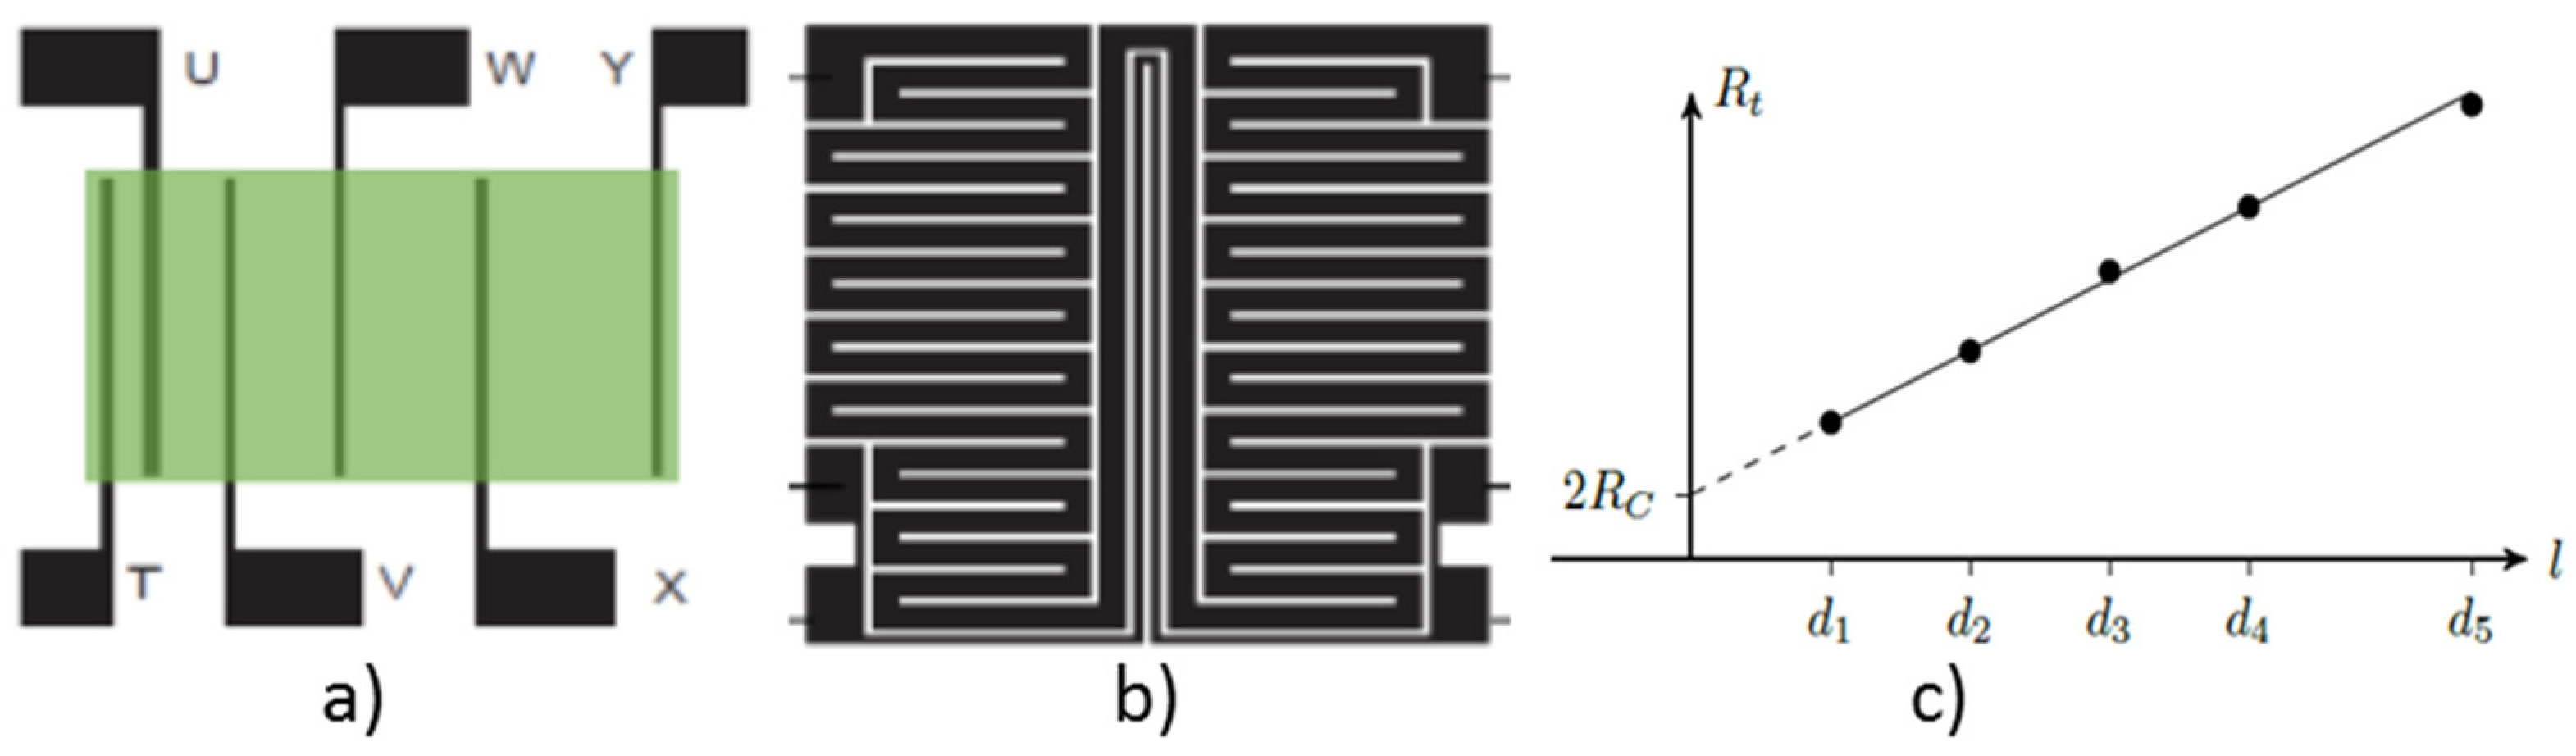
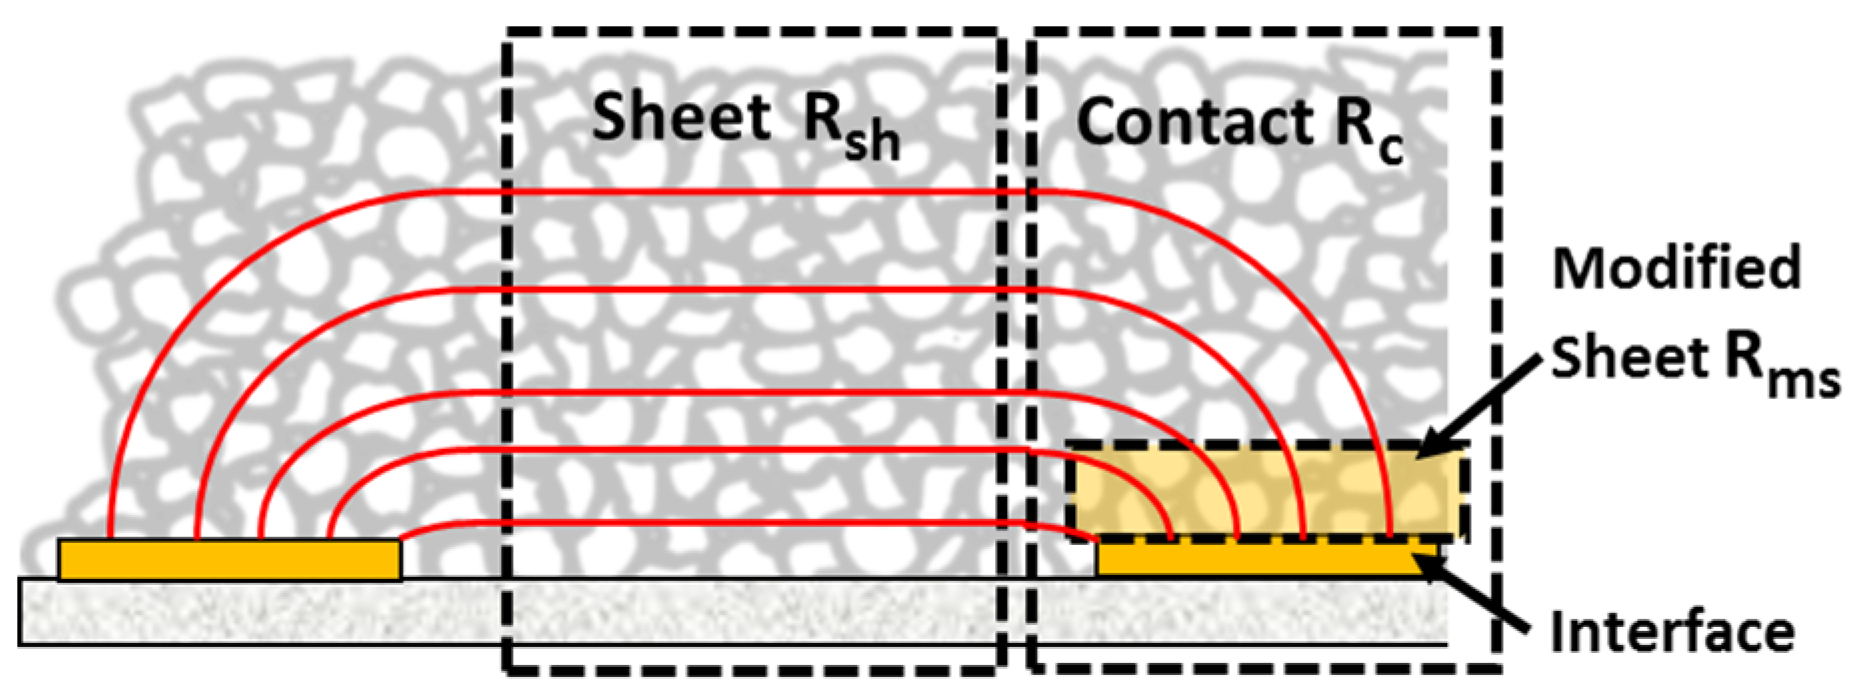
2.2. Principle of Measurement

Separate measurement of different parts of the sensing area according to Figure 2 is enabled by combining multiple two and four wire resistance measurements. In a single TLM measurement sequence the individual resistances R t    (R1 to R5) are measured. The resistances vs. electrode distance l show linear dependency (Figure 1c) and, by applying
R t ( l ) = R s h . l W + 2 R c
R s h (slope) and R c (y-intercept) can be calculated. When combined with an end resistance R e measurement [3] the transfer length L T
L T = d / arcosh ( R c R e )
can be estimated, which is a measure for that part (length) of electrode below the layer, that carries the current transmission. For separate considering of the electrical behavior of the sensitive layer in the vicinity of the electrodes the modified sheet resistance
R m s = R c . W L T
is introduced [4].

3. Results

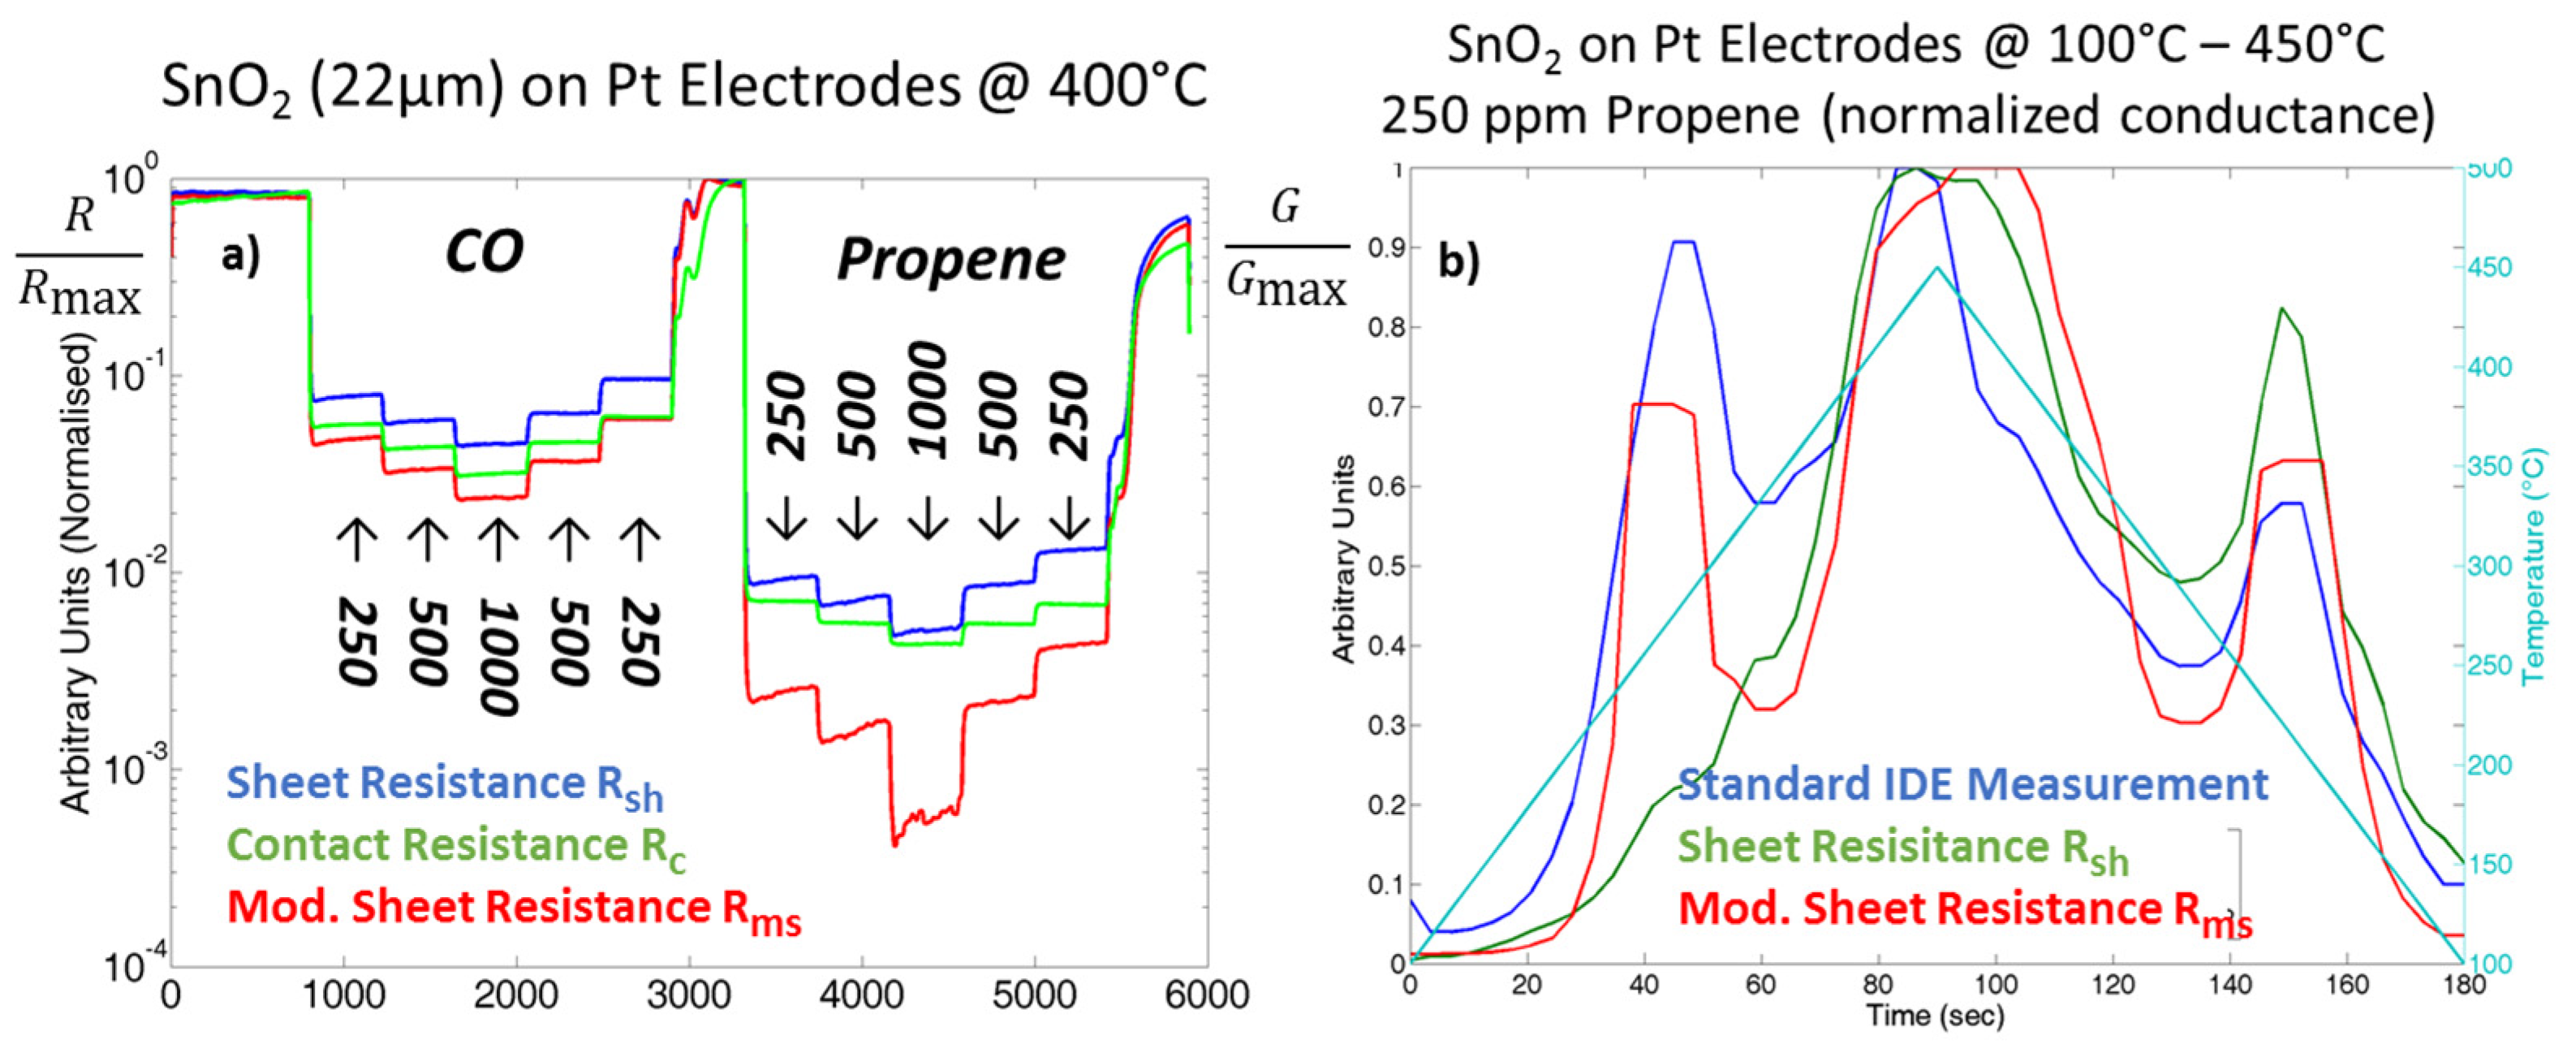
3.1. Gas Measurements
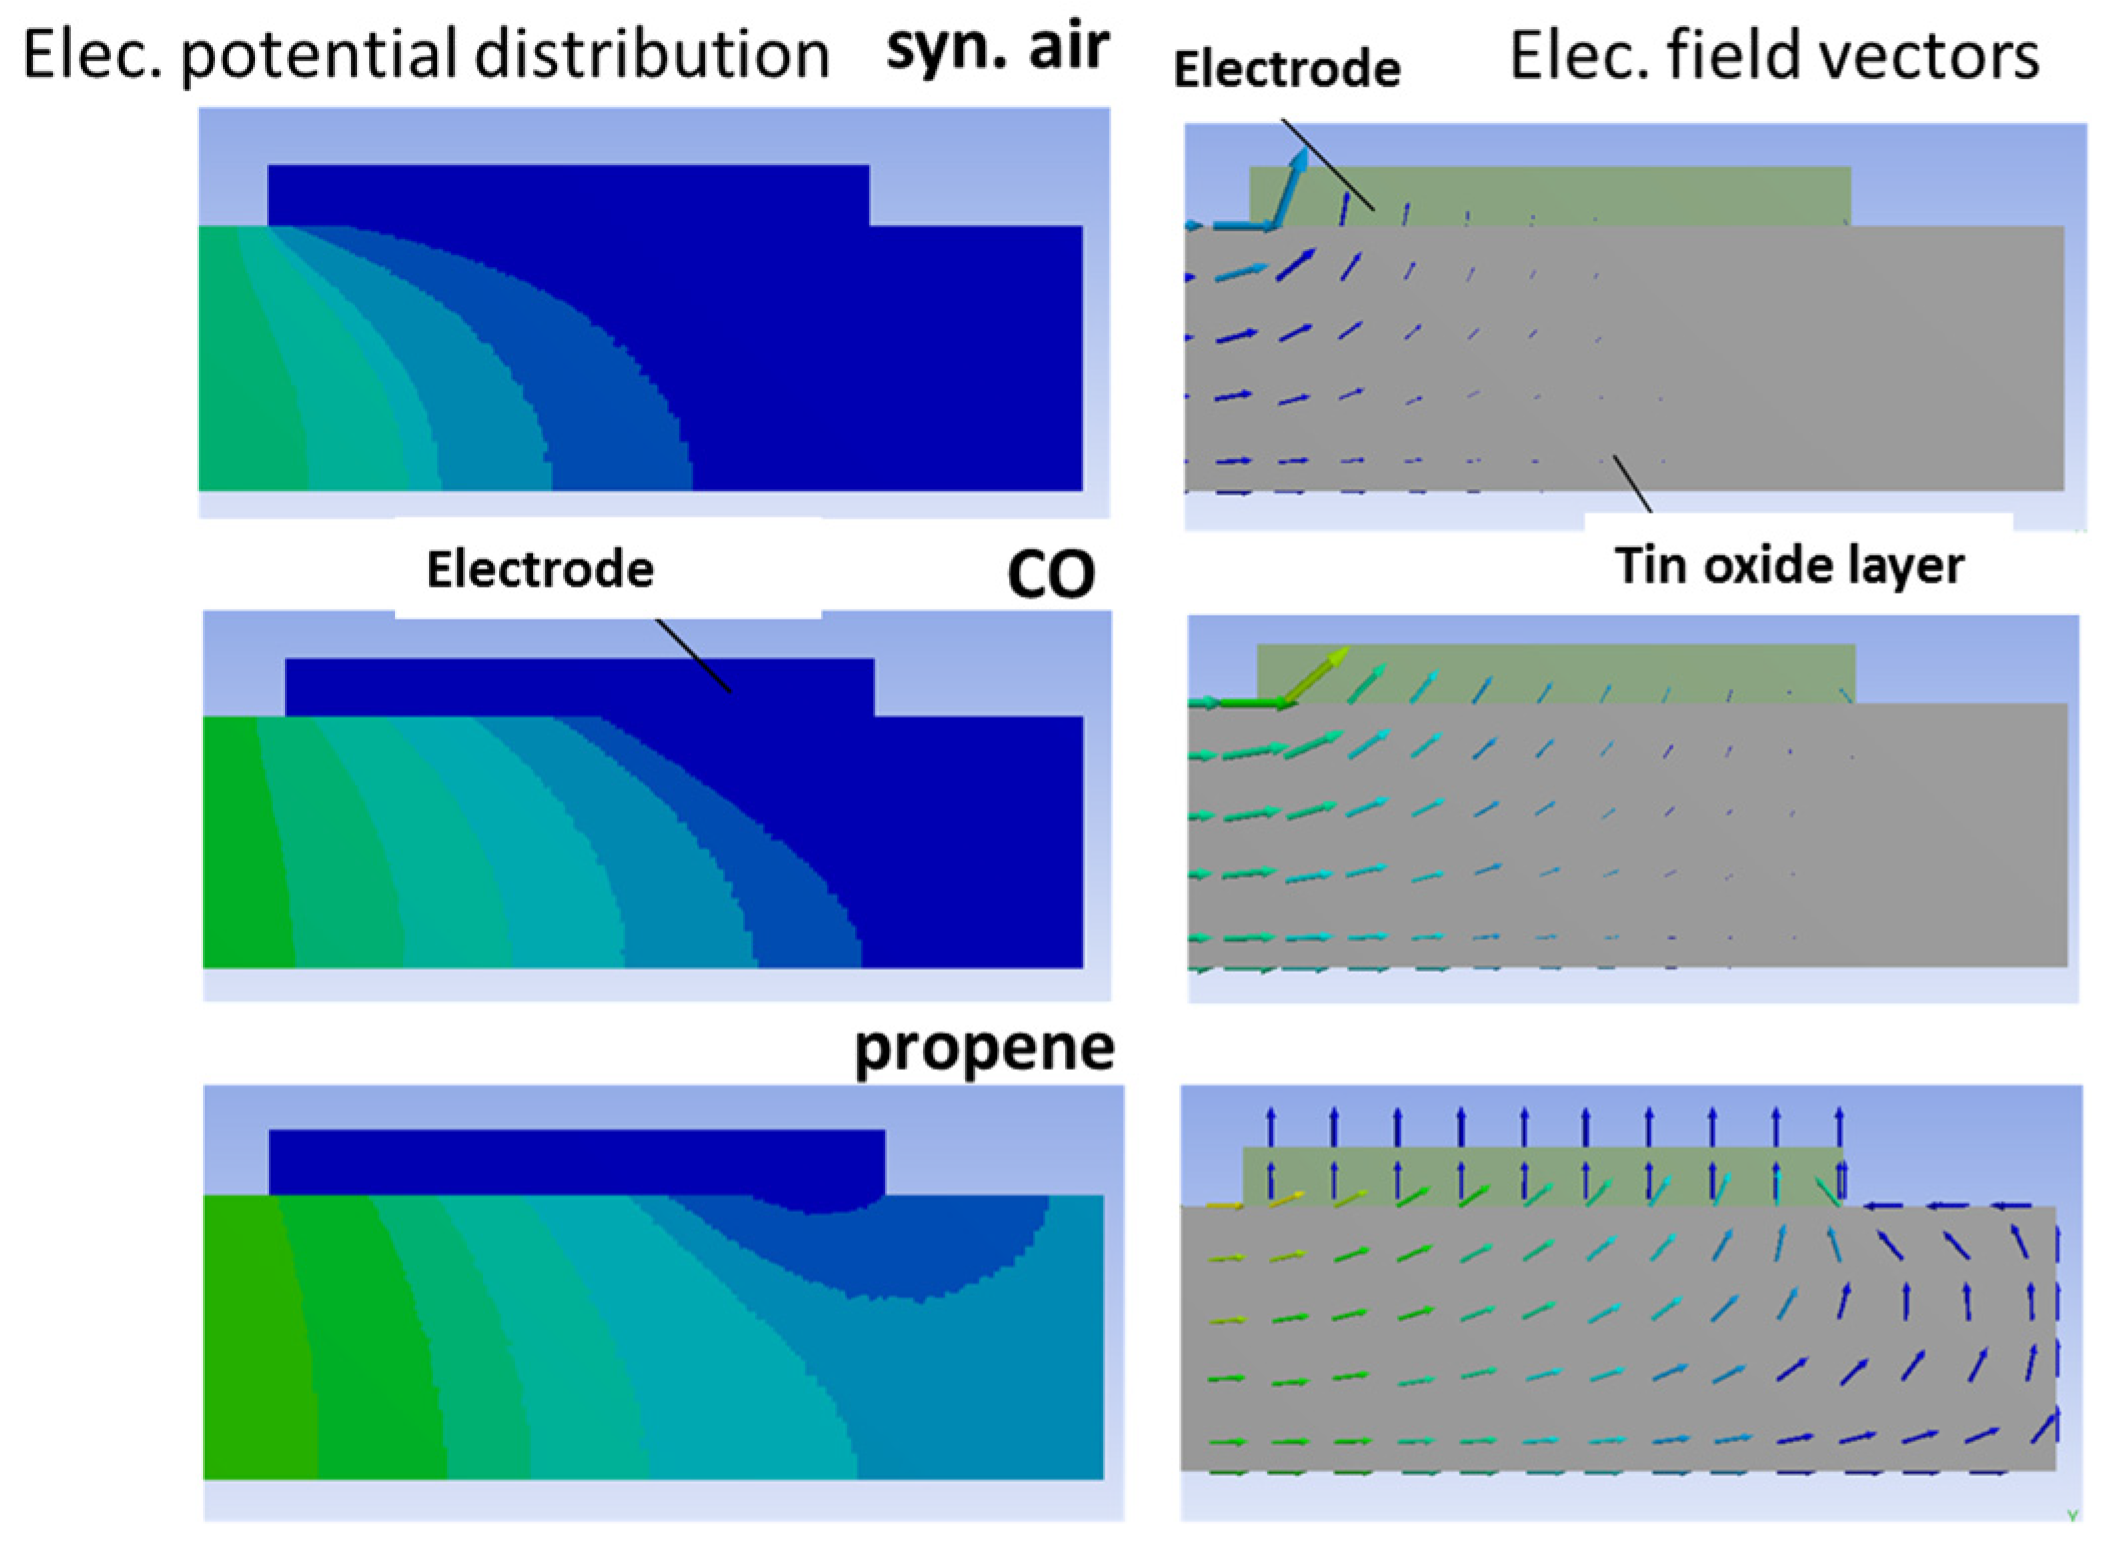
The sensors were exposed to CO and propene/air mixtures of varying concentrations. When comparing R s h , R c and R m s at an operation temperature of 400 °C, a similar response of SnO2 on Pt-electrodes is observed for CO (Figure 3a) whereas the modified sheet resistance R m s   shows an increased sensitivity to propene as compared to the bulk region R s h   . This individual behavior at propene exposure is represented as a sharp peak ( R m s ) at upward temperature rate in the non-steady state measurements and results in a clear distinction in the CTPs (Figure 3b). This indicates specific temperature dependent effects on conductance at different regions of the gas sensing layer, which are not resolvable by isothermal measurements.

3.2. Simulation

By simulation of the sensors electrical behaviour with the FAE software ANSYS Workbench, and employing a model incorporating the determined regional resistances, the current crowding at the leading electrode edge for synthetic air exposure, as well as the transition from a horizontal to a purely vertical contact for CO and propene exposure is visualized (Figure 4).

4. Conclusions

Transmission Line Modelling (TLM) in combination with thermal modulation of metal oxide gas sensors yields a high amount of additional information related to individual gas processes at specific areas of the gas sensitive layer. Regarding to sensitivity effects, separate calculation of R s h , R c and R m s is an attractive method, because it opens new possibilities for further improvement of the capability of gas analysis if the signals are analyzed by an appropriate numeric algorithm. The simulation of the electric field vectors related to the electrode processes visualizes the individual contributions to the layer resistivity dependent on the gas component.

Conflicts of Interest

The authors declare no conflict of interest.

References

  1. Hoefer, U.; Steiner, K.; Wagner, E. Contact and sheet resistance of SnO2 thin films from transmission-line model measurements. Sens. Actuator B Chem. 1995, 26, 59–63. [Google Scholar] [CrossRef]
  2. Illyaskutty, N.; Knoblauch, J.; Schwotzer, M.; Kohler, H. Thermally modulated multi sensor arrays of SnO2/additive/electrode combinations for enhanced gas identification. Sens. Actuator B Chem. 2015, 217, 2–12. [Google Scholar] [CrossRef]
  3. Berger, H.H. Models for contacts to planar devices. Solid State Electron. 1972, 15, 145–158. [Google Scholar] [CrossRef]
  4. Reeves, G.K.; Harrison, H.B. Obtaining the specific contact resistance from transmission line model measurements. IEEE Electron Devices Lett. 1982, 3, 111–113. [Google Scholar] [CrossRef]
Figure 1. (a) Electrode structure with active sensor area (green); and (b) reverse side of the chip with heater and temperature sensor structure; (c) Dependency of R1 to R5 on electrode spacing l according to Equation (1).
Proceedings 01 00476 g001
Figure 2. Schematic representation of a sensor layer (gray) with electrodes (gold) and electric field lines (red). The marked areas represent regions of individual electrical contribution to the overall resistance.
Proceedings 01 00476 g002
Figure 3. (a) Specific responses of the marked areas of the sensor, compared by the corresponding normalized resistance values. The normalized and area separated conductance contributions over a temperature cycle (CTP) for 250 ppm propene is given in (b).
Proceedings 01 00476 g003
Figure 4. ANSYS Simulation of the electrical potential distribution (left) and electric field vectors (right) in an electrical model of a tin oxide layer under a platinum terminal electrode in synthetic air (top), CO (middle) and propene (bottom).
Proceedings 01 00476 g004
Table 1. Electrode distances for TLM measurements (Figure 1).
RtR1 (T/U)R2 (U/V)R3 (V/W)R4 (W/X)R5 (X/Y)
Distance180 μm370 μm560 μm740 μm920 μm
Width of electrode W2000 μmLength of electrodes d50 μm
Publisher’s Note: MDPI stays neutral with regard to jurisdictional claims in published maps and institutional affiliations.

