Exploiting Inter- and Intra-Base Crossing with Multi-Mappings: Application to Environmental Data


1
National Council for Scientific Research Lebanon, 59 Zahia Salmane street, Jnah, 11-8281 Beirut, Lebanon
2
LIRMM, University of Montpellier, CNRS, 163 rue Auguste Broussonnet, 34090 Montpellier, France
3
OREME, University of Montpellier, CNRS, IRD, 163 rue Auguste Broussonnet, 34090 Montpellier, France
*
Author to whom correspondence should be addressed.
Big Data Cogn. Comput. 2018, 2(3), 25; https://doi.org/10.3390/bdcc2030025
Submission received: 25 May 2018
/
Revised: 9 August 2018
/
Accepted: 10 August 2018
/
Published: 19 August 2018
Abstract
:Environmental data are currently gaining more and more interest as they are required to understand global changes. In this context, sensor data are collected and stored in dedicated databases. Frameworks have been developed for this purpose and rely on standards, as for instance the Sensor Observation Service (SOS) provided by the Open GeoSpatial Consortium (OGC), where all measurements are bound to a so-called Feature of Interest (FoI). These databases are used to validate and test scientific hypotheses often formulated as correlations and causality between variables, as for instance the study of the correlations between environmental factors and chlorophyll levels in the global ocean. However, the hypotheses of the correlations to be tested are often difficult to formulate as the number of variables that the user can navigate through can be huge. Moreover, it is often the case that the data are stored in such a manner that they prevent scientists from crossing them in order to retrieve relevant correlations. Indeed, the FoI can be a spatial location (e.g., city), but can also be any other object (e.g., animal species). The same data can thus be represented in several manners, depending on the point of view. The FoI varies from one representation to the other one, while the data remain unchanged. In this article, we propose a novel methodology including a crucial step to define multiple mappings from the data sources to these models that can then be crossed, thus offering multiple possibilities that could be hidden from the end-user if using the initial and single data model. These possibilities are provided through a catalog embedding the multiple points of view and allowing the user to navigate through these points of view through innovative OLAP-like operations. It should be noted that the main contribution of this work lies in the use of multiple points of view, as many other works have been proposed for manipulating, aggregating visualizing and navigating through geospatial information. Our proposal has been tested on data from an existing environmental observatory from Lebanon. It allows scientists to realize how biased the representations of their data are and how crucial it is to consider multiple points of view to study the links between the phenomena.
1. Introduction
1.1. Environmental Data
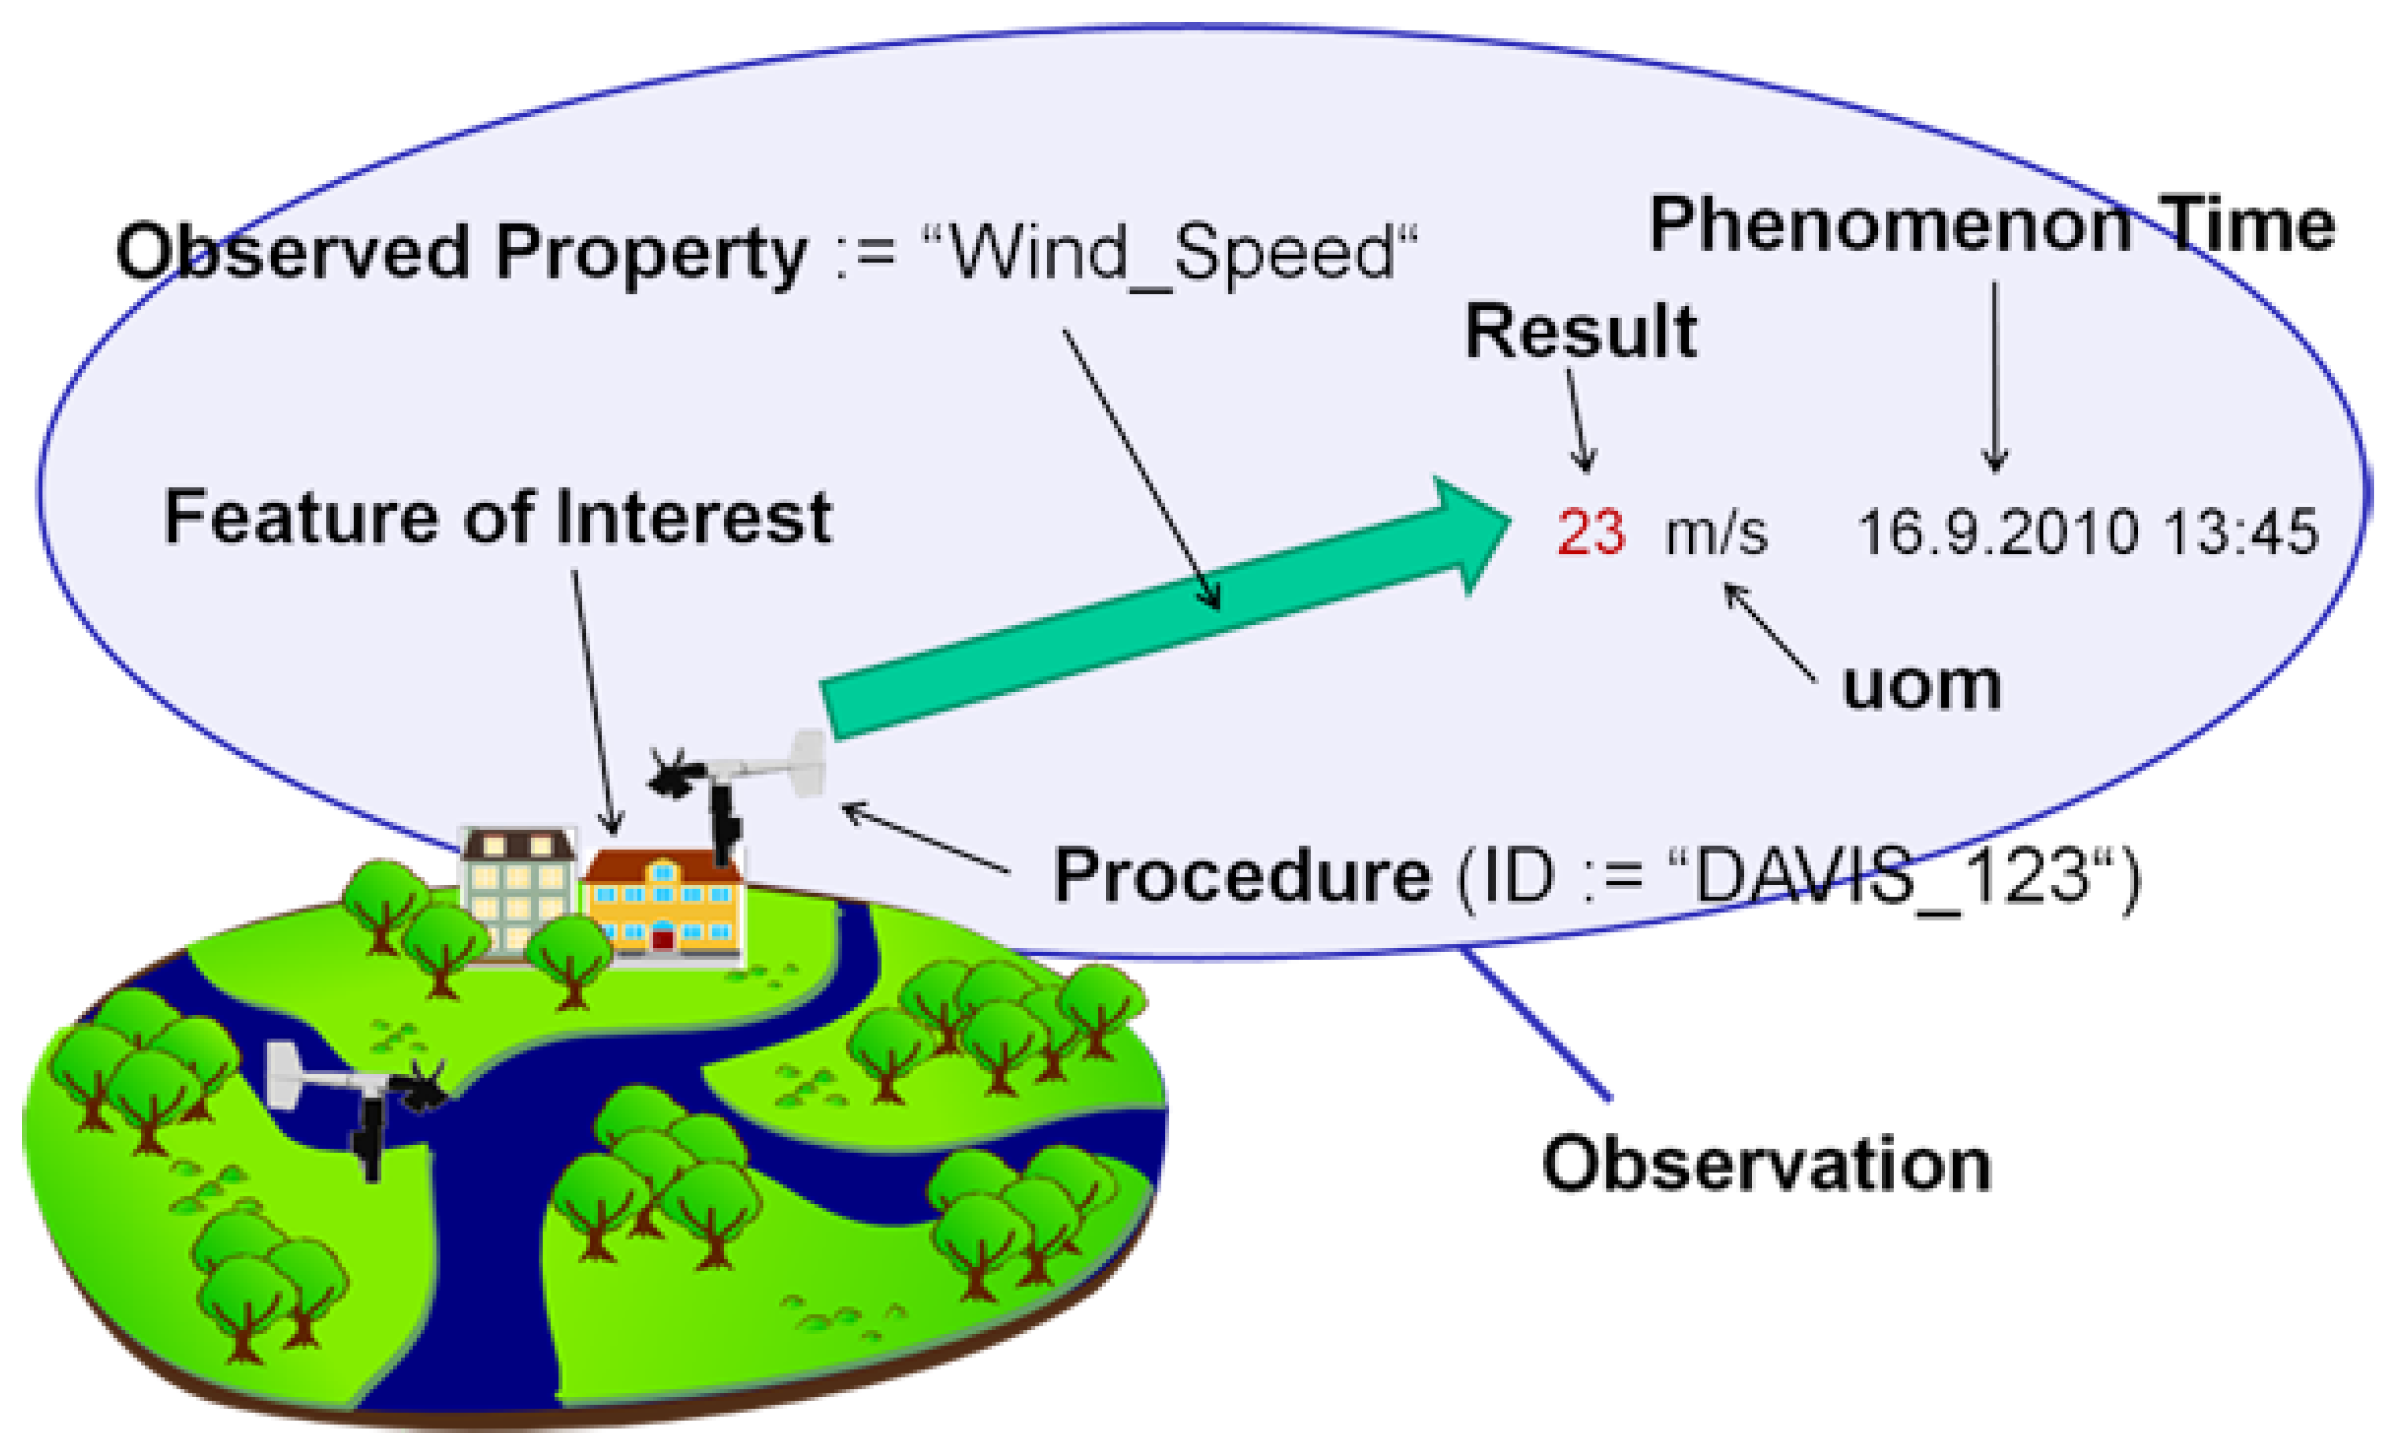
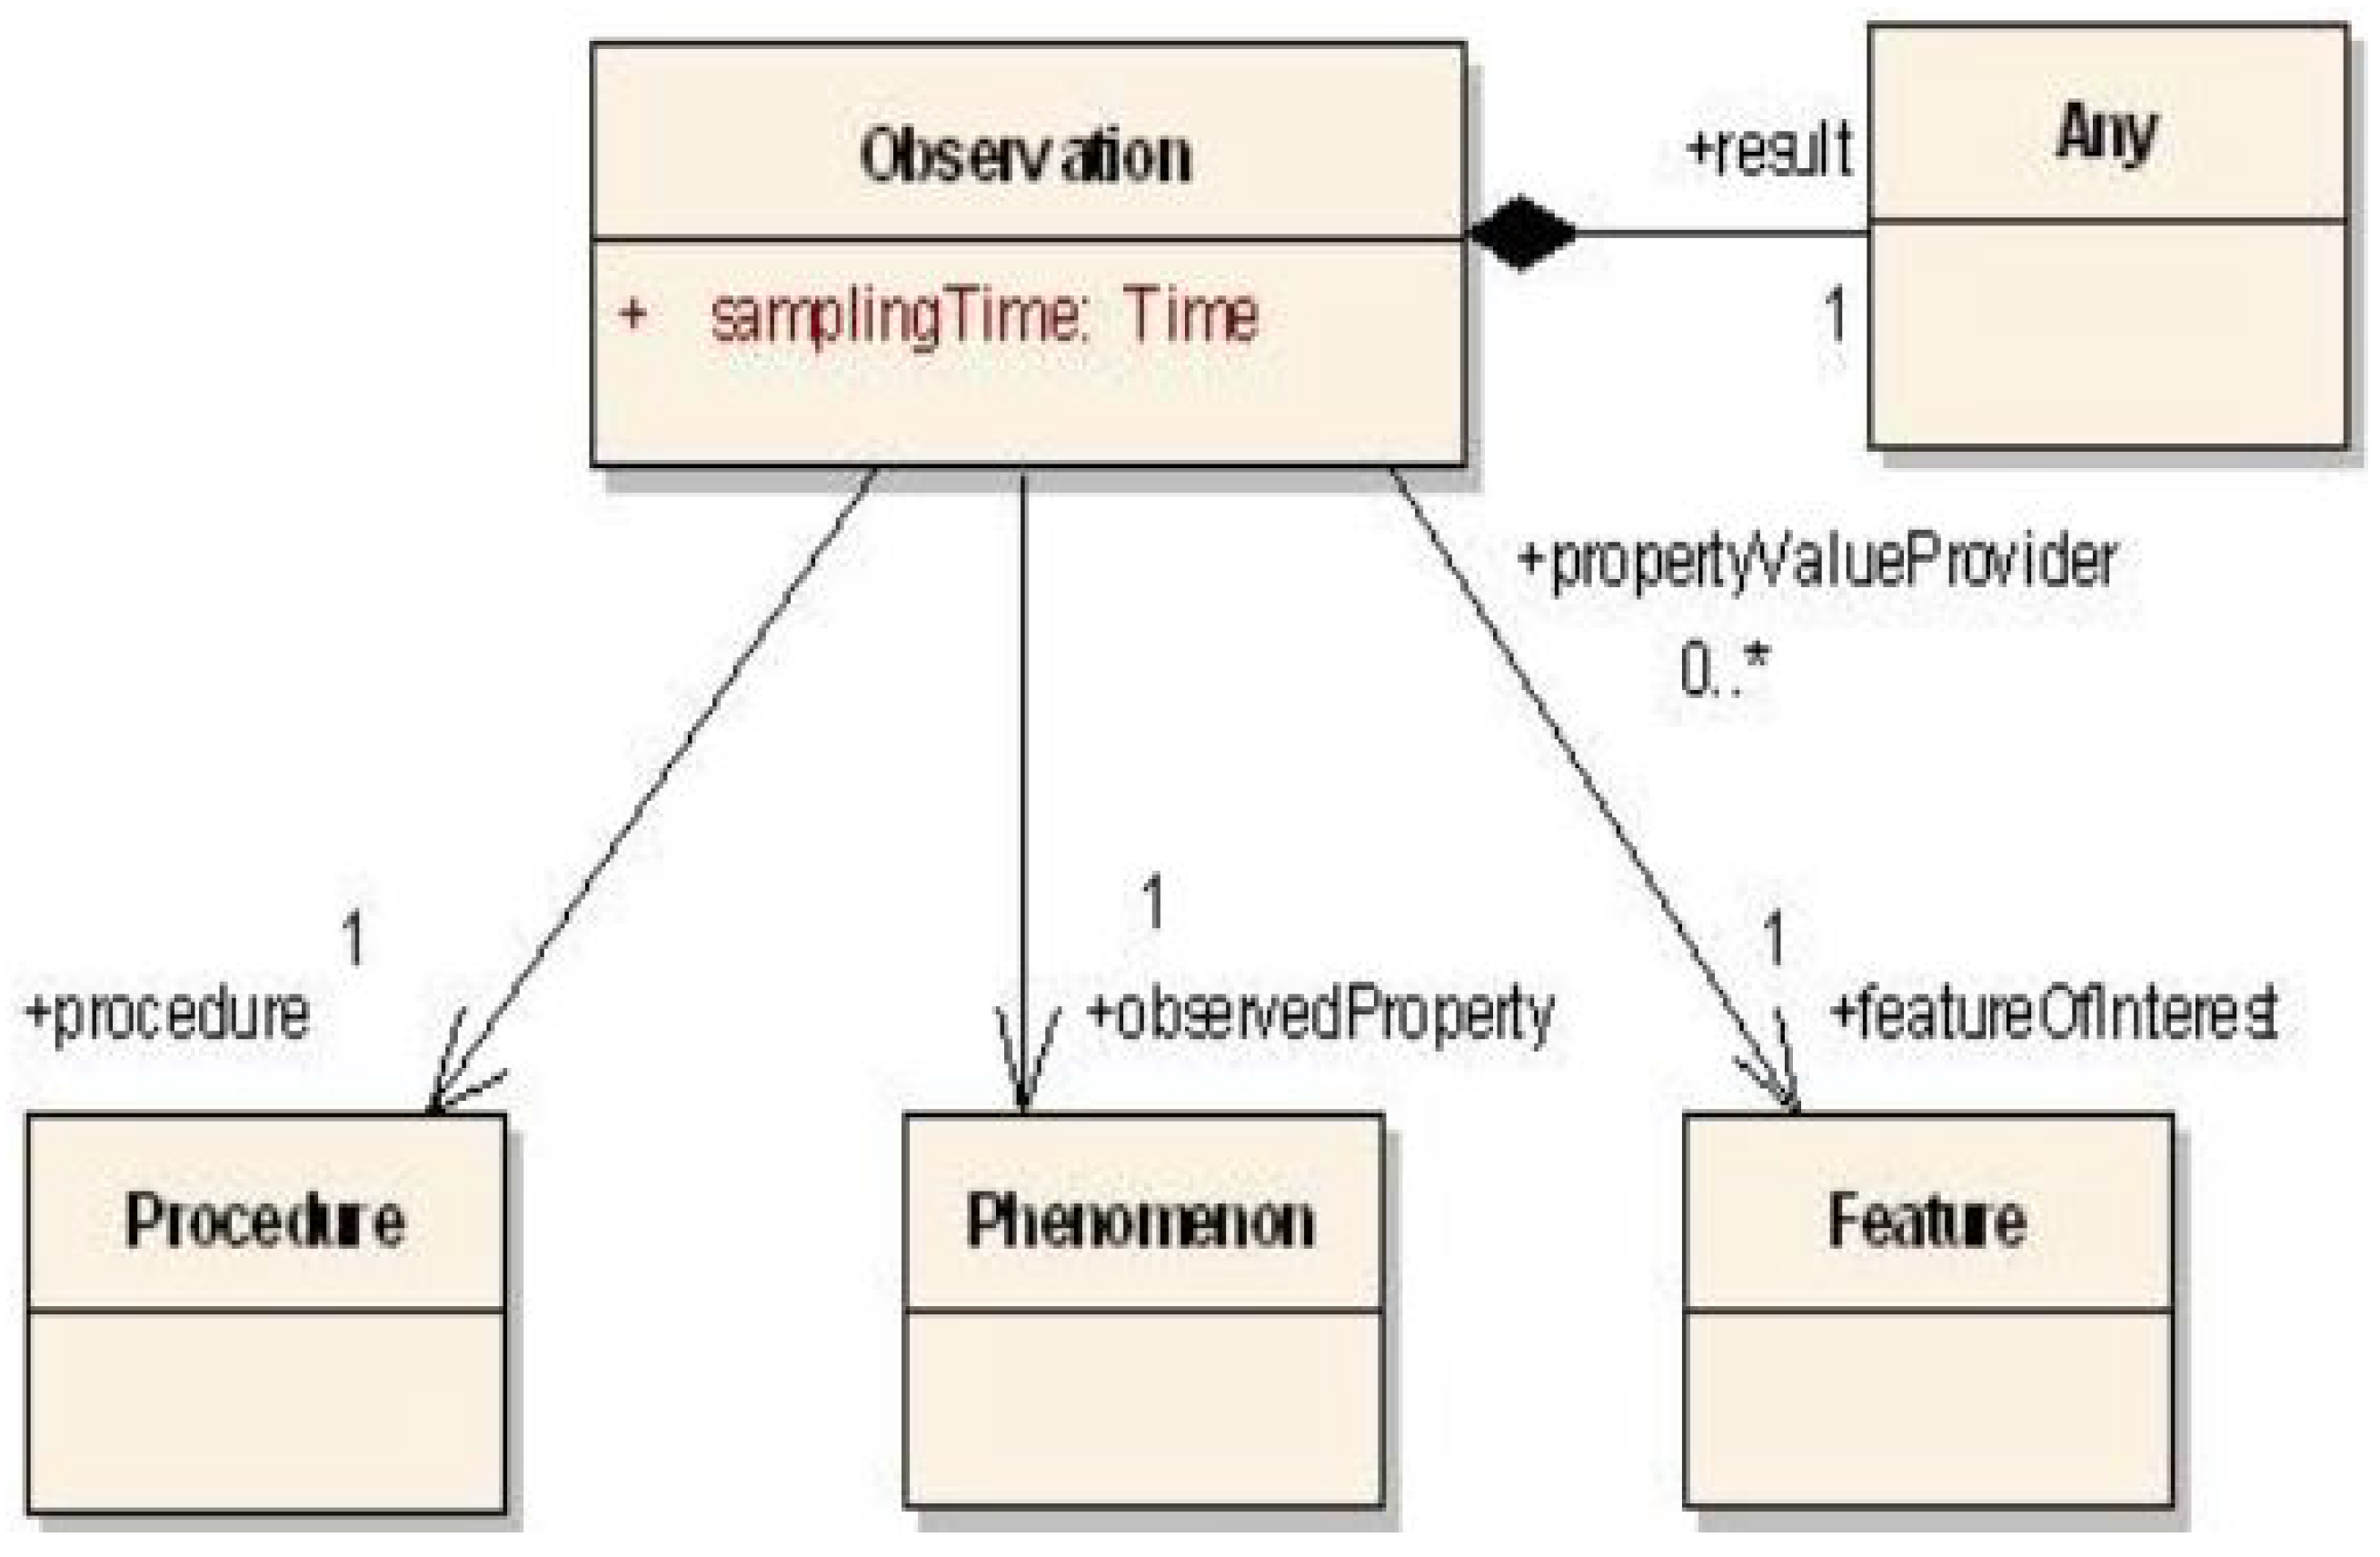
Environmental data are crucial to understand phenomena like the global change and impacts on our planet for many aspects of life, such as droughts, hurricanes, etc. Such environmental data are often collected by sensors. They are mainly represented by the following essential information: “Feature of Interest” (FoI), “date”, “location”, “phenomena” (observed properties), “procedure” (sensor), “measured values” and “units of measurements”. This information is collected and stored in the so-called “Sensor Observation Service (SOS) model”, as presented by Figure 1 and detailed later on in this article.
Many actors intervene in the collection and the transition of the produced data to its use: researcher producers, data users and contracted producers. Note here that the users of the data can be non-human, for example external information systems via web services. In this case, the data are consumed by users/consumers, which we will call users. If the data collected in environmental observatories are to become community resources, the data warehouse and the metadata it contains must be published in formats that allow investigators working both in and between observatories and scientific fields to easily access and interpret the data. This is particularly true, for example, of the confrontation of data acquired for non-scientific purposes and questions raised by the research community. Much qualitative information is captured within the framework of environmental monitoring for operational purposes. Reporting incidents and investigations are examples where many pieces of information can be collected by different and diverse observers, as well as the many types of items that need to be collected. How does one make the data produced by another intelligible for a purpose (possibly, but not necessarily scientific) that is very precise that has sometimes conditioned all the harvesting protocols and the format of the data?
To be able to preserve and effectively use environmental datasets, we must thus take into account the mandatory integration of standards that require the adoption of common implementation rules for metadata, data specifications and data sharing. It is then a question of relying on the currently-referenced standards such as the Open Geospatial Consortium (http://www.opengeospatial.org) (OGC).
These standards are intended to facilitate the transfer of data between itself and other organizations and cover a wide range of data types. By enforcing standard terminology and the inclusion of minimal metadata, they contribute to the interoperability of systems. SWE establishes interfaces and protocols that allow the creation of a Sensor Web interface through which applications and services can access the sensors of all types and the observations they have produced on the web.
The ISO 19156 (https://www.iso.org/standard/32574.html) standard defined in 2011 a conceptual scheme for observations and for the functions involved in sampling during observations. These provide models for the exchange of information describing observation acts and their results, both within and between different scientific and technical communities and environmental observatories.
1.2. Points of View
When dealing with environmental real data, the data producers often work on their model with an oriented vision that corresponds to their point of view. This point of view is determined by both their background and goals.
For instance, geographers and biologists do not have the same interests when they explore parts of the world, and their interests and points of view guide the decisions on the data they collect or not and on the way they organize the data, for instance in several files or databases, with some focus or some other ones.
If we consider the SOS model presented above, even if the data collected are the same, the so-called “Features of Interest” (FoI) and observed properties may vary depending on the fact that the scientist is observing the “geographic region” or “the population of animals” living in the area. This example is detailed in the running example (see Section 2.2.2).
As every database in the repositories of environmental data has been represented with one point of view, we claim that this can prevent data consumers from being aware that some data may be interesting even if they seem to address non-connected topics.
The existence of “non-explicitly defined” points of view can thus make it difficult to use and cross data. Yet, crossing such data may be of crucial interest, for instance to better understand the effects of global changes.
1.3. Case Study
Our work is applied in the framework of the O-LiFE (Observatoire Libano-Francais de l’Environnement: http://www.o-life.org) observatory. O-LiFE was created in 2011 as a shared environmental observatory between France and Lebanon to serve as a medium for scientific collaboration, resources and facilities’ sharing, as well as for knowledge and expertise exchange.
Our work is applied on real datasets in the framework of the O-LiFE observatory aiming at studying the critical zone around the Mediterranean Sea and addressing major environmental subjects such as water resources, biodiversity, natural hazards, environment management and, ultimately, land uses.
There is indeed a growing need to cross several types of data for simultaneous analysis. An example is dust monitoring, where real-time wind direction and dust concentration need to be compared in order to trigger meaningful alerts to an operator. Another very active example now in Lebanon is the effect of waste incineration on air quality.
Based on concrete environmental data and information, the platform allows for effective management of current issues while predicting future trends, scenarios and challenges. Structuring, sharing, processing and integrating environmental data comprise the main mission of O-LiFE.
Our work is applied on real datasets in the framework of the O-LiFE observatory. In this article, we thus introduce two databases that are exploited to show the results of our method: (i) the snow data database collected from three permanent stations located on the heights of Mount Lebanon and the (ii) wells’ data collecting information on groundwater wells in the Bekaa region in Lebanon.
1.4. Contributions of the Work
As presented above, the challenge is to prepare the data so as to make it possible for the user to retrieve correlations between the data even when the possible links are non-explicit because the data have been collected with different points of view.
In this context, many works have been done, especially on data integration, in the domain of data warehouses for data mediation and reconciliation [1,2] in the very generic process of ETL (Extract-Transform-Load) in data warehouses [3,4]. The objective of these architectures is to compute the key performance indicators from several data sources. Mediated schemes can be extracted, with a local or global view [5]. Data are aggregated and mapped by advanced methods able to cope with syntactic and semantic heterogeneity to build decision support systems [6]. In such a context, the data to be crossed are determined a priori, which is no longer the case with the current augmentation of data available and some new paradigms, such as data lakes [7], which complement data warehouses.
Thus, in this article, we rather focus on easing data crossing even if it was not suggested by data producers or consumers. This work extends [8] by providing a full process integrating a catalog and some navigation tools so as to help the end-users to visualize the data using several points of view. We also present results from real data crossing.
Given that the main contribution of our approach is the use of several points of view of the data, we propose a methodology consisting of five steps: reconciling data schemes with standards; exploding and duplicating points of view over the data; cataloging the points of view; enabling/disabling navigation through the points of view; crossing data that are detailed below.
In this article, we focus on the first four steps that are described in the next sections, as they are focused on data preparation to be used in order to exploit the databases by crossing data.
This work has been implemented in the context of the information system of the O-LiFE environmental observatory. As we work on environmental data, we rely on standard models that are presented in this article before introducing our contributions.
The article is organized as follows. We first present the methodology we propose and the data we have used, before reporting the results.
2. Methodology
Our methodology consists of the following components:
- reconciling data schemes with standards;
- exploding and duplicating points of view over the data;
- cataloging the points of view;
- enabling/disabling navigation through the points of view;
- crossing data.
This article focuses on the first four steps for preparing the data to be crossed. In this respect, our work does not focus on data volumes that should be managed by such architectures, but rather on data preparation, which only requires local computations for data transformation. This work prepares the next step (machine learning, data mining) for data crossing, which requires distributed databases and high performance computing.
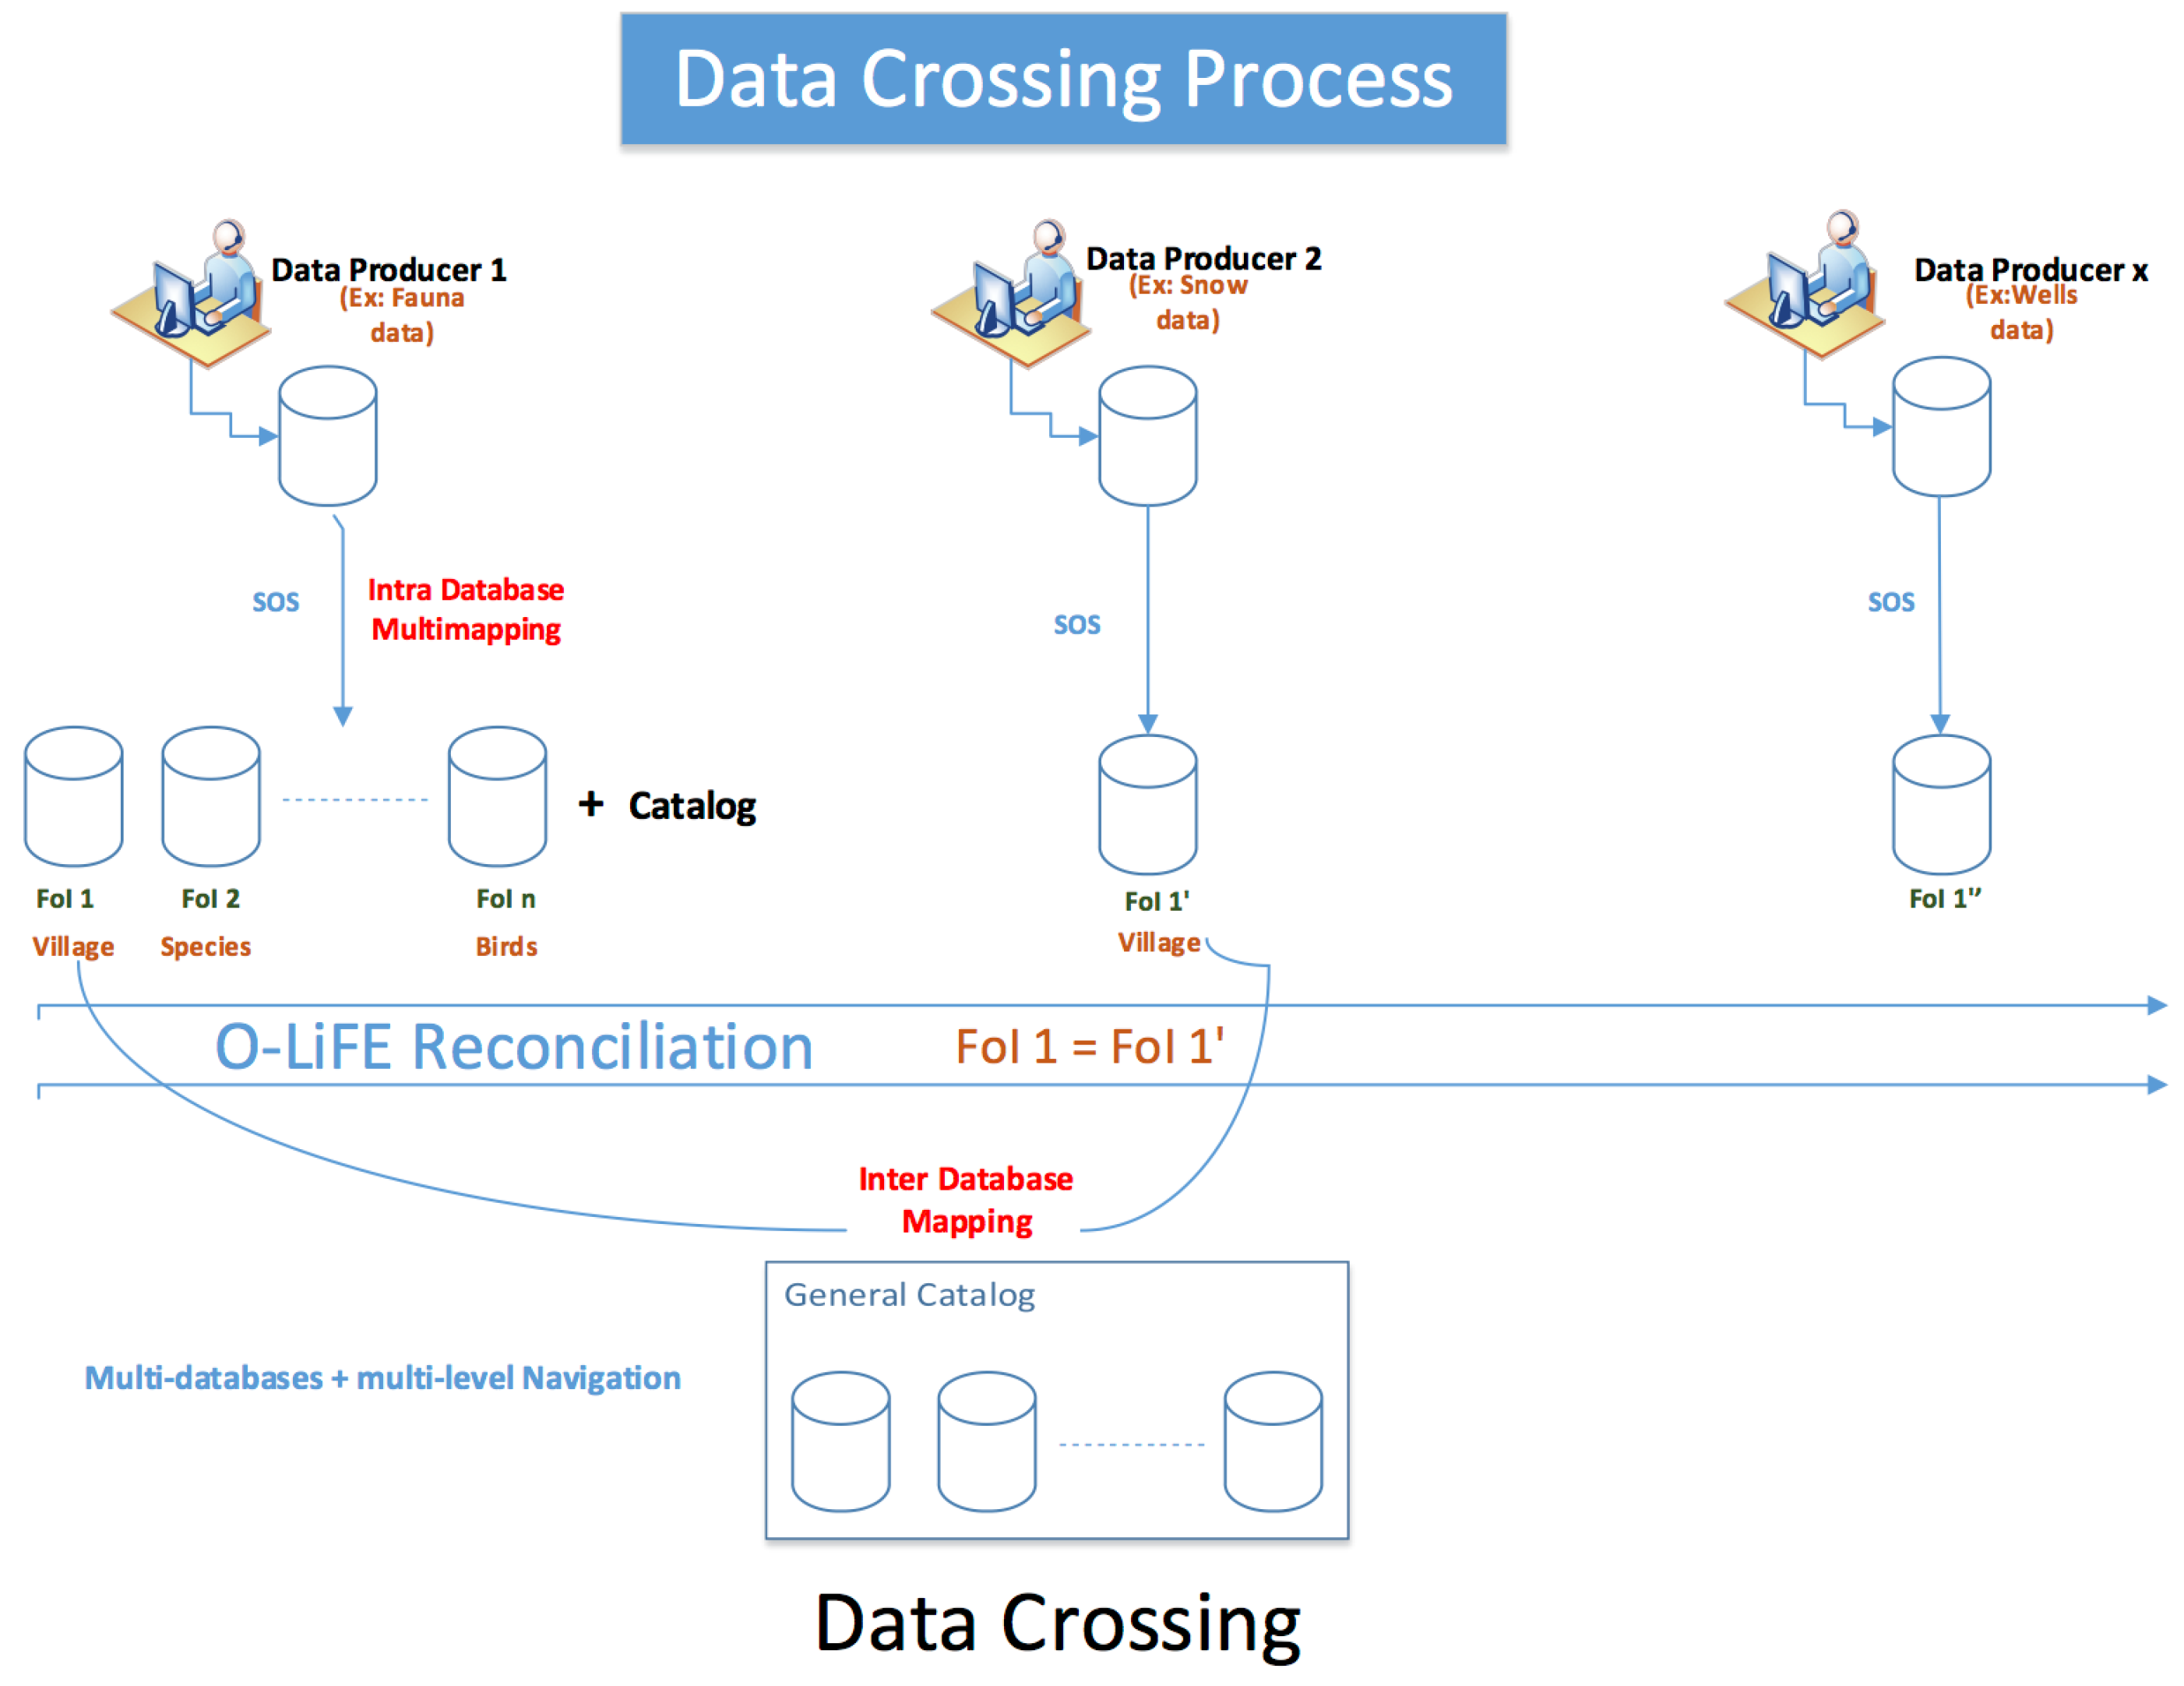
The whole process is described by Figure 2.
2.1. Reconciling Data Schemes with Standards
In our model, we consider a repository of environmental data collected from a set of n data sources. This set is denoted by , with , and every is a specific data source.
For instance, we consider the three data sources “Bird”, “Snow” and “Wells”.
These databases must be represented using standards. The transformation first requires that the data can be understood by non-producers, and thus “translated”, which refers to the semantic field, or in each case, surrounded by a shared ontology and thus co-constructed between producers and data users.
The success of data usually lies in their ability to be exploited in support of well-identified scientific questions, or on the contrary, in their versatility, which can be used for unexpected questions. It is therefore realized that what matters is the ability to relate data from a specific question or point of view, including especially if the data were not initially generated with the point of view used to evaluate. Behind this notion of “point of view” lies our ability to create the necessary links between data to stick to this angle of observation. Let us take the concrete example of monitoring a bird population at a specific site, the aim being to characterize its dynamics, increasing or decreasing, to study the effect of a protection policy. The point of view is therefore the variation of the population over time, in one place, with a simple link between the variables: number of individuals ↔ observation date. This same question and this same point of view can be duplicated on other observation sites. However, the same data can be linked in the following way: number of individuals ↔ place ↔ observation date. In this case, it may be possible to characterize the migration of individuals or the population from site to site, for example under the effect of global warming. What has changed, of course, is the point of view, which has led to the creation of new links with the same data. This change of view could be induced by a new scientific question “Is there a climatic migration of species” or simply by linking data with new links “to see”.
Data mapping is used to translate environmental data into alternative representations without compromising the mission of primary data. Thus, in our example, each point of view generates all the links and therefore the database adapted to its study, provided that the mapping of the data can be done correctly. This mapping is therefore a key to the process.
The data must be transformed into the O&M model of SOS to insert the data into the SOS web service, or in other words make the “mapping”, which is a procedure consisting of identifying these elements in the source database and matching with the O&M model of SOS.
Moreover, the environmental observatories’ IT infrastructure has been studied for many years. It comes from previous work allowing, on the one hand, one to manage the spatio-temporal data (GIS), the sensors data arriving in flow and the heterogeneity. The work in [9] defines observatories as answering a scientific question from which follows an observation model corresponding to data to be collected and followed by relying on a technical, scientific and institutional device and a set of actors. It can be added that, observatories being intended to value the data essentially beyond its producer, they must also be the place of definition of points of view and therefore the place of realization of links between distributed data.
In environmental observatories, spatial data are managed in the so-called Spatial Data Infrastructures (SDI) that provide the basic physical and organizational structures required to facilitate and coordinate the efficient and effective discovery and use of spatial data.The main implementations of SDI rely on the OGC, which provides consensus standards with the help of various contributors (companies, government agencies and universities). OGC standards are used in most environmental observatories, thus enabling the exchanges and uses of data from such observatories.
The OGC Sensor Web Enablement (SWE) framework consists of a set of standards defining data formats for sensor data and its metadata, as well as service interfaces to access sensor data, task sensors or send and receive alerts based on sensor measurements [10]. These standards, for example, SensorMLand O&M, provide syntactic interoperability that enables the integration of sensors and sensor data into Spatial Data Infrastructures (SDI) and thus makes it possible to use the data measured by sensors in a broad range of applications.
The Sensor Observation Service (SOS) is one of the OGC-SWE standards that defines a web service interface for providing access to observations from sensors and sensor systems in a standard way that is consistent for all sensor systems including remote, in situ, fixed and mobile sensors. It defines a conceptual schema and an XML encoding of the observations and elements involved in the measurement of these observations [11]. This model allows the representation and the exchange of the results of the observations. The term observation is the action that results in estimating the value of a property of a point of interest, at a certain point in time, using a procedure, whereas a measurement is the numerical value of the observed property [12].
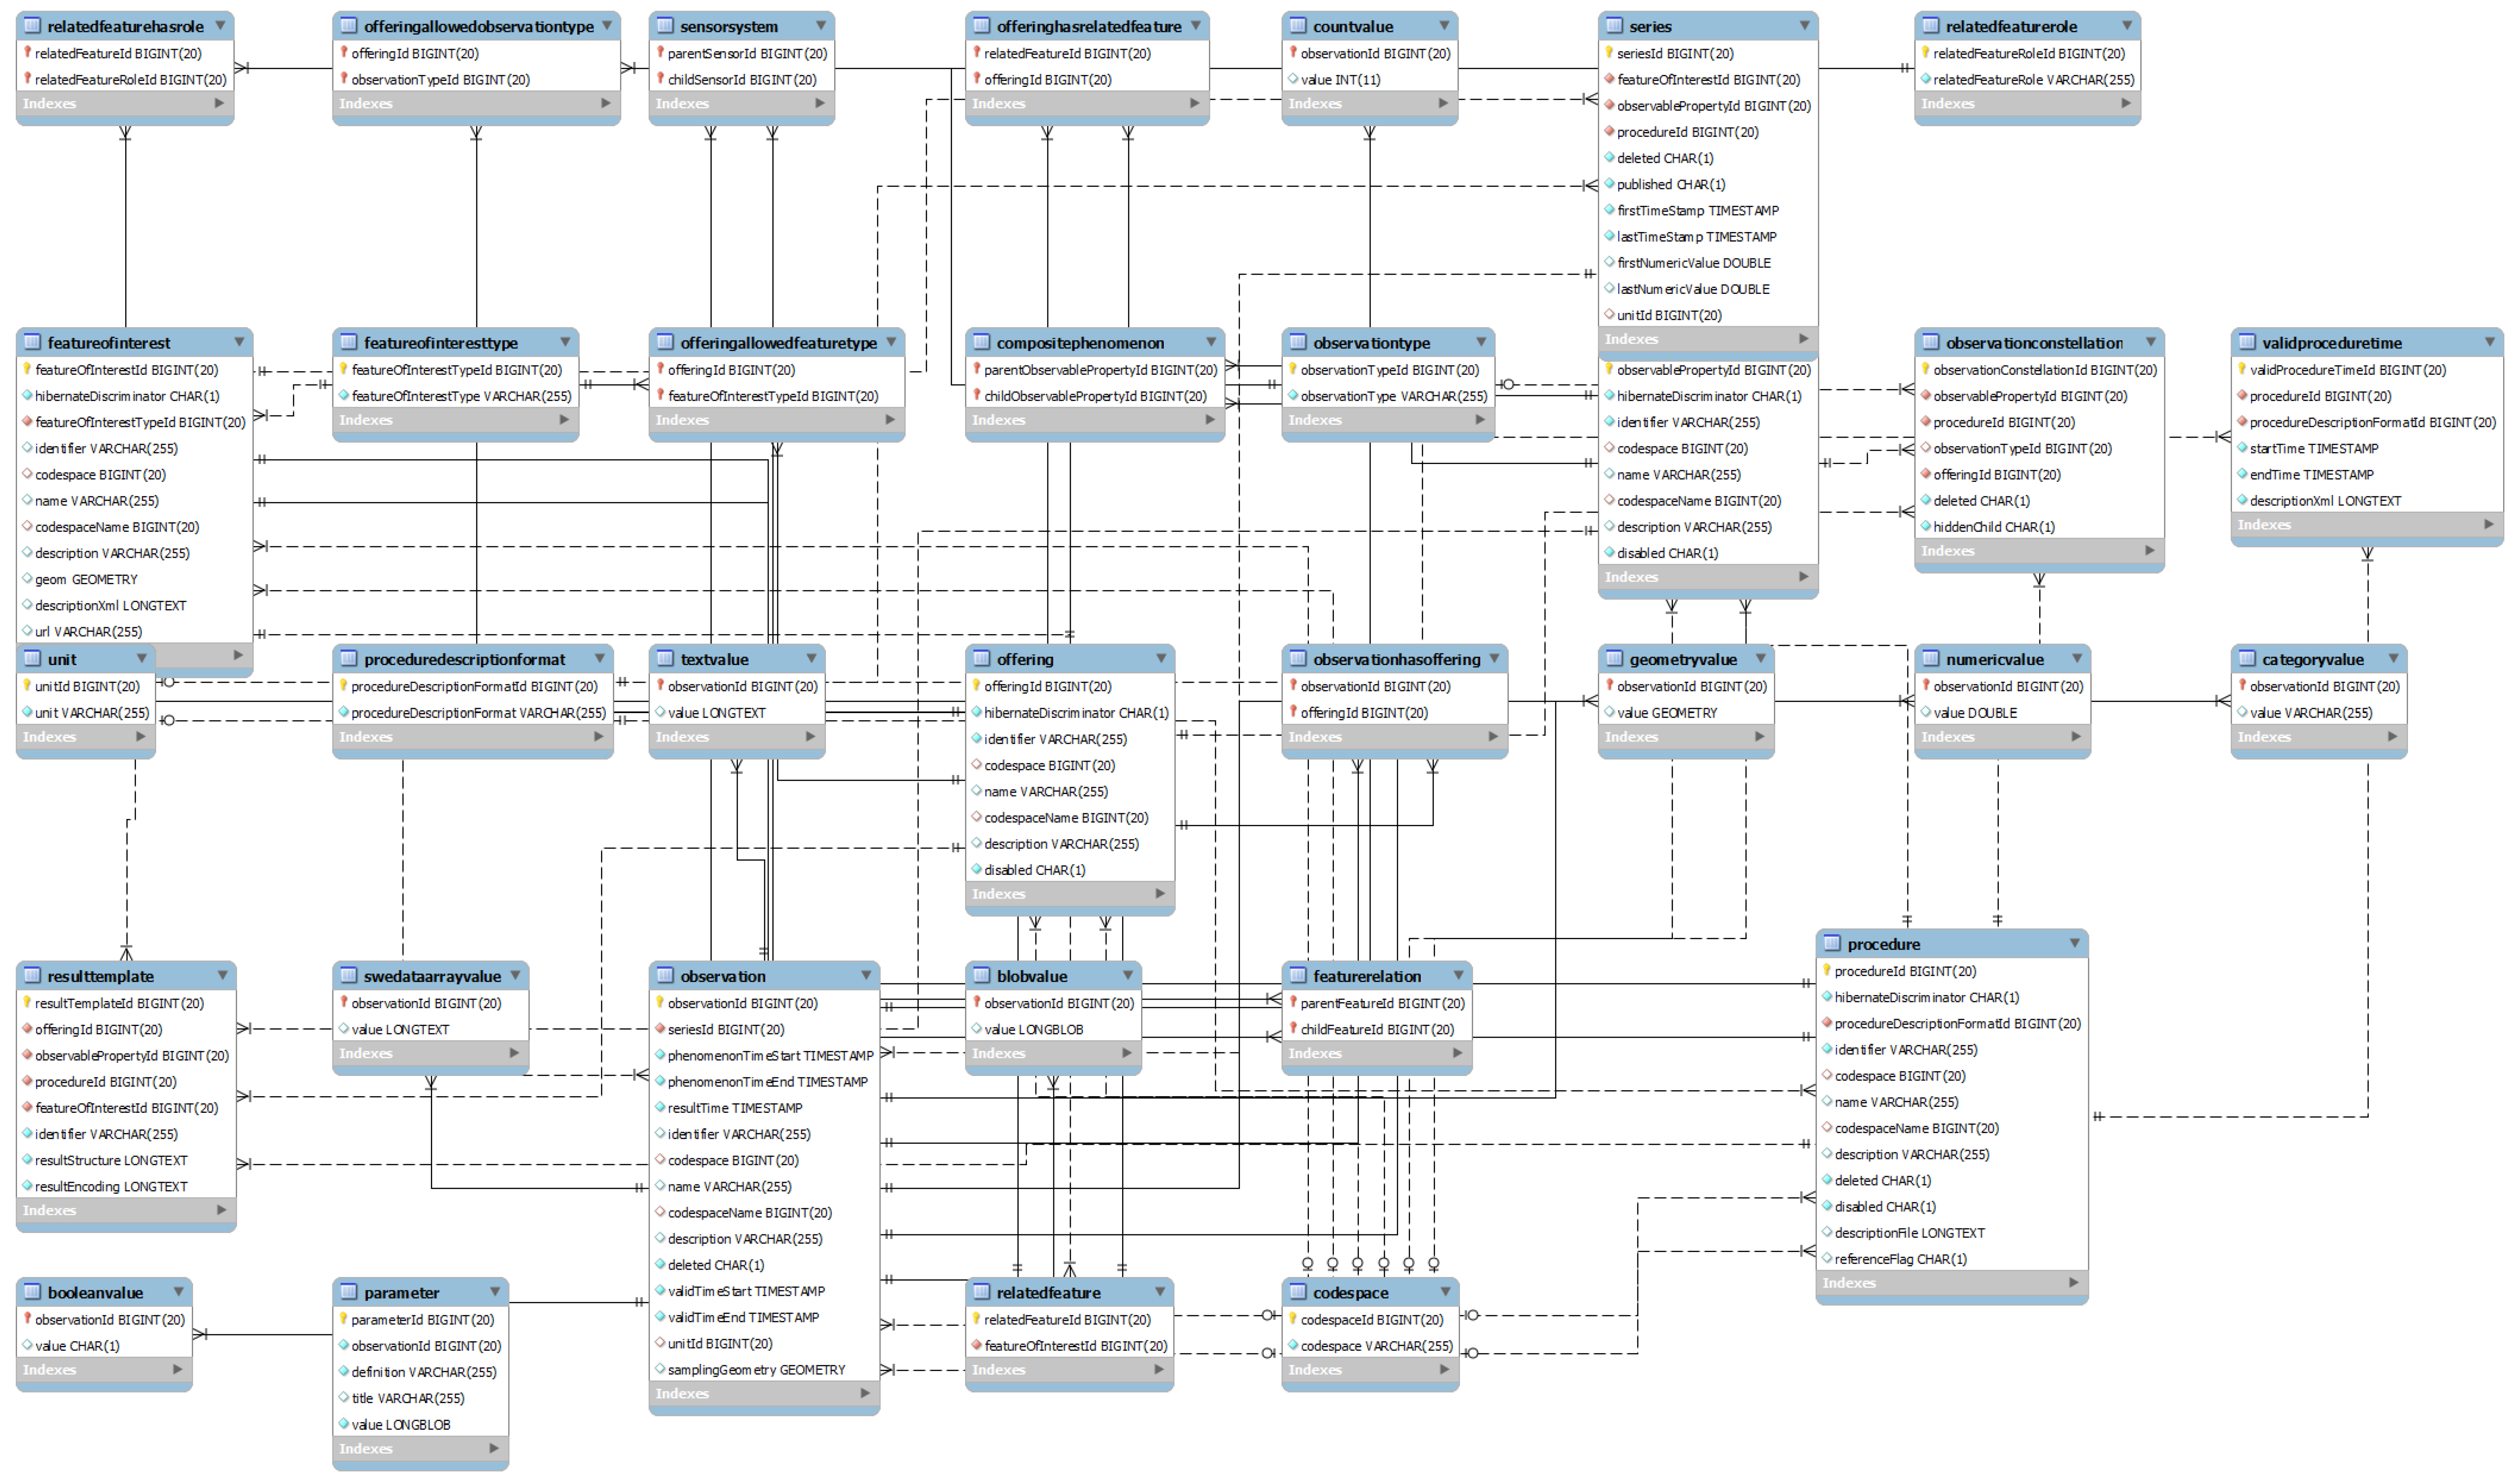
At O-LiFE, we choose to use the “Sensor Observation Service” (SOS) and “Observations and Measurements” (O&M) provided by the 52 North German initiative for Geospatial Open Source software. The 52 North framework is a widely-used open source Java-based pluggable framework that enables the deployment of spatial processes on the web in a standardized way.
For the observation in the 52 North database model shown in Figure 3, every piece of data is described using the same features, some of them being mandatory. For instance, spatial information, feature of interest (e.g., weather, birds’ diet), procedure (sensors being used) and phenomena (e.g., air temperature) are some of the requested information.
Figure 1 presents a simple view of SOS data modeling, taken from Figure 3. Roughly speaking, in SOS, objects named features of interest, the location of which is known (should it be stationary like a building or mobile like a car or an animal), are studied over time by means of some phenomena (also known as observed properties) expressed by values given with particular units of measurement.
2.2. Exploding and Duplicating Points of View with Multi-Mapping
2.2.1. Multiple Mappings
As described above, environmental data have been intensively worked on for the standardization of the vocabularies so as to better exchange and analyze data. Many ontologies and taxonomies have been proposed to harmonize terms in controlled vocabularies that may be open and shared in the so-called linked open vocabularies.
The Ecological Metadata Language (EML) [13] Semantic Web for Earth and Environmental Terminology (SWEET) and NASA Global Change Master Directory (GCMD) are well-known standardized terminologies in the context of environmental data.
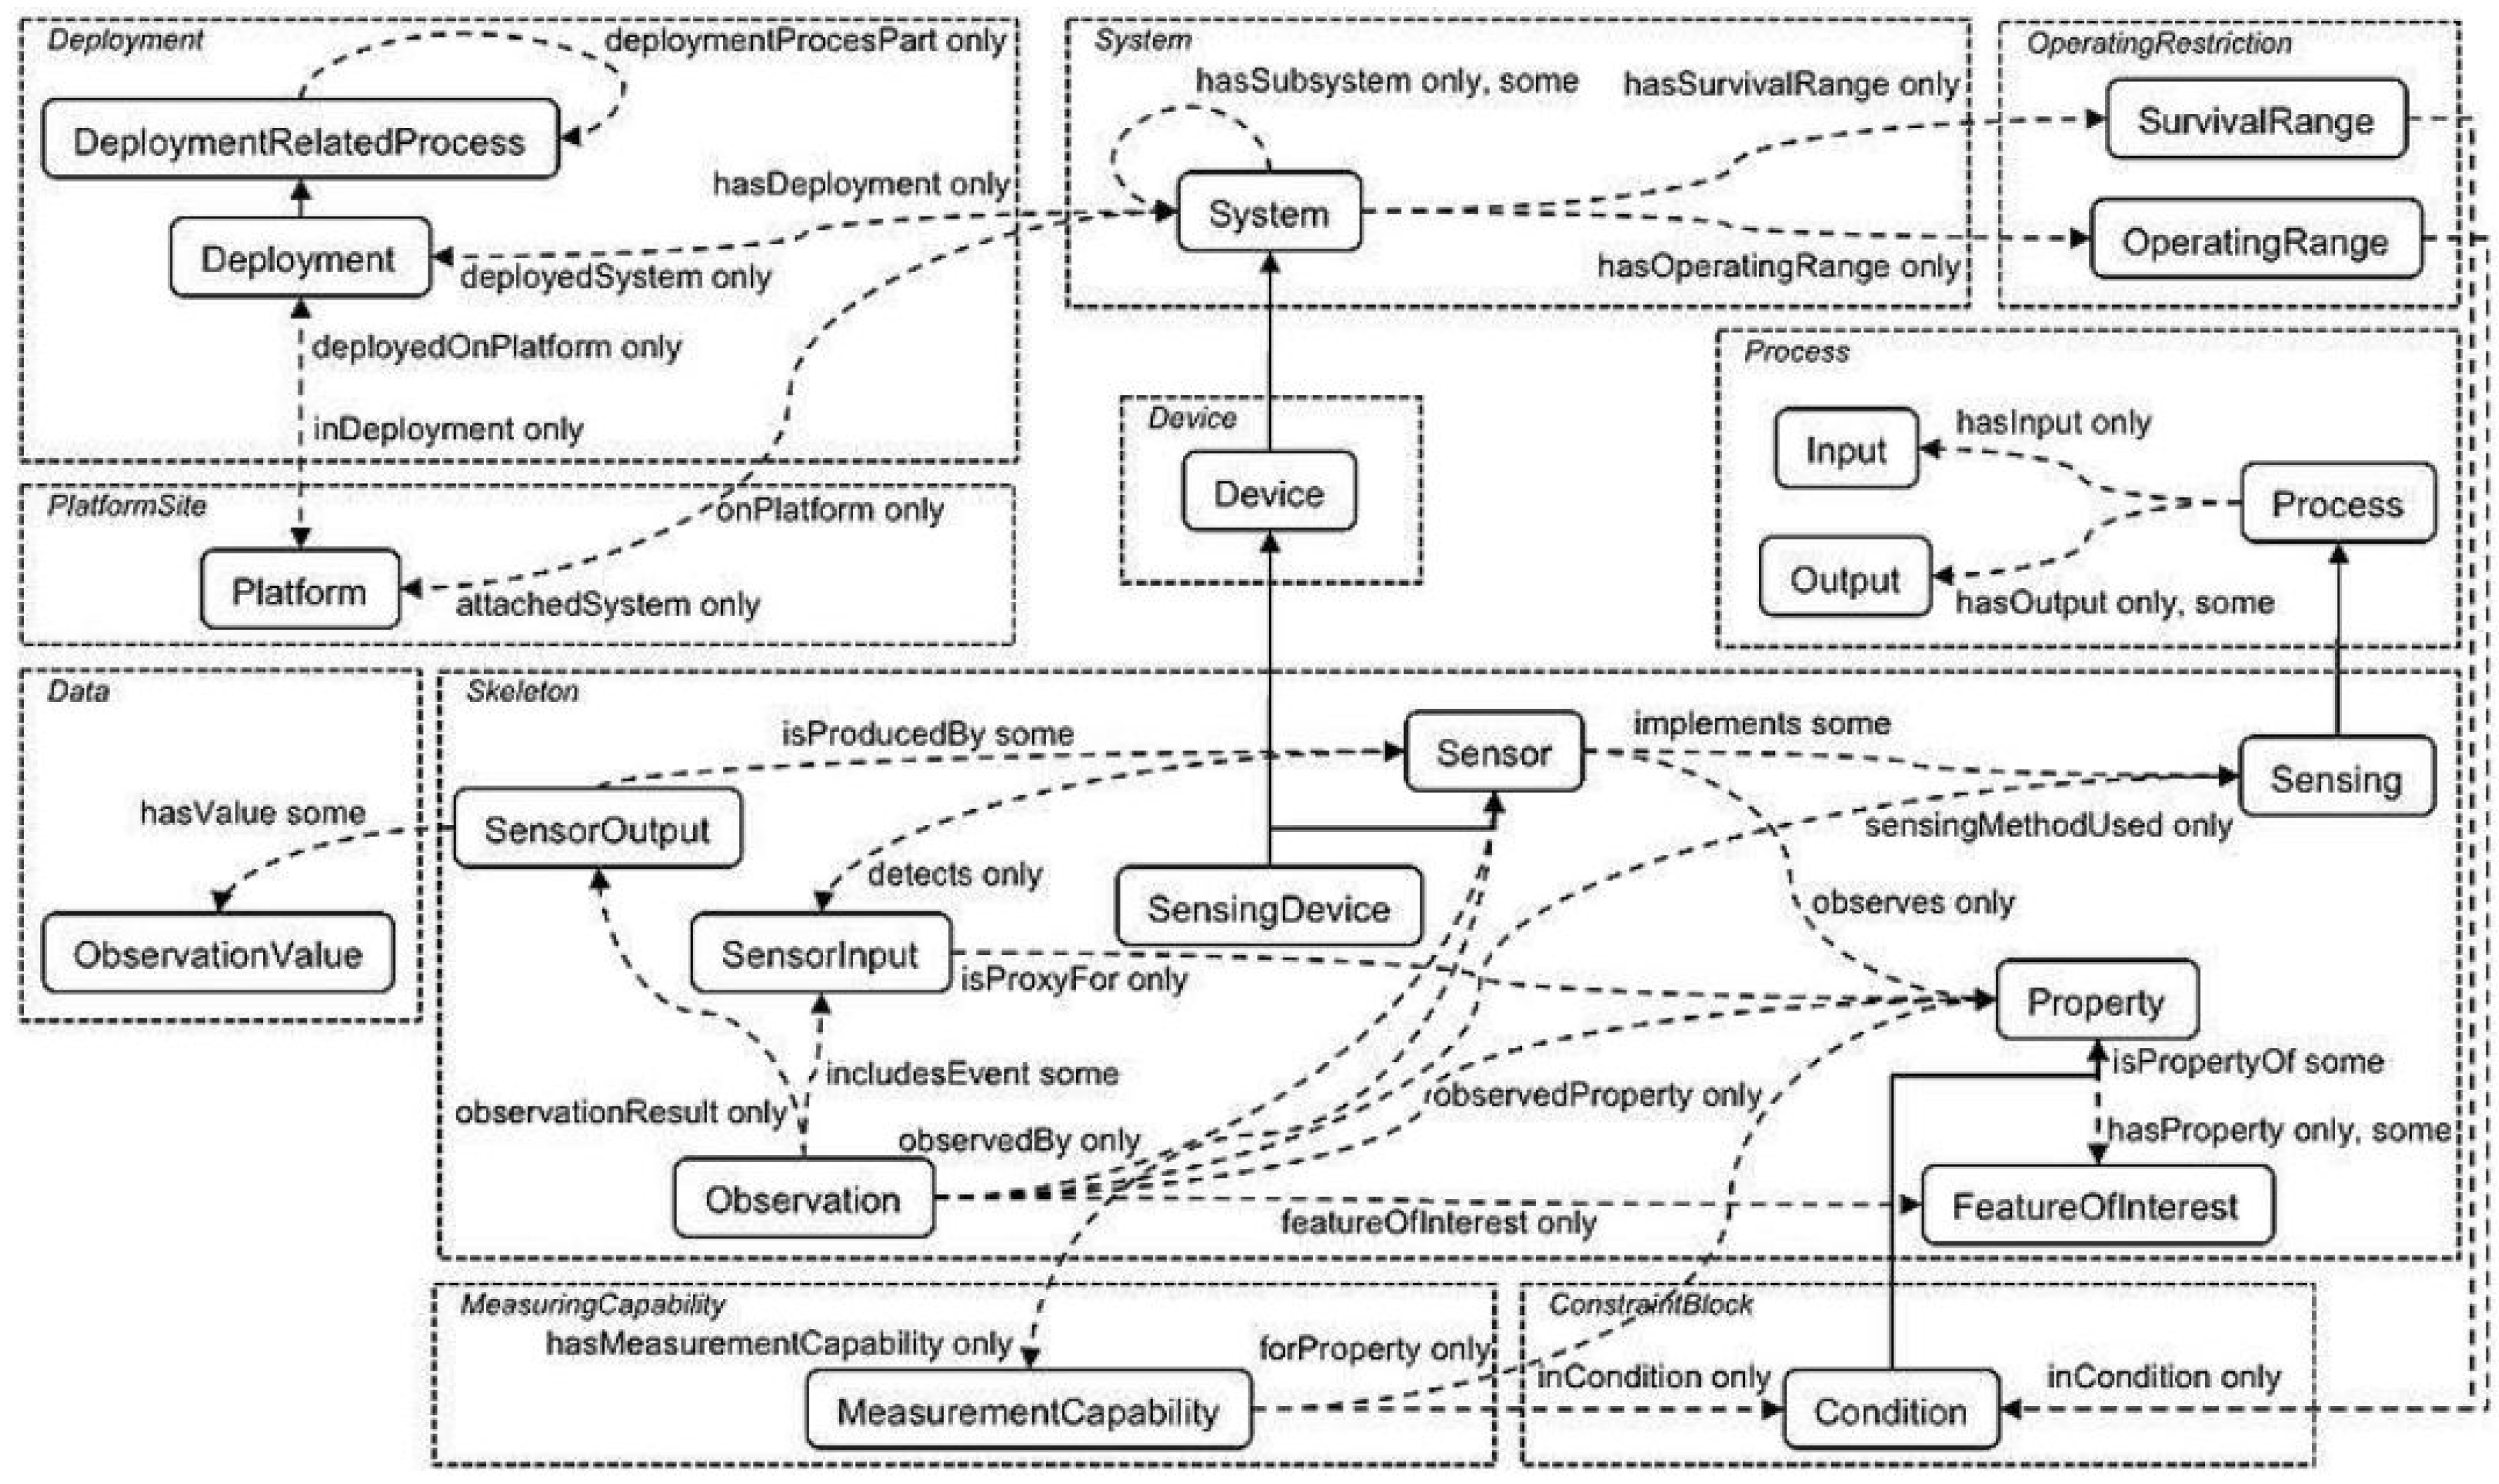
Regarding sensors, the Semantic Sensor Network (SSN) Ontology has been developed by the W3C Semantic Sensor Networks Incubator Group (SSN-XG) and is presented in [14]. Figure 4 shows the main concepts from this ontology. It can be noted that no thematic (for instance, on environmental data) concept is included.
In the European Union, the development and application of INSPIRE for geographical data has led to more compatible and usable infrastructures. SOS implements the INSPIRE Directive with the D2.9 Guidelines for the use of Observations & Measurements and Sensor Web Enablement-related standards.
Works have been proposed to define sensor network ontologies by listing instruments and their characteristics. The work in [15] reviewed the main contributions on this topic. Some other works have addressed the question of reusing ontologies and vocabularies for sensor data modeling and opening [16,17,18,19,20,21] and even linking [22,23,24].
Sensor data can be described by means of RDF schema for transforming sensor data into the RDF conforming to SSN ontology with an XML-based mapping language used to annotate sensors and sources to create a mapping file. However, no detail on the matter will be provided in this article.
Regarding the representation of alternative information, many works have addressed the topic, and some propositions are even effective. For instance, the SKOSmodel allows one to have a preferred label (skos:prefLabel), alternative label (skos:altLabel) and hidden label.
As can be seen from this literature review, many works have addressed the question of mixing Semantic Web and SOS-based observatories. However, these works are limited to SOS-compliant data and do not help to model data from our running example that may be considered as not easily SOS-mappable.
For this reason, we have introduced a new method in previous works [8] helping SOS users to model the different mappings of their data to SOS models by extending existing properties.
As presented above, sensors data are represented in an SOS database with the following entities: FoI, date, location, phenomena (or observed properties), sensors, measured values and units of measurements. Whenever data are received in centralized databases, the data must be transformed into this model. These data are however raw data, often stored within Excel sheets or text files, which may combine several observations and information of a different nature at different levels of granularity, etc.
It is then often possible to define several points of view, and thus several sets of possible links, in particular to specify which objects of the data source can be defined as features of interest. The co-existence of these points of view is linked to the co-existence of several objectives (scientific or operational) possible for the collection and for the analysis of the data, at more or less fine spatial and temporal scales. Moreover, the scientific topic considered at the time of observation of the data (for instance the study of the diet of some specific birds) may change when the data are crossed with other ones to address another scientific issue (for instance the evolution of pollution in some geographic areas and its impact on the fauna). In the first case, the birds are followed up over time. In the second case, some geographic areas are followed up and studied over time.
This can be seen as a multidimensional nature of the data that contain some measures analyzed with respect to several dimensions potentially described at several levels of granularity. Transforming such data into the SOS model is thus often tedious and tricky as there is no unique manner in which to do so.
For instance, the attribute that will be mapped to the “feature of interest” may be difficult to choose as it depends on the scientific goal both at the time of the observation and at the time of consuming the data. Choosing one possibility is difficult and must be made carefully as it impacts the following analyses. It is therefore important for all the stakeholders, especially for the data producer and the person in charge of the mapping design, to be and stay aware of all the possibilities and all the links between the possibilities.
SOS data run with the 52 North framework are stored in a relational database provided with a predefined schema which is compliant with the O&M specifications. However, it does not allow the provision of alternative models. We therefore propose to extend the ontology in order to provide such features.
2.2.2. Running Example
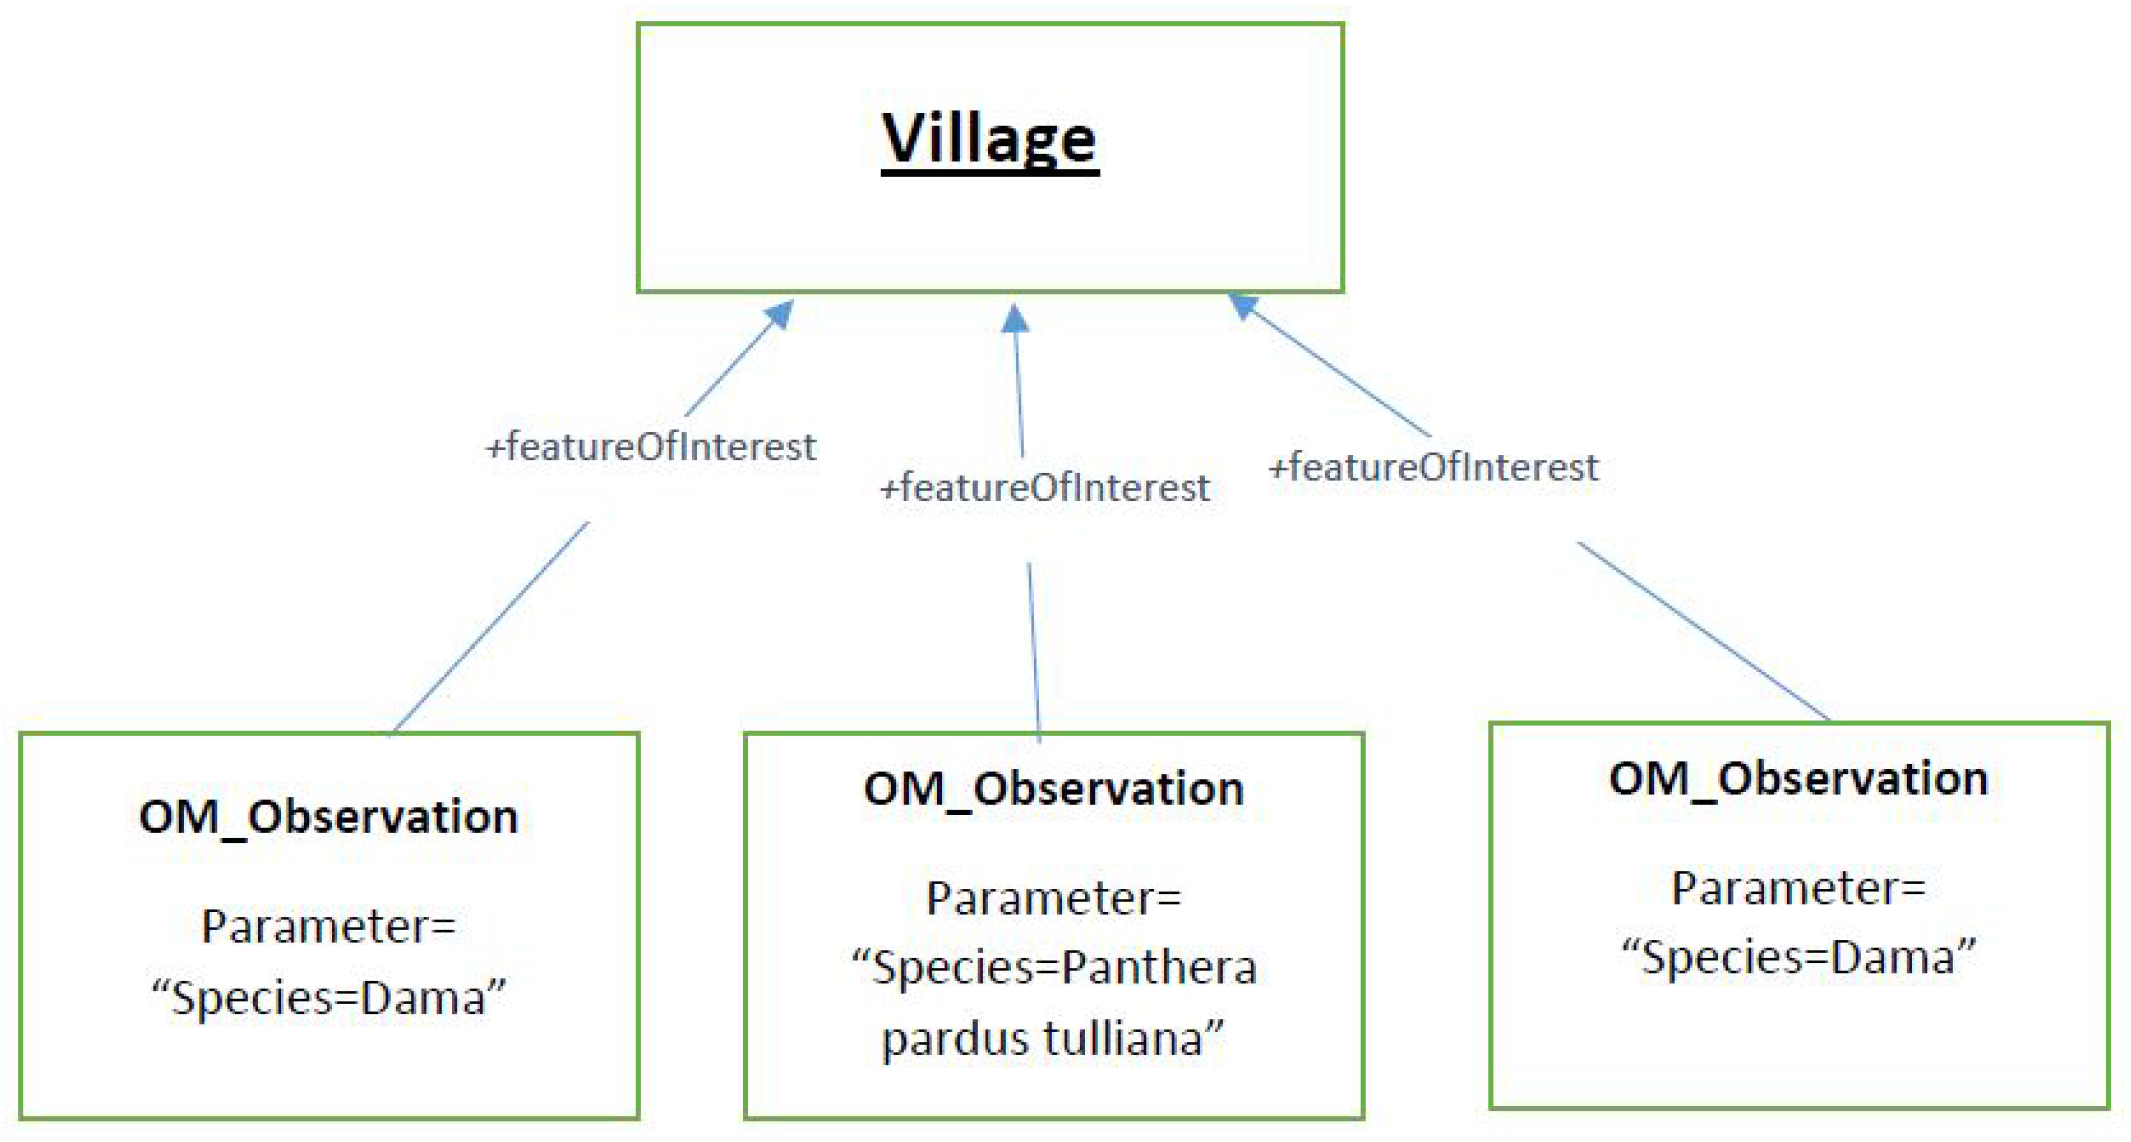
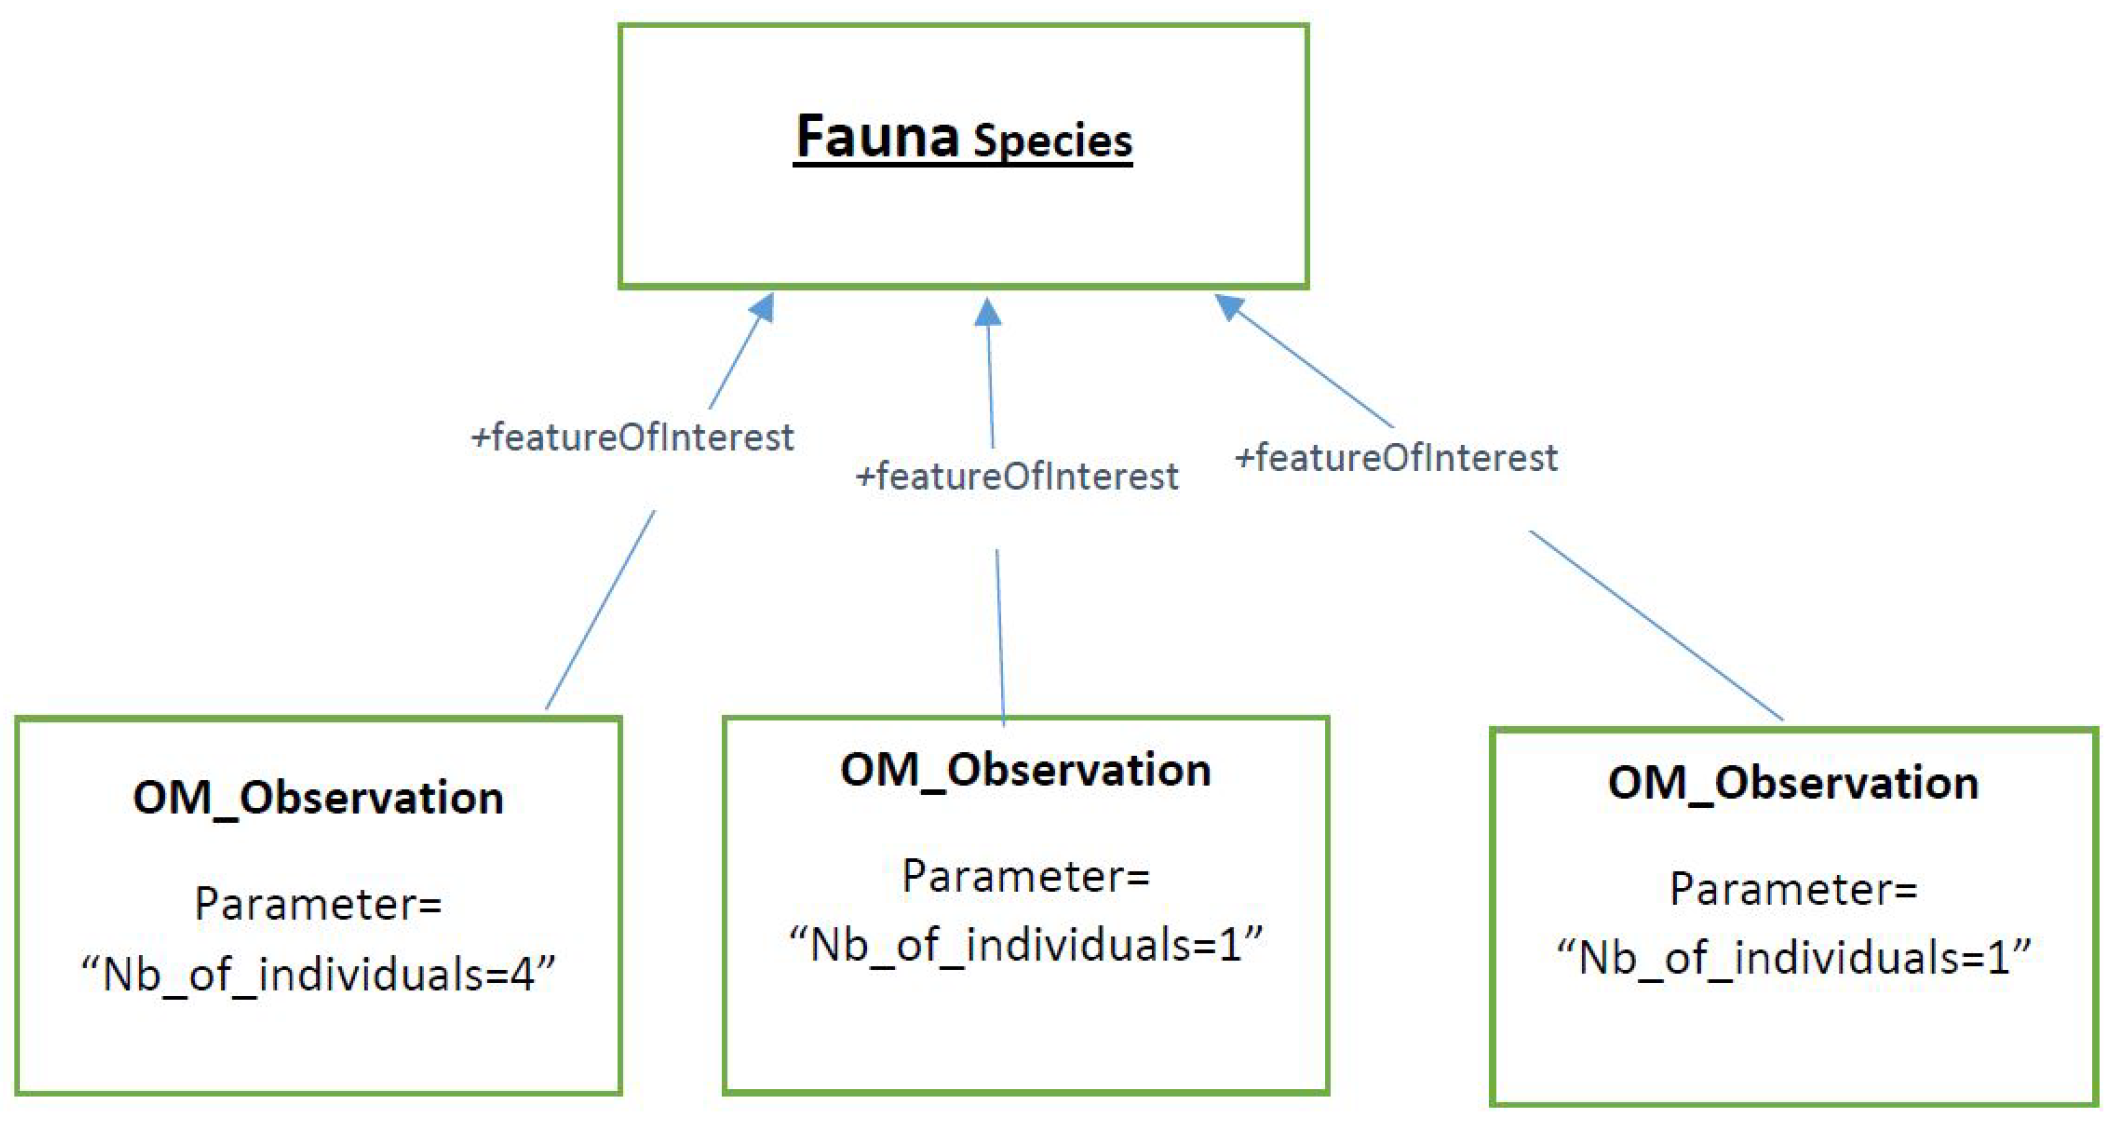
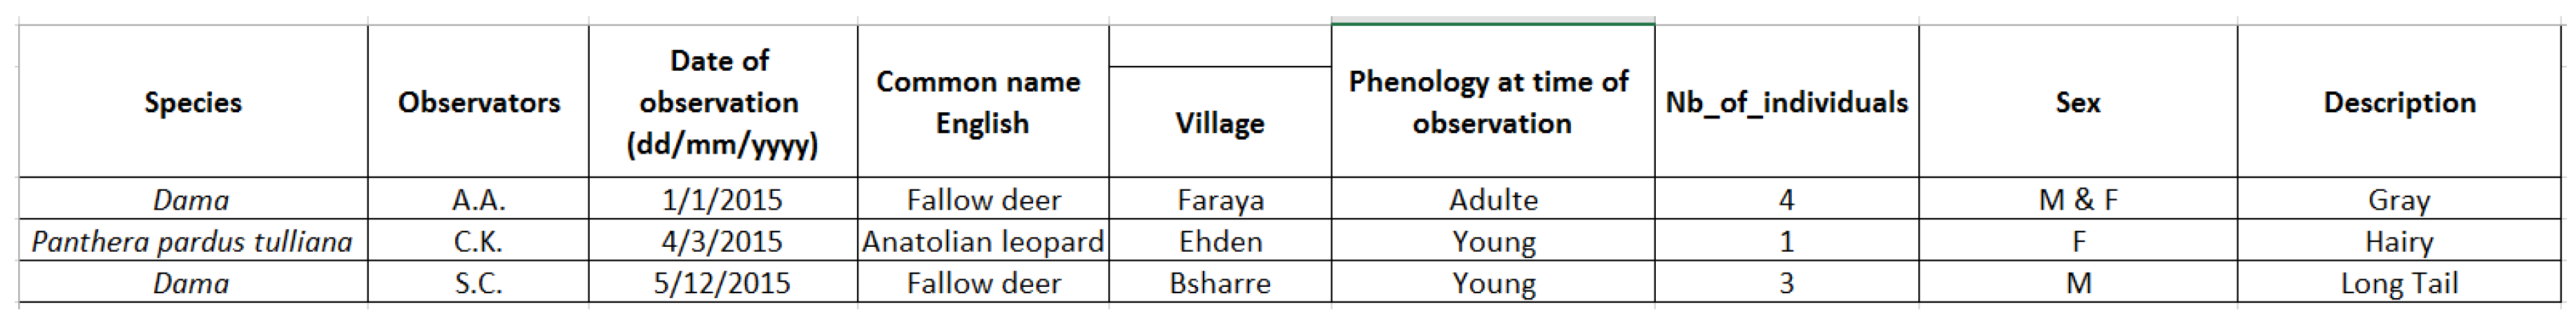
We consider an example of data produced by O-LiFE users collecting fauna data in the field. These data contain information on species observed by some researchers at some places over time.
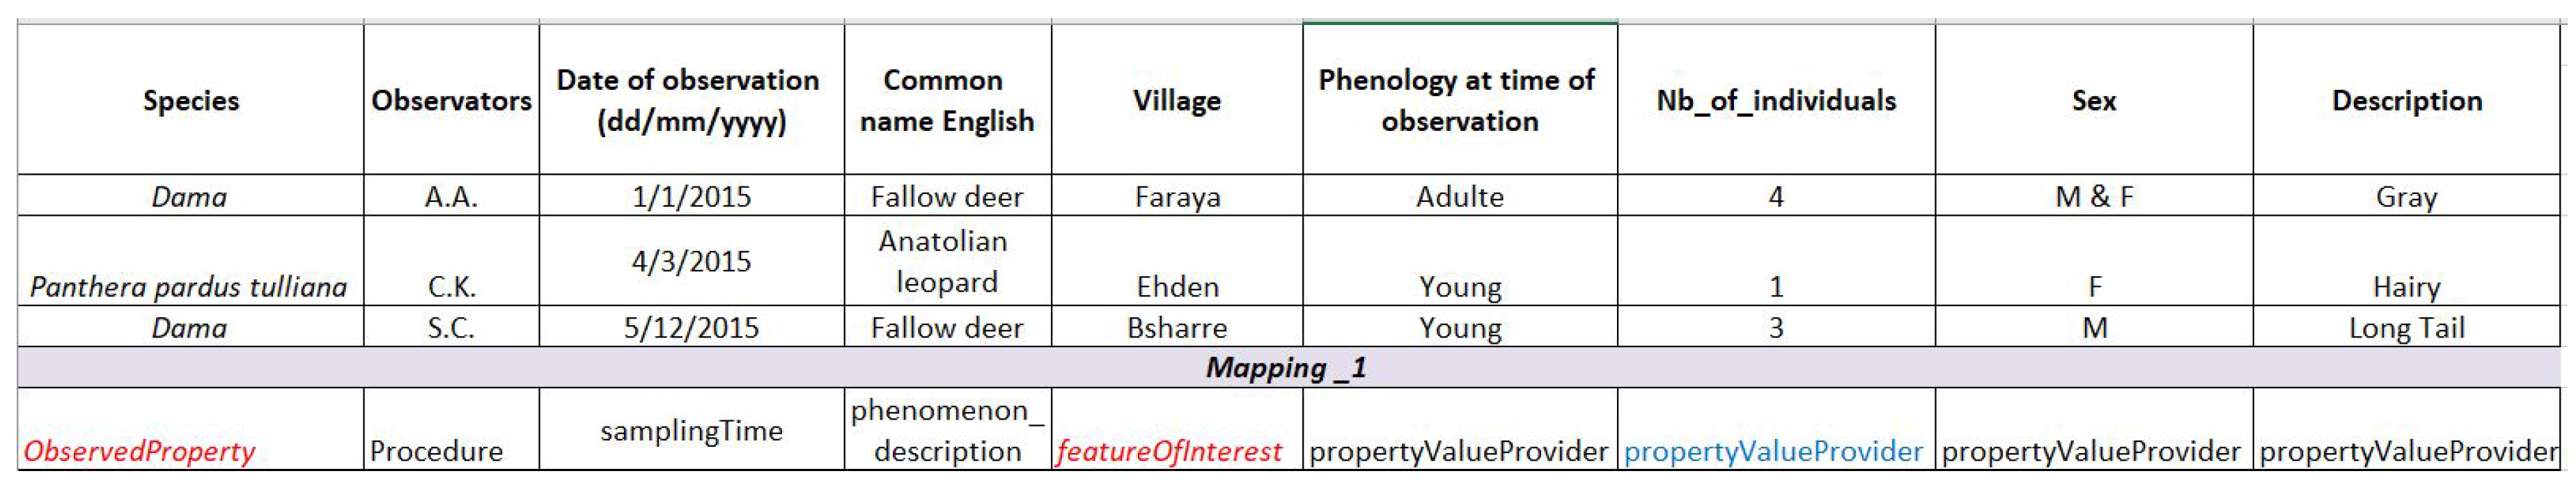
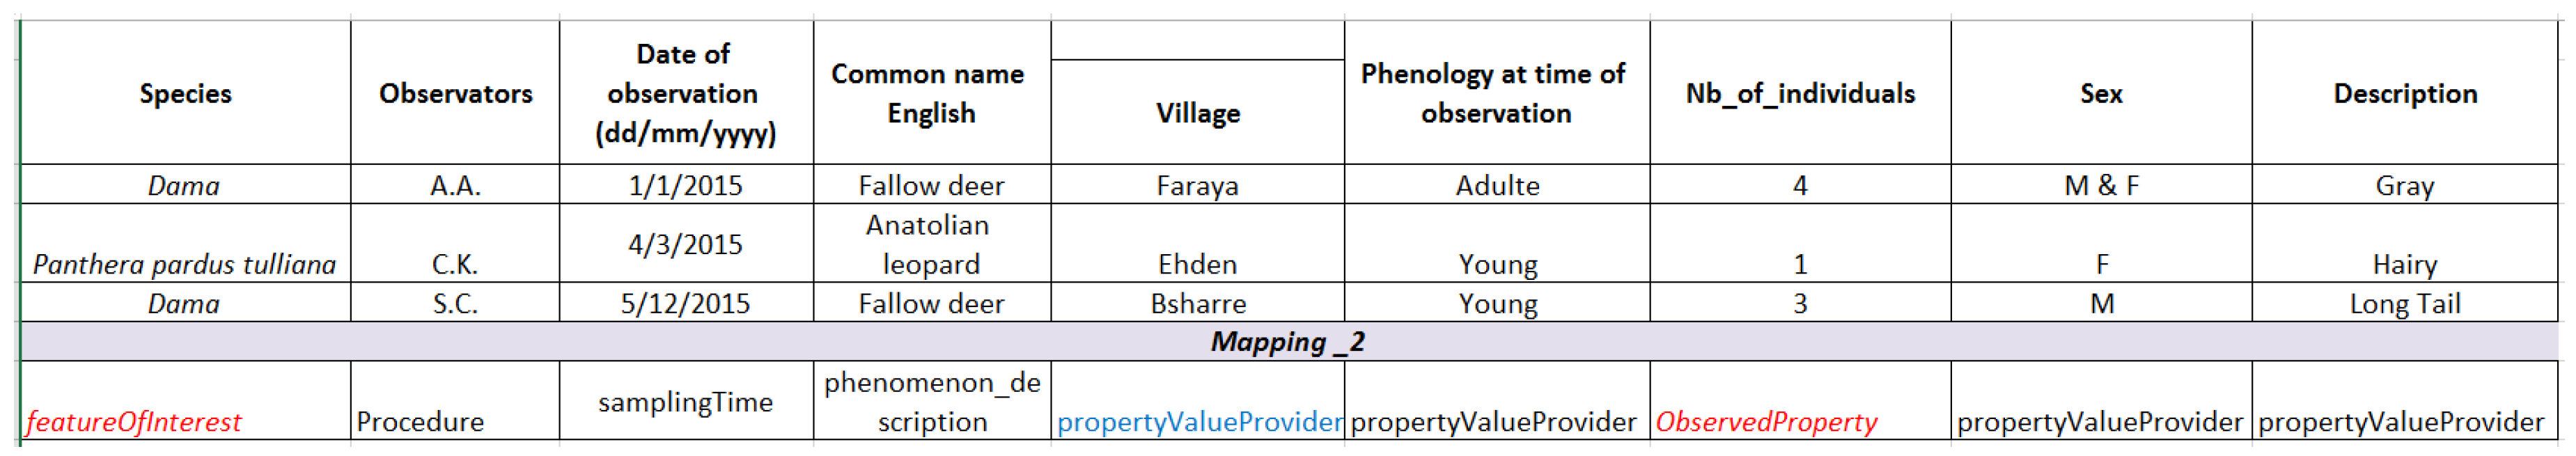
When considering the possible mapping from these data, it can be either argued that the species are followed up over time and space, meaning that the feature of interest is the species, or that the geographic area is followed up over time, meaning that the feature of interest is the village.
This choice is depicted by Figure 5 and Figure 6 for column mappings and Figure 7 and Figure 8 as the UML models.
Moreover, the sensor may be chosen as being either the generic ‘human as a sensor’ or the observer him/herself.
2.2.3. Extending and Refining the Ontology
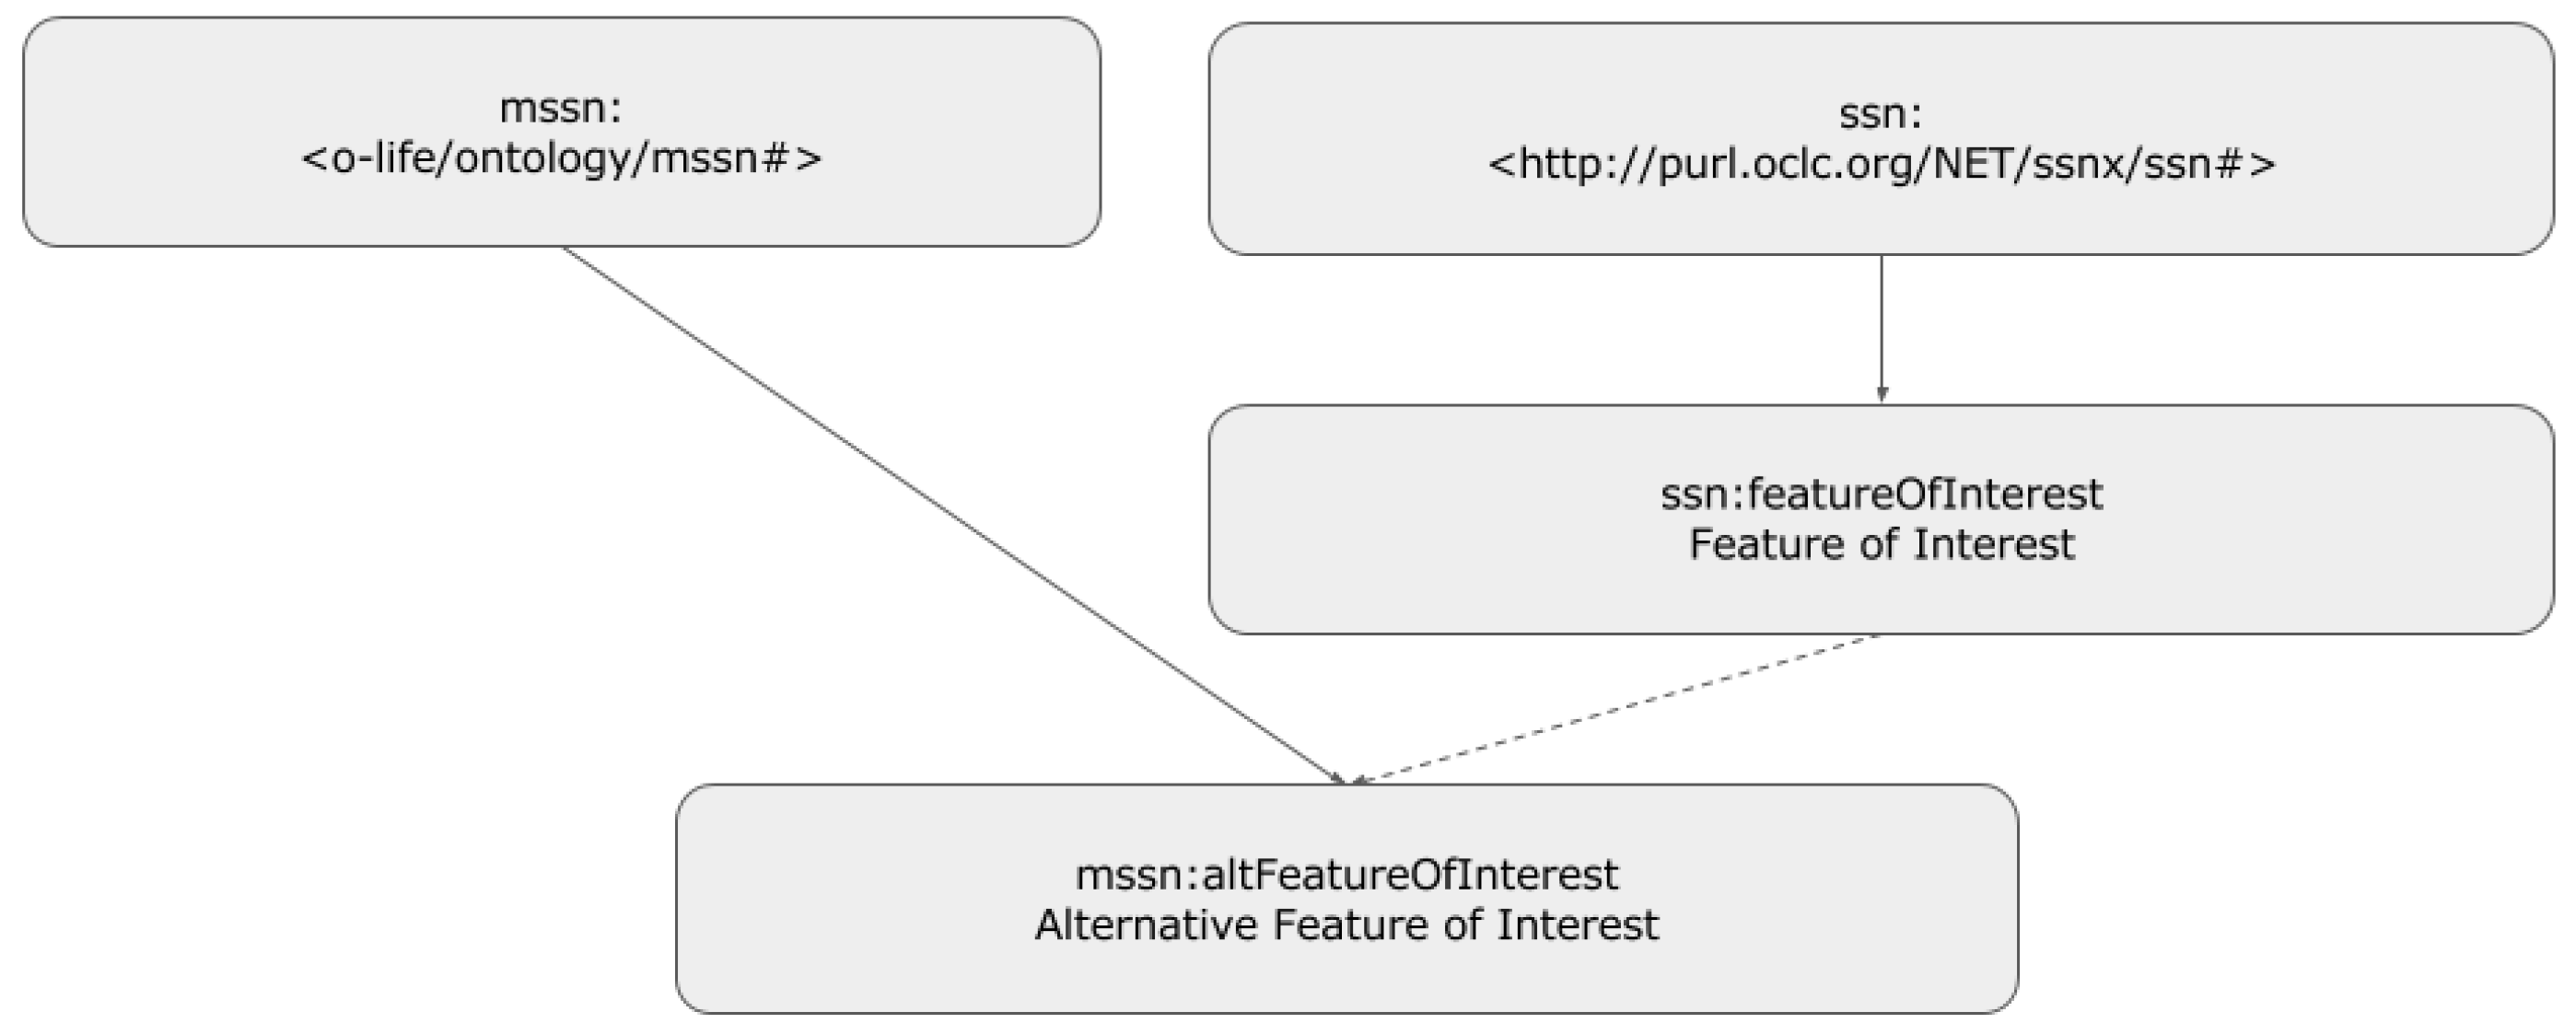
We propose to refine some parts of the SSN ontology in order to be able to represent multiple mappings and to point out the existence of multi-mapping to the users.
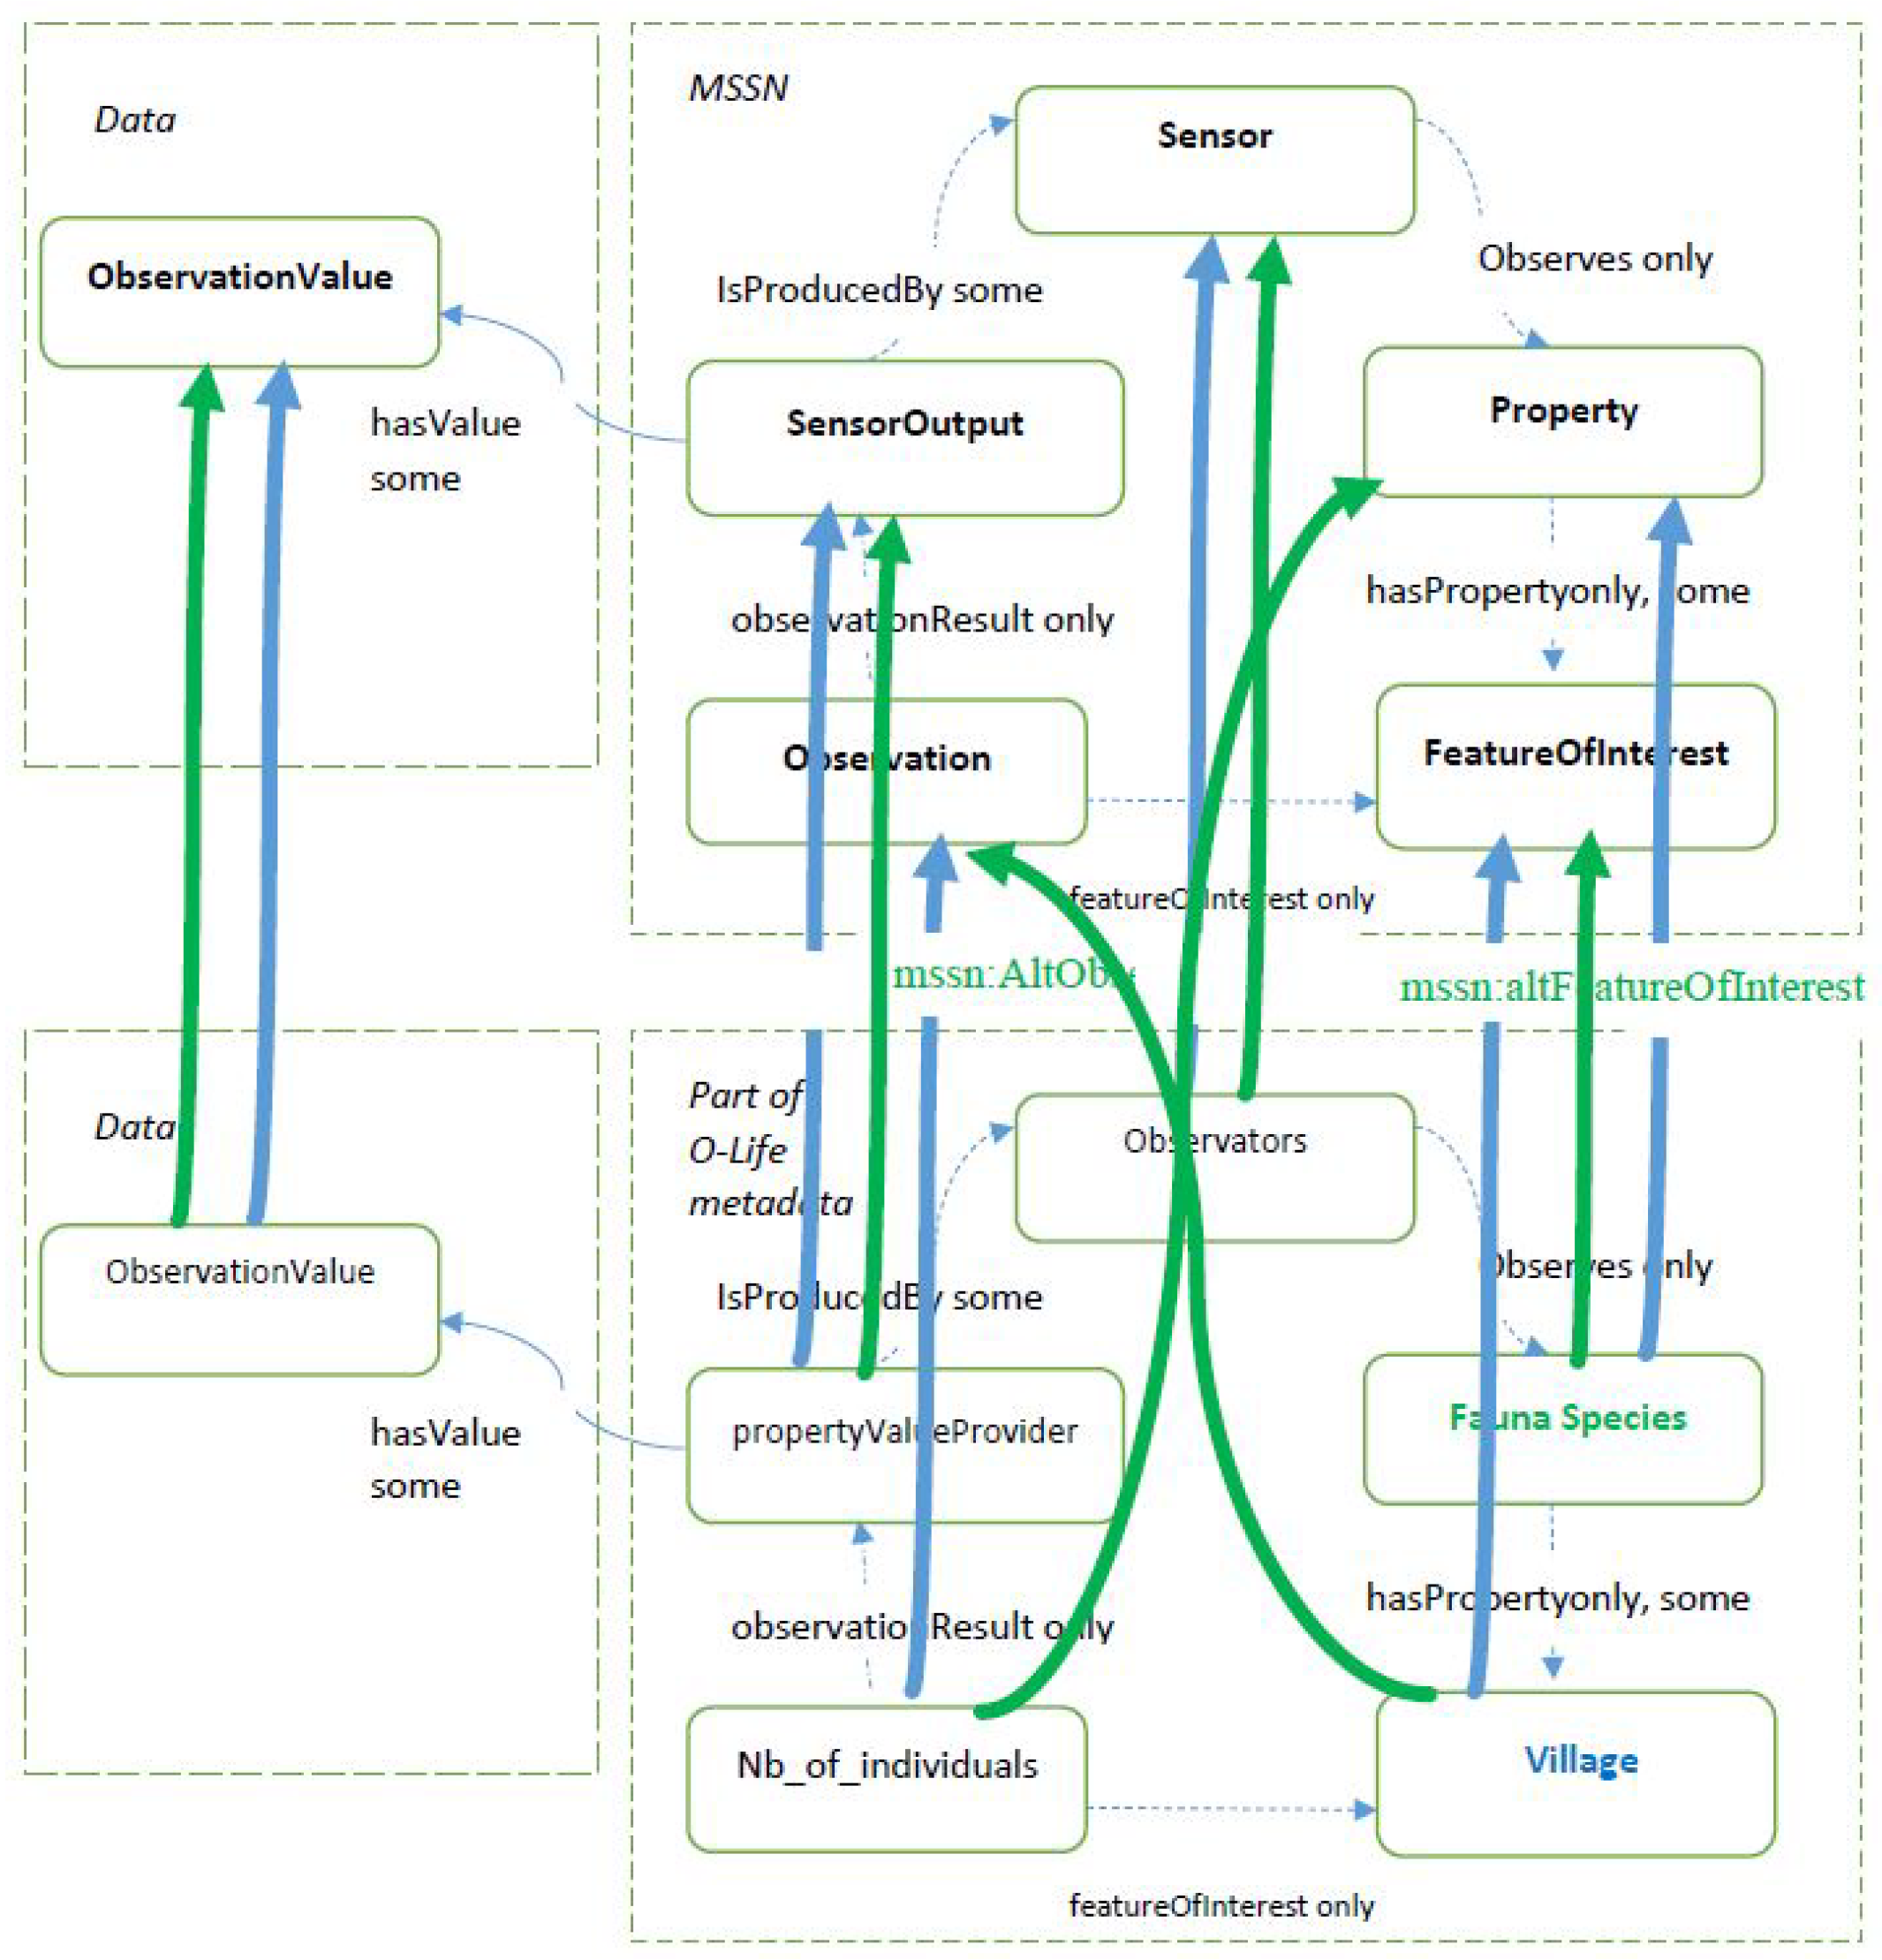
We regroup our proposals under a new vocabulary and propose to use the prefix, standing for multi-mapping SSN. In particular, we propose the addition of a new class representing alternative observation design, with the label , as a subclass of .
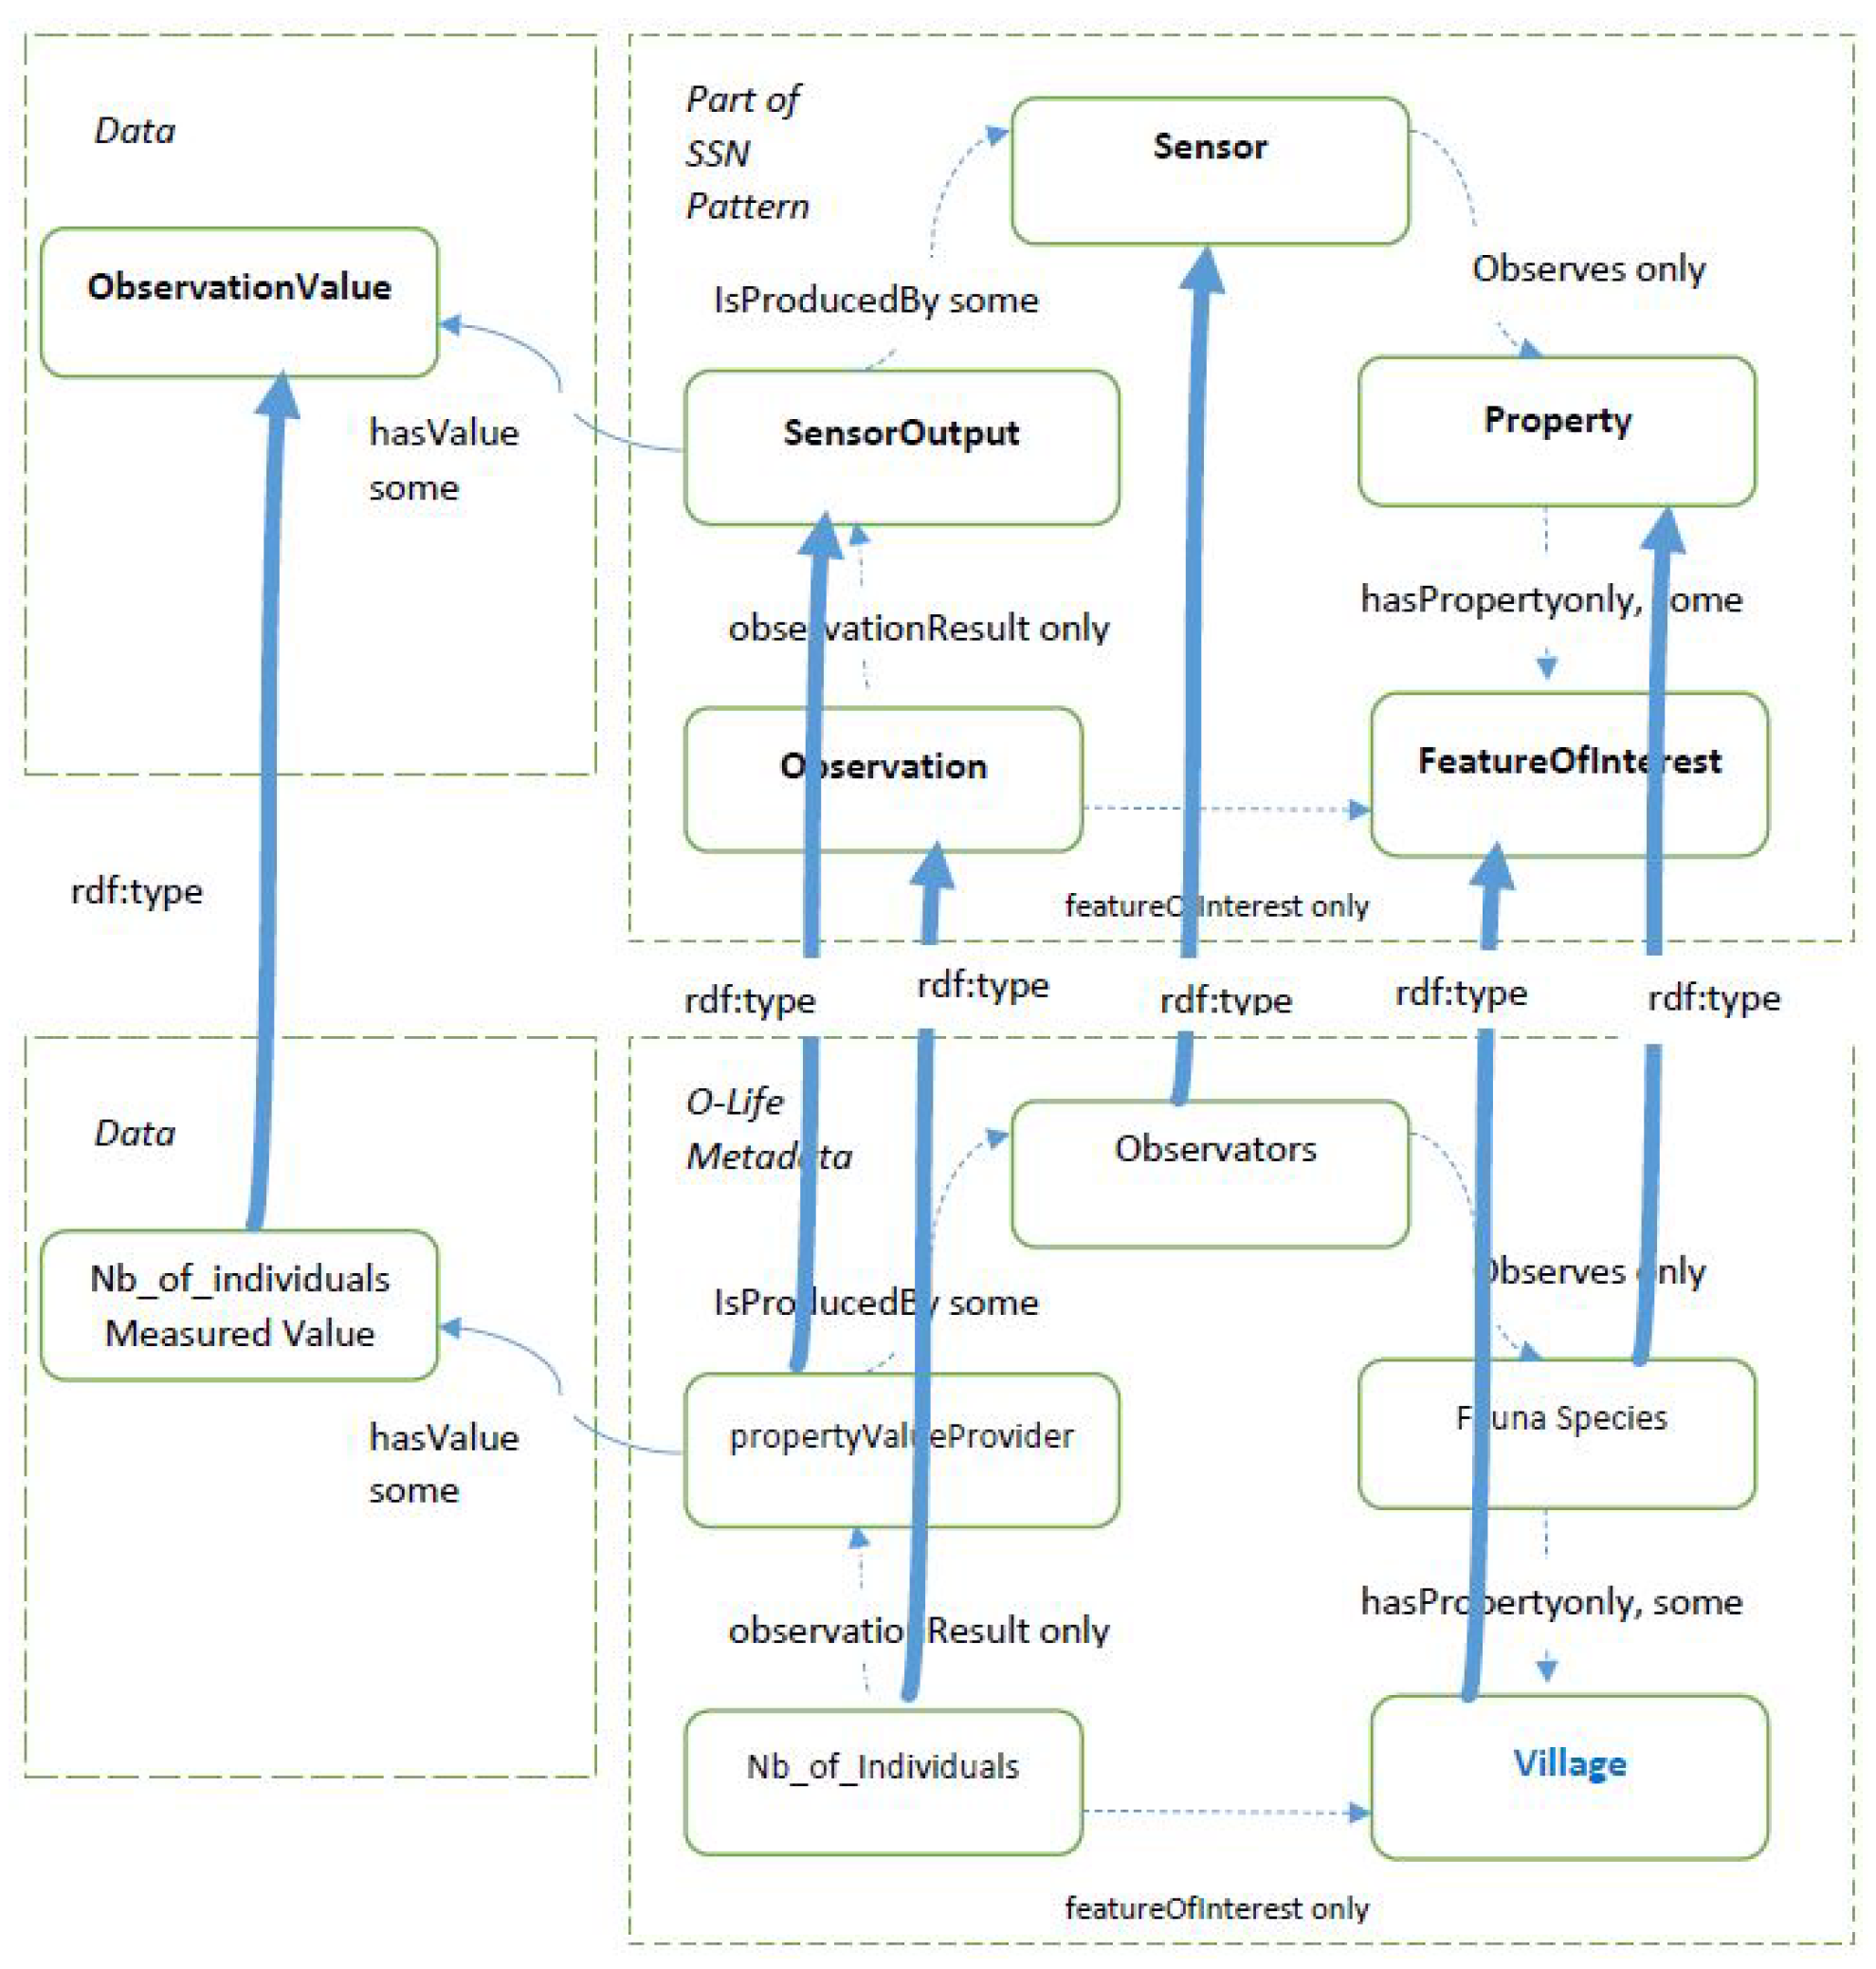
Every mapping will then be described under one alternative observation. In order to highlight the existence of alternative mappings, we also propose to refine the following SSN properties: featureOfInterest, observedProperty and observedBy. The case of the feature of interest is described in Figure 9.
Table 1 details the extensions we propose (introducing the prefix):
- the alternative observation class allows a given observation from the real dataset to be designed in different manners, meaning multiple mappings are available;
- the alternative feature of interest property makes it possible to highlight the fact that the observation being considered can be designed in various manners in order to define the feature of interest;
- the alternative observed property makes it possible to highlight the fact that the observation being considered can be designed in various manners in order to define the observed property;
- the alternative observed by property makes it possible to highlight the fact that the observation being considered can be designed in various manners in order to define the sensor.
It should be noted that we do not propose to refine the class and the other ones as we consider that the fact that the properties are refined is sufficient to keep the users aware of the existence of alternative mappings.
When considering the possible mapping from these data, it can be either argued that the species are followed up over time and space, meaning that the feature of interest is the species or that the geographic area is followed up over time, meaning that the feature of interest is the village.
This choice is depicted by Figure 5 and Figure 6 for column mappings and Figure 7 and Figure 8 as the UML models.
Moreover, the sensor may be chosen as being either the generic “human as a sensor” or the observer him/herself.
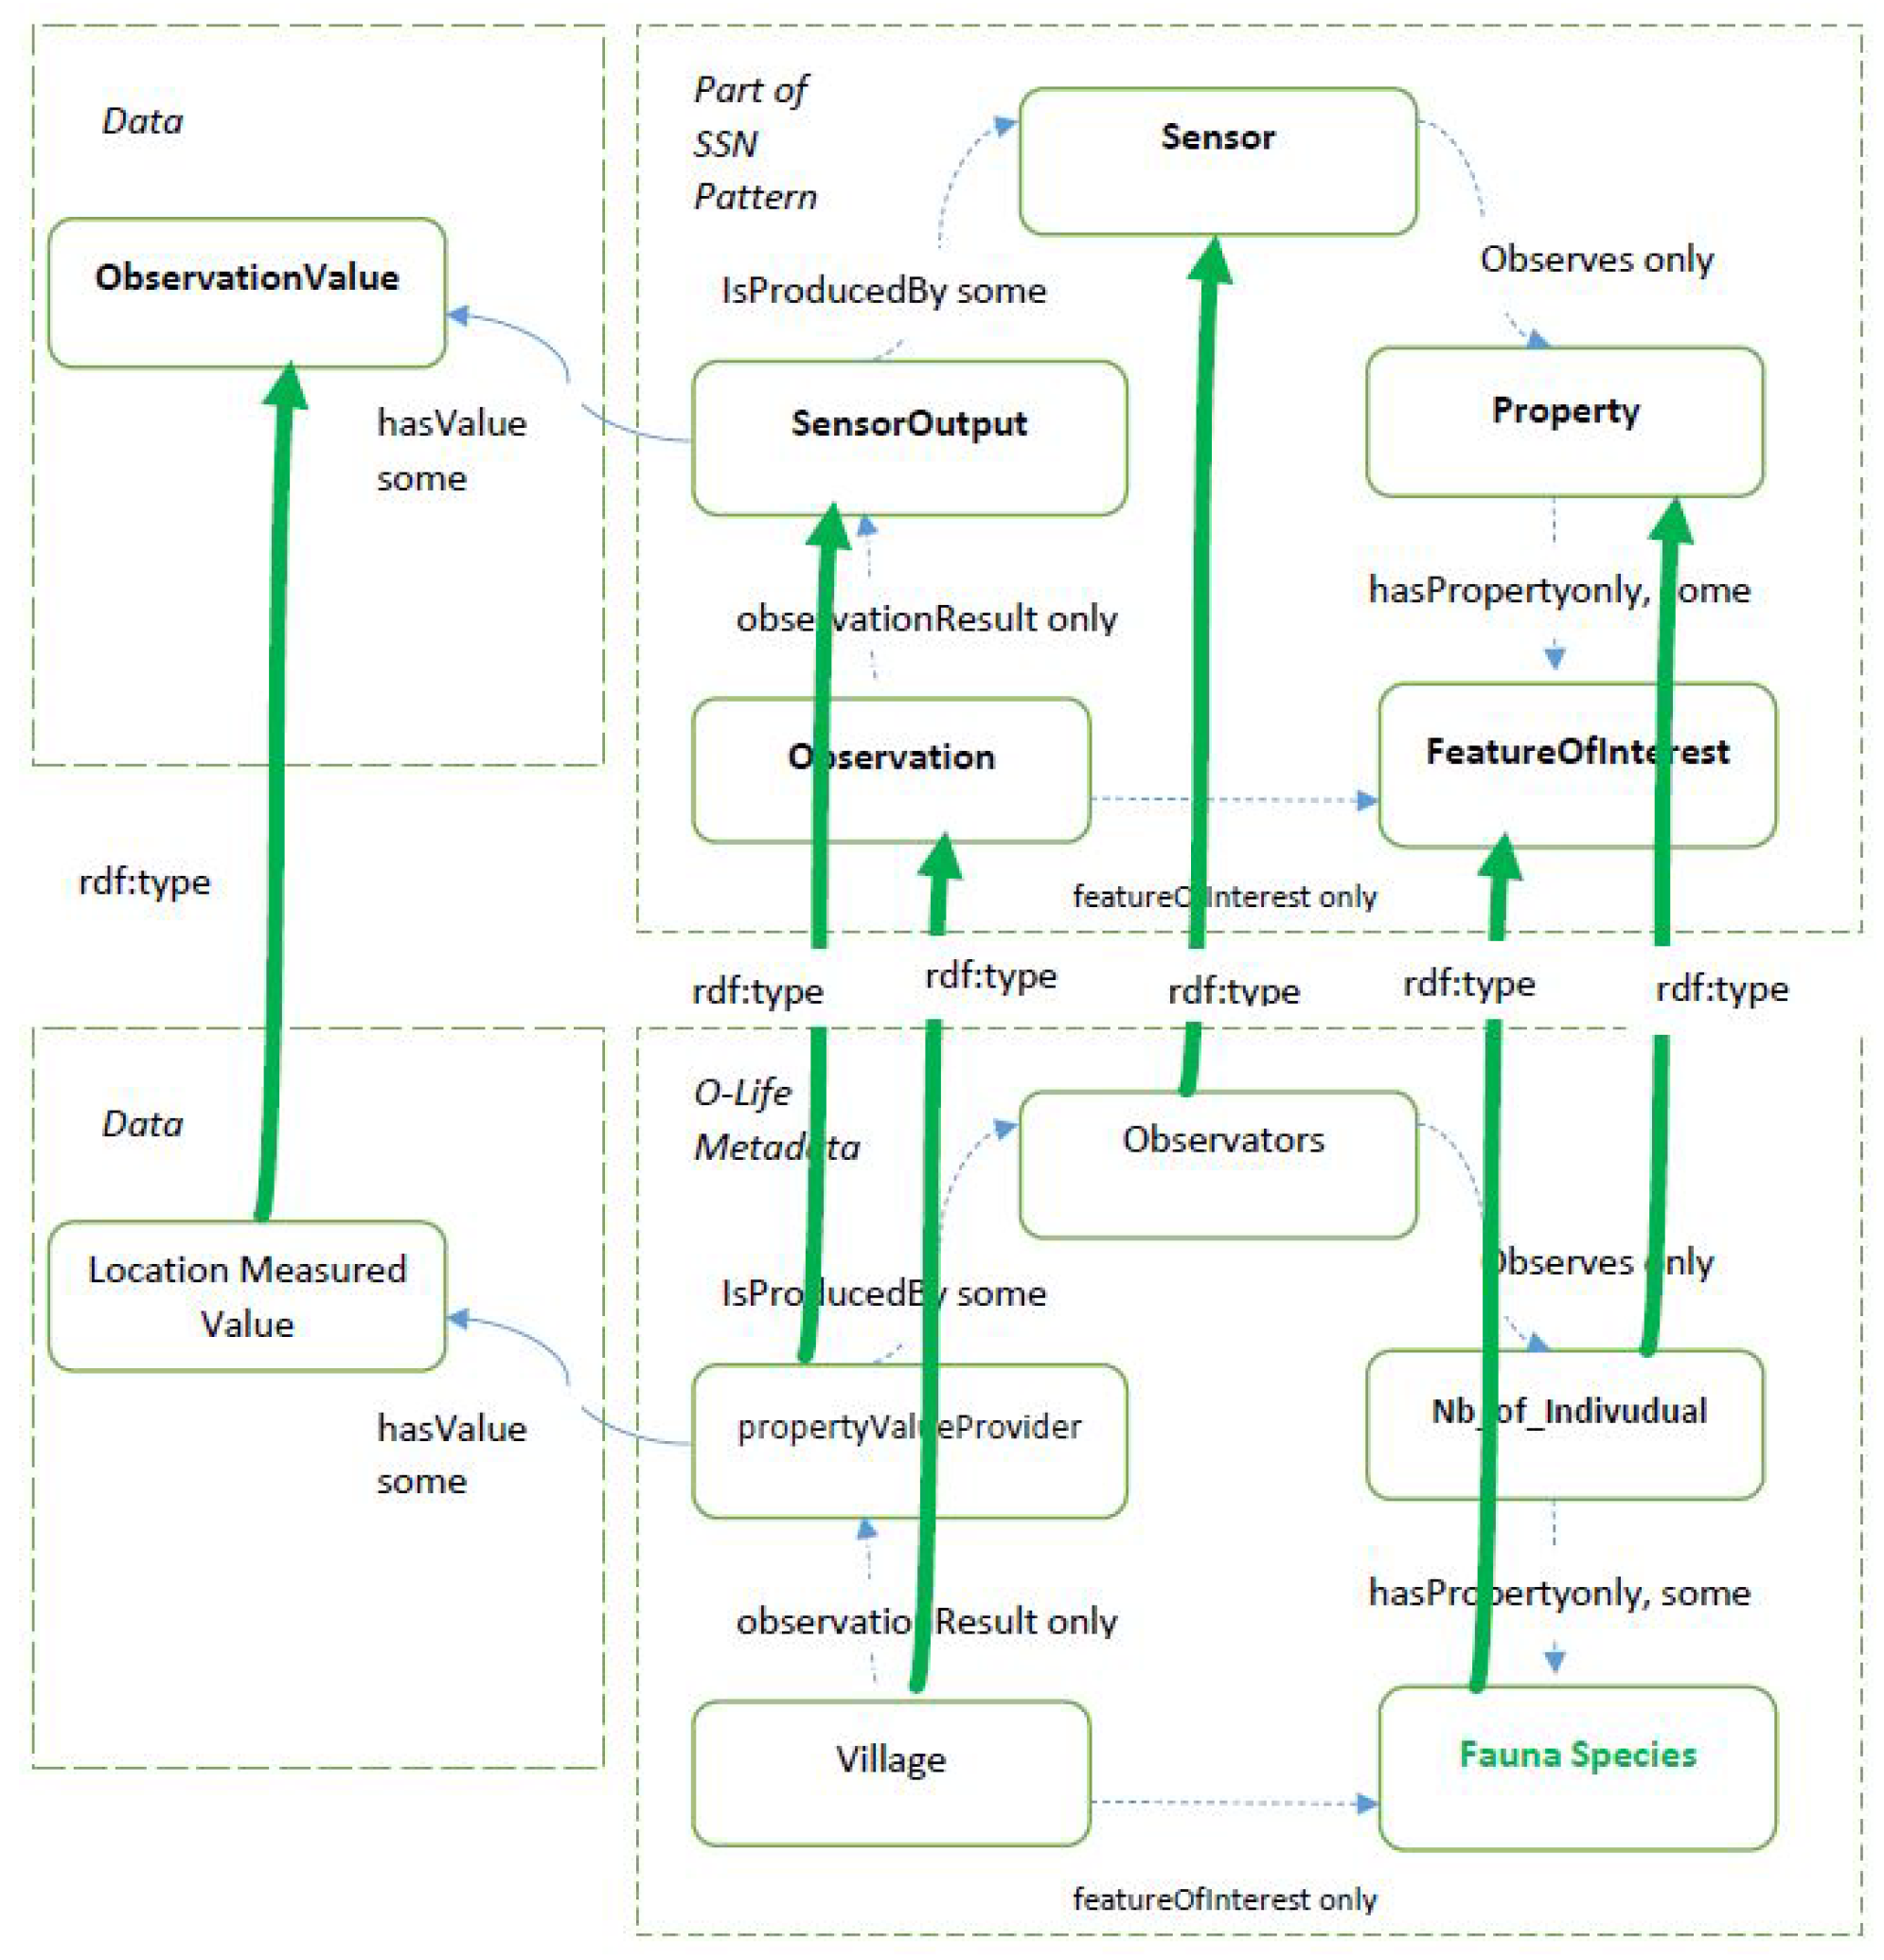
In the case of O-LiFE, the SSN mappings from data presented above are given by Figure 10 and Figure 11, and the multi-mapping is described in Figure 12. All these examples are built from sample data from the running example depicted by Figure 13, Figure 14 showing the 52 North SOS schema it relies on.
We consider that URIs have been provided for the data, as proposed by the SOS framework, and that the prefix for this dataset is . We thus have RDF triplets such as:
fauna:species mssn:altFeatureOfInterest ssn:FeatureOfInterest
2.3. Cataloging the Points of View
All the data sources are stored in the catalog, with as many entries as there are mappings and features of interest. The information must be mapped into the model used in the application being considered. Several models exist for representing catalogs.
Let us consider a data repository with the set of n data sources. Every data source is associated with mappings by considering alternative features of interest (see Section 2.2 above), thus resulting in a total number of representations of data sources.
We propose here a condense and more intuitive manner to present the information by grouping the points of view regarding the meaning, as for instance geographic areas or temporal information.
For this purpose, we consider a set of t features of interest, partitioned into two categories, namely and , where denotes common features of interest, as for instance geographic areas or temporal information, and denotes specific features of interest, as for instance the animal species.
We have thus .
2.4. Enabling/Disabling Navigation through the Points of View and Crossing Data
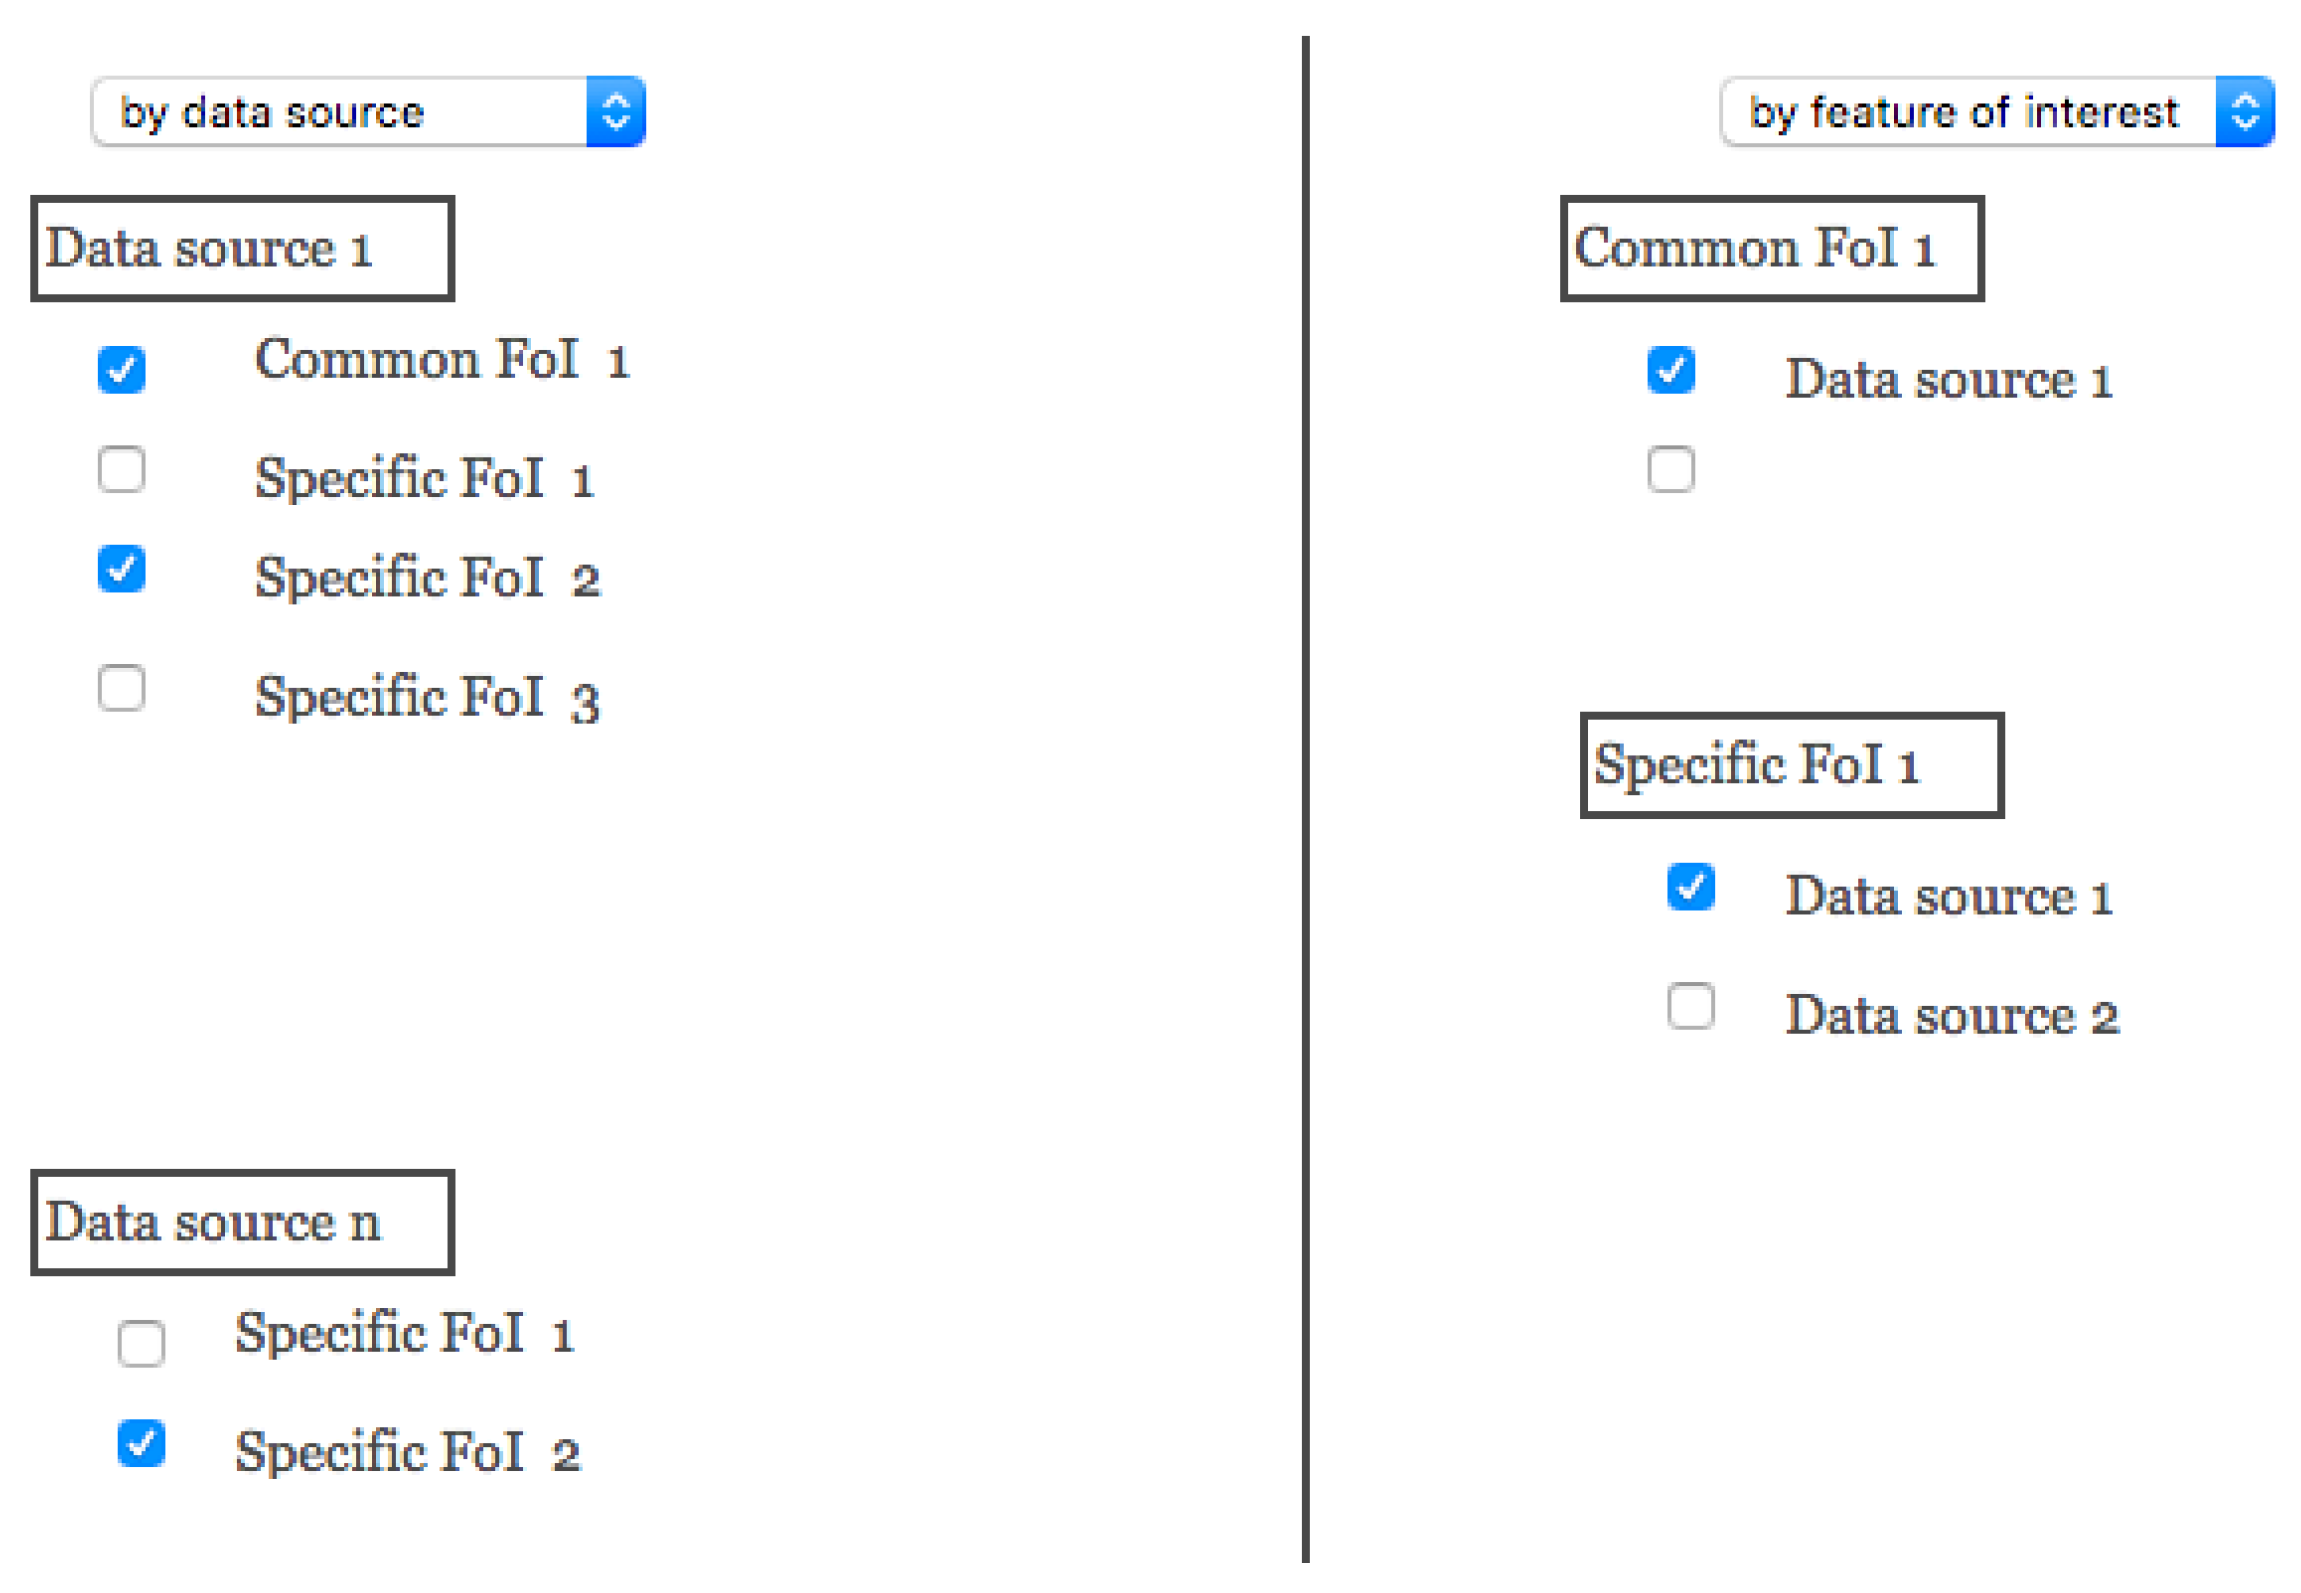
Given the information provided in the catalog (see Section 2.3), the user can then navigate through the data either by adopting the point of view of the data sources of by exploring the data sources on the basis of the different features of interest, knowing that common ones can act as pivots for data crossing.
Figure 15 shows how data sources can be displayed regarding these two versions.
It should be noted that the features of interest are sometimes at several levels of granularity, thus providing an OLAP-like navigation through dimensions [25]. The users can then roll up and drill down following the hierarchies when data can be aggregated through the levels, as for instance for zooming on geographic areas or for detailing some time periods (e.g., drilling down from years to months). However, it may be the case that such aggregations are not possible, either because data are not available at low levels of granularity or because it is not relevant to apply some aggregation operation over some dimension (e.g., summing temperatures is not relevant). We refer here to the taxonomy from [26] reported in Figure 2.
3. Experimental Data
This work has been implemented in the context of the information system of the O-LiFE environmental observatory.
3.1. O-LiFE Information System
O-LiFE is an observatory shared between France and Lebanon and built with the following objectives:
- Simultaneously conduct: observation, research, training and valorization;
- Federate skills through common tools and objects;
- Organize, share, sustain and enhance environmental data.
The observatory main activity is to study the critical zone around the Mediterranean Sea. As such, it addresses major environmental subjects such as water resources, biodiversity, natural hazards, environment management and, ultimately, land uses.
Analysis and visualization of the data produced by the sensors are very important parts for the researchers. This is the part that allows them to interpret the results of observations and analyze their effects on their research.
This information system relies primarily on a set of existing tools that implement recognized standards. It makes it possible to identify and structure the existing sources of data on the experimental corpus of Lebanon.
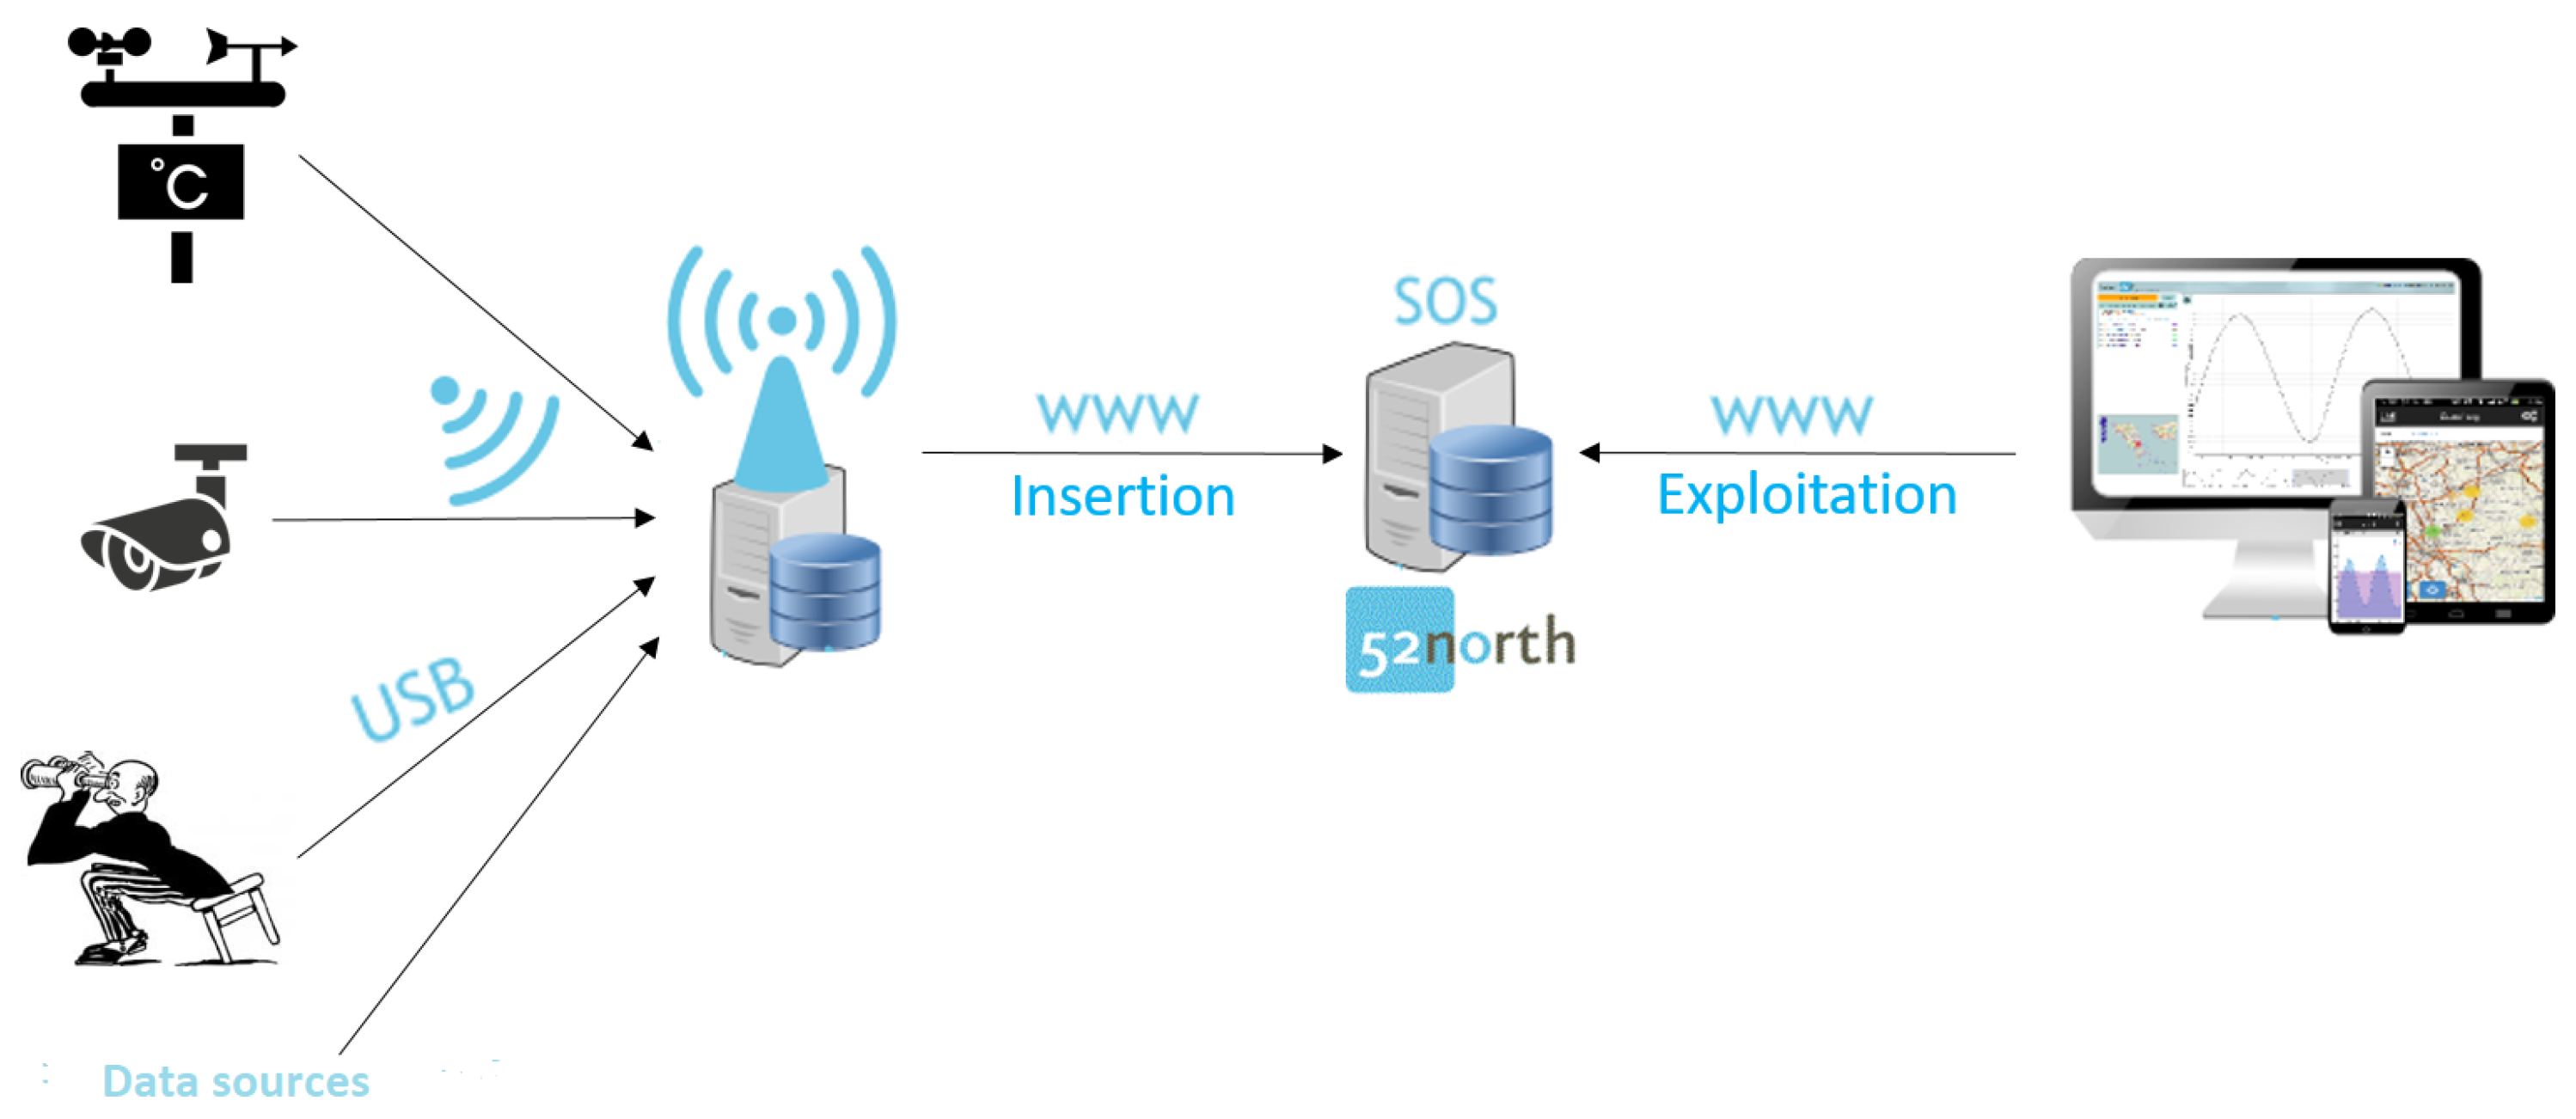
The Information System (IS) should store the data collected by various means (electronic, human, automated or manual, etc.). These data are saved in a central database and then inserted into the SOS service using HTTP requests. Then, these data can be queried and viewed by the clients by also using HTTP requests. Figure 16 shows the system’s general architecture.
Several clients are developed to retrieve these data and display them on maps and diagrams. Those are web clients using JavaScript libraries to connect to the SOS service through basic profile operations. In addition, these clients use open source data visualization tools such as Open Layers. We have used the SOS.js client, which is a JavaScript library used to build web pages to access the SOS service to use the observation data. This library contains the basic operations of SOS to retrieve the data of the observations and the metadata of the sensors. Similarly, it defines a web-based graphical interface to visualize the data. This client is open source and can be adapted to the needs of the SOS service.
As described in [30], the O-LiFE observatory is implemented by relying on the 52 North German initiative for Geospatial Open Source software, Sensor Observation Service (SOS) and Observations and Measurements (O&M) The SOS is a web service to query real-time sensor data and sensor data time series and is part of the Sensor Web framework. A 52 North PostgreSQL database with a predefined schema by the 52 North implementation of the SOS is used to store the sensors’ data. The PostGIS spatial extension is included in the PostgreSQL database. Apache Tomcat is used as the servlet container.
The database server contains environmental data from different data providers for different subjects and structures.
Then, the crossing of various phenomena makes it then possible to discover some correlations. However, some data are not that easy to map with this schema, and it may sometimes be difficult for the SOS users to integrate data within the framework.
3.2. Data Description
3.2.1. Snow Data
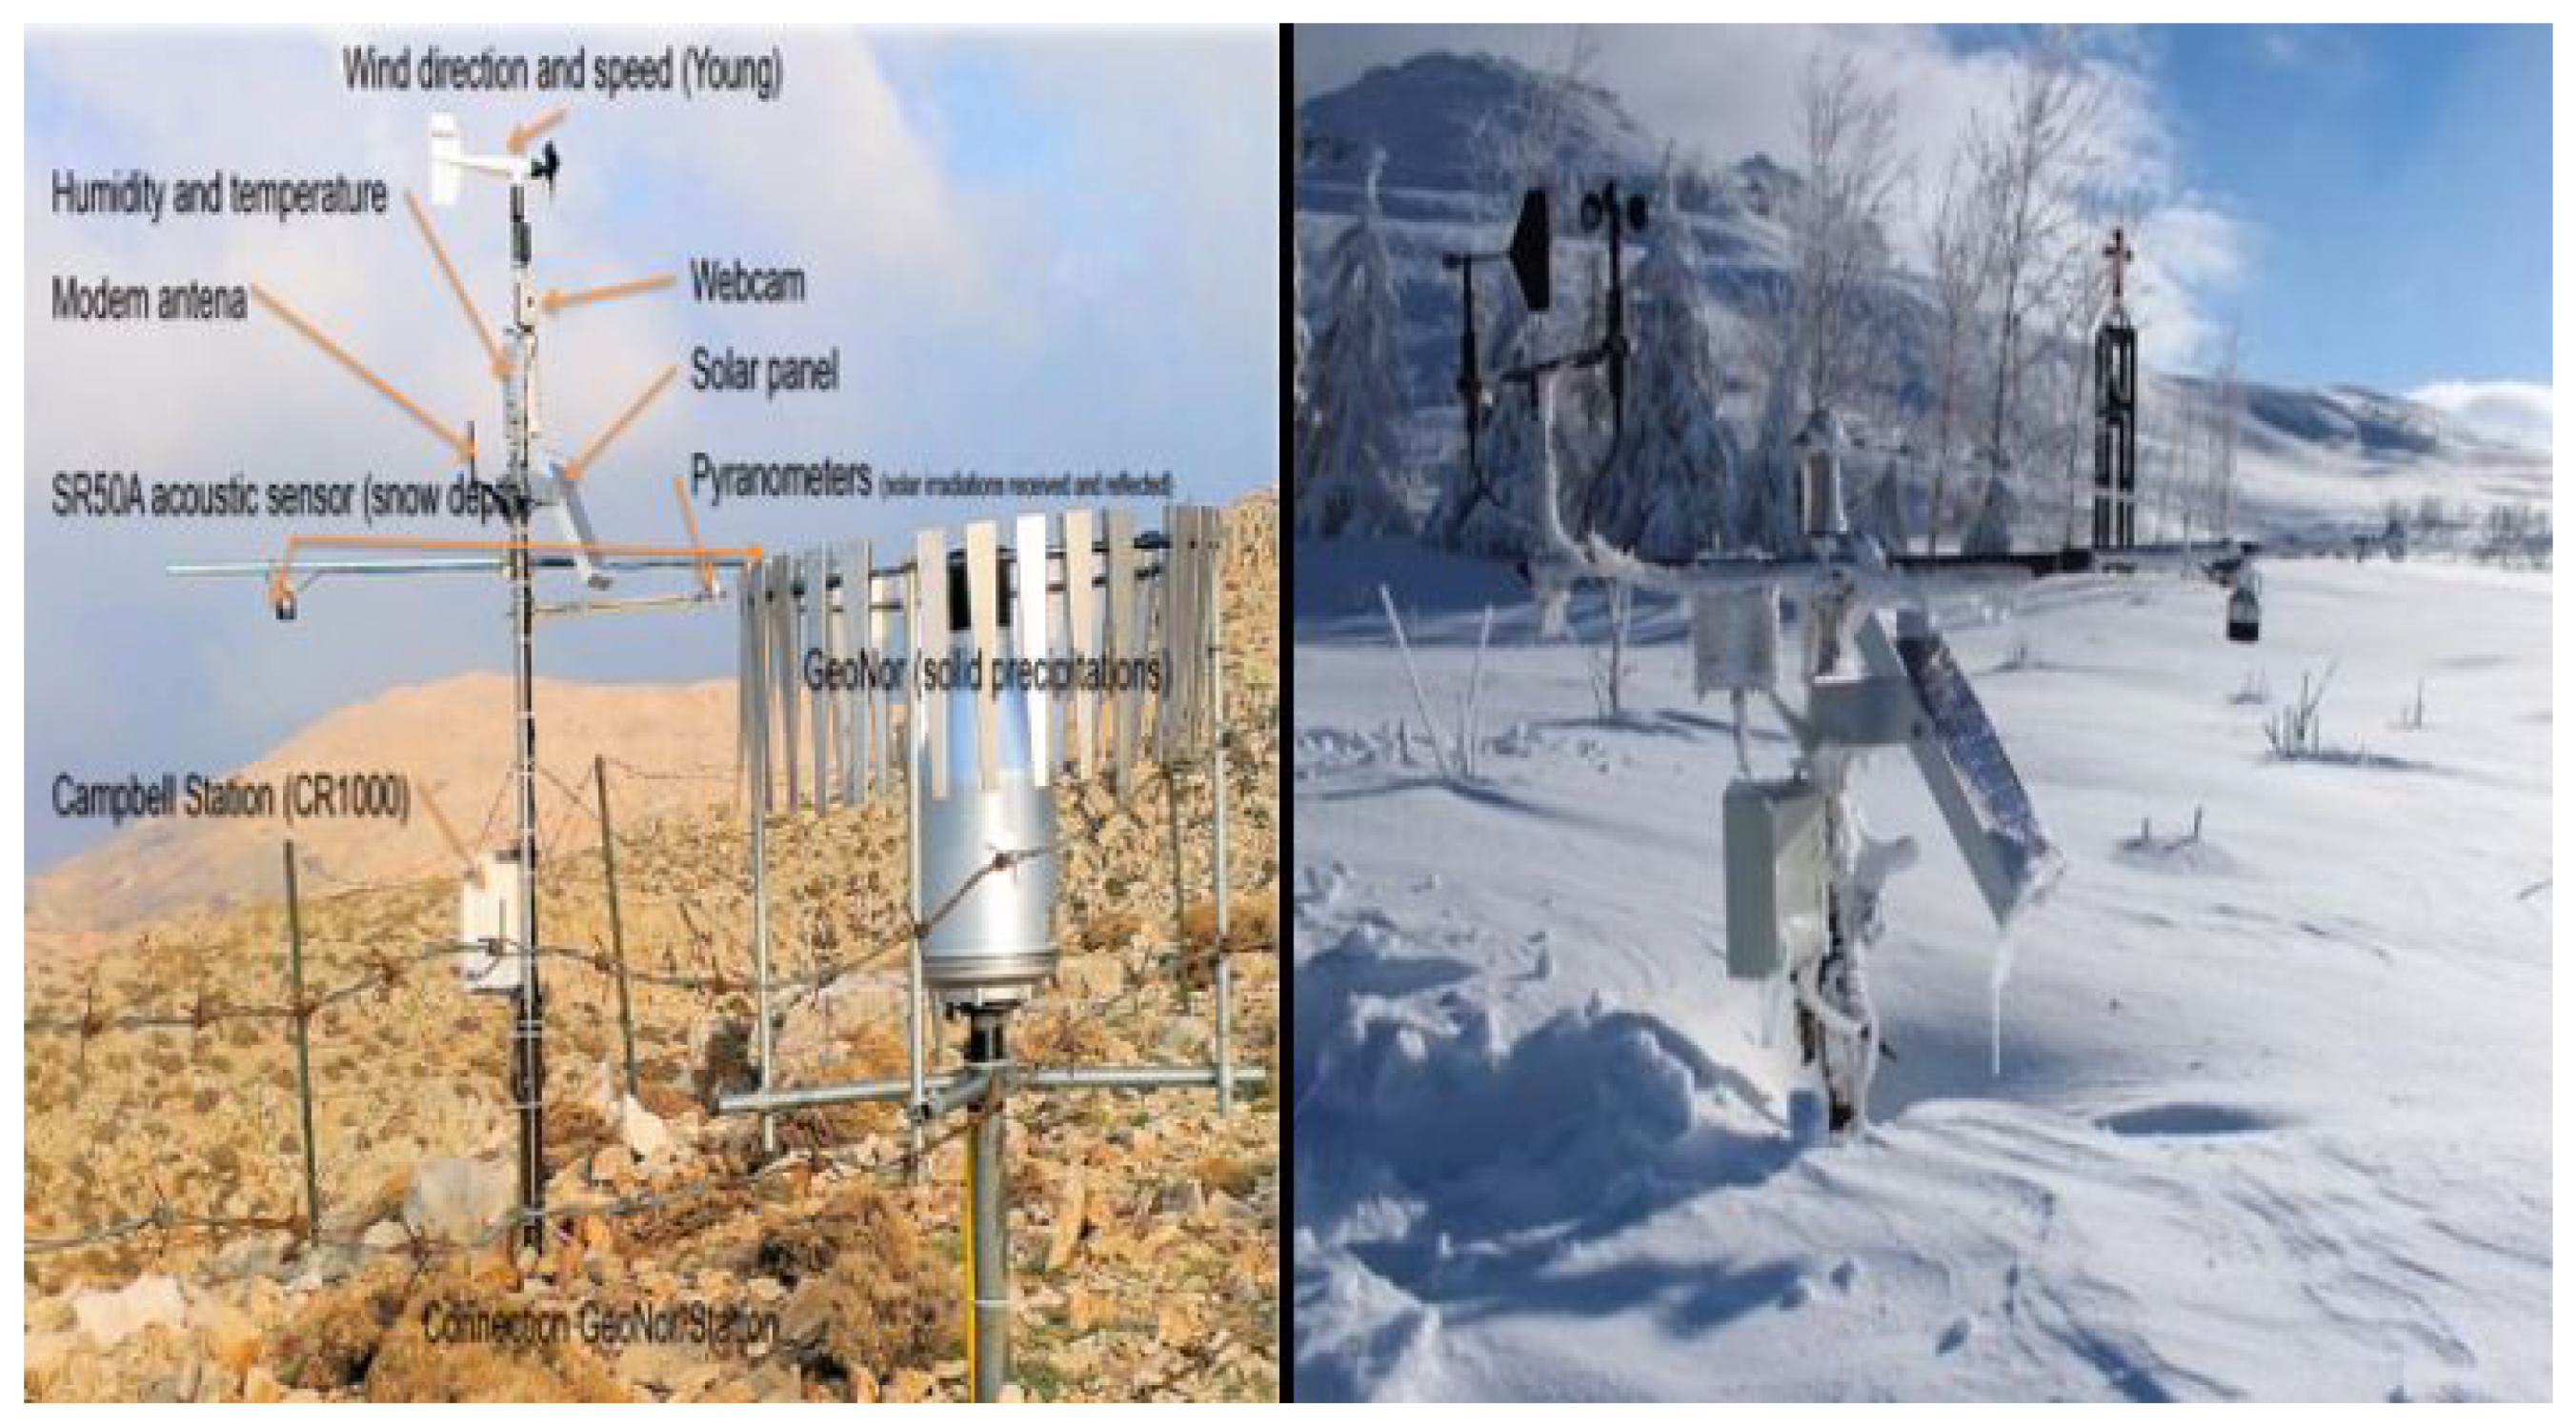
Data on snow cover in Lebanon (snow data) are collected as part of the snow observatory managed by Saint Joseph University (USJ), National Council for Scientific Research in Lebanon (CNRS-L) and Centre d’Etudes Spatiales de la Biosphère (CESBIO) in France. They concern the compilation of data collected on three permanent stations located on the heights of Mount Lebanon: Faraya (2200 and 2500 m in altitude), Laqlouk (1800 m in altitude) and Cedars (2900 m in altitude). This collection, initiated in 2010, makes it possible to monitor snow cover dynamics and to identify trends, anticipate risks, predict the climate and redistribution of melt-water and, above all, analyze the future availability of water. Each station consists of an acquisition unit (Campbell CR1000), which receives information from several sensors connected to it. Figure 17 shows such a station.
These sensors concern:
- temperature and relative humidity;
- wind horizontal speed and direction;
- snow depth, by sonar (acoustic sensor);
- solar radiation, by two pyranometers;
- the atmospheric pressure by barometry;
- the monitoring of the ambient weather in real time via a digital camera.
The measurements were taken every 30 min continuously. They were aggregated and stored on the ‘data logger’ in a CSV file and then collected manually and periodically.
Snow studies focus on the impact of weather conditions on snow depth during the year in a given area. For this, several phenomena are observed using sensors positioned on one or more workstations in each region. The proposed platform is not intended solely for these types of data. It is designed so that it can handle all O-LiFE data. This is handled thanks to the phase that standardizes the data format and transforms them.
Several observed properties are included in these studies including air temperature, wind speed and direction, relative air humidity, atmospheric pressure, direct and reflected solar radiance, raw and corrected snow depth, the maximum wind speed and the battery voltage of the sensor system. The data of these observed properties all have numeric-type values.
3.2.2. Wells Data
Wells’ data are collected for the purpose of developing a database of some groundwater wells in the Bekaa region to assess the state of groundwater resources in terms of quantitative indicators by carrying out two seasonal measurements (winter and spring, 2014) of the water level. The height of the water column is the only parameter collected.
3.3. Interpretation
In this section, we present, using real data of O-LiFE, an example showing the different features of the proposed platform. The data used in this example were mainly those of the snow observation system.
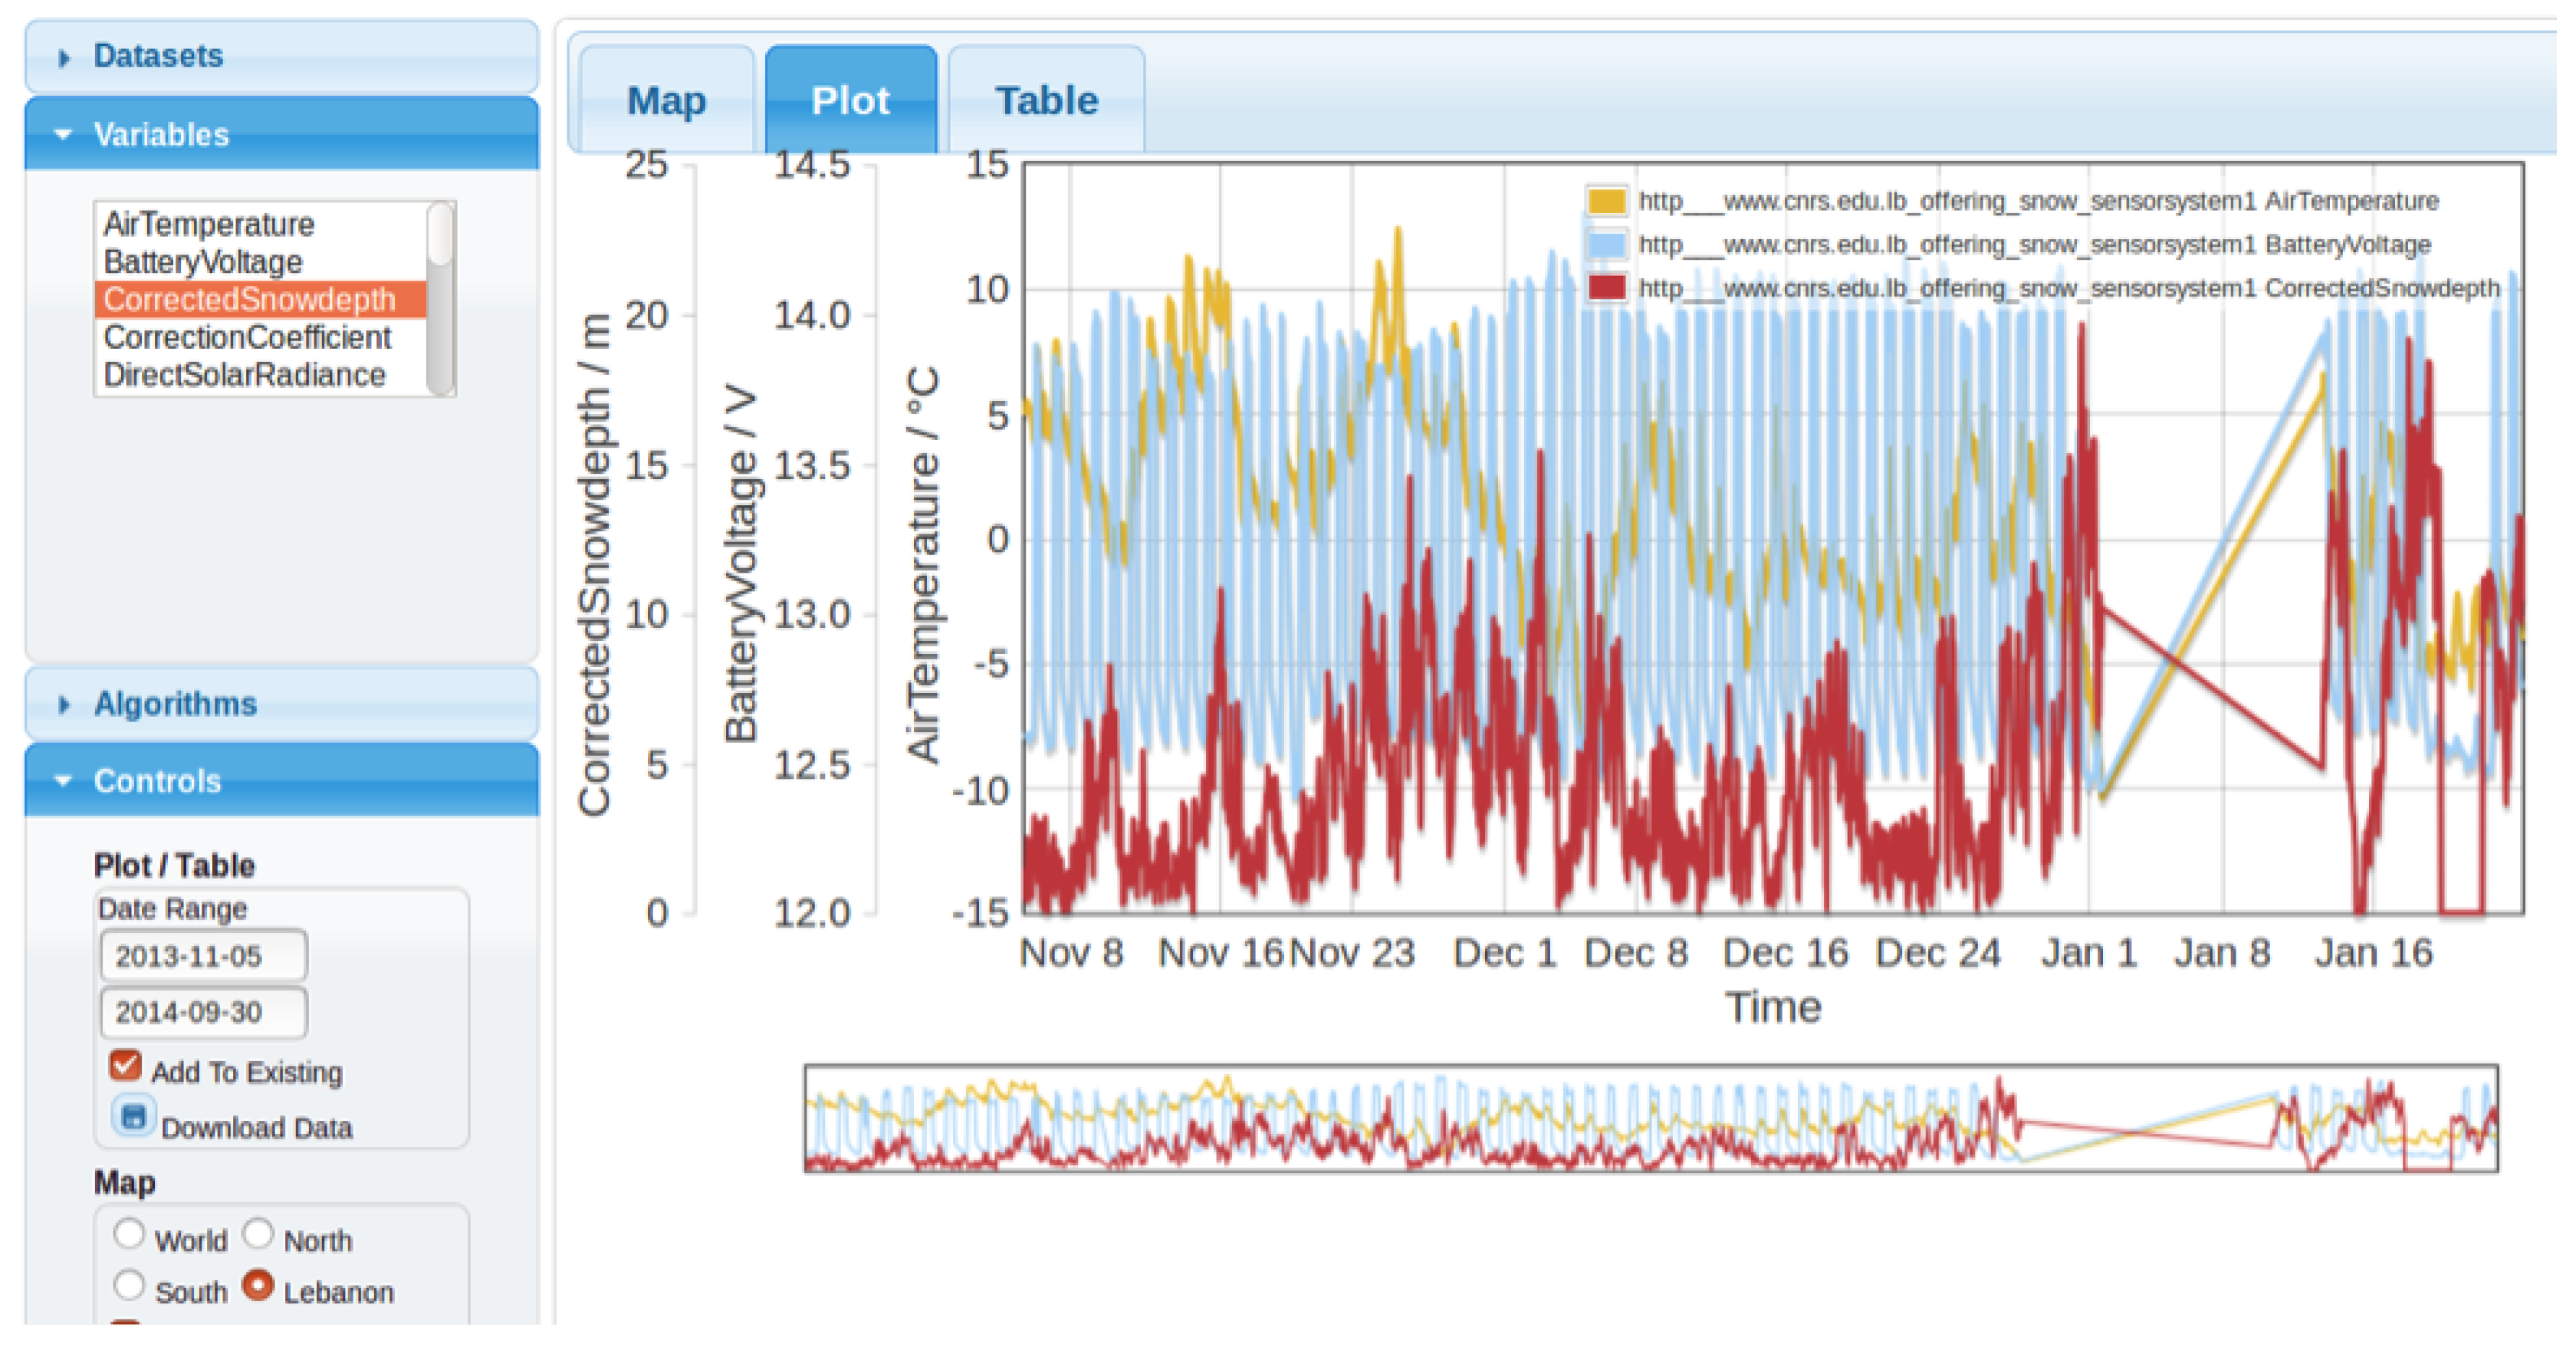
This first example makes it possible to visualize all the data recovered on a station. This brings together several sensors that allow one to cross the information on the various parameters studied. Figure 18 below shows the depth of the snow and the temperature of the air measured from November 2013 till January 2014 of the Mzaar and Cedars stations. We have also made the choice to report an “internal” variable to the measurement system (the voltage delivered by the station’s battery) to show that these instrumental data are also important. For example, a malfunction of the station could be detected, potentially leading to errors in the measurement. It is also noted that these variables allow monitoring and preventive intervention in the event of a malfunction, thus guaranteeing the continuity of the measure. This sequence makes it possible to visualize three months of data with a recording interruption at the end of the period. We distinguish very clearly on the temperature measurement three superimposed frequencies:
- a very high frequency variation related to day/night alternations;
- a frequency variation of approximately eight days, which may correspond to one or two synoptic situations;
- a low monthly frequency variation.
The snow depth also presents these three frequencies, but with a much lower amplitude for the high frequency variations, as well as a systematic shift from a few hours to a few days for frequencies probably related to the synoptic events. There is therefore a slight anti-correlation between the increase in temperature and the decrease in the snow pack, which can be attributed to the resilience of the melting phenomenon related to the good internal thermal insulation of the snow. This is the well-known phenomenon of the igloo and the good thermal insulation it provides. Low frequency variations, on the other hand, seem to be slightly correlated, suggesting a cold, but dry period in December. This kind of approach allows for example to suggest that the synoptic situations are the main winter control of the height of the snow pack in the period. This example also shows the problem associated with the lack of data. Note that we understand immediately that the lack of data is related to a malfunction of the measuring station. In this case, of course, the original file has been cleaned up without adding false data or a negative value. This example of “internal” cross-referencing of a dataset shows that it allows both data consistency analysis and internal validation of the measure, as well as scientific exploitation.
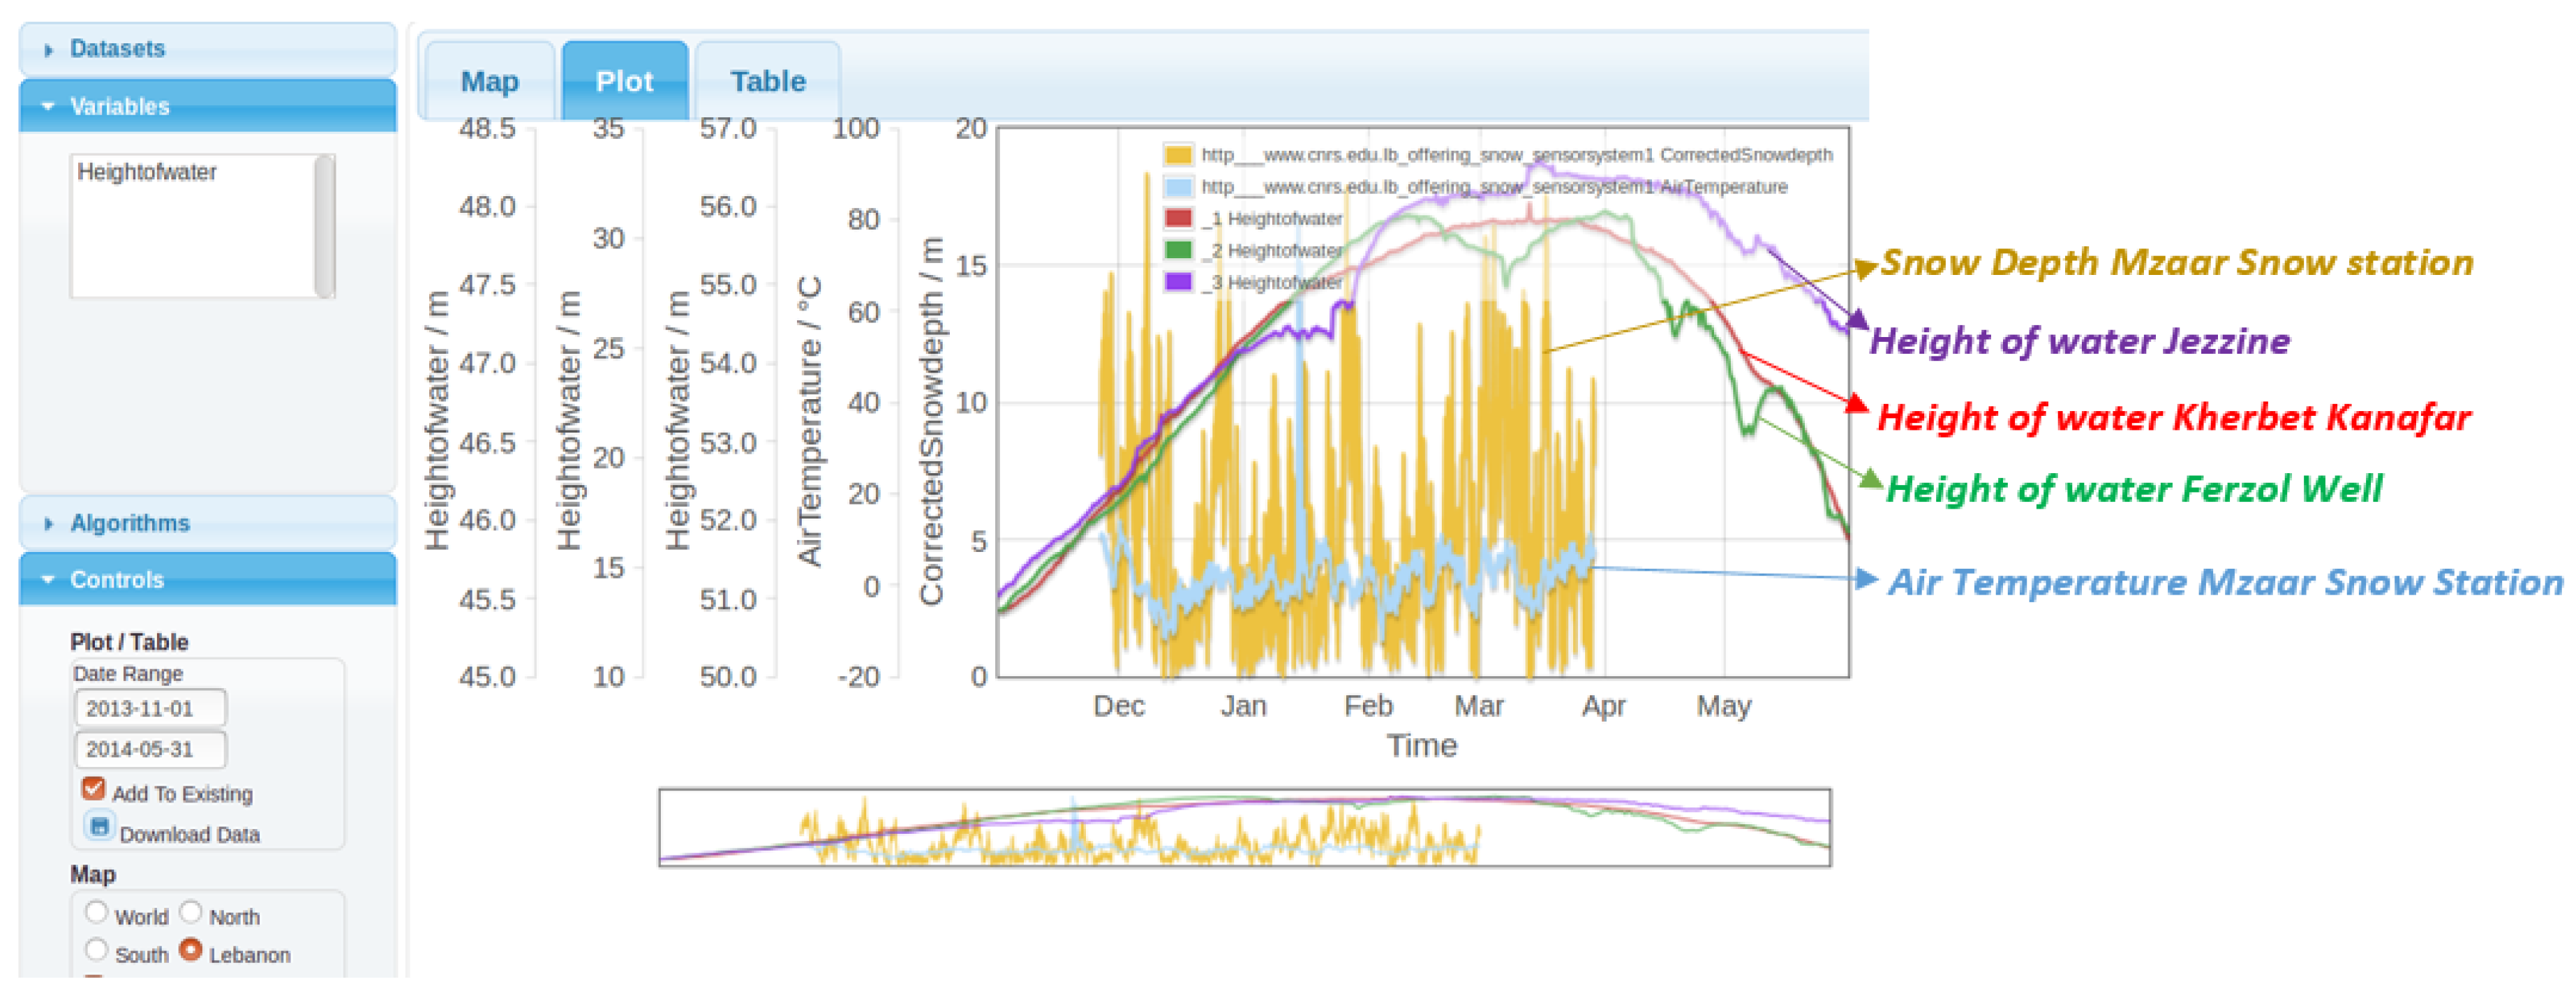
3.4. An Example of a Data Crossing between Two Data Sources
This second example concerns the crossing of data from two different sources. We are at the heart of the contribution of O-LiFE’s Information System since its purpose is to allow the crossing of data generated by different actors who have not necessarily shared their point of view.
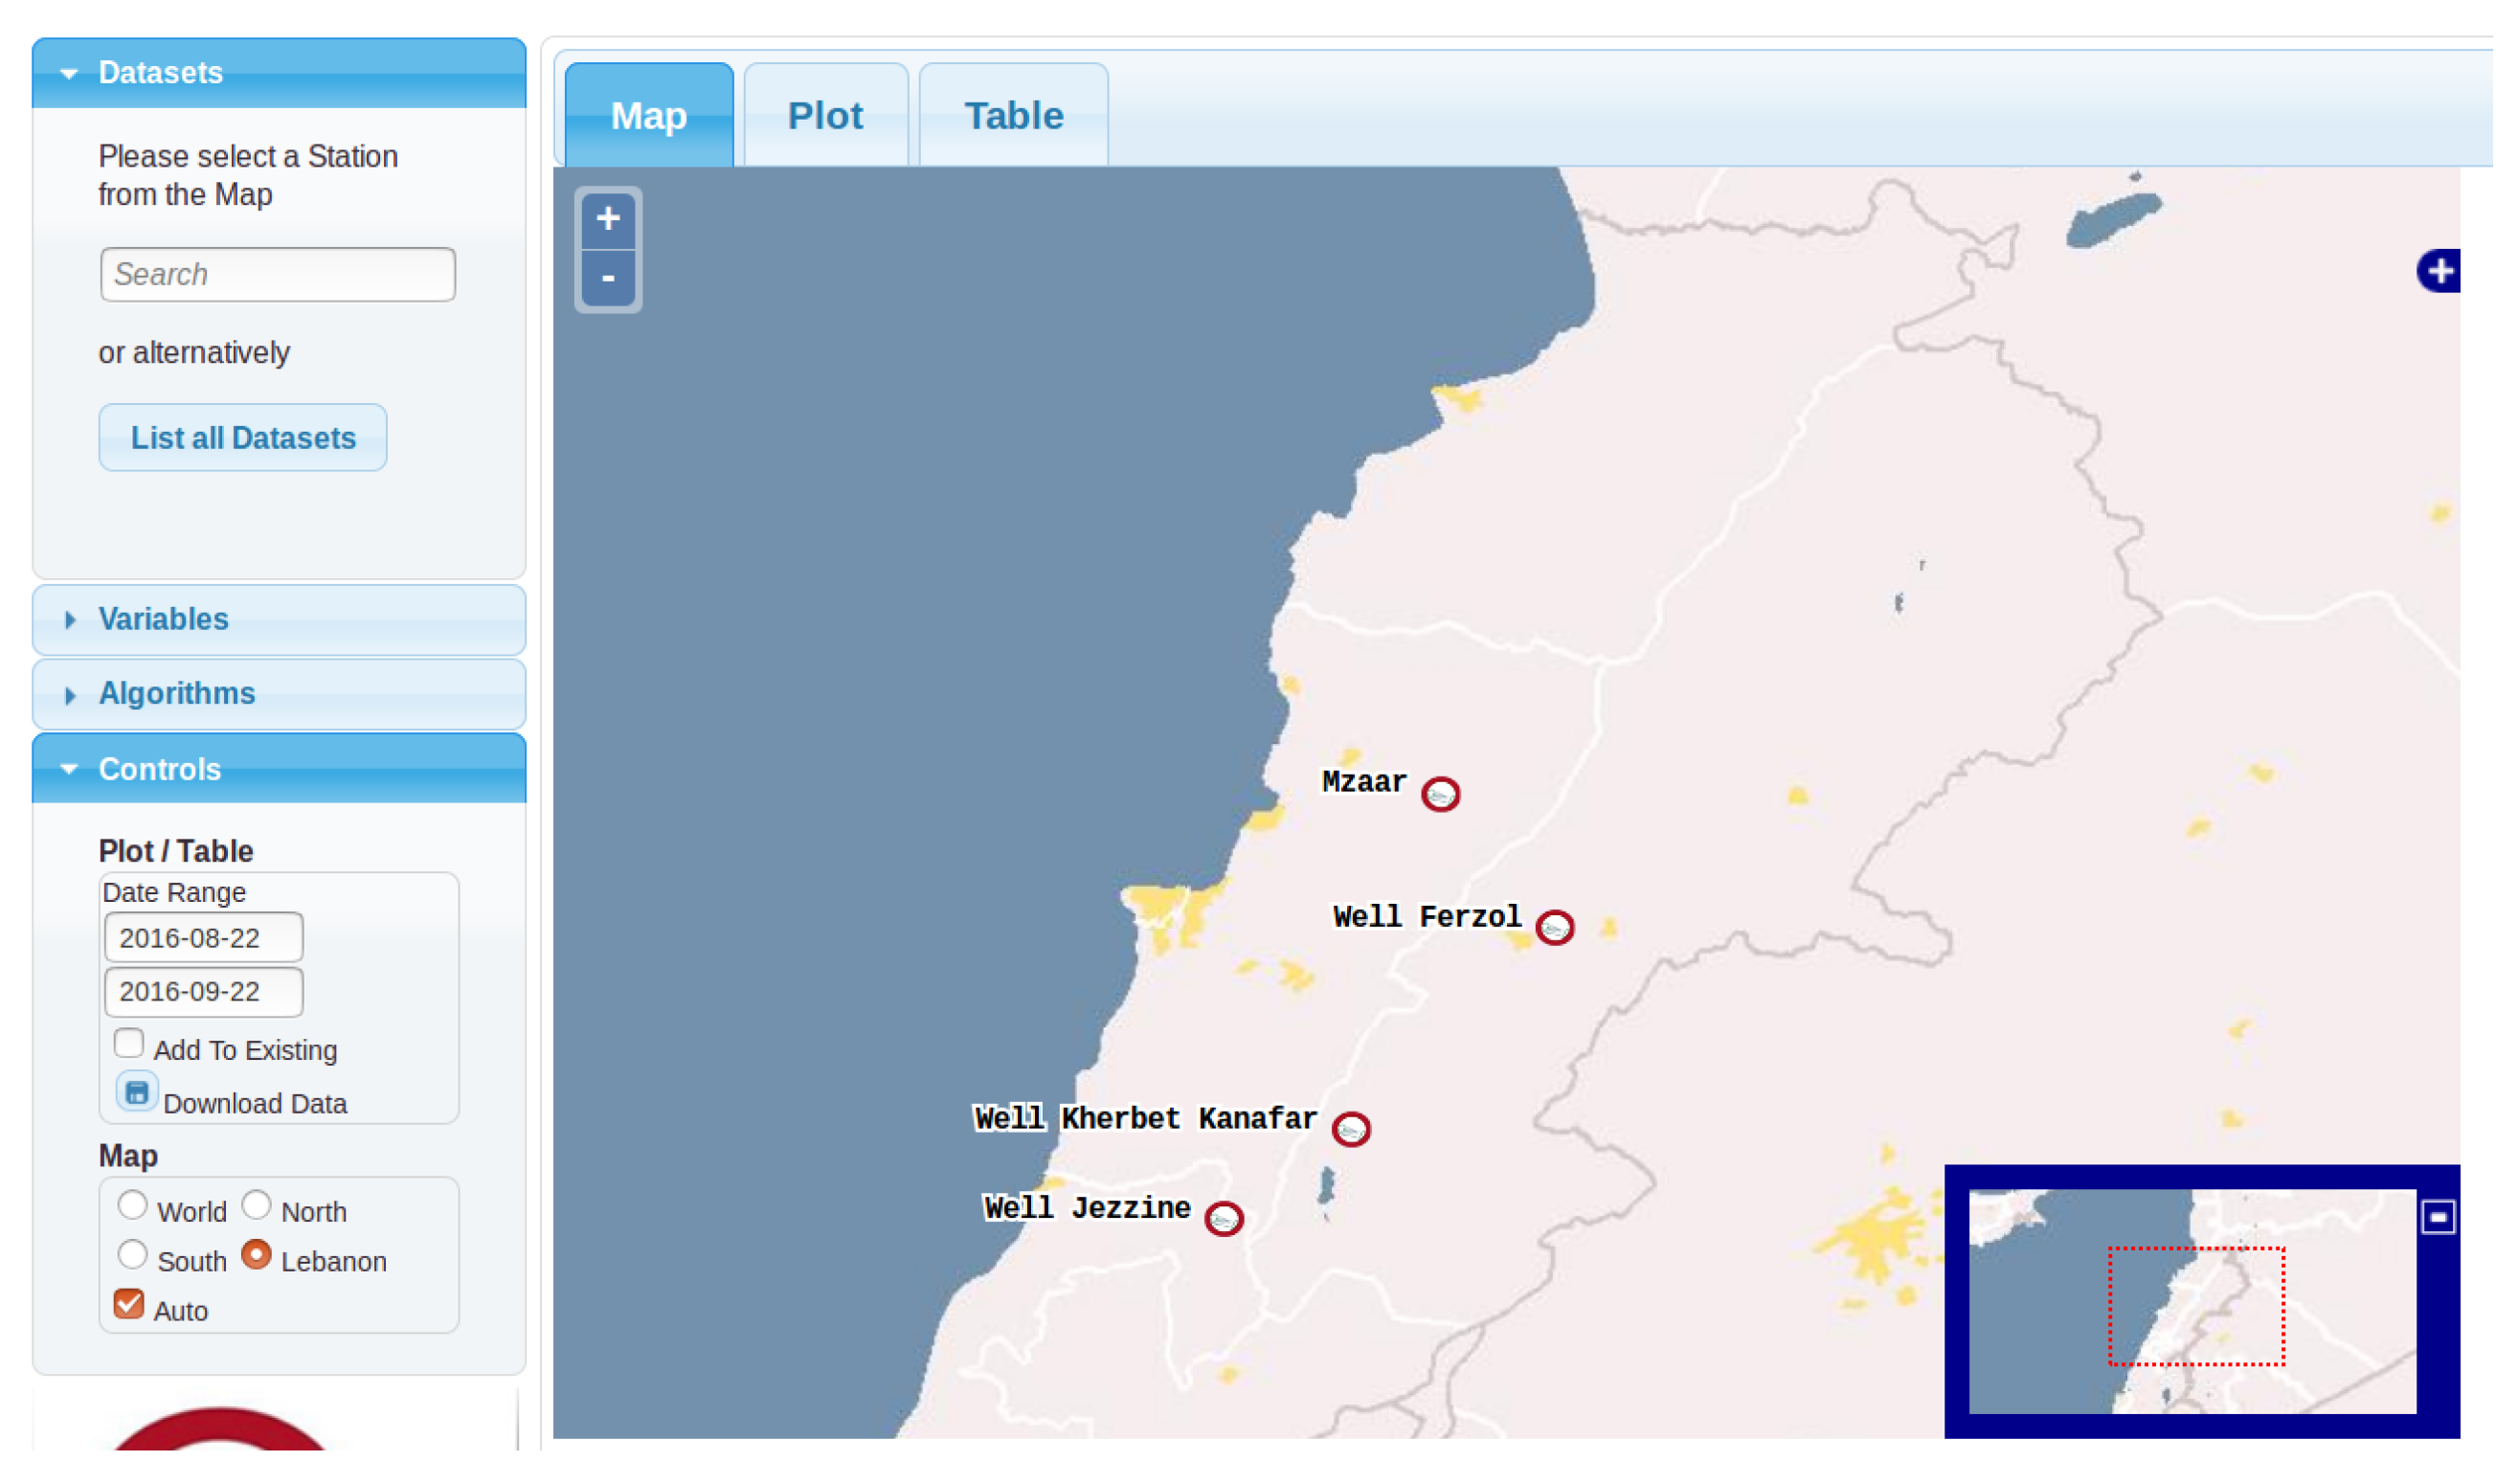
As stated before, snow depth and air temperature are extracted from snow stations, but the water level of the groundwater has been added taken from wells at several places along the course of Litani River in the Bekaa region as shown in Figure 20, and particularly the area of Ferzol watershed of the reverse snow measurement site. It is noted that the resolution of the data of the two sources is not exactly the same, which of course reflects that the measurement of the water level is daily (twice a day in the best case), while the measurements at the station “snow” are taken every 30 min. However, resolutions are sufficiently compatible to allow analysis as shown in Figure 20. There are quite variable hydrological dynamics within the watershed, but an increase in all flows with the change of season towards spring. It also seems that the flows stabilize fairly quickly from the beginning of March, characterized by both a significant increase in both temperature and snowfall, which seems contradictory. We notice that Ferzol well has a clear decrease in flow as the snow height increases on the peaks. This may reflect the resilience of the hydrological system in relation to the dynamics of growth/melting of the snow pack. We also note that the other systems seem undisturbed and that all flows decrease rapidly after the month of April.
The crossing of these data is necessary to understand the dynamics of the transfer of the water resource and the functioning of the hydro systems on which all the coastal cities of Lebanon depend, and in particular the dependence of the resource on the initial stock and on the dynamics of the snow melt, for example to develop predictive indicators of the available resource and ultimately to adapt its use.
4. Conclusions
The volume of environmental data is growing dramatically as it is crucial to collect such data to better understand global changes and their impacts. Such data are stored in repositories that are meant to deliver data and services to decision makers and scientists. As for every decision support system, these analyses often require crossing data sources so as to discover and/or highlight correlations between data. However, relevant data crossings may be hidden because the data are presented in an “oriented” point of view due to their production. For instance, geographers and biologists, because they do not focus on the same scientific topics, may represent the data in different manners.
In this article (following our first work from [8]), we thus propose an extension of existing approaches for easing data crossing. Our contribution lies in the framework of “data preparation” that can be linked to the ETL (Extract Transform Load) process in data warehouses. It consists of proposing “multiple mappings” for every data source, meaning that the data are transformed to obtain all possible data representations. The transformation takes advantage of the standards that guide the representation of environmental data for pointing out the “feature of interest” that is observed (SOS model). These representations are then offered to the user by means of a catalog.
For this purpose, we propose a five-step methodology: (i) reconciling data schemes with standards (e.g., O&M and SSN for sensor data); (ii) exploding and duplicating points of view over the data through multi-mapping; (iii) cataloging the points of view; (iv) enabling/disabling navigation through the points of view; (v) crossing data with existing and extended tools.
Our proposal focuses here on the first four steps and has been applied on environmental issues in the context of the O-LiFE Lebanese-French Observatory.
On top of the methodology, which is novel, the main contributions of this work lie in Steps (ii) and (iv) (proposition of the multi-mappings and navigation through points of view in an OLAP-like manner). These two topics had never been proposed before in the literature and in the tools proposed to scientists.
A a result of the exploitation of this, the experts of the environmental data have realized how biased the representations of their data are and how crucial the work on multiple points of view is for better exploring data crossings.
In future work, we aim to focus on the last step (data crossing) for automating data crossing by automatically testing the application of machine learning and pattern mining algorithms on the data. Such methods may help to discover relevant correlations among data in order to better understand the mechanisms of global change and the impacts. Several methods may be tested to deal with this perspective, such as support vector regression, frequent pattern mining and gradual pattern mining. Regarding the complexity of this topic and the combinatorial explosion problem, methods will have to be scalable and high performance computing and new paradigms (map/reduce and Spark) will be required.
Author Contributions
H.H.-H. implemented the program and article writing. A.L. developed the concept and structured the manuscript. A.M. contributed to the concept and article writing. All authors have read and approved the manuscript.
Funding
This research received no external funding.
Acknowledgments
The authors would like to thank the Lebanese and French CNRS and the O-LiFE observatory. The authors would also like to thank Nicolas Arnaud, Laurent Drapeau, Carla Khater and Olivier Lobry. This is an LIAO-LiFE Contribution Number SA-42-2018.
Conflicts of Interest
The authors declare no conflict of interest.
Abbreviations
The following abbreviations are used in this manuscript:
| O-LiFE | L’Observatoire Libano-Francais pour l’Environnement |
| OGC | Open Geospatial Consortium |
| SWE | Sensor Web Enablement |
| SOS | Sensor Observation Service |
| O&M | Observations and Measurements |
| FoI | Feature of Interest |
| IS | Information System |
| GAV | Global As View |
| LAV | Local As View |
References
- Catarci, T.; Lenzerini, M. Representing and Using Interschema Knowledge in Cooperative Information Systems. Int. J. Coop. Inf. Syst. 1993, 2, 375–398. [Google Scholar] [CrossRef]
- Dayal, U.; Castellanos, M.; Simitsis, A.; Wilkinson, K. Data integration flows for business intelligence. In Proceedings of the 12th International Conference on Extending Database Technology: Advances in Database Technology, Saint Petersburg, Russia, 24–26 March 2009; ACM International Conference Proceeding Series; Kersten, M.L., Novikov, B., Teubner, J., Polutin, V., Manegold, S., Eds.; ACM: New York, NY, USA, 2009; Volume 360, pp. 1–11. [Google Scholar] [CrossRef]
- Jovanovic, P.; Romero, O.; Simitsis, A.; Abelló, A. Integrating ETL Processes from Information Requirements. In International Conference on Data Warehousing and Knowledge Discovery; Cuzzocrea, A., Dayal, U., Eds.; Springer: Berlin, Germany, 2012; Volume 7448, pp. 65–80. [Google Scholar]
- Simitsis, A.; Vassiliadis, P. A method for the mapping of conceptual designs to logical blueprints for ETL processes. Decis. Support Syst. 2008, 45, 22–40. [Google Scholar] [CrossRef]
- Katsis, Y.; Papakonstantinou, Y. View-based Data Integration. In Encyclopedia of Database Systems; Springer: Boston, MA, USA, 2009; pp. 3332–3339. [Google Scholar] [CrossRef]
- Miu, M.; Zhang, X.; Dewan, M.A.A.; Wang, J. Development of Framework for Aggregation and Visualization of Three-Dimensional (3D) Spatial Data. Big Data Cogn. Comput. 2018, 2, 9. [Google Scholar] [CrossRef]
- Madera, C.; Laurent, A. The next information architecture evolution: The data lake wave. In Proceedings of the 8th International Conference on Management of Digital EcoSystems 2016, Biarritz, France, 1–4 November 2016; Chbeir, R., Agrawal, R., Biskri, I., Eds.; ACM: New York, NY, USA, 2016; pp. 174–180. [Google Scholar] [CrossRef]
- Hajj-Hassan, H.; Arnaud, N.; Castelltort, A.; Drapeau, L.; Laurent, A.; Lobry, O.; Khater, C. Multimapping Design of Complex Sensor Data in Environmental Observatories. In Proceedings of the 6th International Conference on Web Intelligence, Mining and Semantics, Nîmes, France, 13–15 June 2016; ACM: New York, NY, USA, 2016; pp. 2:1–2:10. [Google Scholar] [CrossRef] [Green Version]
- Desconnets, J.; Moyroud, N.; Libourel, T. Méthodologie de mise en place d’observatoires virtuels via les métadonnées. In Proceedings of the Actes du XXIème Congrès INFORSID, Nancy, France, 24–27 May 2003; pp. 253–267. (In French). [Google Scholar]
- Broring, A.; Echterhoff, J.; Jirka, S.; Simonis, I.; Everding, T.; Stasch, C.; Liang, S.; Lemmens, R. New Generation Sensor Web Enablement. Sensors 2011, 11, 2652–2699. [Google Scholar] [CrossRef] [PubMed] [Green Version]
- Jirka, S.; Bröring, A.; Stasch, C. Applying OGC Sensor Web Enablement to risk monitoring and disaster management. In Proceedings of the GSDI 11 World Conference, Rotterdam, The Netherlands, 15–19 June 2009. [Google Scholar]
- Broring, A.; Stasch, C.; Echterhoff, J. OGC Sensor Observation Service Interface Standard (Version 2.0). In OGC Document; Available online: http://www.opengis.net/doc/IS/SOS/2.0 (accessed on 15 August 2018).
- Michener, W.K.; Brunt, J.W.; Helly, J.J.; Kirchner, T.B.; Stafford, S.G. Nongeospatial metadata for the ecological sciences. Ecol. Appl. 1997, 7, 330–342. [Google Scholar]
- Compton, M.; Barnaghi, P.; Bermudez, L.; Garcıa-Castro, R.; Corcho, O.; Cox, S.; Graybeal, J.; Hauswirth, M.; Henson, C.; Herzog, A.; et al. The SSN Ontology of the W3C Semantic Sensor Network Incubator Group. J. Web Semant. 2012, 17, 25–32. [Google Scholar] [CrossRef] [Green Version]
- Compton, M.; Henson, C.; Lefort, L.; Neuhaus, H.; Sheth, A. A survey of the semantic specification of sensors. In Proceedings of the 2nd International Semantic Sensor Networks Workshop, Aachen, Germany, 26 October 2009. [Google Scholar]
- Janowicz, K.; Schade, S.; Bröring, A.; Keßler, C.; Maué, P.; Stasch, C. Semantic Enablement for Spatial Data Infrastructures. Trans. GIS 2010, 14, 111–129. [Google Scholar] [CrossRef]
- Henson, C.A.; Pschorr, J.; Sheth, A.P.; Thirunarayan, K. SemSOS: Semantic sensor Observation Service. In Proceedings of the 2009 International Symposium on Collaborative Technologies and Systems, Baltimore, MD, USA, 18–22 May 2009. [Google Scholar]
- Vitolo, C.; Elkhatib, Y.; Reusser, D.; Macleod, C.; Buytaert, W. Web technologies for environmental Big Data. Environ. Model. Softw. 2015, 63, 185–198. [Google Scholar] [CrossRef] [Green Version]
- Huang, C.Y.; Liang, S.H. A Sensor Data Mediator Bridging the OGC Sensor Observation Service (SOS) and the OASIS Open Data Protocol (OData). In The 12th International Symposium on Web and Wireless Geographical Information System; Lecture Notes in Computer Science; Springer: Banff, AB, Canada, 2013; Volume 7820. [Google Scholar]
- Nešić, S.; Rizzoli, A.E.; Athanasiadis, I.N. Towards a Semantically Unified Environmental Information Space. In Proceedings of the 9th IFIP WG 5.11, International Symposium on Environmental Software Systems—ISESS 2011, Brno, Czech Republic, 27–29 June 2011; Springer: Brno, Czech Republic, 2011; Volume 359/2011. [Google Scholar]
- Horsburgh, J.S.; Tarboton, D.G.; Maidment, D.R.; Zaslavsky, I. Components of an environmental observatory information system. Comput. Geosci. 2011, 37, 207–218. [Google Scholar] [CrossRef]
- Moßgraber, J.; Hilbring, D. Automating the web publishing process of environmental data by using semantic annotations. In Proceedings of the 1st International Workshop on Environnmental Multimedia Retrieval Co-Located with ACM International Conference on Multimedia Retrieval, EMR@ICMR 2014, Glasgow, UK, 1 April 2014; pp. 1–6. [Google Scholar]
- Yu, L.; Liu, Y. Using Linked Data in a Heterogeneous Sensor Web: Challenges, Experiments and Lessons Learned. Int. J. Digit. Earth 2015, 8, 17–37. [Google Scholar] [CrossRef]
- Yu, L.; Liu, Y.; Lee, J. SSTDE: An Open Source Semantic Spatiotemporal Data Engine for Sensor Web. In Proceedings of the First ACM SIGSPATIAL Workshop on Sensor Web Enablement, Redondo Beach, CA, USA, 6 November 2012; ACM: New York, NY, USA, 2012; pp. 9–16. [Google Scholar] [CrossRef]
- Chaudhuri, S.; Dayal, U. An Overview of Data Warehousing and OLAP Technology. SIGMOD Rec. 1997, 26, 65–74. [Google Scholar] [CrossRef]
- Horner, J.; Song, I.Y.; Chen, P.P. An Analysis of Additivity in OLAP Systems. In Proceedings of the 7th ACM International Workshop on Data Warehousing and OLAP, Washington, DC, USA, 12–13 November 2004; ACM: New York, NY, USA, 2004; pp. 83–91. [Google Scholar] [CrossRef]
- Aggarwal, C.; Han, J. (Eds.) Frequent Pattern Mining; Springer: Berlin, Germany, 2014. [Google Scholar]
- Trafalis, T.B.; Alwazzi, S.A. Support vector regression with noisy data: A second order cone programming approach. Int. J. Gen. Syst. 2007, 36, 237–250. [Google Scholar] [CrossRef]
- Laurent, A.; Lesot, M.; Rifqi, M. GRAANK: Exploiting Rank Correlations for Extracting Gradual Itemsets. In International Conference on Flexible Query Answering Systems; Andreasen, T., Yager, R.R., Bulskov, H., Christiansen, H., Larsen, H.L., Eds.; Springer: Berlin, Germany, 2009; Volume 5822, pp. 382–393. [Google Scholar]
- Hajj-Hassan, H.; Arnaud, N.; Drapeau, L.; Laurent, A.; Lobry, O.; Khater, C. Integrating Sensor Data Using Sensor Observation Service: Towards a Methodology for the O-Life Observatory. Sens. Transducers J. 2015, 194, 99–105. [Google Scholar]
Figure 1.
The Sensor Observation Service (SOS) modeling.
Figure 2.
Complete process.

Figure 3.
The O&M standard UML model.

Figure 4.
The Semantic Sensor Network (SSN) ontology.
Figure 5.
Running example: mapping on the geographic area.

Figure 6.
Running example: mapping on the species.
Figure 7.
Running example: UML mapping on the geographic area.
Figure 8.
Running example: UML mapping on the species.
Figure 9.
Alternative feature of interest.

Figure 10.
Running example: SSN mapping on the species.
Figure 11.
Running example: SSN mapping on the geographic area.
Figure 12.
Running example: Multi-mapping.
Figure 13.
Running example.
Figure 14.
The 52 North SOS schema.
Figure 15.
Points of view in the catalog.
Figure 16.
General architecture of the Information System (IS).

Figure 17.
Snow station.
Figure 18.
Intra-base data crossing (snow).

Figure 19.
Map showing the location of the snow and wells’ water level measurement stations.
Figure 20.
Comparison of snow depth and wells’ water level measurements.

Table 1.
Extending and refining properties.
| Description | Proposed Property |
|---|---|
| Alternative Observation | mssn:AltObservationDesign |
| Alternative Feature of Interest | mssn:altFeatureOfInterest |
| Alternative Observed Property | mssn:altObservedProperty |
| Alternative Observed By | mssn:altObservedBy |
© 2018 by the authors. Licensee MDPI, Basel, Switzerland. This article is an open access article distributed under the terms and conditions of the Creative Commons Attribution (CC BY) license (http://creativecommons.org/licenses/by/4.0/).
Share and Cite
MDPI and ACS Style
Hajj-Hassan, H.; Laurent, A.; Martin, A. Exploiting Inter- and Intra-Base Crossing with Multi-Mappings: Application to Environmental Data. Big Data Cogn. Comput. 2018, 2, 25. https://doi.org/10.3390/bdcc2030025
AMA Style
Hajj-Hassan H, Laurent A, Martin A. Exploiting Inter- and Intra-Base Crossing with Multi-Mappings: Application to Environmental Data. Big Data and Cognitive Computing. 2018; 2(3):25. https://doi.org/10.3390/bdcc2030025
Chicago/Turabian StyleHajj-Hassan, Hicham, Anne Laurent, and Arnaud Martin. 2018. "Exploiting Inter- and Intra-Base Crossing with Multi-Mappings: Application to Environmental Data" Big Data and Cognitive Computing 2, no. 3: 25. https://doi.org/10.3390/bdcc2030025