1. Introduction
Data driven approaches have become a crucial part in most of the scientific fields, as well as within the business, social sciences, humanities and the financial sectors. Given that data are continuously created via human activity, financial transactions, sensor information, the ability to identify actionable insights and useful trends has become a priority for many organisations [
1].
Big Data research mainly focuses on four main properties, although in a different context a higher number of such properties are considered [
2]:
Volume: The amount of data produced daily is enormous. The combination of real-time and historical data provides a wealth of information to identify the appropriate and best decision process.
Velocity: Real-time data raise numerous challenges as suitable processing power must be allocated to allow an efficient assessment within specific time constraints. However, depending on the sources, type and dynamics of such data, various techniques need to be implemented to provide sufficient efficiency.
Variety: Data consist of various types, structures, and format. For example, information is collected from audio or video sources, as well as from sensors and textual sources, to name but a few. This diversity requires suitable tools and techniques that can be applied to efficiently deal with the different data types.
Veracity: Data are likely to contain contradictory and erroneous information, which could jeopardise the whole process of acquisition, assessment, and management of information.
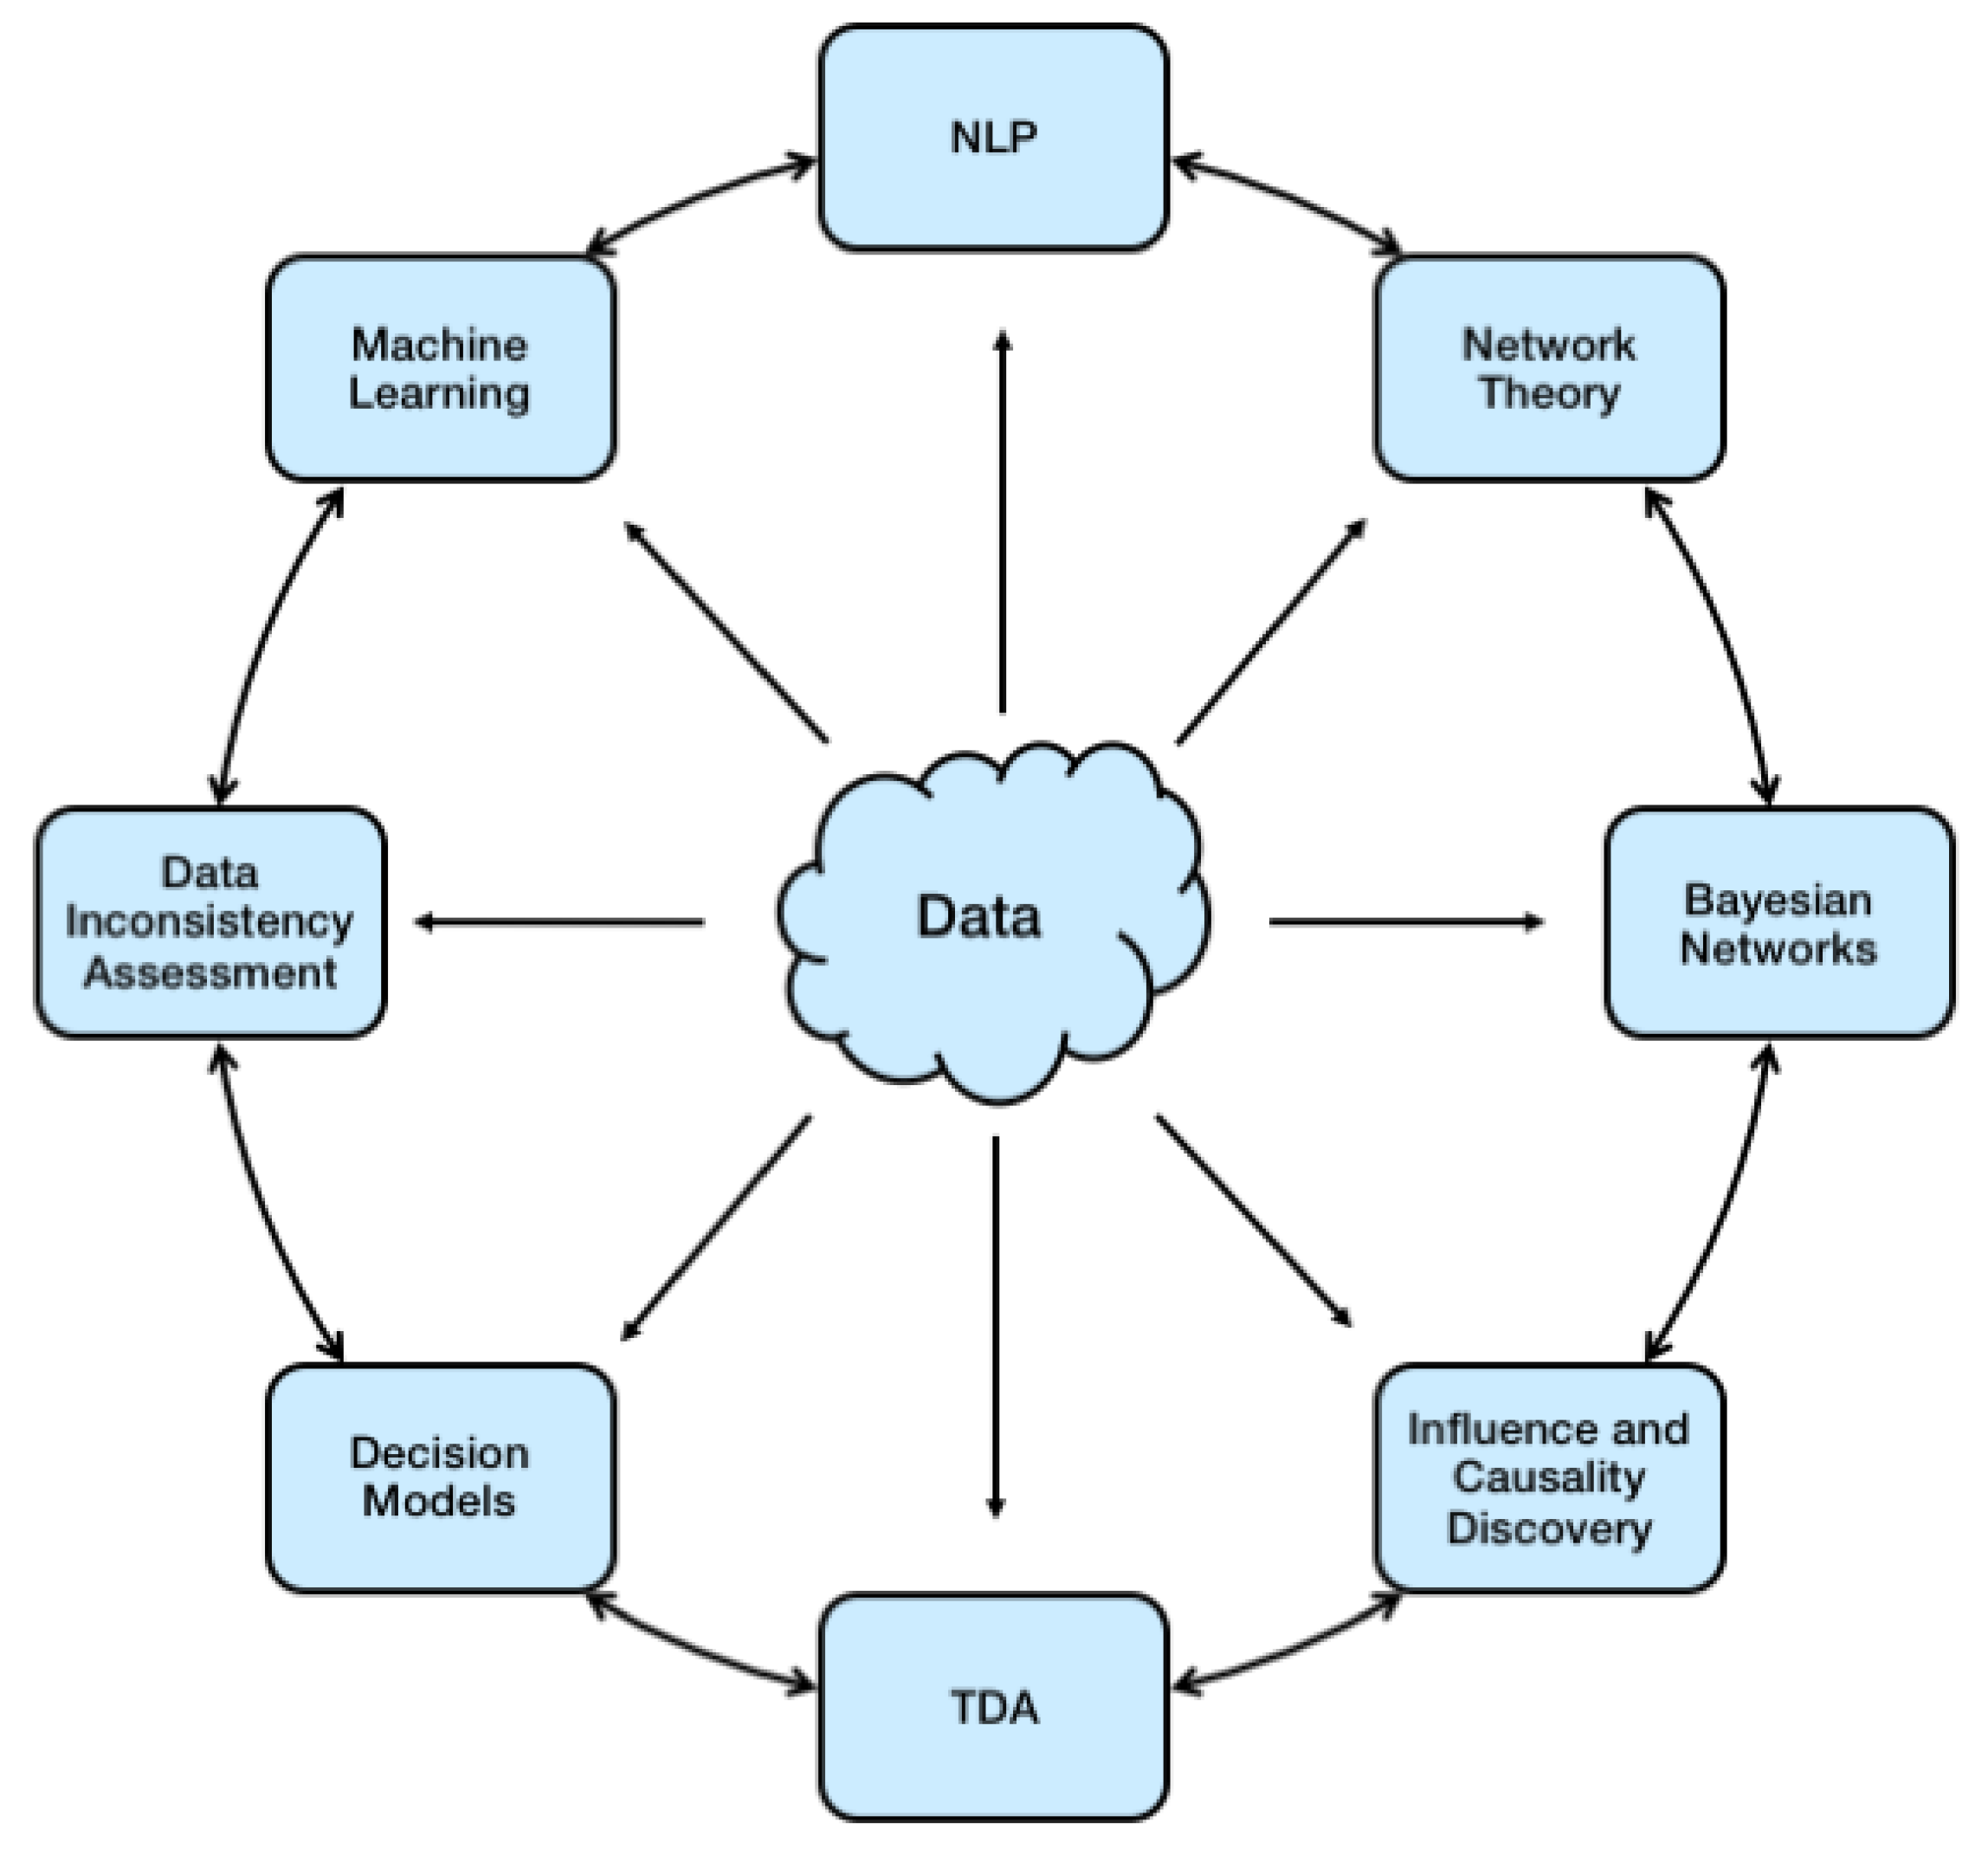
Decision Models have been developed based on various techniques and methods, which share numerous inter-dependencies. This article aims to provide a survey of some specific approaches, techniques and methods in Big Data, as depicted in
Figure 1, with particular emphasis on automated decision support and modelling. In particular,
Section 2 and
Section 3 discuss Machine Learning techniques (with emphasis on Natural Language Processing) and Network Theory within Big Data.
Section 4 provides an overview of Bayesian Networks with specific application to data analysis, assessment and extraction.
Section 5 focuses on the identification of data inconsistencies and general approaches to address this challenge. Finally,
Section 6 concludes the article.
2. Machine Learning for Decision Modelling in Big Data
The driving force behind Machine Learning in Big Data is its ability to perform intelligent automation. Furthermore, it facilitates the discovery of hidden patterns, market trends and customer preferences in a fraction of the time and with increased accuracy over a human counterpart, or traditional data analytics model. To apply Machine Learning techniques to Big Data processing, it is important to understand the strengths and weakness of the various methods to ensure the most appropriate approach is employed to solve the specific problem. Broadly speaking, there are three main approaches: Supervised Learning, Unsupervised Learning and Reinforcement Learning. Each group has its own unique strengths and weakness creating no ideal single solution. Machine learning techniques can be used in conjunction with traditional methods to enhance Big data analytics.
The Supervised Learning methodology is the most common form of Machine Learning, which aims to solve a target variable [
3]. This outcome variable is reached from a given set of predictors or inputs (independent variables). Using these set of variables, a function is generated, which maps inputs to desired outputs. The process requires a quality set of training data that allows correlation to be drawn between inputs and the desired output. The training process continues until the model achieves the desired level of accuracy on the training data, then unseen data can be given to the model and accuracy can be measured of the built system. Popular Supervised Learning methodologies include Support Vector Machines, Linear and Logistic Regression, Naïve Bayes, Decision Tree, Random Forest, and K-Nearest Neighbour (KNN) [
3].
The Unsupervised Learning methodology requires no target variable and is generally utilised when a series of unlabelled data is to be analysed. The most common purpose for Unsupervised Learning comes from its ability to cluster or group unlabelled data and discover hidden structures from a dataset. Examples of Unsupervised Learning include
means for clustering and
a priori for rule or association discovery [
3].
The Semi-Supervised Learning methodology is a combination of both Supervised and Unsupervised Learning, which addresses problems that contain both labelled and unlabelled data. Many real-world problems fall into this area as it can be expensive to utilise experts in a particular area to label an entire dataset. Unsupervised Learning discovers the data structure and the Supervised Learning creates best guess predictions for the unlabelled data [
4]. An example of implementation of Semi-Supervised Learning is the Python VADER sentiment analysis tool, which assesses the sentiment polarity of each word from social media platforms [
5].
The Reinforcement Learning methodology is also widely used, and it utlises complex algorithms to take actions based on its current state. It then reevaluates the outcome to again make a decision based on its new condition. The machine is trained to assess different scenarios, including make specific decisions in a training environment. This allows a trial and error approach until the most appropriate options is identified. Popular reinforcement Learning methods include: Markov Decision Process and a neural network based NEAT (Evolving Neural Networks through Augmenting Topologies) [
6].
The ability to produce intelligent analytics makes Machine Learning well suited to address various challenges in Big Data. In fact, Machine Learning is not restricted to one data type and its highly versatile analytical process can lead to rapid decision-making assessments and processes.
2.1. Natural Language Processing in Big Data
An important research area within Machine Learning is Natural Language Processing (NLP). NLP has drawn increasing interest within the Big Data community, especially when designing systems to facilitate the decision-making process [
7]. In fact, decision modellers often utilise textual sources to identify relevant information when building suitable models. However, this is very time consuming, as only a limited amount of information can be processed manually. Consequently, various NLP approaches have been introduced to bridge efficiency and large data processing [
8]. More specifically, it consists of a range of computational techniques for assessing and extracting knowledge from textual sources, via linguistic analysis for a range of tasks or applications. Its goal is to extend its methods to incorporate any language, mode or genre used by humans to interact with one another to achieve a better understanding of the information patterns that emerge in human communication. NLP was originally referred to as Natural Language Understanding (NLU) and even though the ultimate target of NLP is “true” NLU, there is still much research required to achieve that. In fact, the ability to logically infer conclusions from textual sources is still being developed and improved to incorporate the richness of language in terms of imprecise knowledge, causality and ambiguous meaning.
2.1.1. Lexical and Semantic Analysis
The most basic level in a NLP system is based on lexical analysis, which deals with words regarded as the atomic structure of text documents. In particular, it is the process which takes place when the basic components of a text are analysed and grouped into tokens, which are sequences of characters with a collective meaning. In other words, lexical analysis facilitates the interpretation of individual words, which can refer to more than one concept, based on the context in which they occur. As a result, the use of simplified lexical representations unifies the meaning across words to generate complex interpretations at a higher meta-level [
9]. Lexical analysis may require a lexicon, which usually consists of the particular approach used in a suitably defined NLP system, as well as the nature and extent of information inherent to the lexicon. Mainly, lexicons may vary in terms of their complexity as they can contain information on the semantic information related to a word. Moreover, accurate and comprehensive sub-categorisation lexicons are extremely important for the development of parsing technology as well as vital for any NLP application which rely on the structure of information related to predicate–argument structure. More research is currently being carried out to provide better tools in analysing words in semantic contexts [
9].
More specifically, lexical analysis consists of various tasks, which include:
Lemmatisation, which collects inflected forms of a word into a single item corresponding to its lemma (or dictionary form)
Part-of-speech tagging, which aims to identify the syntactic role of each word
Parsing, which is the process to grammatically analyse a sentence, where the contribution of each word is considered as a whole, with the corresponding hierarchy
Semantic analysis deals with a higher meta-level with respect to the objects associated with a lexicon. In fact, semantic processing determines the possible meanings, by investigating the interactions among word-level meanings in the sentence. This approach can also incorporate the semantic disambiguation of words with multiple senses, which determines the sense of ambiguous words so that they can be included in the appropriate semantic representation of the sentence. This is particularly relevant in any information retrieval and processing system based on ambiguous and partially known knowledge. Extremely useful applications in NLP can be seen in inferencing techniques where extra information derived from a wider context successfully addresses statistical properties, between concepts within textual sources.
2.1.2. Machine Learning Approaches to NLP
To perform text classification in NLP, various analysis methods based on Machine Learning are available, which include Linear Discriminate analysis (LDA) and Quadratic discriminant analysis (QDA). These are the two fundamental classifiers used commonly as a dimensionality reduction technique, which has been adapted for use in Machine Learning [
4]. The two methods estimate the class priors, the class means and the covariance matrices. However, in QDA, no assumptions are made on the covariance, which leads to the quadratic decision boundary.
These classifiers have been shown to have ease of computation and multi-class form. Furthermore, they require no hyper-parameters tuning, thus reducing the complexity of any implementation. The reduced complexity can also increase overall performance allowing for a more real-time result to be displayed to the user. During the LDA process, for each class, the mean and variance are calculated for any variable to be used. If multiple variables are needed, then the mean and variance are calculated over the multivariate Gaussian. These values are used to form the LDA model, based on the assumption that the data follow a Gaussian curve, and that each attribute has the same variance [
10]. Whilst LDA is commonly used to produce decision boundaries, it is possible to utilise the same algorithm for supervised dimensionality reduction.
2.2. Information Extraction via NLP Techniques within Big Data
One of the most investigated data types in Big Data includes those without a well defined structure, i.e. unstructured. Textual data fall into this category, and NLP techniques allow the identification and assessment of relevant information between concepts embedded in textual data sources [
11].
In the identification of relations between concepts, which is the crucial step in any decision-making and information extraction processes, the primary aim is the selection of the appropriate concepts and the type of relations linking them. For example, similar concepts (e.g., “disease” and “illness”), or those at different lexical levels, need to be suitably analysed and selected to provide the appropriate amount of information. Furthermore, contradictory information is often present in large textual datasets, as it is common to find opposite relationships related to the same context [
7].
To achieve this, various approaches can be used including statistically based methods, which focus on frequency, co-occurrence and other measures to assess the overall behaviour of the information embedded in texts. Another widely utilised approach focuses in the grammatical and syntactic roles of the different components of each textual fragment. In [
12], the authors use a grammar based technique to identify influence relationships between concepts by considering the triples
(NP1, VB, NP2) where
One aspect of NLP, which has been extensively investigated, focuses on sentiment analysis, which aims to detect “opinions” or
polarity from textual data sources [
13]. This can be particularly useful in supporting the specific information extracted. In fact, if the overall opinion related to a specific context is “positive”, then it may suggest that the corresponding information is discussed in positive terms [
14]. As discussed in the next sections, the concepts and mutual relationships naturally create a network structure, whose investigation can provide useful tools to investigate the overall modelling system.
3. Network Theory
Network theory has become increasingly popular in numerous research fields, including mathematics, computer science, biology, and the social sciences [
15,
16,
17]. In particular, the ability to model complex and evolving systems has enabled its applicability to decision-making approaches and knowledge discovery systems. The aim of this section is to provide a general overview of some properties relevant to Decision Models, rather than an in-depth discussion. Refer to [
17] for an exhaustive analysis of Network Theory.
Networks are defined as sets of nodes
, which are connected as specified by the edge-set
[
18]. Real-world networks are utilised to model complex systems, which often consist of numerous components. Therefore, the resulting complexity can lead to models that are computationally demanding. To balance accuracy with efficiency, in [
12,
19,
20], the authors proposed a method, based on data and text mining techniques, to determine and assess the optimal topological reduction approximating specific real-world datasets. In [
21], the topological properties of such networks are further analysed to identify the connecting paths, which are sequences of adjacent edges. This approach enables the identification of the mutual influences of any two concepts corresponding to specific nodes.
The importance of such process is that it firstly allows the identification of a topological structure which can give an insight into the corresponding datasets. Secondly, it is possible to extract information on the system modelled by such network that can be used to determine relevant intelligence.
The algorithms utilised for the reduced network topology extraction process are introduced, and the reader can refer to that article for further details. Furthermore, these algorithms also allow the identification of the long-tail distribution in the case of scale-free networks, resulting in a more accurate and relevant extraction [
12,
20].
Random networks are defined by probabilistic processes, which govern their overall topology, and the existence of any edge is based on a probability
p. Such networks have been extensively investigated, and several associated properties have been identified depending on their theoretical, or applied context. More specifically, the fraction
of nodes with degree
k is characterised by the following equation
where
[
18].
When random networks are used to model real-world scenarios, the relationships among the nodes are purely random. In such cases of the edge connecting nodes, the relationships captured by the edges are unlikely to be associated with meaningful influence. In fact, if a random network is associated to a purely randomised system, then the relations between nodes do not follow a specific law [
21].
Scale-free networks appear in a numerous contexts, including the World Wide Web links, biological and social networks [
18], and the continuous enhancement of data analysis tools is leading to the identification of more examples of such networks.
These are characterised by a node degree distribution, which follows a power law. In particular, for large values of
k, the fraction
of nodes in the network having degree
k, is defined as
where
has been empirically shown to be typically in the range
[
18].
A consequence of Equation (
1), is the likelihood of the existence of highly connected hubs, which suggests that in scale-free networks the way information spreads across them tends to exhibit a preferential behaviour [
18].
Another important property is when new nodes are created, these are likely to be connected to existing nodes that are already well linked. Furthermore, since the connectivity of nodes follows a distribution which is not purely random, networks that are topologically reduced to scale-free structures are likely to capture influence relations between the corresponding nodes, and their dynamics provides to predictive capabilities related to their evolution.
3.1. Topological Data Analysis
Topological Data Analysis (TDA) is an emerging research area, which combines methods from network theory with topology to classify and analyse complex data [
22]. The aim of TDA is the assessment of the structure of the corresponding data, defined by the connectivity of its components. In particular, invariant features of a data-space, i.e. general properties that do not change, play a crucial role in their classification. In fact, in several clustering and classification methods, invariant properties of objects provide valuable tools, as different types of data connectivity can be utilised to group similar data clusters together. Two elastic bands might have different dimensions, yet they are still considered similar due to their “hole”. This is captured by the concept of
persistent homology, which focuses on the identification of the topological properties which remain invariant [
23].
One of the building bricks of persistent topology is simplicial complexes, which are space triangulations defined by combined, non-overlapping polyhedra, covering a topological space. These include Voronoi diagrams, Delaunay triangulations, Vietoris and Čech complexes (see [
23] for more details). An approximation of an image by a suitable pixellation, aiming to provide an accurate representation, is an example of space triangulation. In fact, one of the most important aspects of simplicial complexes is that fact that they provide an “approximation” of the corresponding objects. Several TDA implementations for different needs and contexts have been shown to produce good results. For an overview, refer to [
14].
Implementation of Topological Data Analysis Algorithms
As discussed above, persistent homology is an algebraic method to investigate topological properties of specific objects, by defining suitable triangulations (simplicial complex) are defined in terms of a specific metric of the underlying space [
24,
25]. A specific implementation is the Python library Dionysus, which has numerous algorithms to analyse different data objects and types. Even though Dionysus is a Python interpreter, it is computationally efficient and it provides an accurate data representation [
26].
Manifold Learning is an algorithm, which visualises data of high dimensionality by identifying specific low dimensional manifold properties and parameters. Python library Scikit-Learn [
27] contains various method to facilitate this type of analysis, such as Locally Linear Embedding, Modified Locally Linear embedding, Spectral Embedding, Local Tangent Space alignment and
distributed Stochastic Neighbour Embedding, which allow efficient and accurate data analysis.
More specifically, Mapper is a widely used algorithm [
28] with Python Mapper as a very successful Python implementation [
29,
30]. In particular, it utilises filter functions to assess and analyse dataset by applying dimensionality reduction [
22], where data points are linked via specifically identified clusters, which provides a topological data summary [
31].
Since the Dionysus and Mapper algorithms are based on the point cloud properties of datasets, the data are to be embedded onto a specific co-ordinate system. Furthermore, Mapper allows the analysis of two-dimensional and one-dimensional datasets, which enables a more efficient method for data analysis.
However, the Dionysus library has some limitations in the construction of an alpha shape filtration [
32], which makes Mapper algorithm and Python Mapper solutions more suitable compared to to the Dionysius library.
The Manifold Learning algorithms contained within the Scikit-Learn package require the embedding of the data onto a low dimensional sub-manifold, as opposed to the Mapper algorithm. Furthermore, the corresponding dataset must be locally uniform and smooth. However, the Mapper algorithm output is not intended to faithfully reconstruct the data or reform the data to suit a data model, as it provides a representation of the data structure.
The Manifold learning and Mapper solutions provide a useful set of data analysis tools, which enable a suitable representation of data structures and they can be selected once the structure of the corresponding dataset has been identified. Since both libraries are native to the Python programming language, this allows an integration with other popular data science Python packages.
The Mapper algorithm has been extensively utilised for commercial data applications, due to its capability of analysing large datasets containing over 500,000 features. This also allows the analysis of Big Data without deploying Hadoop, map reduce and SQL database, which provides further flexibility and reliability.
4. Bayesian Networks in Big Data
Bayesian Networks (BNs) [
33,
34] are very powerful tools with a wide range of applications with particular emphasis on cause and effect modelling in a variety of domains. Loosely speaking, their main characteristic is the ability of capturing the probabilistic relationship between variables, as well as historical information about their relationships. More formally, Bayesian networks are directed acyclic graphs such that their nodes represent Bayesian random variables or, in other words, they are associated with observable quantities, unknown parameters, hypotheses, etc. Nodes that are conditionally dependent are joined by an edge. BNs have proven to be very successful when a scenario defined by prior knowledge and uncertain or partially known data. Moreover, such networks also offer consistent semantic tools to described causes and effects via an intuitive graphical representation. We discuss this in
Section 4.2.
Our knowledge and representation of the world is usually based on unknown parameters from uncertainty of a priori knowledge and partial or total lack of certainty of a particular scenario. BNs provide a tool to model uncertainty and an intuitive graphical representation of the interactions between various events, generating a powerful method of modelling cause and effect scenarios. In fact, a BN represents the possible states of a defined domain containing probabilistic relationships among some of the states. Conditional probability tables describe the likelihood of any node in the Bayesian network being in one state or another without current evidence and in particular they depend on the causality relationships between some nodes often described by prior information on such networks.
4.1. The Bayes’ Rule
Bayesian networks are based on the
Bayes’ rule [
33,
34]:
where
and
are the probability of
a and
b, respectively, and
is the probability of
a given that
b has occurred. Equation (
2) can be also expressed in more general terms by considering a hypothesis
H updated by additional evidence
E and past experience
c [
34]. More specifically,
where the above terms are referred to as follows:
is defined as the posterior probability of H based on the effect of the evidence E.
is the a priori probability of H based on c.
is the probability of the evidence E following the assumption that the hypothesis H and c are true.
Finally is independent of H and is often defined as a normalising or scaling factor.
Automated NLP understanding systems rely on several data sources which are often partially or very little known, resulting in problematic tasks as the integration of disambiguation and consequently the use of probabilistic tools has proved to be very challenging. In fact, even though such knowledge sources are well known to be probabilistic with well defined models of some specific linguistic levels, the combination of the probabilistic knowledge sources is still little understood [
35]. Bayesian networks applications to NLP have clear advantages. In particular, they allow the evaluation of the impact of different independence assumptions in a uniform framework, as well as the possibility of modelling the behaviour of highly structured linguistic knowledge sources [
33].
The ambiguity of the syntax and semantics within natural language makes the development of rule-based approaches very challenging to address even very limited domains of text. This has led to probabilistic approaches where models of natural language are learnt from large text sets. A probabilistic model of a natural language subtask consists of a set of random values with certain probabilities, associated with lexical, syntactic, semantic, and discourse features [
34] and the use of Bayesian networks applied to multiple natural language processing subtasks in a single model supports inferencing mechanisms which improve simple classification techniques [
36].
4.2. Influence and Causality Discovery
Influence and causality between concepts are an important aspect in any approach to optimise information extraction to facilitate decision modelling. The main difference between them is often semantic, as the sentence “
chemotherapy influences an improved outlook of certain types of breast cancer” is profoundly different from “
chemotherapy causes an improved outlook of certain types of breast cancer”. In fact, causality is a much stronger statement based on stricter conditions compared to influence. Furthermore, the former implies the latter, but not the other way round [
34]. In other words, causality allows a more direct link between concepts, which enables a more conclusive and well-defined decisional approach [
37]. Furthermore, causality implies a direction (“
A causes B” is different from “
B causes A”), and it is often characterised by semantic unambiguity.
On the other hand, influence between two or more concepts may not be tied to a direction, or a well-defined, unambiguous semantic definition. There is extensive research on the automated extraction of causal relations between concepts, such as events, entities, factual data, etc. [
38]. In many contexts, influence between two objects is based on their mutual co-occurrence. When analysing large amounts of data, the co-occurrence of two or more elements can facilitate the extraction of specific insights. For example, this can allow large datasets to be topologically reduced to determine whether the data follow a scale-free or a purely random structure [
12]. However, co-occurrence does not necessarily implies any influence, since the mutual existence of two concepts might not be associated with any relation between them.
The network structure provided via semantic analysis in NLP provides a tool for modelling stochastic processes within complex systems. In [
39], some properties of semantic networks are demonstrated to have important applications to the processes of semantic growth. Such properties are based on on statistical properties linked to theoretical properties of the associated semantic networks. Furthermore, such networks exhibit small-world structures characterised by highly clustered neighbourhoods and a short average path length [
17]. Such networks also show a scale-free organisation [
18] defined by a relatively small number of well-connected nodes, with the distribution of node connectivities, which is governed by a power function.
Causal inference plays a fundamental role in any question-answering technique and reasoning process with important Artificial Intelligence applications such as decision-making and diagnosis in BNs [
40,
41]. On the other hand, the investigation of the properties of BNs enables effective causal inference especially in complex domains [
42]. The conditional dependencies in a Bayesian Network are often based on known statistical and computational techniques and contain much information, which can be successfully analysed to extract causal relations [
8]. Often, any two concepts linked by paths in a network defined by the relationships extracted from text, can be complex to fully identify in terms of the corresponding influence (or causality) they may represent. This is usually due to either the topological structure of the network not fully being known, or partial knowledge of the structure of the paths between them. An important concept to understand the influence between two concepts is
causality discovery [
40], which aims to pinpoint the causal relationship between them when it is not explicitly defined. Typically, semantic similarity measurement plays a significant role in semantic and information retrieval in contexts where detection of conceptually close but not identical entities is essential. Similarity measurement is often carried out by comparing common and different features such as parts, attributes and functions. In [
43], a method based on adding thematic roles as an additional type of features to be compared, is introduced. Semantic distance is closely linked to causal relationship as it describes how closely two concepts are connected. However, much of the work on this topic is concerned about linguistic or semantic similarity of terms based on both the context and the lexicographic properties of words [
40]. One of the main setbacks of this approach is that a hierarchical structure of the concepts can lead to an oversimplification of the problem. The important question is not merely how far two concepts are, but
how much a concept is influential with respect to another one. The difference is subtle but crucial when dealing with causal discovery. Semantic distance can also be applied to information retrieval methods in order to improve automated assignment of indexing based descriptors, as well as to semantic vocabulary integration which enables to choose the closest related concepts while translating in and out of the multiple vocabularies.
4.3. Extraction of Bayesian Networks from Text
Usually BNs are analysed, defined and built out manually by expert modellers. However, this is clearly a very time-consuming process and only small amount of data sources can be analysed [
34]. To address this issues, there has been extensive research on the extraction of BNs from unstructured data, with particular emphasis to textual sources [
8]. However, this is a complex task due to the intrinsic ambiguity of natural language, as well as to the strict topological and probabilistic rules, which BNs need to obey. In particular, challenges associated with low recall and precision, as well as contradictory information, must be addressed to provide a reliable BN automated extraction tool.
In [
7], the authors introduced a method to extract and populate fragments of BNs from biomedical textual sources, defined on grammar and lexical properties, as well as on the topological features of the associated networks. More specifically, a text pattern approach was utilised to identify specific concepts and their mutual relations captured via text patterns. This was carried out by considering specific patterns to identify:
The noun phrases, i.e. phrases with a noun as the head word, containing biomedical concepts.
Any keyword or verb referring to probabilistic terms or causal/influence relations contained in an ontology, which is defined by the authors.
The modality of above keyword or verb, which indicated whether the existence of a probabilistic relationship is supported.
Finally, the tense of the verb, which can be either active or passive. If it cannot be determined, then it is defined as unknown.
Consider, for example, the following two statements: “smoking causes lung cancer”, and “there is no proven direct dependency between antidepressants and liver damage”. In the former, “smoking” and “lung cancer” are linked by a direct (causal) relationship, whereas, in the latter, “antidepressants” and “liver damage” are not linked by any relation. Subsequently, the network generated by the concepts and relations extracted above, is analysed to identify its topological properties, which lead to the most appropriate BNs related to specific term-queries. In particular, the dynamical properties of the network are assessed to investigate the global behaviour of concepts and their mutual relations. For example, there are instances of biomedical concepts previously considered as independent, and subsequent research has suggested the opposite. Furthermore, depending on the data sources, claims can be substantiated or argued against. Therefore, it is crucial to consider this type of “information fluctuations” and assess the parameters influencing tis dynamics to identify the most accurate relation. The evaluation results demonstrates the potential of this approach, especially in providing valuable resources to BN modellers to facilitate the decision-making process.
5. Inconsistencies in Big Data Analysis
Data veracity is another crucial aspect of Decision Models, as well as Big Data and, as a consequence, there has been extensive investigation in the resolution of inconsistencies in data [
44]. Closely related to this is finding a way to organise data so that concepts having similar meaning are related through links, while concepts that are distinct from one another are also clearly represented [
45]. As discussed above, one of the important benefits in representing data through their relationships is that it will enable the classification and analysis of real-world networks and this will lead to a better understanding and prediction of the properties of the systems that are modelled by these networks [
21]. Furthermore, such links will allow more intelligent and effective processing by query engines and analytic tools.
As discussed in
Section 1, variety refers to different forms of structured and unstructured datasets that are collected for use. Data typically contain erroneous, contradictory and missing information, which potentially undermines the whole process of acquisition, assessment, and management of information.
Data inconsistencies could occur during the analysis and integration of data from the different sources, where each of them may represent the same information in a different way and they could potentially exist both at the data value level and the data format levels. In fact, in [
44], the authors found that inconsistencies exist at schema level, data representation level and data value level, which is regarded as a data analysis and integration problem. To provide effective information applications, organisations would typically require data from these multiple sources. However, analysing and integration of such data present their own challenges, with respect to the overall business context. For example, misinterpretation of data resulting from inconsistencies could potentially affect the overall business value. To extract meaningful links or create accurate and relevant information from structured and unstructured data consistently, it is expected that common conceptual model for integrated data should exist [
46]. More specifically, it is expected that data are stored in a consistent format in order to facilitate intelligent analytics. Moreover, the benefits of virtualised access to multiple data sources, inconsistent types and formats are enormous. To this extent, data formats must be consistent across the operational context to be acted upon. Therefore, tackling such issue is at the very core of Big Data science.
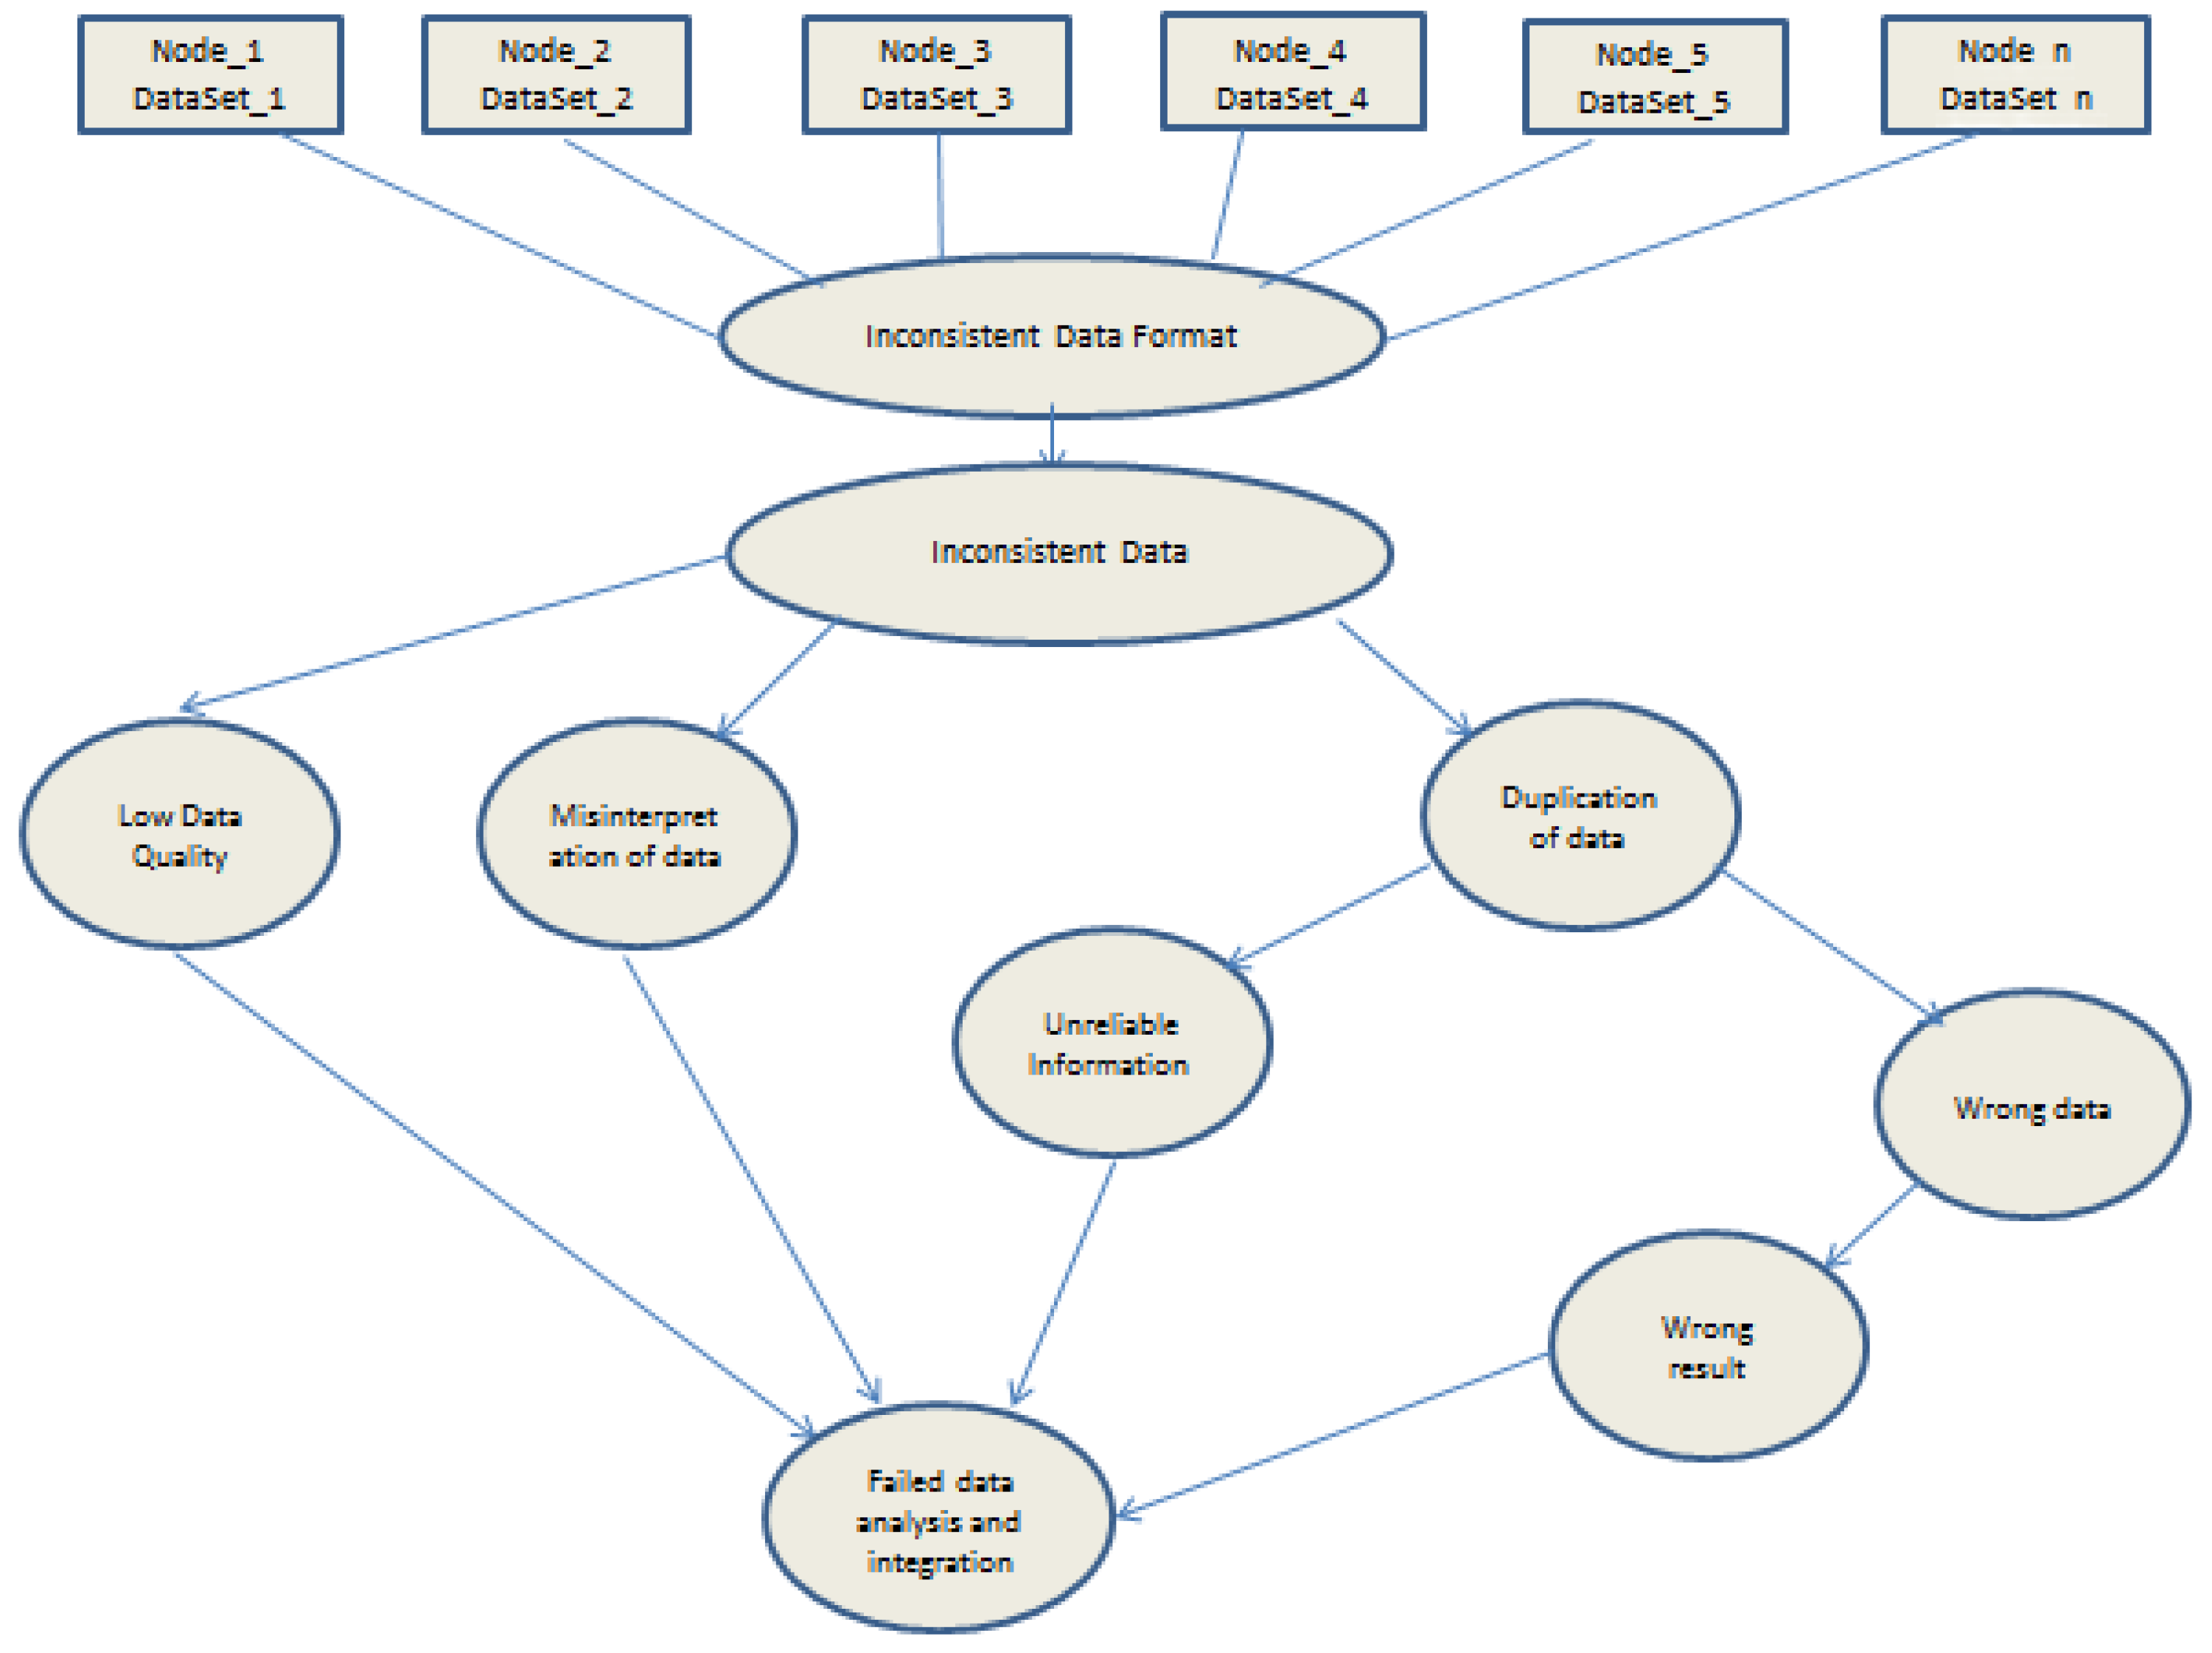
The risk map model depicted in
Figure 2 describes the events which characterises the risk of Big Data inconsistencies.
5.1. Dataset Inconsistencies
Many real world datasets contain instances of conflicts, inaccuracies and fuzzy duplicates at various levels. In some cases, datasets contain overlapping information, while, in other cases, they contain missing information about one or more entities. Moreover, some contain different representation of the same real world entity in the same datasets or different datasets. As discussed above, inconsistencies exist at schema level, data representation level and data value level [
44]. At the schema level, the presence of different schemas within the same data model gives rise to inconsistencies. This kind of data inconsistency is largely due to the heterogeneity nature of the sources of data. Schema inconsistency is also referred to as Structural Conflicts [
47]. For example, in an integration scenario where there is no one-to-one correspondence between the tuples of the relations that describes the same real world entity, these could have different numbers of attributes, a situation commonly referred to as outliers. At the data representation level, inconsistencies arise as a result of data expression that comes in different natural languages and data types as well as the measurement systems. For example, in currency, one source can contain currency expressed in USA dollars, whereas another one British pounds. More specifically, data value inconsistency exists when two objects obtained from different data sources are identified as representing the same real-world object and some of the values of their corresponding attributes differ. That is, the same real world entity can be represented in several ways. In [
48], the authors distinguished two kinds of data conflicts: uncertainty and contradictions. Uncertainty is a conflict between a non-null value and one or more null values that are all used to describe the same property of a real-world entity. Contradiction is a conflict between two or more different non-null values that are all used to describe the same property of the same entity. Intuitively, contradiction highlights discrepancies in the description of the same event. For example, “
Jane sold a car to John ” and “
John sold a car to Jane” are incompatible and highly unlikely to occur at the same time and, therefore, contradictory. Furthermore, uncertainty is caused by missing information such as null values or missing attributes, contradiction is caused by different sources providing different values for the same attribute of a real-world entity [
48]. All these gives rise to conflicting circumstances which present itself as data inconsistency problem in Big Data analysis and integration.
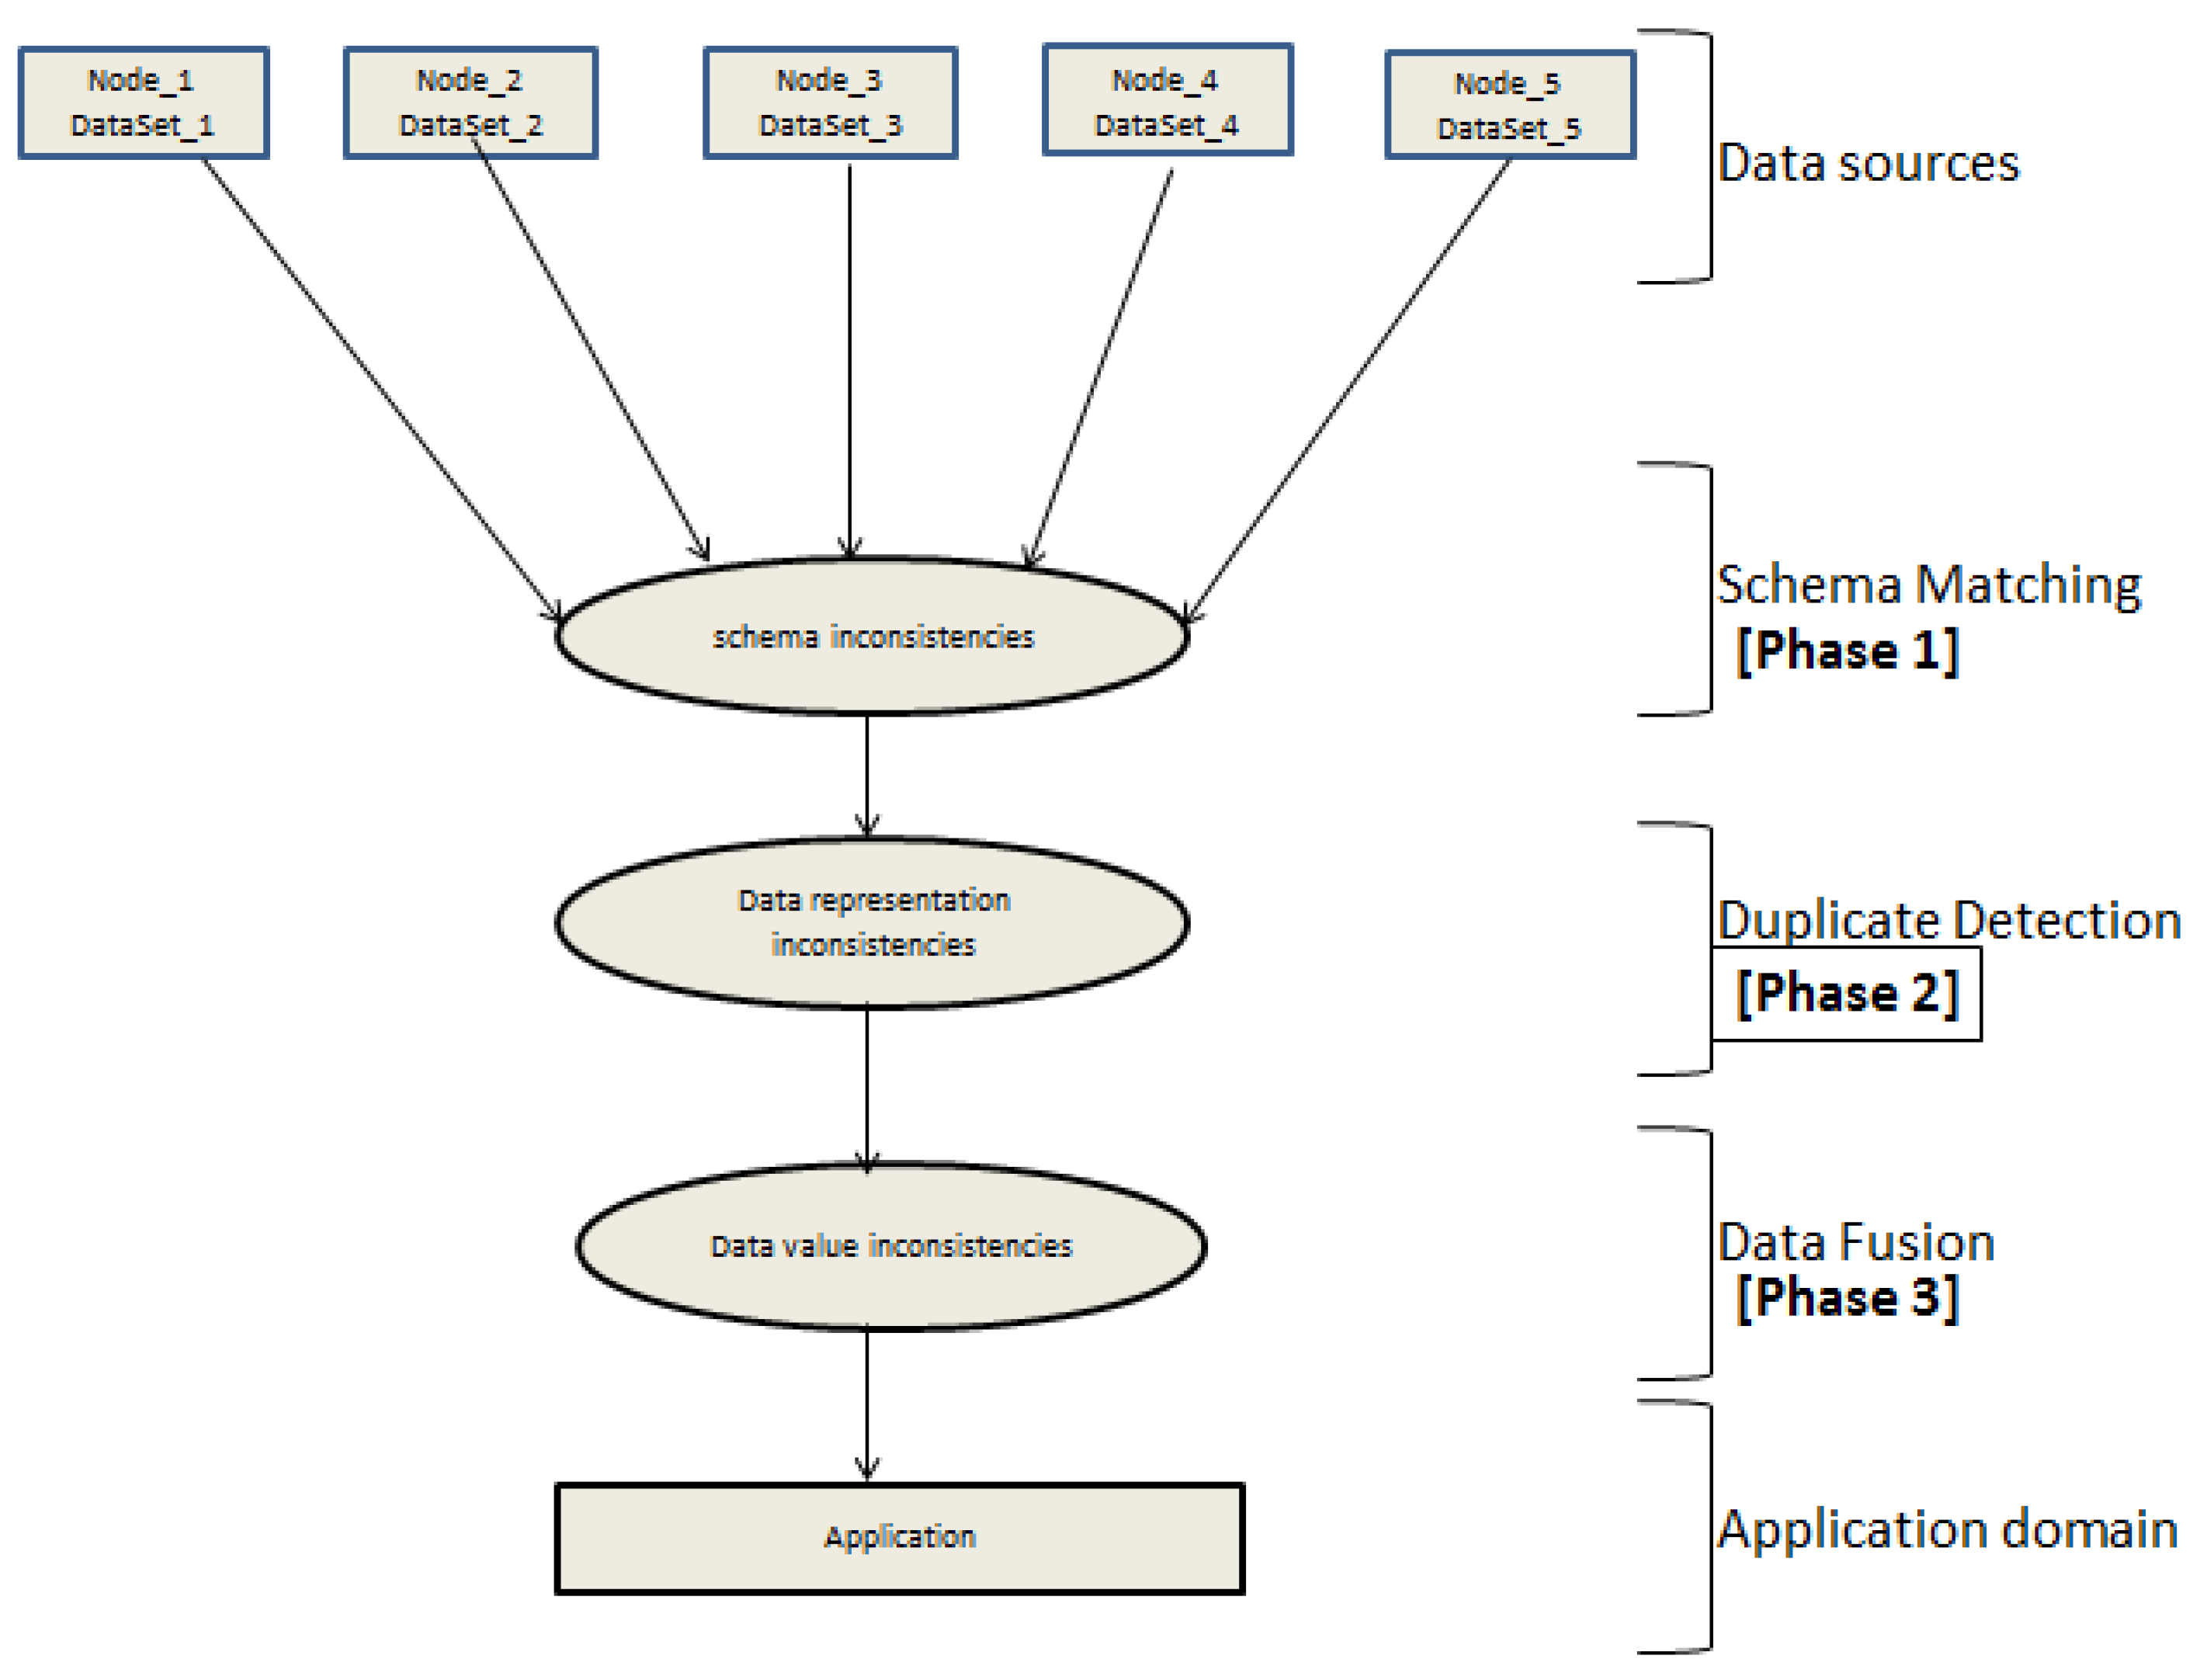
Figure 3 shows the architecture of the major phases in the integration and fusion of heterogeneous datasets and the inconsistency levels that are addressed.
The first phase is the schema matching where the schematic mapping between the contents of the respective data sources are done. This is basically the extraction phase in a typical Extract–Transform–Load (ETL) framework, where schema inconsistencies are identified and resolved. The second phase is the duplicate detection, where objects that refer to the same real world entities are identified and resolved. This is at the tuple level, which is the transform phase in the ETL process. The final phase is the fusing of data, which is the process that involves combining multiple records that represent the same real world object into a single, consistent state. This is the phase where the process performs attempts to resolves conflicts associated with the datasets. The identification of data value inconsistency is the final state. Therefore, such identification is only possible when both schema inconsistencies and data representation inconsistencies have been resolved. These kinds of inconsistencies are not universal; rather they are hidden and contextual.
5.2. Inconsistencies from Textual Sources
An unstructured dataset lacks defined characteristics and therefore lacks relations, which can convey the precise information about the content. An inconsistency in text occurs when there are conflicting instances of concepts in the same dataset or different datasets from textual sources; that is, whether two statements in a dataset refer to the same event or entity. This is known as co-reference, which is a necessary condition for text inconsistencies [
11]. Another condition is that they must involve the same event and embedded texts must be considered in this determination. This type of inconsistency affects the integrity of the dataset and can ultimately affect data analysis. For example, “
today is cloudy” would be perfectly fine and consistent. However, if we also had that “
today is very sunny” within the same datasets, this would add a level of inconsistency. In addition, assume we have the relation “MemberOF” as asymmetric property, therefore, the triples “John → MemberOF → ConservativeParty” and “ConservativeParty → MemberOF→ John” are in a state of inconsistency. Essentially, these are two instances that represent the same real-world entity. These kinds of inconsistency give rise to conflicting circumstances which present itself as data inconsistency problem in Big Data analysis and integration.
5.3. Temporal and Spatial Inconsistencies
Temporal inconsistencies arise when there is conflicting information between two time-series data. In this situation, some data items with reference to time can overlap or temporally coinciding in different datasets or in the same dataset. In particular, this type of inconsistency is crucial when specific inferences are drawn from elements in datasets, such as causality. Such inconsistencies could be partial or complete [
49]. Partial inconsistencies occur when the time intervals of two inconsistent events are partially overlapping while complete inconsistencies situation arises when time intervals of two inconsistent events coincide or satisfy containment.
Spatial inconsistencies arise when there are violations of spatial constraints in a dataset with geometrical properties and various spatial relations. For example, when a spatial object in a dataset is having multiple conflicting geometric locations, such inconsistencies can arise. Moreover, it can occur in a data integration project when multiple sources with special dimension are represented to the extent that the aggregation of the object violates some kind of unique constraints [
50].
Further inconsistencies could also arise from the aggregation of information from textual data sources. Moreover, unstructured text data may exhibit forms of properties that take a semantic and syntactic dimension pertaining to asymmetric, antonym, mismatched values and contradiction. Contradictions can occur in terms of data values, in terms of semantics and in terms of their structural representation [
47]. Therefore, semantics of the language is important in discussing the problem of text inconsistencies in datasets. Being able to construct semantic rules based on ontologies can be an important step in identifying conflicts and they enable the assessment and verification of the concepts, which are being considered. One of the most important questions in solving this problem is how to weigh the available information within a given dataset and find the best data value among the conflicting values in a dataset. Moreover, how to find the data value efficiently. Another important challenge when dealing with textual data is how to represent the content in order to apply appropriate statistical methods.
5.4. Discussion on Techniques and Implementations to Address Big Data Inconsistencies
Many approaches have been developed for addressing inconsistencies. In [
47], the authors categorised conflict resolution techniques into deciding strategies and the mediating strategies. The former identifies an option from the existing conflicts in datasets and assigns it as the decided final value, which depends on the data value or the metadata. The latter resolves conflicts by aggregation of values in datasets. This type of strategies selects results that are not necessarily among the existing conflicting values. One major deference between the two is that, in the case of deciding strategy, there is traceability to the lineage, while that is not the case with mediating strategy as data linage information is not attached to the aggregate value in datasets.
In [
51], conflict hypergraph is utilised as an approach for computing consistent query answers for projection-free queries and denial integrity constraints. Conflict hypergraph is a graphical representation of the inconsistent database in which nodes represent database facts and hyper edges represent minimal sets of facts that together give rise to a violation of the integrity constraints. The authors used a polynomial-time algorithm and a system called Hippo to implement the conflict hypergraph approach.
In [
52], an approach based on the notion of virtual attributes and partial values is introduced, which provides a general algebraic solution on data mismatch resolution. First, the approach maps conflicting attribute to common domains by means of a mechanism of virtual attributes and then apply a set of extended relational operations to the resulting values. When the mapping relationship is one to one, the conflict is resolved. However, when a one to one mapping of values in the domains cannot be established, the approach regard these sets of resulting attributes as partial values and it then applies the algebraic operation over the partial values to manipulate the incomplete information. This approach specifically addresses data scaling conflicts which occurs when semantically related attributes that are stored in different data sources use different unit of measurement. A potential drawback of [
52] is that, since tuples might be used as qualitative measures of uncertainty while processing queries over incompatible domains, it is possible that inconsistencies among common attributes could be ignored a situation. Furthermore, the identification of inconsistencies at the data value level would enable the identification of hidden inconsistencies, which might not be universal but rather contextual [
53]. In particular, when large datasets are analysed, the probability of generating inconsistencies, such as cycles or different probability evaluations representing the same real-world entity, increases almost exponentially.
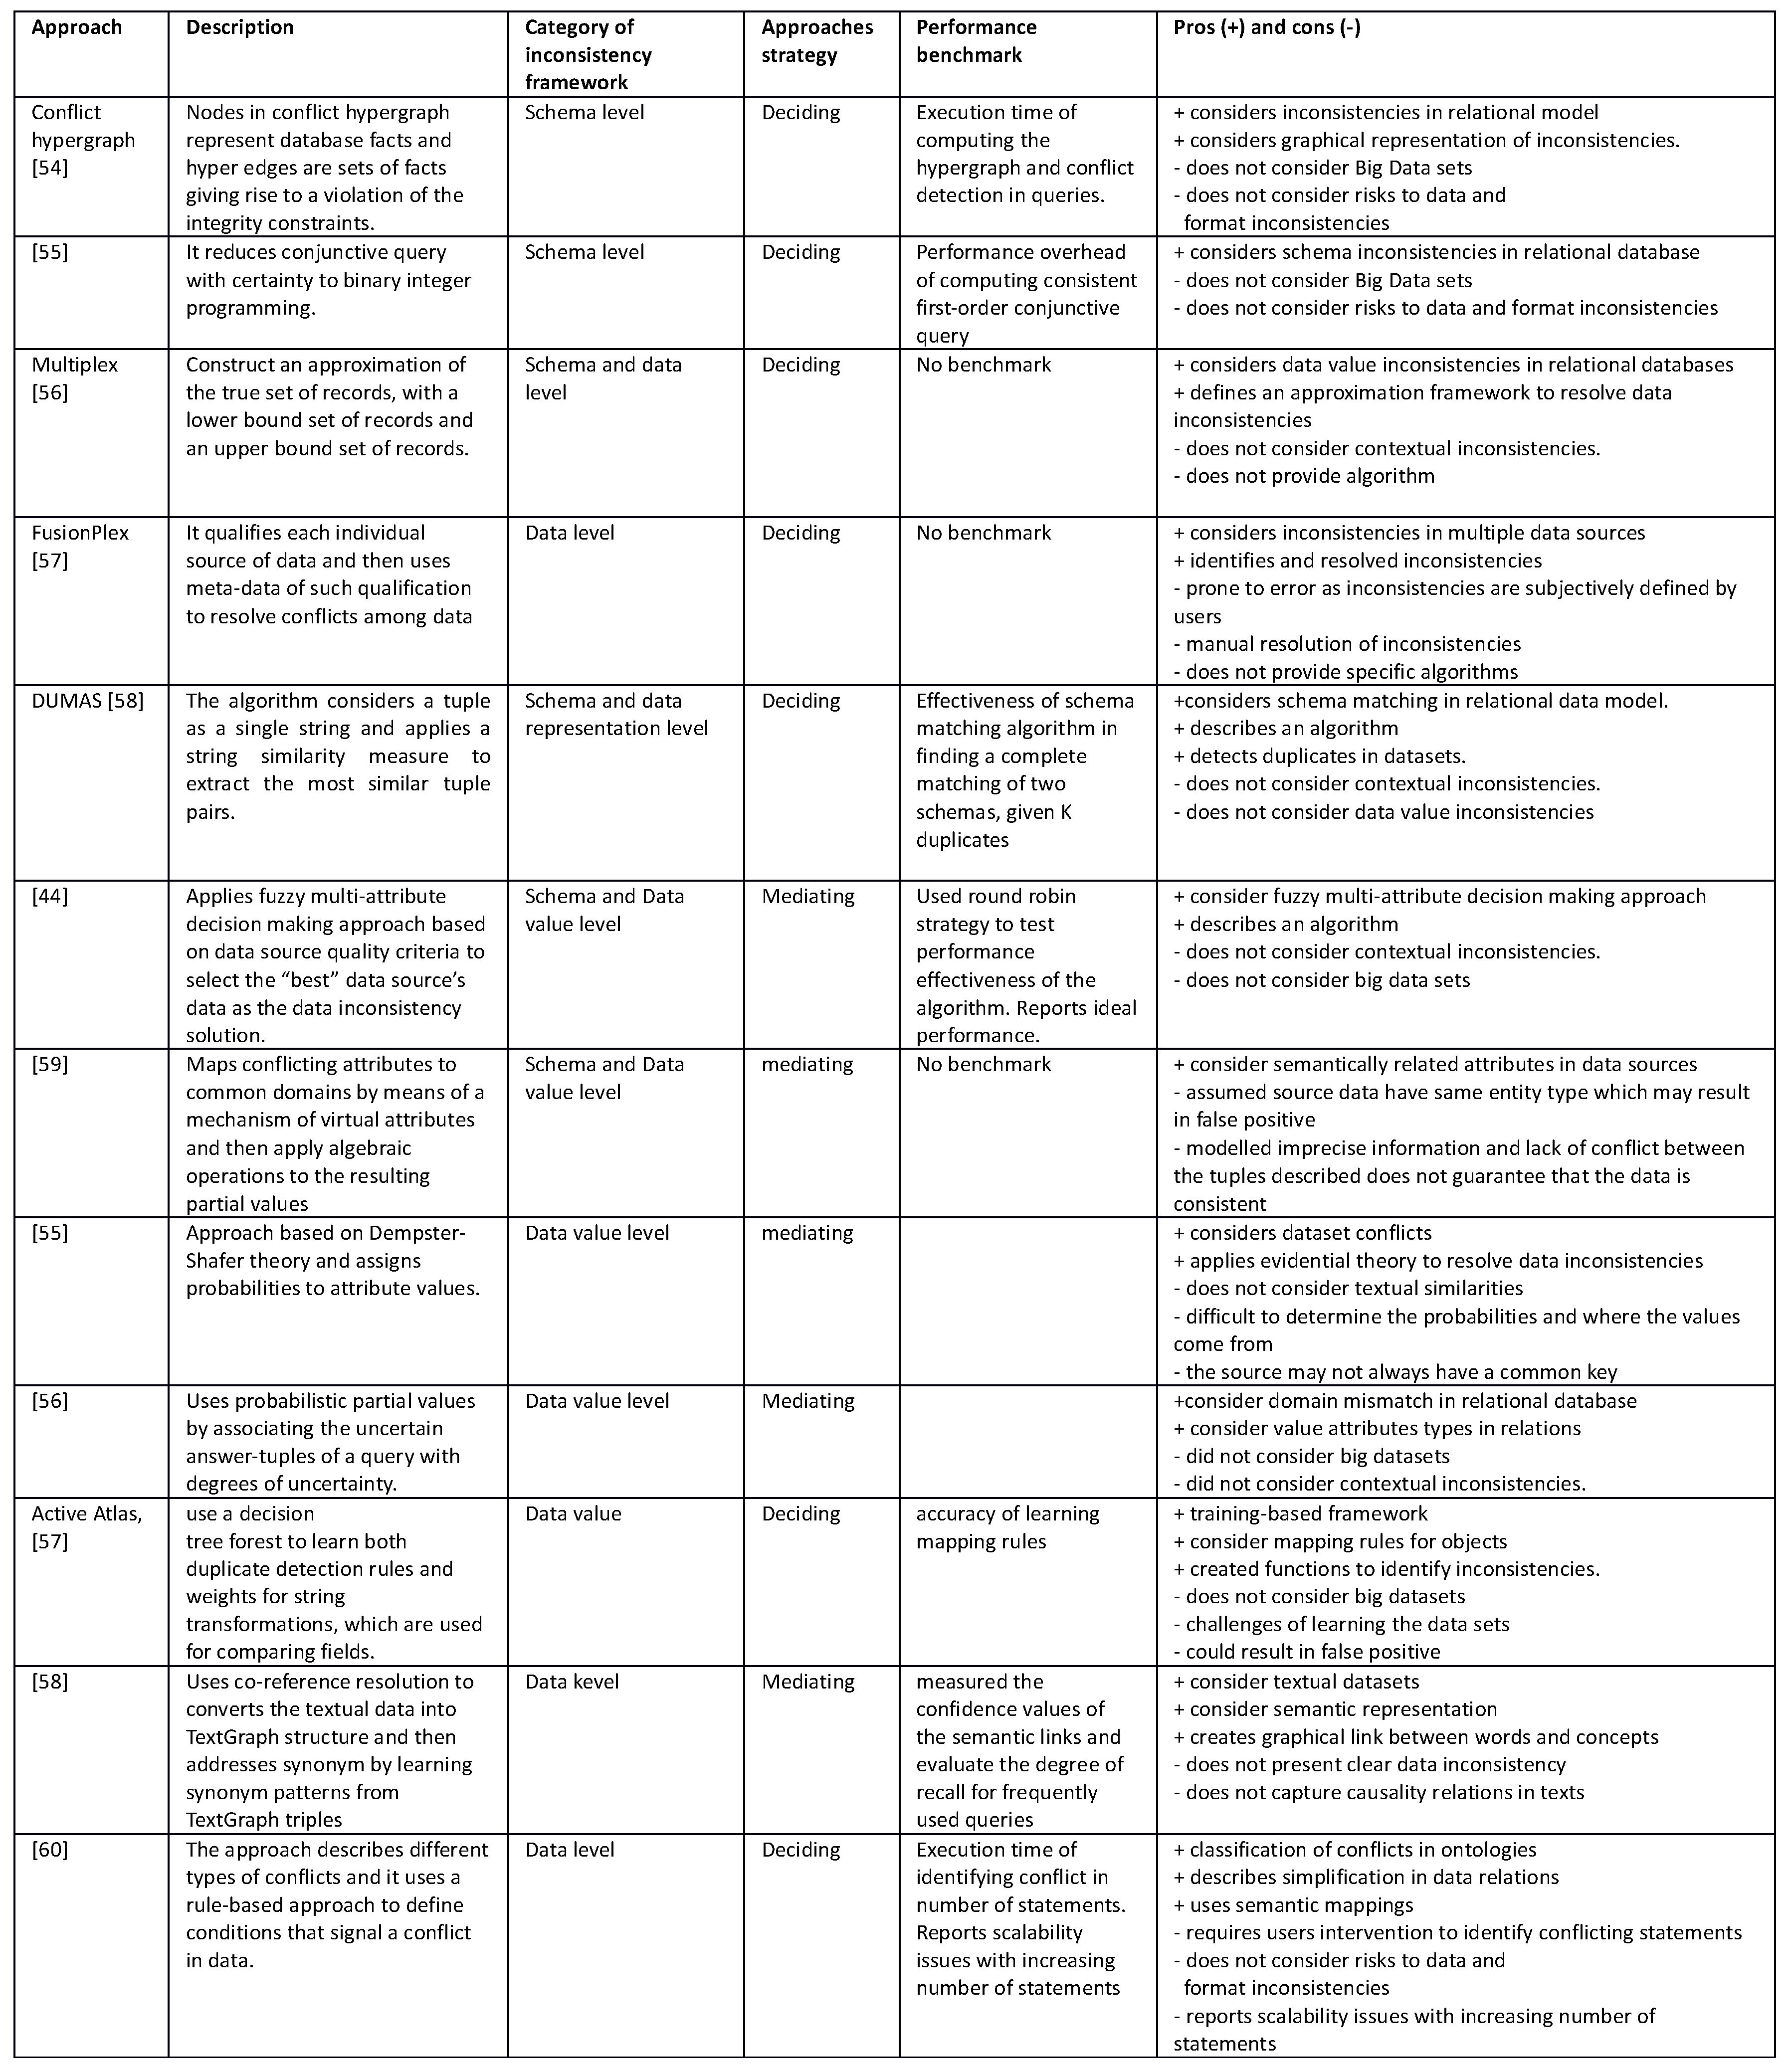
Appendix A provides a further description of the main approaches in the identification and assessment of data inconsistencies.
6. Conclusions
With the continuous creation of data, Big Data research has become increasingly crucial within the majority of data-driven fields. Consequently, it has attracted considerable attention from multi-disciplinary research areas. However, data exhibit highly dynamical properties, which need to be harnessed to facilitate the knowledge discovery and the decision modelling processes. Furthermore, there is compelling evidence that cutting-edge algorithm and methods need to be continuously introduced to address the multiple challenges posed by the diverse and large quantity of data. Moreover, new frontiers of Big Data have been opened due to the interconnections with disciplines and topics, previously considered as unrelated to data analysis. Therefore, further research and investigation is required to enhance the current state-of-the-art understanding of data. This article focuses on a survey of specific research areas with particular emphasis on decision-making techniques, including Network Theory, Bayesian Networks, NLP and Machine Learning, which have enhanced our capability of identifying, extracting and assessing actionable insights from Big Data.


