A User Study of a Prototype of a Spatial Augmented Reality System for Education and Interaction with Geographic Data


Abstract
:1. Introduction
2. Materials and Methods
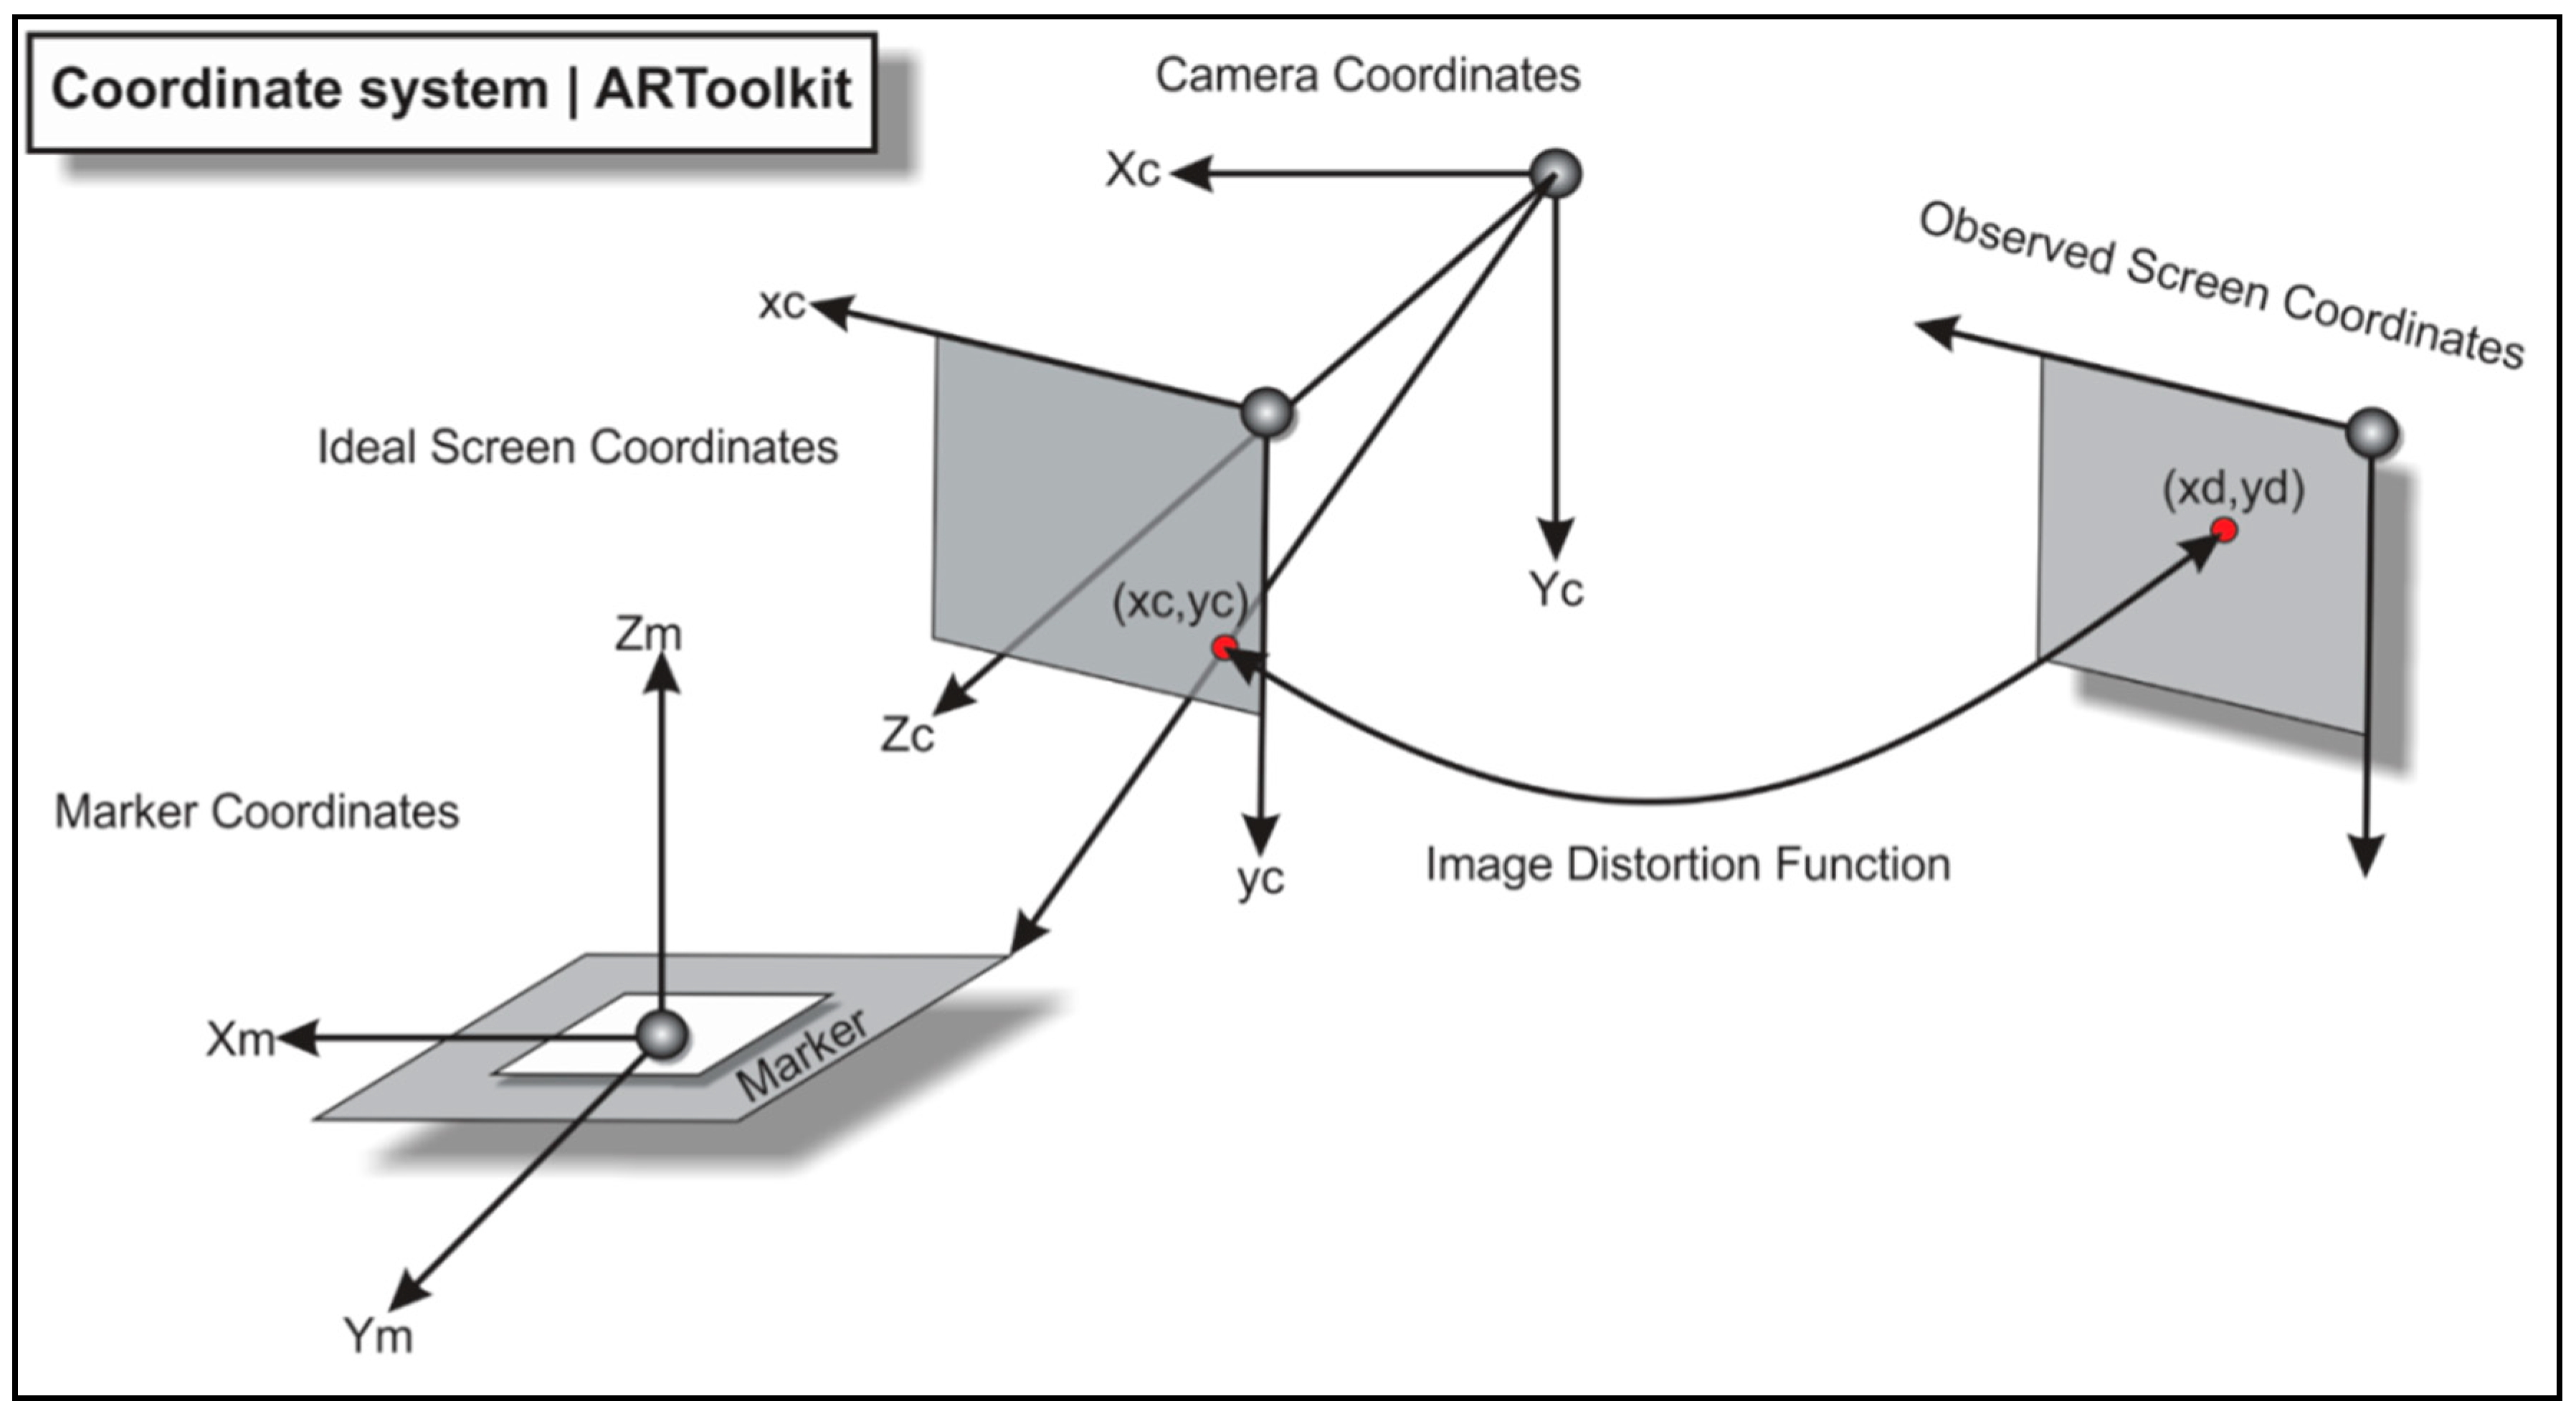
2.1. The Augmented Reality System Development
- The Marker Coordinate System to the Camera Coordinate System (3D to 3D);
- The Camera Coordinate System to the Screen Coordinate System (3D to 2D).
2.2. A Fisrst Look into the Usability of the Spatial Augmented Reality System
2.2.1. Participants
2.2.2. Activity Design & Basic Procedures
2.3. Describing and Analyzing the Results
2.3.1. Answer Transcriptions
2.3.2. Trends and Users’ Evaluation
3. Results and Discussion
3.1. Analysis of Results from User’s Activities
3.2. General Review and Potential of Augmented Reality Systems According to the Interviewed Users
4. Conclusions
Author Contributions
Funding
Acknowledgments
Conflicts of Interest
References
- Azuma, R.T. A survey of augmented reality. Presence 1997, 6, 355–385. [Google Scholar] [CrossRef]
- Azuma, R.; Baillot, Y.; Behringer, R.; Feiner, S.; Julier, S.; Macintyre, B. Recent advances in augmented reality. IEEE Comput. Graph. Appl. 2001, 21, 34–47. [Google Scholar] [CrossRef]
- Bobrich, J.; Otto, S. Augmented maps. Int. Arch. Photogramm. Remote Sens. Spat. Inf. Sci. 2002, 34, 502–505. [Google Scholar]
- Bobrich, J. An Immersive Environment Based on Paper Maps. In Proceedings of the 21st ICC 2003, Durban, South Africa, 10–16 August 2003. [Google Scholar]
- Carbonell-Carrera, C.; Avarvarei, B.V.; Chelariu, E.L.; Draghia, L.; Avarvarei, S.C. Map-Reading Skill Development with 3D Technologies. J. Geogr. 2017, 116, 197–205. [Google Scholar] [CrossRef]
- Carbonell-Carrera, C.; Saorin-Perez, J.L.; Torre-Cantero, J. Teaching with AR as a tool for relief visualization: Usability and motivation study. Int. Res. Geogr. Environ. Educ. 2017, 27, 69–84. [Google Scholar] [CrossRef]
- Asai, K.; Kondo, T.; Kobayashi, H.; Mizuki, A. A geographic surface browsing tool using map-based augmented reality. In Proceedings of the 2008 International Conference Visualisation, London, UK, 9–11 July 2008; pp. 93–98. [Google Scholar]
- Paelke, V.; Sester, M. Augmented paper maps: Exploring the design space of a mixed reality system. ISPRS J. Photogram. Remote. Sens. 2010, 65, 256–265. [Google Scholar] [CrossRef] [Green Version]
- Adithya, C.; Kowsik, K.; Namrata, D.; Nageli, V.S.; Shrivastava, S.; Rakshit, S. Augmented reality approach for paper map visualization. In Proceedings of the 2010 International Conference on Communication and Computational Intelligence (INCOCCI), Erode, India, 27–29 December 2010; pp. 352–356. [Google Scholar]
- Morrison, A.; Oulasvirta, A.; Peltonen, P.; Lemmela, S.; Jacucci, G.; Reitmayr, G.; Näsänen, J.; Juustila, A. Like bees around the hive: A comparative study of a mobile augmented reality map. In Proceedings of the SIGCHI Conference on Human Factors in Computing Systems, Boston, MA, USA, 4–9 April 2009; pp. 1889–1898. [Google Scholar]
- Arvanitis, T.N.; Petrou, A.; Knight, J.F.; Savas, S.; Sotiriou, S.; Gargalakos, M.; Gialouri, E. Human factors and qualitative pedagogical evaluation of a mobile augmented reality system for science education used by learners with physical disabilities. Pers. Ubiquitous Comput. 2009, 13, 243–250. [Google Scholar] [CrossRef]
- Ternier, S.; Klemke, R.; Kalz, M.; Van Ulzen, P.; Specht, M. ARLearn: Augmented Reality Meets Augmented Virtuality. J. UCS 2012, 18, 2143–2164. [Google Scholar]
- Wu, H.K.; Lee, S.W.Y.; Chang, H.Y.; Liang, J.C. Current status, opportunities and challenges of augmented reality in education. Comput. Educ. 2013, 62, 41–49. [Google Scholar] [CrossRef]
- Cheng, K.H.; Tsai, C.C. Affordances of augmented reality in science learning: Suggestions for future research. J. Sci. Educ. Technol. 2013, 22, 449–462. [Google Scholar] [CrossRef]
- Carbonell-Carrera, C.; Medler, S.H. Spatial Orientation Skill Improvement with Geospatial Applications: Report of a Multi-Year Study. ISPRS Int. J. Geo-Inf. 2017, 6, 278. [Google Scholar] [CrossRef]
- Roth, R.E.; Ross, K.S.; Maceachren, A.M. User-Centered Design for Interactive Maps: A case Study in Crime Analysis. ISPRS Int. J. Geo-Inf. 2015, 4, 262–301. [Google Scholar] [CrossRef]
- He, Z.; Xia, Z.; Chang, Y.; Chen, W.; Hu, J.; Wei, X. Research on underground pipeline augmented reality system based on ARToolKit. In Proceedings of the Geoinformatics 2006: Geospatial Information Technology, Wuhan, China, 28–29 October 2006; Volume 6421. [Google Scholar]
- Fiala, M. Comparing artag and artoolkit plus fiducial marker systems. In Proceedings of the IEEE International Workshop on Haptic Audio Visual Environments and Their Applications, Ottawa, ON, Canada, 1 October 2005; p. 6. [Google Scholar]
- Schöning, J.; Krüger, A.; Müller, H.J. Interaction of mobile camera devices with physical maps. In Proceedings of the Fourth International Conference on Pervasive Computing, Dublin, Ireland, 7–10 May 2006; pp. 121–124. [Google Scholar]
- Raskar, R.; Welch, G.; Fuches, H. Spatially augmented reality. In Proceedings of the First IEEE Workshop on Augmented Reality (IWAR’98), San Francisco, CA, USA, 1 November 1998. [Google Scholar]
- Slocum, T.A.; Blok, C.; Jiang, B.; Koussoulakou, A.; Montello, D.R.; Fuhrmann, S.; Hedley, N.R. Cognitive and Usability issues in Geovisualization. Cartogr. Geogr. Inf. Sci. 2001, 28, 61–75. [Google Scholar] [CrossRef]
- Fabrikant, S.I.; Lobben, A. Introduction: Cognitive Issues in Geographic Information Visualization. Cartographica 2009, 44, 139–143. [Google Scholar] [CrossRef] [Green Version]
- Sommerville, I. Software Engineering, 4th ed.; Addison-Wesley: Wokingham, UK, 1992; p. 649. [Google Scholar]
- Van Elzakker, C.P.J.M. The Use of Maps in the Exploration of Geographic Data. Ph.D. Thesis, ITC, Utrecht/Enschede, The Netherlands, 2004. [Google Scholar]
- Board, C. Map reading tasks appropriate in experimental studies in cartographic communication. Cartographica 1978, 15, 1–12. [Google Scholar] [CrossRef]
- Maceachren, A.M. How Maps Work: Representation, Visualization, and Design; The Guilford Press: New York, NY, USA, 1995. [Google Scholar]
- Slocum, T.A.; Mcmaster, R.B.; Kessler, F.C.; Howard, H.H. Thematic Cartography and Geovisualization, 3rd ed.; Pearson Prentice Hall: Upper Saddle River, NJ, USA, 2009. [Google Scholar]
- Arnheim, R.T. The perception of maps. Am. Cartogr. 1976, 3, 5–10. [Google Scholar] [CrossRef]
- Akhtar, M. Communication and retrieval of spatial information from thematic maps. Natl. Geogr. 1989, 24, 51–65. [Google Scholar]
- Maceachren, A.M. The role of maps in spatial knowledge acquisition. Cartogr. J. 1991, 28, 152–162. [Google Scholar] [CrossRef]
- Tversky, B.; Hemenway, K. Objects, Parts, and Categories. J. Exp. Psychol. Gen. 1984, 113, 169–193. [Google Scholar] [CrossRef] [PubMed]
- Rosch, E.; Mervis, C.; Gray, W.; Johnson, D.; Boyes-Braem, P. Basic objects in natural categories. Cogn. Psychol. 1976, 8, 382–439. [Google Scholar] [CrossRef] [Green Version]
- Lakoff, G. Woman, Fire, and Dangerous Things: What Categories Reveal about the Mind; University of Chicago Press: Chicago, IL, USA, 1987. [Google Scholar]
- Maceachren, A.M.; Kraak, M.J. Research Challenges in geovisualization. Cartogr. Geogr. Inf. Sci. 2001, 28, 3–12. [Google Scholar] [CrossRef]
- Koua, E.L.; Maceachren, A.M.; Kraak, M.J. Evaluating the usability of visualization methods in an exploratory geovisualization environment. Int. J. Geogr. Inf. Sci. 2006, 20, 425–448. [Google Scholar] [CrossRef]
- Suchan, T.A.; Brewer, C.A. Qualitative methods for research on mapmaking and map use. Prof. Geogr. 2000, 52, 145–154. [Google Scholar] [CrossRef]
- Patton, M.Q. Qualitative Research and Evaluation Methods, 3rd ed.; Sage: London, UK, 2002; p. 127. [Google Scholar]
- Ooms, K.; De Meyer, P.; Fack, V. Listen to the Map User: Cognition, Memory, and Expertise. Cartogr. J. 2015, 52, 3–19. [Google Scholar] [CrossRef]
- Roth, R.E.; Harrower, M. Adressing Map Interface Usability: Learning from the Lakeshore Nature Preserve Interactive Map. Cartogr. Perspect. 2008, 60, 46–66. [Google Scholar] [CrossRef]
- Kulhavy, R.W.; Stock, W.A. How Cognitive Maps are Learned and Remembered. Ann. Assoc. Am. Geogr. 1996, 86, 123–145. [Google Scholar] [CrossRef]


| Class | Requirements |
|---|---|
| Experts | Professor, with a PhD degree in Cartography, GIS, Geography, or Environmental Sciences/Water Resources, with experience treating spatial information related to water resources. |
| Non-experts | Individuals who have not been classified as an expert. |
| Task | Goal | |
|---|---|---|
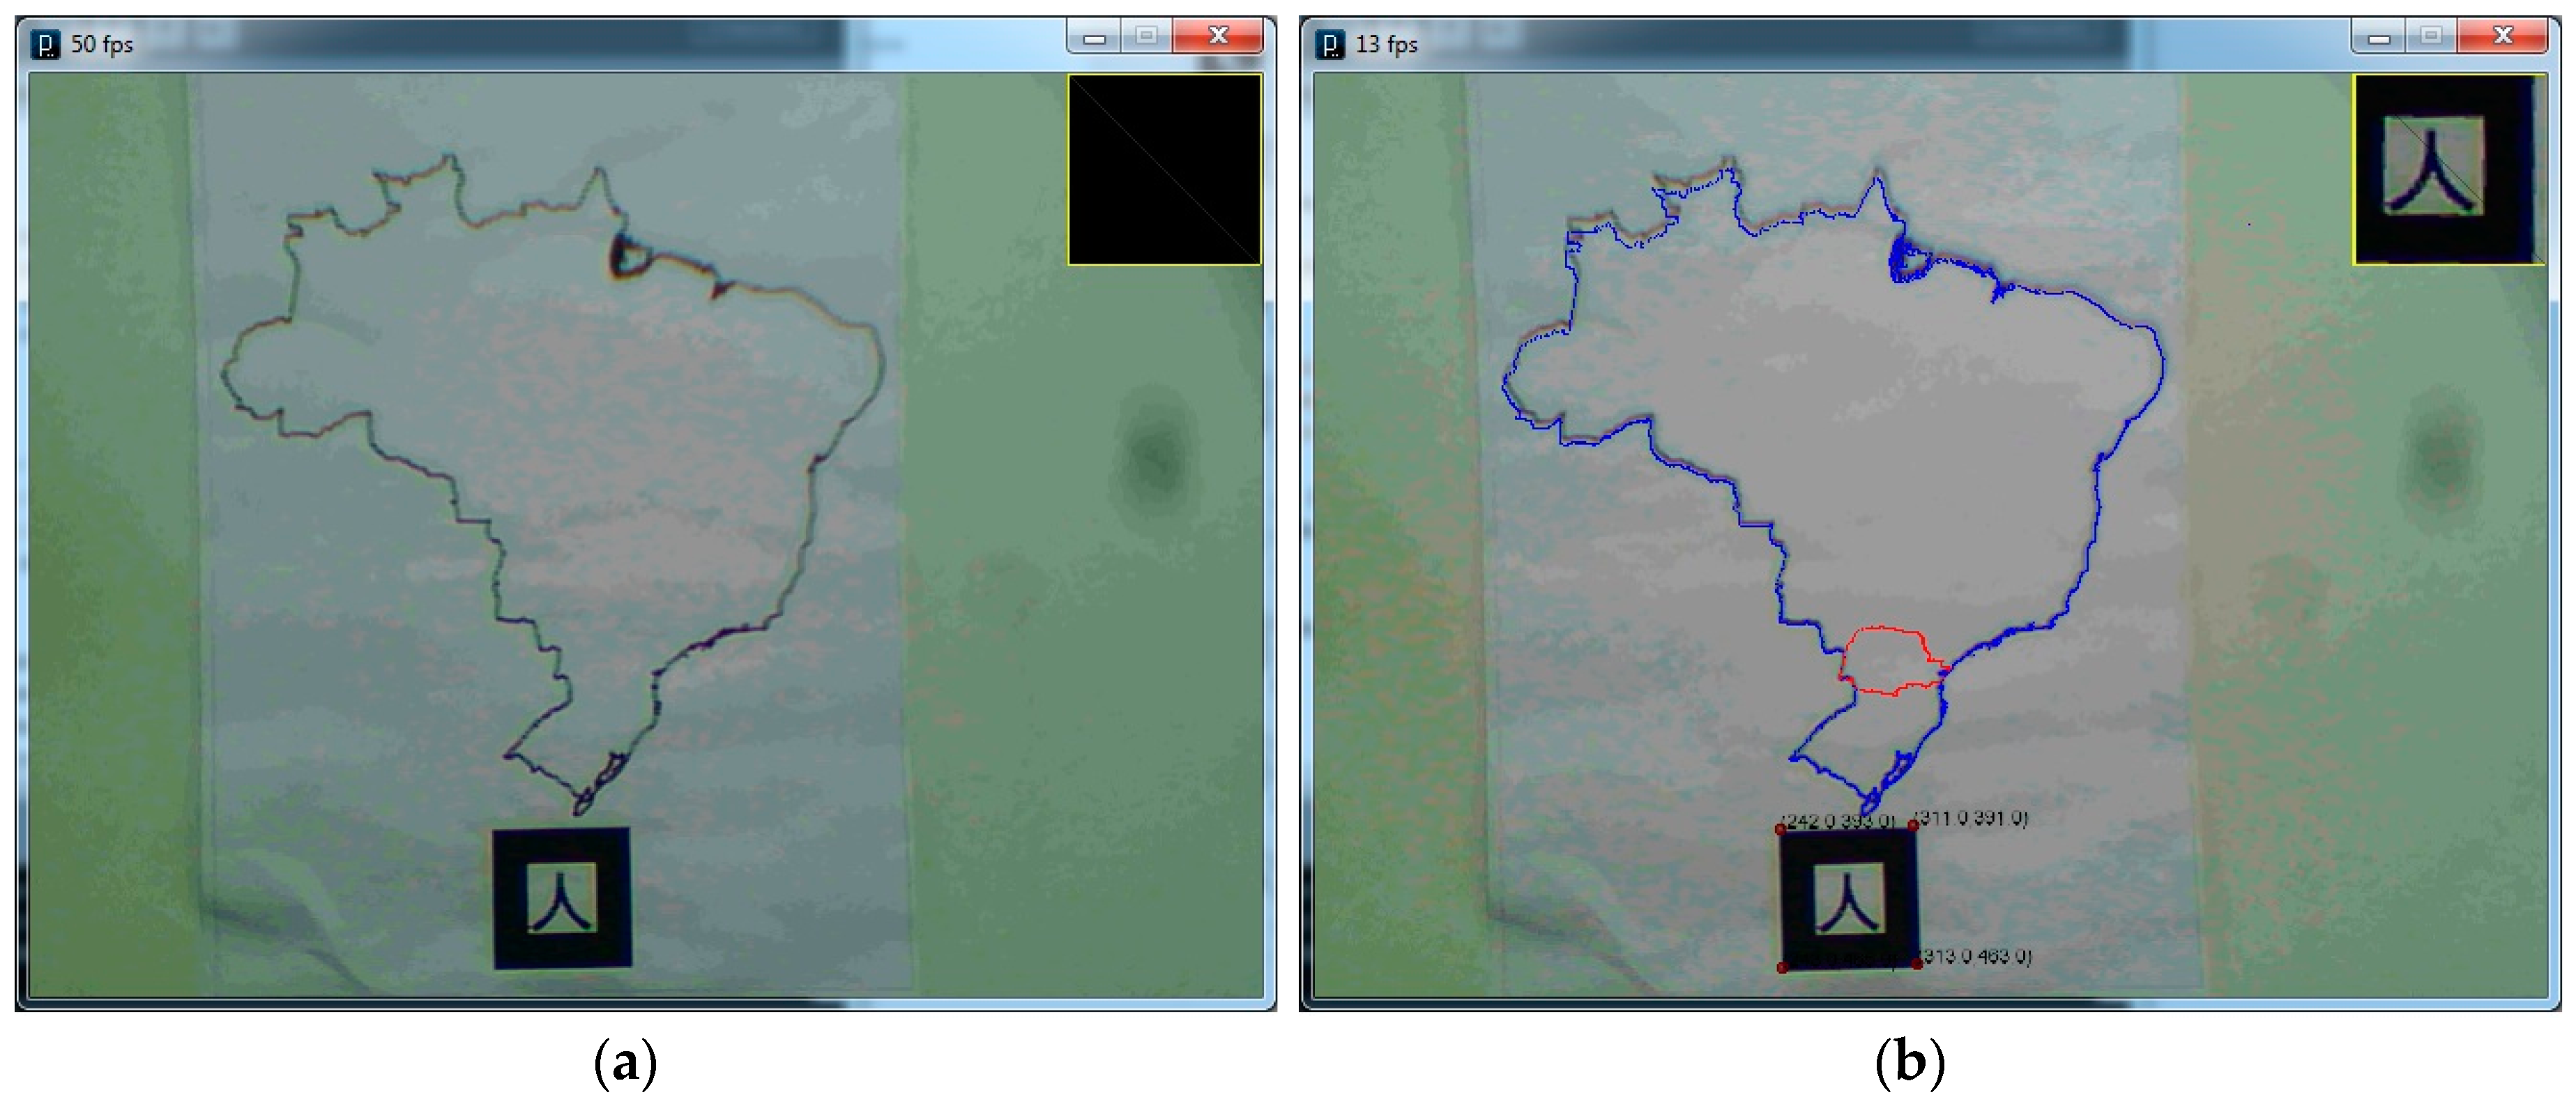
| 1 | Given the printed map with the Brazil’s boundaries, draw the boundaries of Paraná State. | Instigate cognitive and perceptual reasoning processes. |
| After this, we turned on the system and projected the Paraná State boundaries (Figure 3b). | ||
| 2 | Once the system is presented, would you change your first representation? Why? | Instigate the parallel of knowledge between what is presented and what the subject knows, aiming to allow a new boundary delimitation. |
| 3 | Does the system help in the proposed task? | Verify the system contribution for the spatial knowledge construction. |
| Task | Goal | |
|---|---|---|
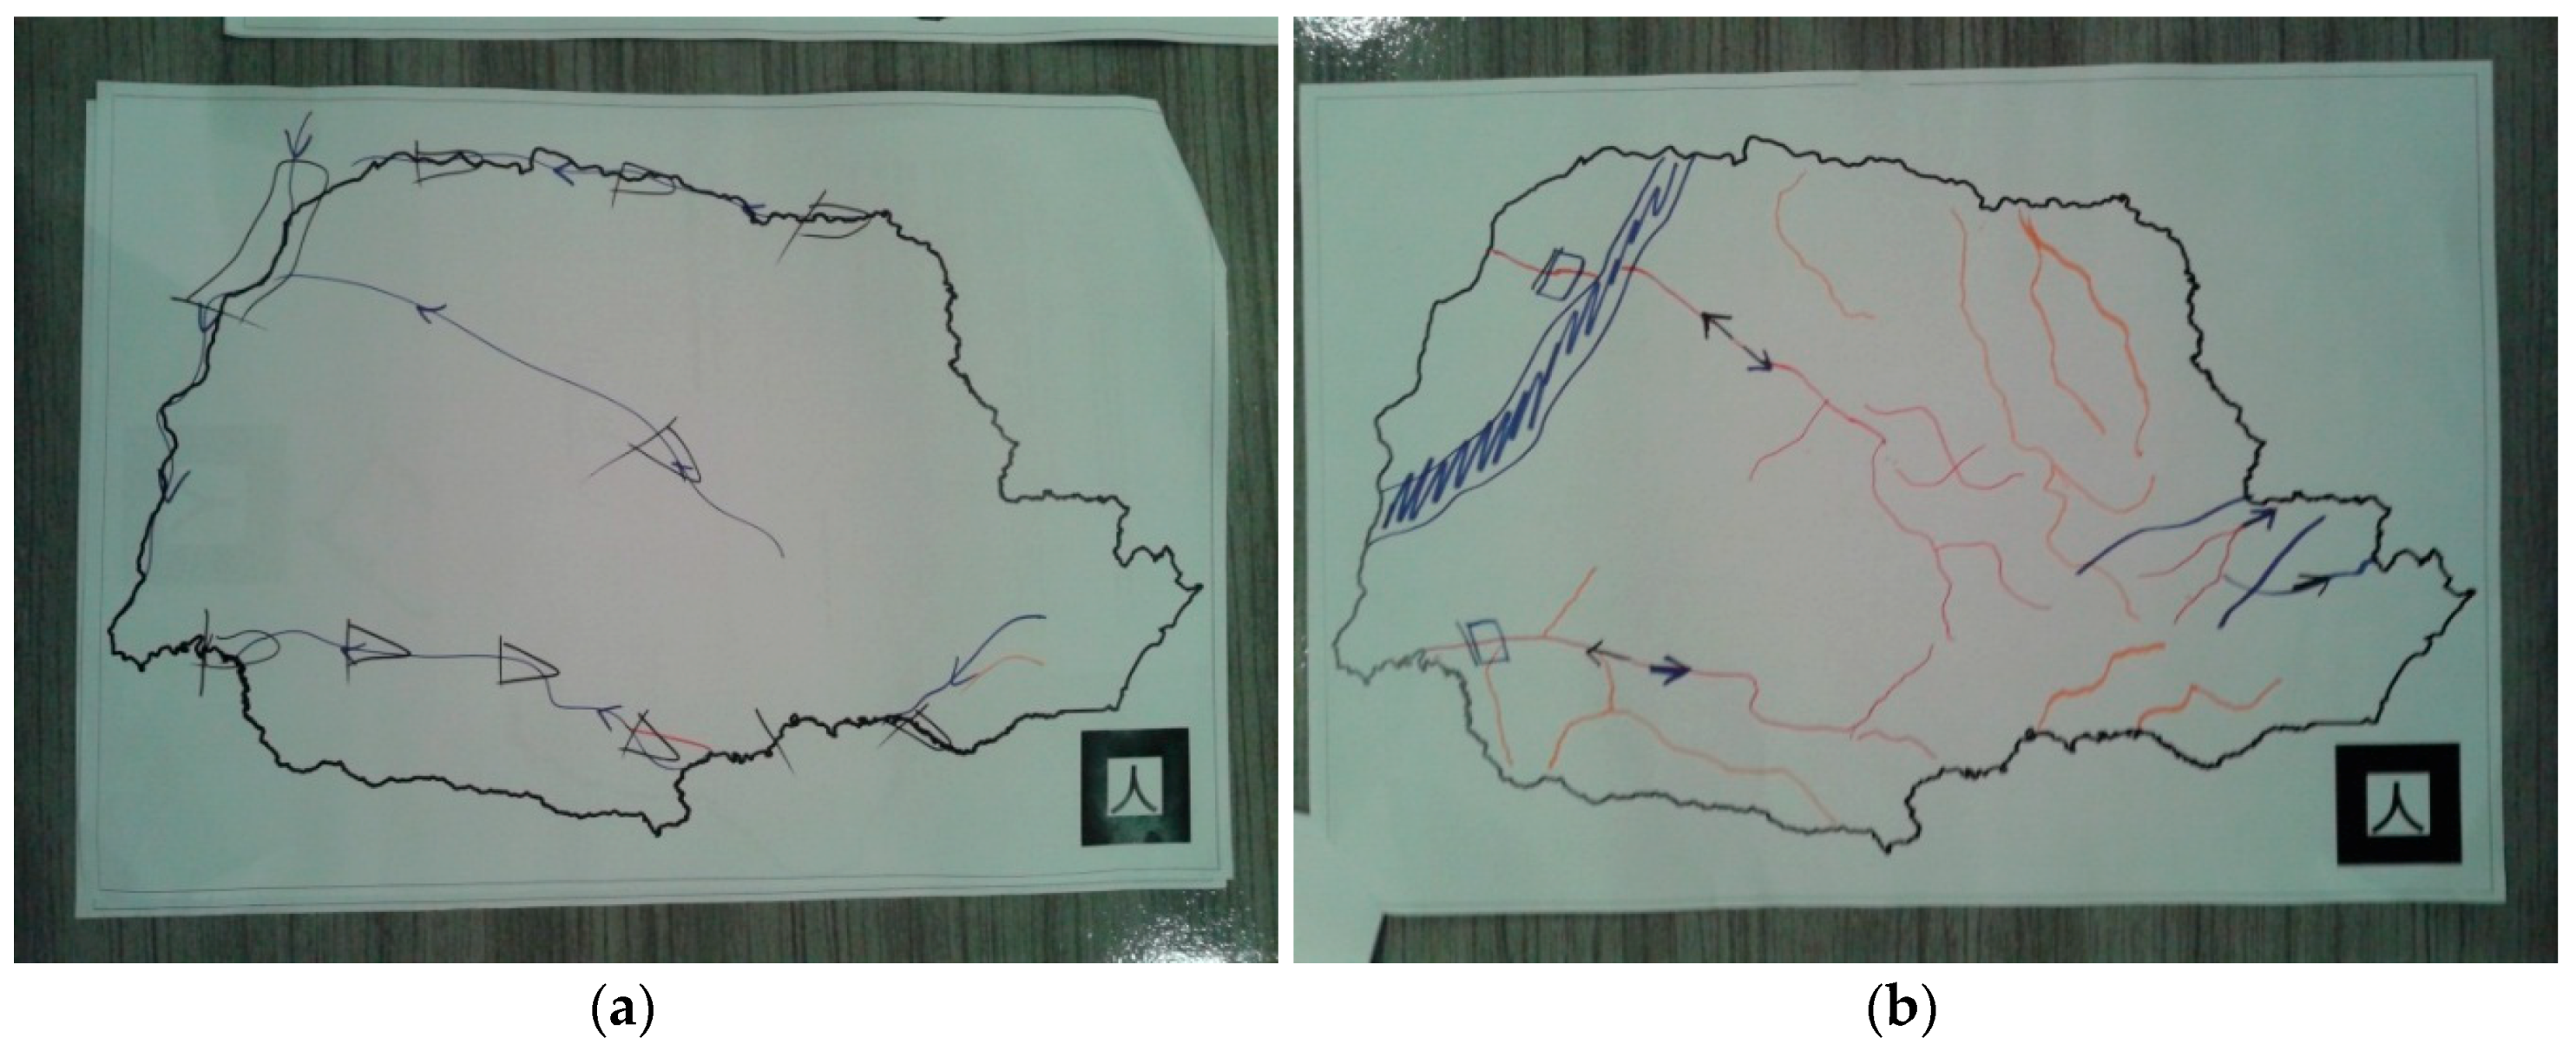
| 1 | Given the map with the Paraná State’s boundaries, draw four rivers you know or remember. | Instigate cognitive and perceptual reasoning processes. |
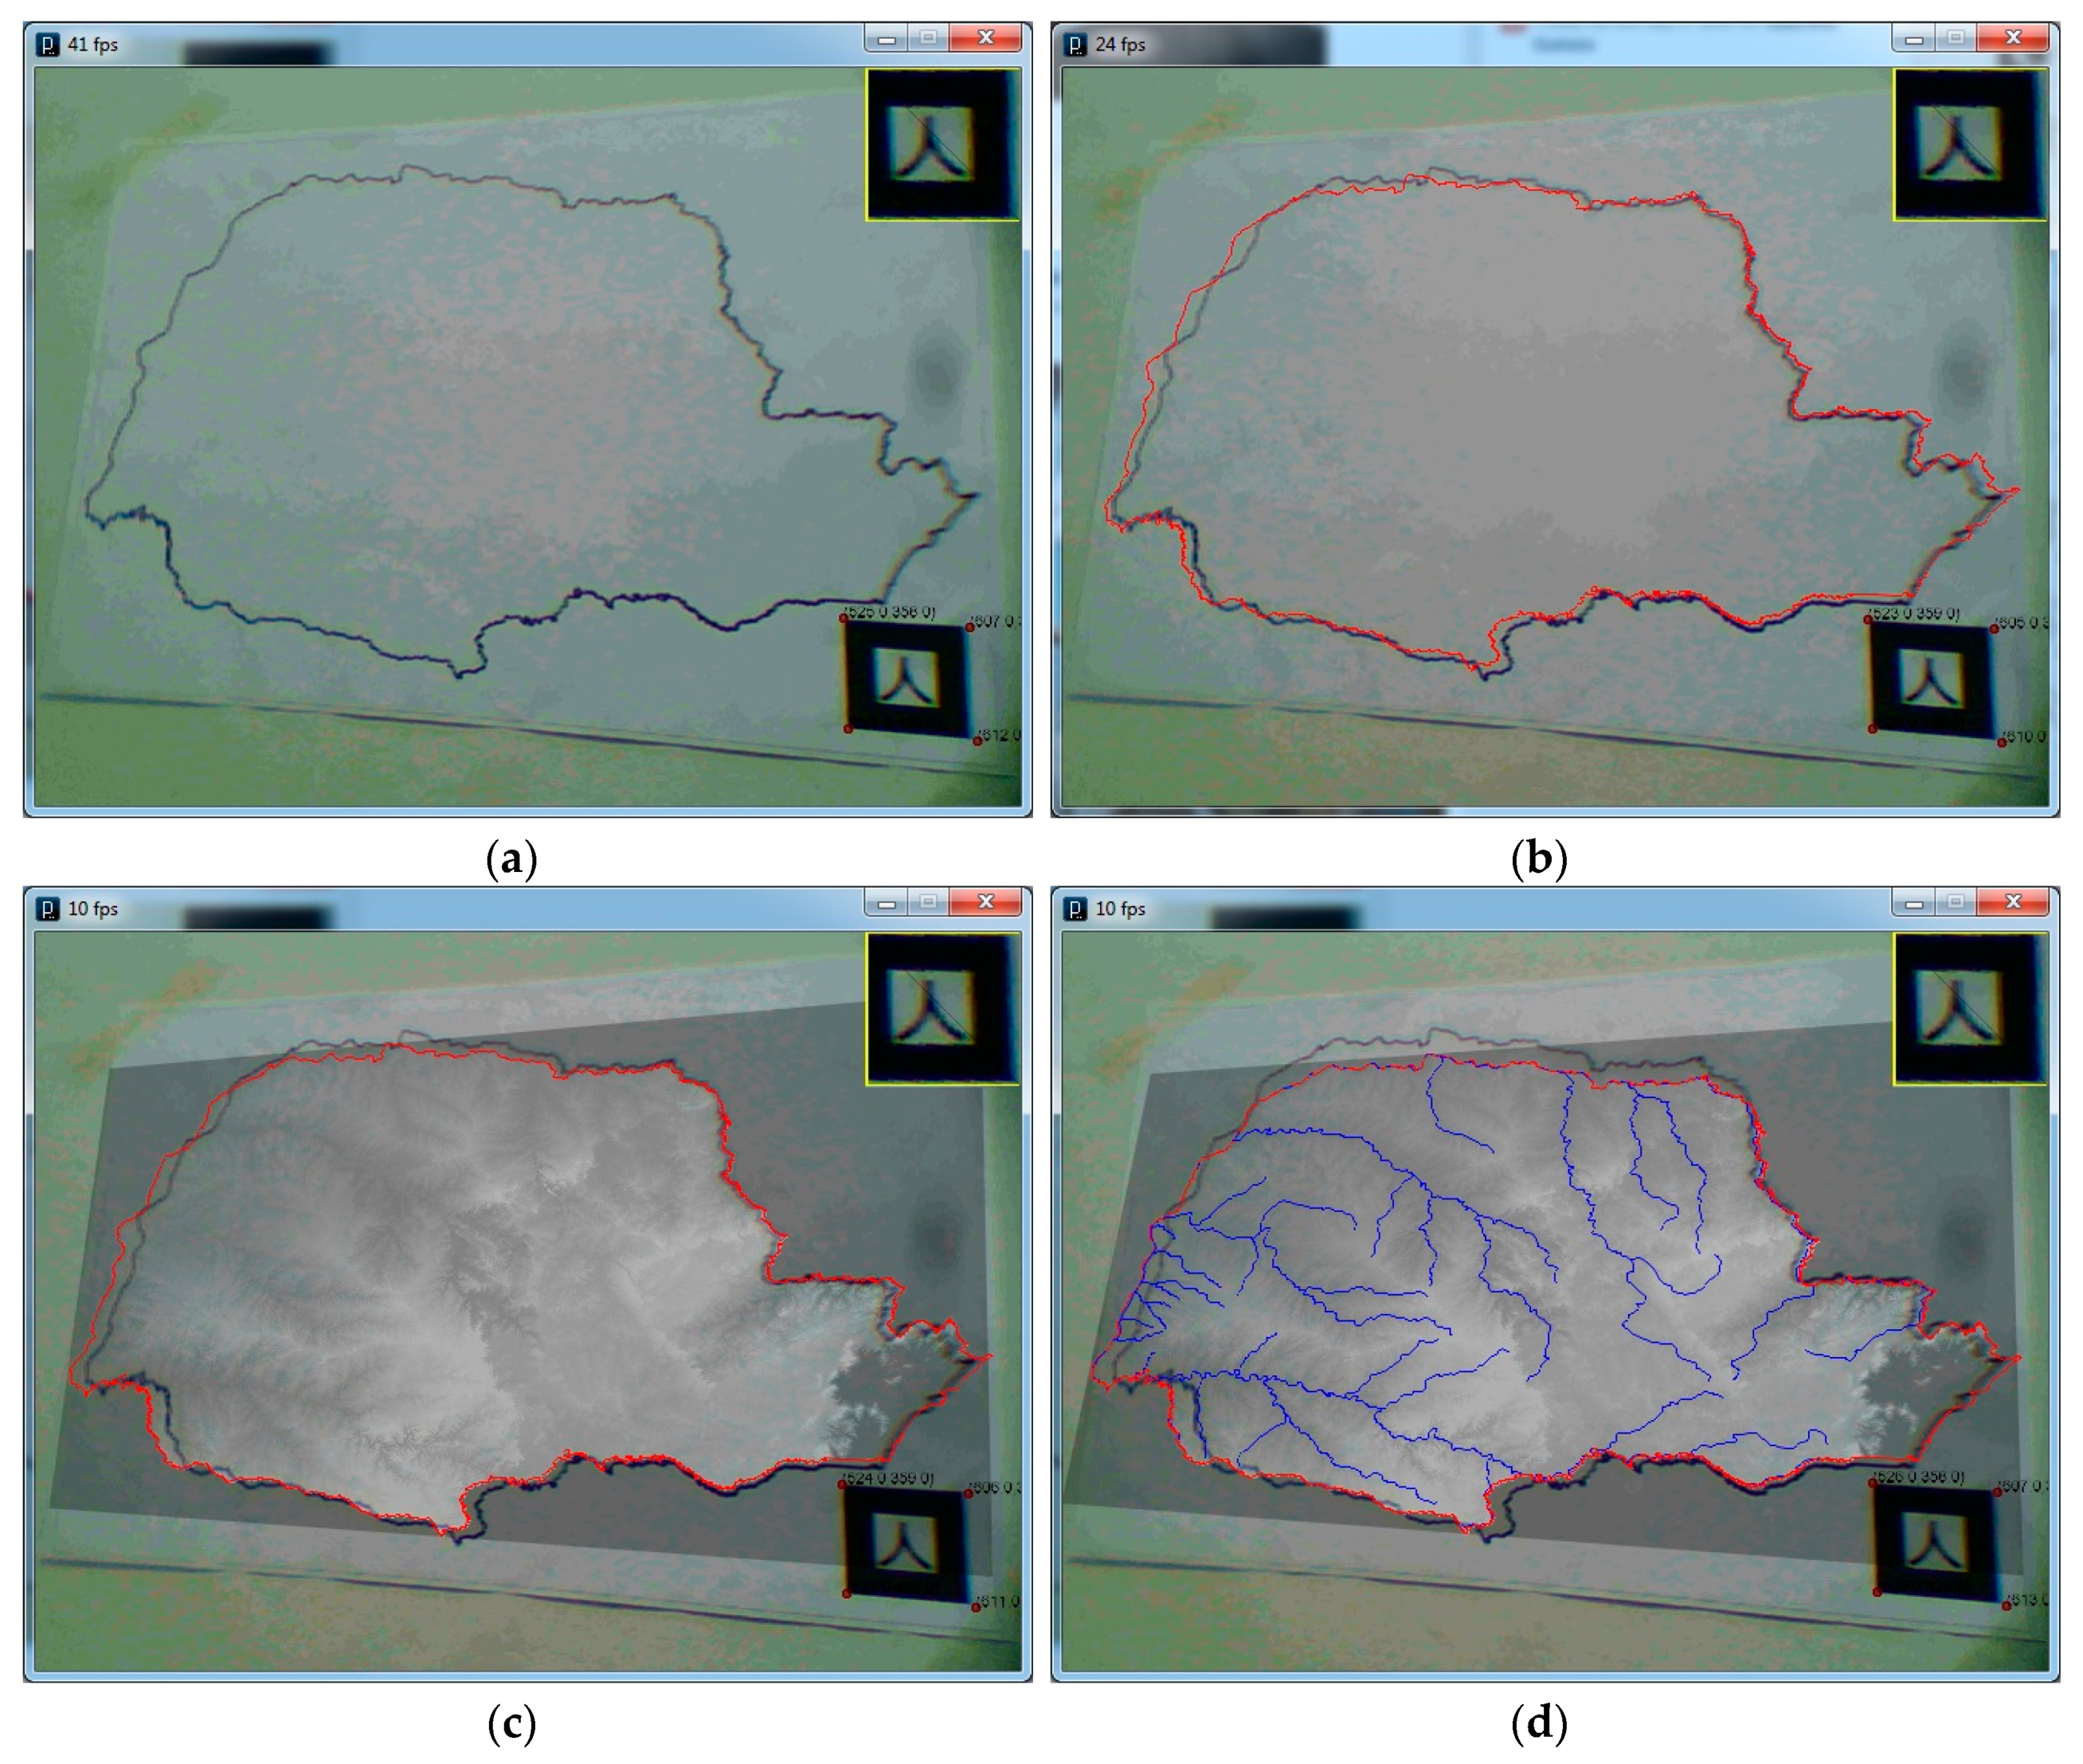
| At this point, we connected the system and projected the SRTM image with the relief of the area (Figure 3c). | ||
| 2 | Do you recognize this product (the SRTM image)? Does it help you in this task? | Instigate cognitive and perceptual reasoning processes. |
| 3 | Once presented to the system again, would you change your representation? Why? | Instigate the parallel of knowledge between what is presented and what the subject knows, aiming to allow a new river flow delimitation. |
| At this point, we connected the system and projected the river flow vectors (Figure 3d). We looked forward 10 s and then turned off the SRTM layer. | ||
| 4 | Do you recognize this product (the river flow vectors)? Does it help you in this task? | Instigate cognitive and perceptual reasoning processes. |
| 5 | Once presented to the system again, would you change your representation? Why? | Instigate the parallel of knowledge between what is presented and what the subject knows. |
| 6 | Does the system help in the proposed task? | Verify the system contribution for the spatial knowledge construction. |
| 7 | Based on your representations, draw arrows indicating the river flow direction. | Instigate cognitive and perceptual reasoning processes. |
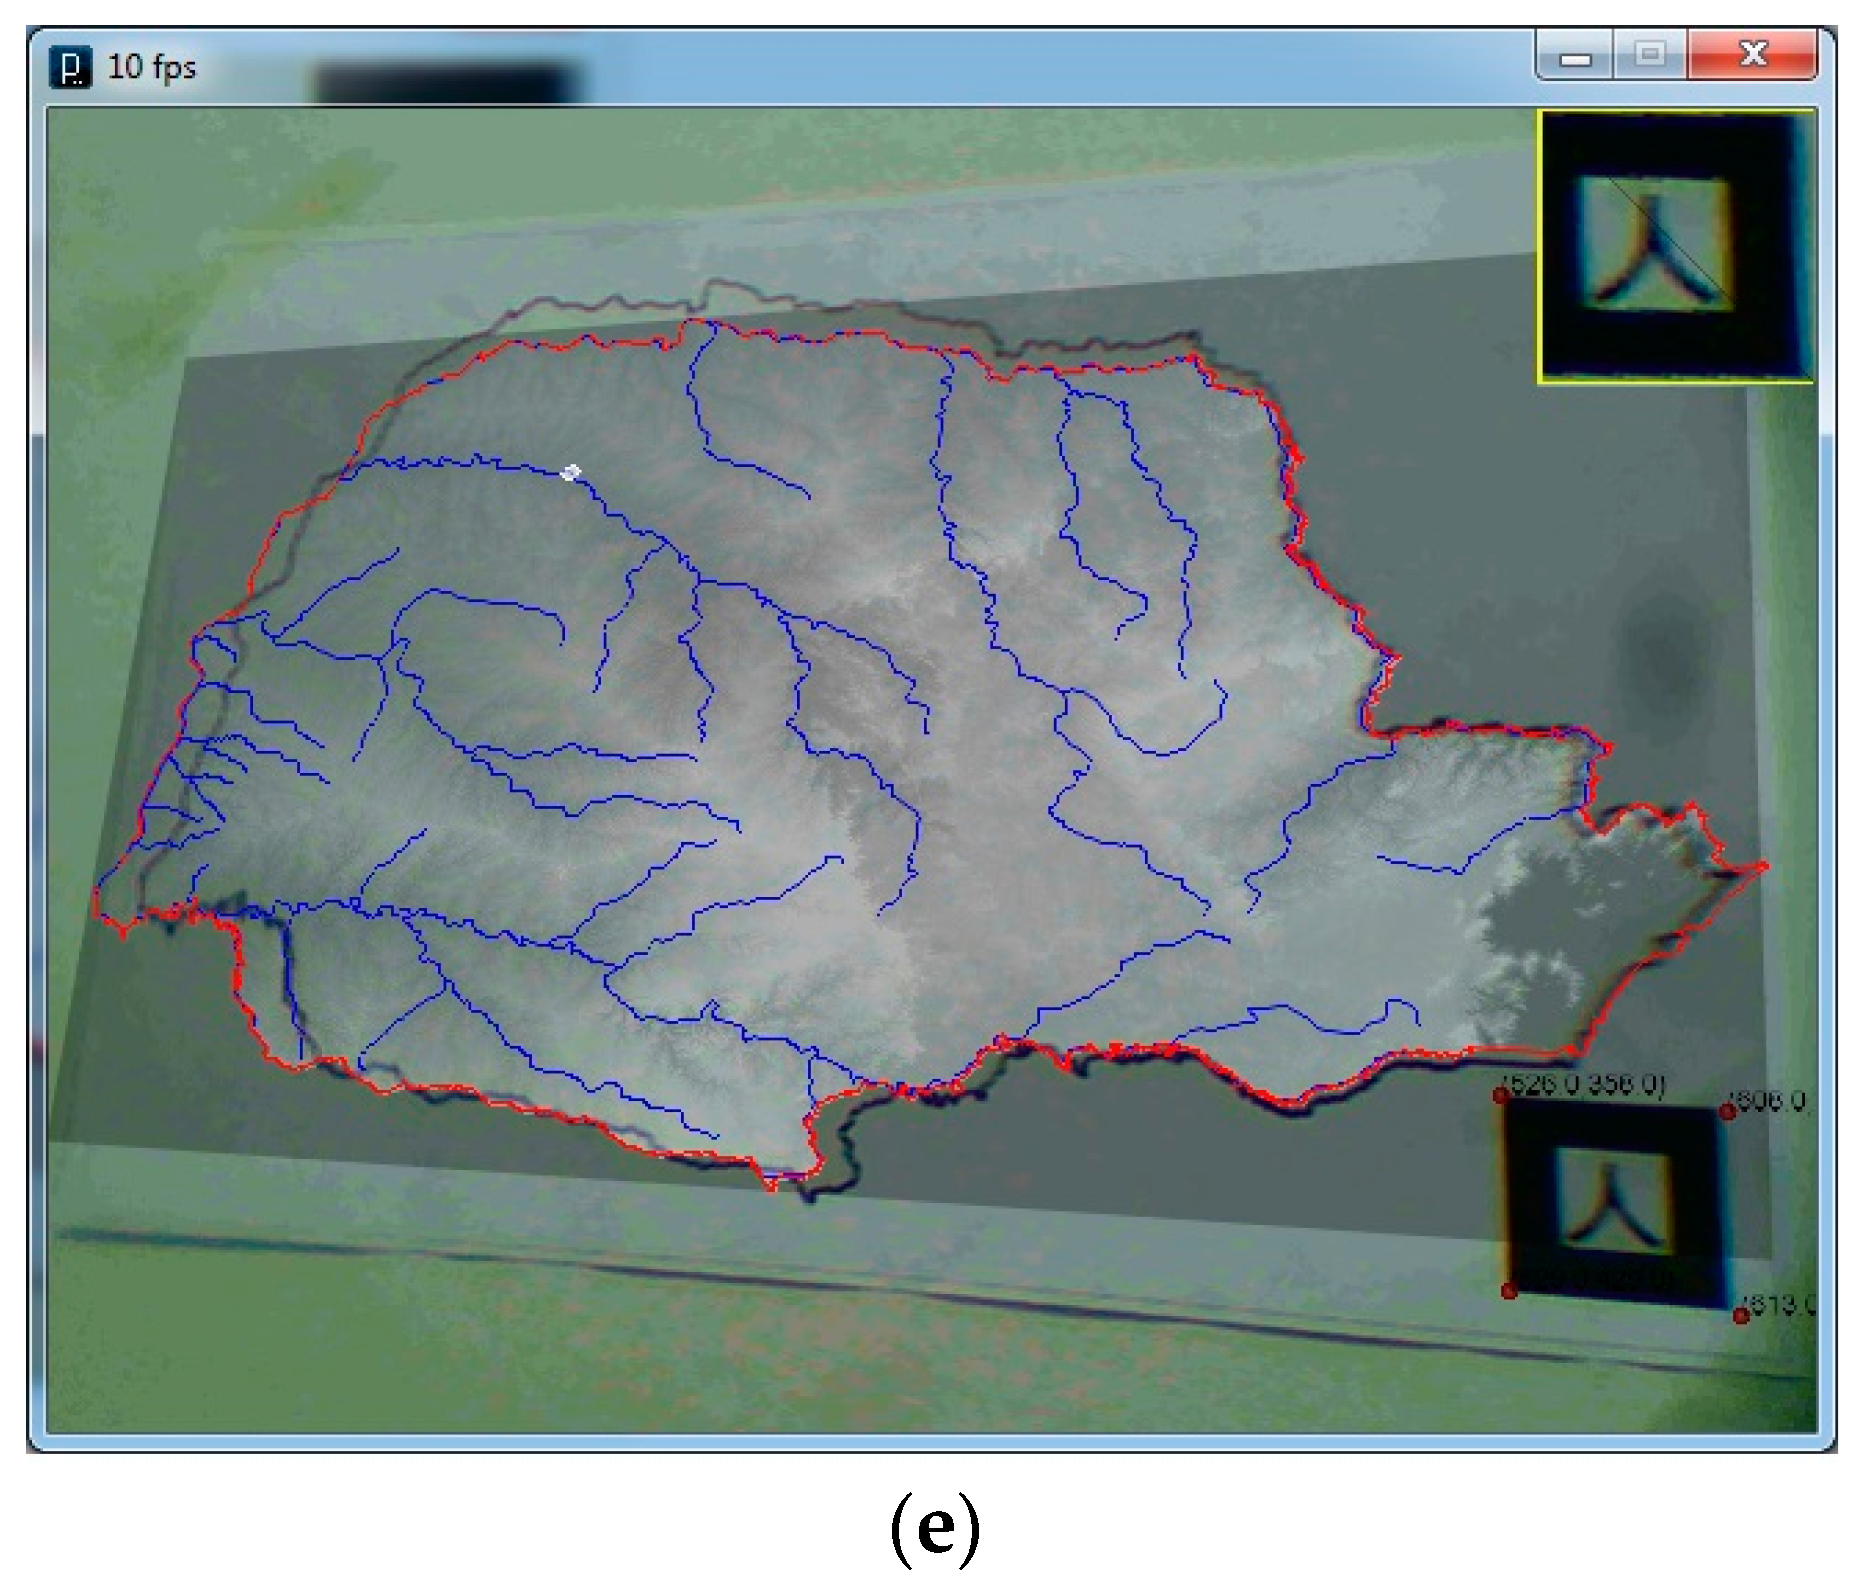
| At this moment, we connected the system and projected the river flow direction animation (Figure 3e). | ||
| 8 | Do you recognize this product (the vectors and the animation)? Does it help you in this task? | Instigate cognitive and perceptual reasoning processes. |
| 9 | Once presented to the system again, would you change your representation? Why? | Instigate the parallel of knowledge between what is presented and what the subject knows. |
| Task | Goal | |
|---|---|---|
| 1 | Based on your representations, draw optimal points for dams by means of traces, as well as its reservoir by a polygon. | To instigate cognitive and perceptual reasoning processes. |
| 2 | Does the system help in the proposed task? | To verify the system contribution for the spatial knowledge construction. |
© 2018 by the authors. Licensee MDPI, Basel, Switzerland. This article is an open access article distributed under the terms and conditions of the Creative Commons Attribution (CC BY) license (http://creativecommons.org/licenses/by/4.0/).
Share and Cite
De A. Pereira, G.H.; Bravo, J.V.M.; Centeno, J.A.S. A User Study of a Prototype of a Spatial Augmented Reality System for Education and Interaction with Geographic Data. Big Data Cogn. Comput. 2018, 2, 20. https://doi.org/10.3390/bdcc2030020
De A. Pereira GH, Bravo JVM, Centeno JAS. A User Study of a Prototype of a Spatial Augmented Reality System for Education and Interaction with Geographic Data. Big Data and Cognitive Computing. 2018; 2(3):20. https://doi.org/10.3390/bdcc2030020
Chicago/Turabian StyleDe A. Pereira, Gabriel Henrique, João Vitor M. Bravo, and Jorge A. S. Centeno. 2018. "A User Study of a Prototype of a Spatial Augmented Reality System for Education and Interaction with Geographic Data" Big Data and Cognitive Computing 2, no. 3: 20. https://doi.org/10.3390/bdcc2030020