Exploring Emergent Features of Student Interaction within an Embodied Science Learning Simulation

Department of Curriculum and Instruction, University of Illinois at Urbana-Champaign, Champaign, IL 61820, USA
*
Author to whom correspondence should be addressed.
Multimodal Technol. Interact. 2018, 2(3), 39; https://doi.org/10.3390/mti2030039
Submission received: 22 May 2018
/
Revised: 14 June 2018
/
Accepted: 21 June 2018
/
Published: 2 July 2018
(This article belongs to the Special Issue Multimodal Learning)
Abstract
:Theories of embodied cognition argue that human processes of thinking and reasoning are deeply connected with the actions and perceptions of the body. Recent research suggests that these theories can be successfully applied to the design of learning environments, and new technologies enable multimodal platforms that respond to students’ natural physical activity such as their gestures. This study examines how students engaged with an embodied mixed-reality science learning simulation using advanced gesture recognition techniques to support full-body interaction. The simulation environment acts as a communication platform for students to articulate their understanding of non-linear growth within different science contexts. In particular, this study investigates the different multimodal interaction metrics that were generated as students attempted to make sense of cross-cutting science concepts through using a personalized gesture scheme. Starting with video recordings of students’ full-body gestures, we examined the relationship between these embodied expressions and their subsequent success reasoning about non-linear growth. We report the patterns that we identified, and explicate our findings by detailing a few insightful cases of student interactions. Implications for the design of multimodal interaction technologies and the metrics that were used to investigate different types of students’ interactions while learning are discussed.
1. Introduction
Understanding core ideas in STEM (Science, Technology, Engineering and Mathematics) domains and applying them across various content areas is critical, and is a central tenant of the Next Generation Science Standards in the United States (US) [1]. Embodied learning is an approach to educational environment design that focuses on the interplay between the knowledge creation process and learners’ physical interactions with their surroundings [2]. Body-based interactions can play a critical role in the development of both concrete and abstract understandings. With the refinement of body detection and tracking technologies arising out of the entertainment and virtual reality industries, software designed to utilize dynamic and continuous body tracking and gesture recognition can now be leveraged to facilitate embodied learning with platforms such as whole-body interactive science learning simulations. Recently, several authors have outlined basic design principles for effective embodied design [2,3,4,5]. These technology-enhanced environments can guide embodied interaction in ways that instigate new learning [6,7,8]. However, there is still a need to explore specific features that can inform the way that these environments support student learning, and in particular how to analyze and integrate the real-time multimodal data that is collected as students interact with the environment. High-frequency data collection and sensing technologies have the ability to capture massive amounts from multiple modes of interaction simultaneously [9,10]. This complements recent perspectives on learning as multimodal (e.g., Ainsworth, Prain, & Tytler [11], Ibrahim-Didi, Hackling, Ramseger, & Sherriff [12]), but more clarity and innovation is needed to discover and articulate effective multimodal metrics within immersive and interactive learning environments. More effective metrics will allow for an increasingly sophisticated understanding of how multimodal environments facilitate student learning and provide valuable feedback on the design of specific features in these environments. In this paper, we explore the relationship between how students engage with ideas about non-linear growth within science contexts in an embodied simulation, and their subsequent reasoning following the use of simulation. We are particularly interested in investigating different multimodal interaction metrics that are generated as students attempt to make sense of the cross-cutting science concepts of scale, proportion, and quantity using a personalized gesture scheme.
1.1. Embodied Learning Environments
An expanding foundation of literature on the interplay between the body and cognitive processes lends support to a body-centered, or embodied, approach to learning (e.g., Barsalou [13], Johnson [14]). Embodied cognition emphasizes the importance of the body’s physical interactions with the environment as a central anchor for a wide array of complex cognition including problem-solving, abstraction, and memory formation [15,16,17]. Recent studies utilizing fMRI (Functional Magnetic Resonance Imaging) imagery have strengthened the connection between mental imagery and physical actions, showing evidence that similar regions of the brain are activated while imagining as well as experiencing (e.g., Tomasino et al. [18]). Leveraging this connection within the framework of embodied learning situates the body as a critical component of the learning process, and emphasizes the importance of designing learning environments that forge and augment the connections between the imagined and the experienced [4].
Advanced technologies in gesture recognition and “mixed reality”—digital environments that embed both physical and virtual objects [19]—create new opportunities to design immersive and interactive educational environments that are responsive to the embodied nature of human learning. Lindgren and Johnson-Glenberg [5] have emphasized the importance of aligning physical actions with concepts and creating meaningful collaborative interaction. Abrahamson and Lindgren [2] have discussed challenges that are relevant to activities, materials, and facilitation for the pedagogical design of embodied environments. They argue, first, that initial activities should focus on relatively simple tasks with straightforward execution within a familiar physical context. Second, these environments should be designed such that tangible connections to the materials in the environment emerge over time through targeted feedback and gradually increasing activity complexity. Third, to facilitate productive embodied actions, learners should be guided or cued toward more expert actions and perceptions, and given time to reflect on how their body is affecting the system. More recently, DeSutter and Stieff [4] outlined three design principles for embodied learning environments, emphasizing the inclusion of instructional scaffolds that clearly connect embodied actions and spatial entities, the leveraging of embodied actions to simulate high-fidelity spatial concepts especially for unseen phenomena, and the link with innovative tools such as visualizations.
Along with the established design practices, research has begun to show the benefits of embodied interactions with emerging technologies. For example, Johnson-Glenberg et al. [7] demonstrated the learning benefits of environments that they termed Embodied Mixed Reality Learning Environments (EMRELEs). The particular EMRELE that they investigated was SMALLab, which is a platform that engages students through visual, auditory, and kinesthetic modalities to learn concepts in chemistry. Compared with students in a “low” embodiment condition, students in the SMALLab condition showed higher learning gains in physics. Another study embedded middle school students in a whole-body interactive simulation of planetary astronomy called MEteor that allowed them to learn through enacting their predictions of how objects move in space. Lindgren et al. [8] examined students’ learning and attitudes about science, and found that students in the whole-body intervention showed higher learning gains and engagement compared with students in a control condition that used a desktop computer version of the same simulation.
A growing number of developments in embodied learning have contributed to establishing embodied design strategies and developing learning measures that so far have been significantly varied. In this study, we explore how learning occurs in a science simulation by investigating the different interaction metrics generated as students attempt to make sense of the cross-cutting science concepts of scale, proportion, and quantity.
1.2. Embodiment and Multimodal Learning
Gesture has shown to play a pivotal role in how students express and even construct their ideas, with the use of gesture even more critical in content domains that rely heavily on abstract concepts and formalized representations [20,21,22]. Science education is one such domain, and an embodied and multimodal approach has shown to be valuable in aiding student’s synthesis and explanation of abstract concepts (e.g., Ibrahim-Didi et al. [12]). For example, Crowder [23] investigated the role that gesture played for student explanations in a classroom context on the topic of seasons, and argued that gestures are used not only for students to transmit existing knowledge, but further construct an explanation. Embodied learning draws on and enhances the synthesis of common instructional modalities with salient connections to the learners’ own motoric and perceptual systems to produce strong connections to abstract concepts and metaphors encountered during instruction [24].
One instructional approach that is aligned with the core tenets of embodied learning is multimodality. Multimodal instruction emphasizes the value of effectively integrating representations of content across multiple sensory modalities to facilitate understanding and discourse [25,26,27,28]. These modalities can take on many forms, and while classification varies, Prain and Waldrip [29] provided a broad framework: descriptive (verbal, graphic, tabular), experimental, mathematical, figurative (pictorial, analogous, or metaphoric), and kinesthetic (gestural). Early research indicates that an instructor’s verbal and non-verbal immediacy behaviors are positively related to student motivation to learn (e.g., Frymier [30], Richmond, Gorham, & McCroskey [31]). Andersen [32] provided a list of non-verbal immediacy behaviors including eye gaze, smiles, nods, relaxed body posture, forward leans, movement, gestures, vocal variety, and proximity. Recent studies of non-verbal immediacy found that there was a positive effect on students’ perception of learning and level of motivation, but only a small correlation with performed cognitive learning [33,34,35]. Márquez, Izquierdo, and Espinet [36] highlighted the critical role of the instructor in facilitating the integration of these modalities in a seventh grade science classroom exploring the water cycle: “Whereas speech introduces and identifies the entities, gesture locates them and dynamizes processes. Visual language, through the diagram, provides a scenario, and through arrows, facilitates the establishment of functional mechanisms that are necessary to construct an explanation of water circulation in nature.” (p. 223).
Multimodal sense-making through the creation of complex representations has also been shown to enhance learning [27]. Comparative work by Ainsworth and Loizou [37] and Ainsworth and Iacovides [38] found increased learning gains when students were asked to self-explain a concept while transferring across modalities (e.g., drawing a diagram based on text or writing a text based on a diagram). Promoting a student’s self-expressive verbal representation of their learning has also shown to have benefits when combined with visual modalities such as diagrams or written text [39,40]. In this paper, we elaborate on the significance of embodied learning as a resource for sense-making in all forms of interactions that occur in interactive learning environments. We propose that the examination of multimodal interactions is of great relevance to enhance embodied learning experiences and inform the design of embodied learning environments.
1.3. ELASTIC3S
The embodied learning simulation environment that we focus on in this paper is called ELASTIC3S (Embodied Learning Augmented through Simulation Theaters for Interacting with Cross-Cutting Concepts in Science). The ELASTIC3S platform attempts to cultivate understanding of a range of science topics that are fundamentally connected to the “cross-cutting concepts”, which is one of the core components described in the Next Generation Science Standards in (NGSS) in the US [1]. These seven concepts were articulated to promote a more cross-content framework, bridging STEM disciplines throughout K12 education. The cross-cutting concept of “scale, proportion, and quantity” was the lens employed in the design of a pair of simulations focusing on scale and magnitude. Both simulations shared the same user interface components (graphs showing logarithmic scales, gesture controls), but one focused on earthquakes (the Richter scale) and the other focused on acidity and basicity (the pH scale). Preliminary studies of student interactions with these simulations have shown promise; students who interacted with the embodied simulations showed significant learning and concept transfer gains compared with students who received traditional educational materials on the same topic [41]. In this paper, we will be looking specifically at the interactions that students had with the earthquake simulation as they explored the cross-cutting concepts of scale, proportion, and quantity via the Richter scale. The goal is to better understand the kinds of multimodal interactions that students have with an embodied simulation, and develop metrics that can inform the specific design features of these kinds of environments.
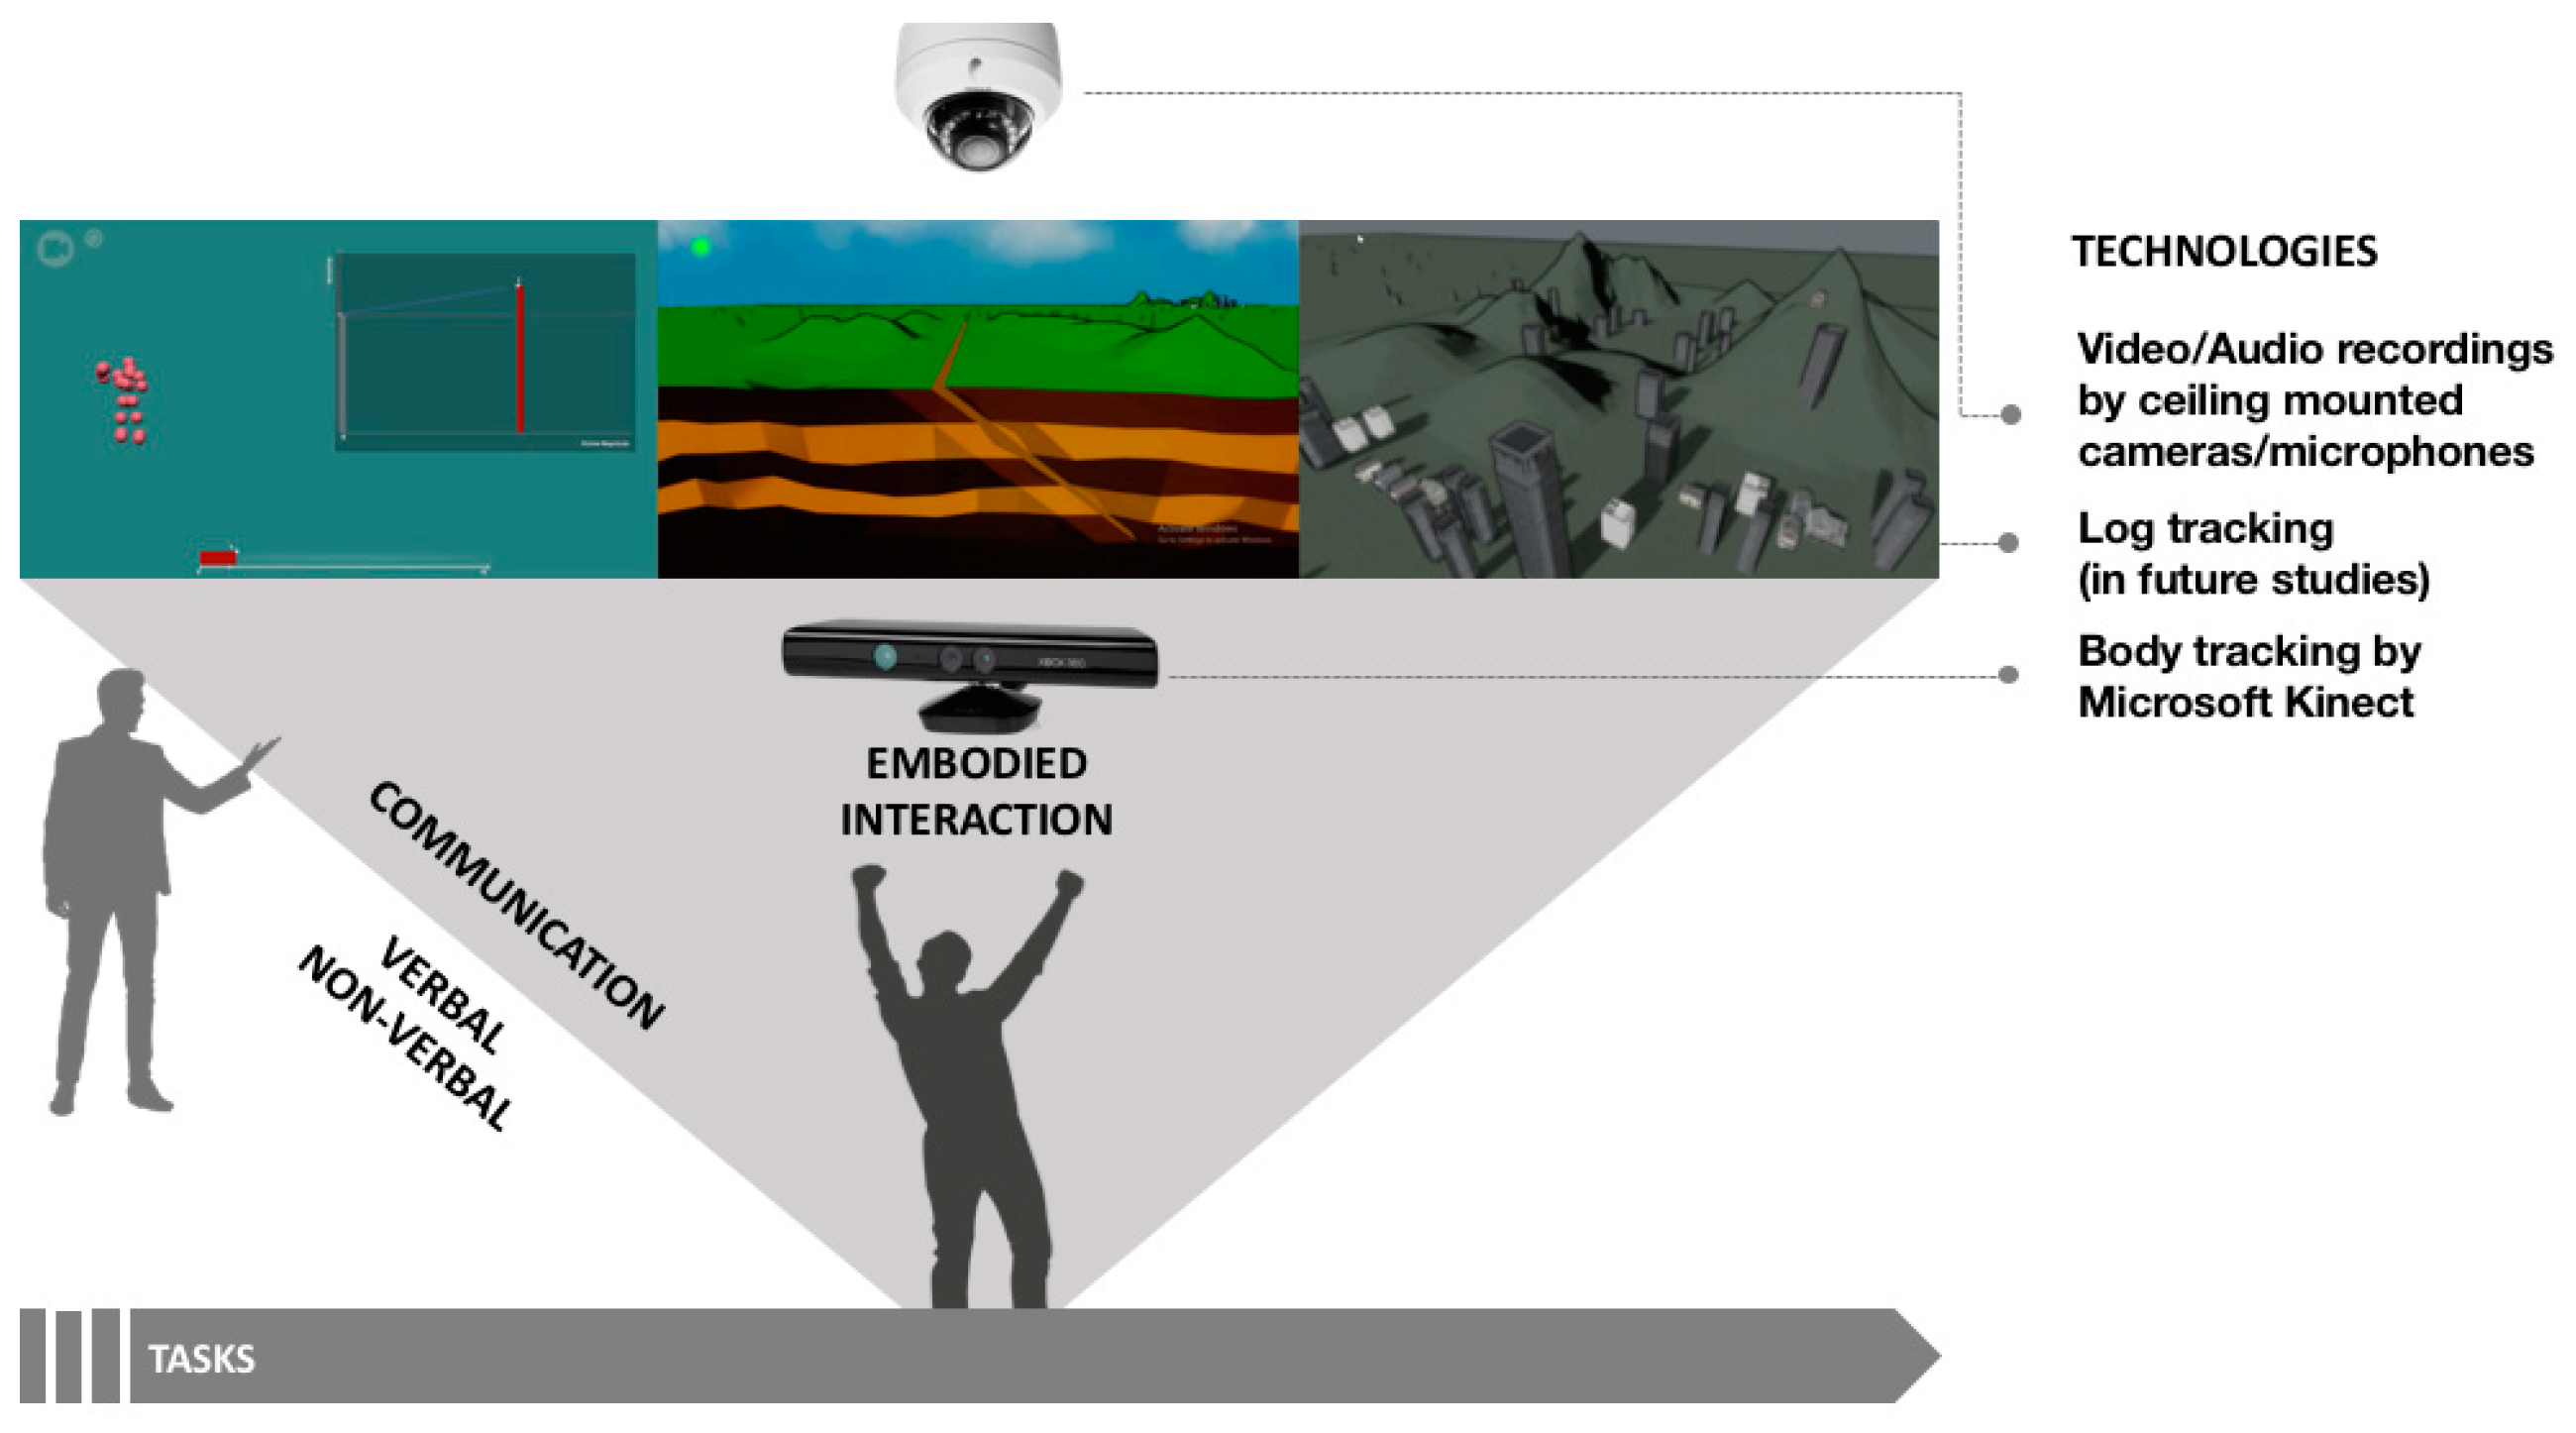
All of the simulations developed for the ELASTIC3S platform utilize a flexible multimedia laboratory space (see Figure 1) that utilizes screens, projectors, microphones, video cameras, and body tracking sensors to facilitate unobtrusive data collection while users are immersed in a simulation.
The earthquake simulation is designed in the Unity game engine utilizing the Microsoft Kinect V2 body-tracking sensor (Microsoft Corporation, Seattle, WA, USA). This device allows for interaction in three dimensions without the need for additional equipment worn by the student (see Figure 1b). To facilitate gestural input, the simulation utilizes a hybrid hierarchical hidden Markov model algorithm, which allows for robust gesture tracking and rapid training [42].
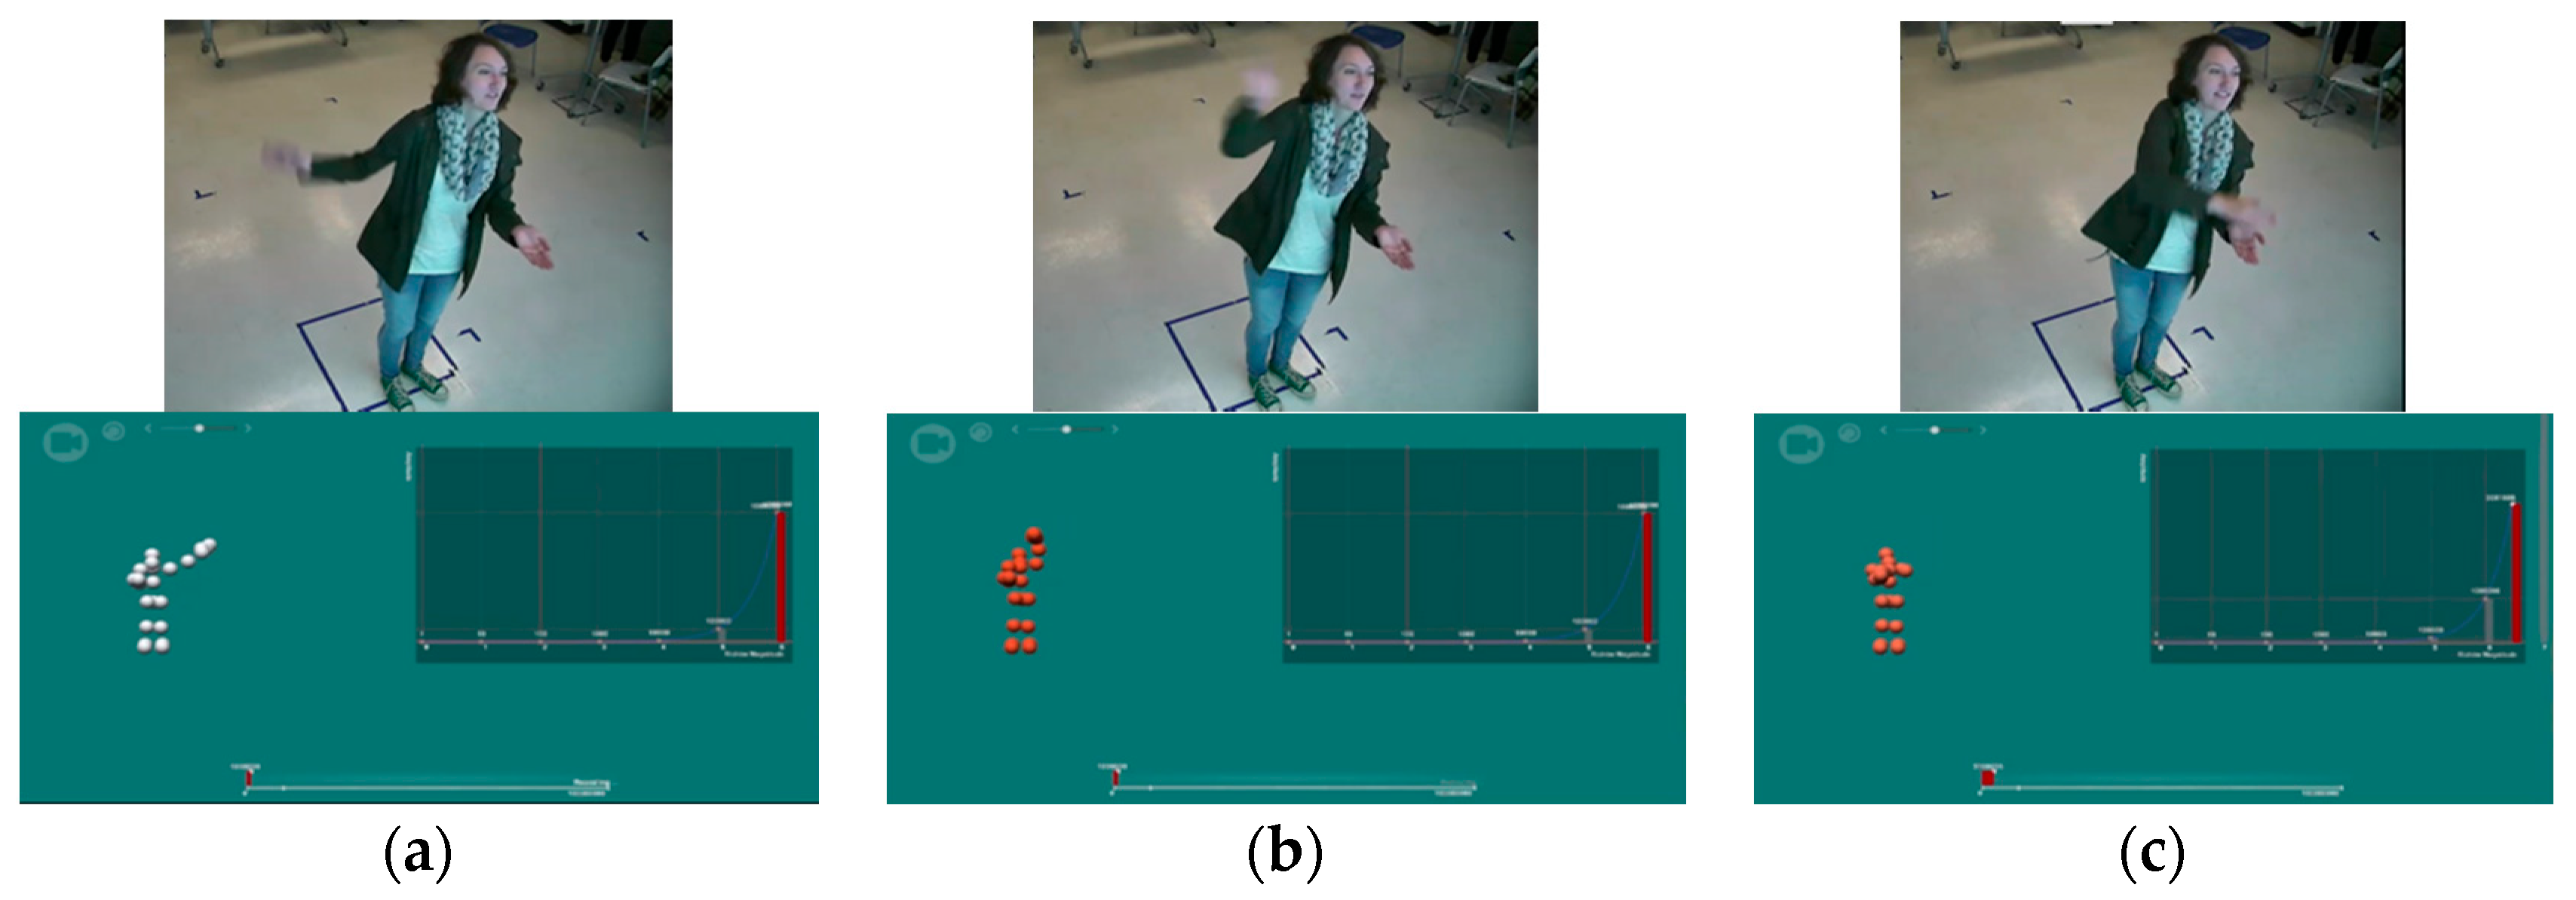
In the simulation, students are presented with a task that requires them to reach a certain numerical quantity using gestural inputs for four mathematical functions (+1, −1, ×10, and ÷10) while being given as much time as they need to perform the quantitative operations required to reach the goal. While the gesture recognition system can utilize any sequence of body motions to map each of the four mathematical functions, early pilot interviews with participants identified promising physical metaphors that resonated with students’ intuitions about mathematical operations (e.g., stacking duplicates of a quantity on top of itself to represent multiplication) [43]. So, while participants had the flexibility to represent them in their own way, they were prompted with the following metaphors: “add one” as stacking one cube on top of a pile, “subtract one” as kicking a cube off the pile, “multiply by 10” as stacking a column of nine cubes on top of a single cube, and “divide by 10” as splitting one’s legs and extending one leg outward as though a stack is being split into smaller groups (see Figure 2). In addition to mapping nicely onto accessible metaphors, this gesture framing had some practical benefit as well, such as mapping each function to a different quadrant of the body, and priming gestures that we knew could be recognized well by Kinect. Before students address the earthquake-specific content, the system is trained to better recognize individual variations in degree of movement, body size, and other idiosyncrasies of a participant. In the “training” phase, students record and practice utilizing their gestures in the context of simply creating a certain number of cubes, and then they later use these same operations and gestures to reach target earthquake magnitudes. If any recognition errors are encountered during this phase, gestures can be re-played within the simulation for reference, or easily re-recorded at any time. When a gesture is recognized, the skeletal representation in the game flashes, providing immediate feedback to the student that their actions are being detected. The goal in all of the phases is to find the most efficient way to reach the target (e.g., 234 cubes, a Richter scale magnitude of two) in any combination of the four gestural operations: addition (+1), subtraction (−1), multiplication (×10), and division (÷10)). If at any time a student introduces an error in their gestural sequence, they can always utilize a complementary gesture (such as ÷10 to counteract and erroneous ×10) to undo an action and try again.
In the training phase where students are creating cubes, students are initially given straightforward objectives to gain familiarity with the system (i.e., create five cubes). The tasks in the training scenario gradually increase in complexity, culminating in a task that requires multiple sequenced gestural inputs (i.e., make 431 cubes). Students then transition to the science learning tasks, where the focal quantity students that manipulate is presented through the lens of an earthquake (the amplitude of seismic waves, re-imagined as cube-based “amplitude units”). The user interface of the simulation is spread across three large projector screens, with each screen attending to a different element of the knowledge-building process (see Figure 3). The left screen provides real-time skeletal tracking feedback to the participant, a Richter magnitude, and an earthquake wave amplitude graph, as well as a “base bar” along the bottom. The base bar resizes dynamically with gestural input from the participant, and acts as an additional concrete representation of the size of a change initiated by a gesture, working in concert with the amplitude graph. The center screen displays a cross-sectional view of a reverse tectonic fault; when triggered by the interviewer after a participant has reached a goal amplitude, the plates at the fault line visibly slip and send out visualized ground waves that spread across the screen. The right screen shows a detailed view of a small city, and acts as a visual representation of the magnitude of an earthquake and the resulting damage caused to the buildings (shaking and/or falling apart).
Following the same gesture scheme of the cube-training scenario, students start with a straightforward task (i.e., create a magnitude 2 earthquake, which corresponds to 100 amplitude units, 102). Moving through subsequent tasks, the complexity of both their gestural inputs and conceptual understandings is progressed as they become more acclimated with the system. For example, a particularly challenging task is when the simulation asks students to set the amplitude of the seismic waves to create a magnitude 3.5 earthquake. To solve this task, students must estimate the actual amplitude of a magnitude 3.5 earthquake (approximately 3160) based on the graph that they have utilized in the previous two tasks (create a magnitude 2 and 3). The non-linear nature of the Richter scale as visualized through changes in the amplitude graph supports student reasoning that the amplitude of a 3.5 earthquake is not halfway between amplitudes 3 and 4 due to the exponential nature of the scale. Throughout the entire task set, from a magnitude 2 to a magnitude 8, students are confronted with the exponential nature of the Richter scale.
This study is particularly interested in the different multimodal interaction metrics that are generated as students attempt to make sense of the cross-cutting science concepts of scale, proportion, and quantity using a personalized gesture scheme. The purpose of the study is to explore the diverse types of interactions that are currently occurring in the learning environment and identify significant interaction metrics to understand student learning and relevance for future data collection, analysis, and the design of embodied learning environments. Our specific research questions are:
- What multimodal interaction metrics are available to capture student behavior as they engage with cross-cutting science concepts within an embodied learning simulation?
- How does the multimodal learning environment allow students, or not allow them, to progress in their understanding of non-linear growth?
2. Materials and Methods
2.1. Participants
Twenty-four undergraduate students (female = 18, male = 6) from a large midwestern university participated in the earthquake interview and simulation tasks. Of these 24 students, 58% were white, 17% were Asian/Asian American, 20% preferred not to answer, and the rest consisted of two or more race groups/unreported. All of the interviews and simulation tasks were both audio and video recorded for later analysis. Before participating in a simulation session, a video recorded one-on-one interview was conducted. Through an increasingly complex series of questions, students communicated their pre-simulation conceptions of earthquakes, the Richter scale, and the mathematical relationship between Richter magnitude and earthquake amplitude. During the simulation, students were presented with a series of tasks guided by an interviewer. After completing the simulation, students were again interviewed and given the same opportunities to communicate their conceptions.
2.2. Data Sources
2.2.1. Conceptual Measures
During the pre-tests and post-tests, students were asked to solve problems requiring them to contrast linear and exponential growth for the earthquake topic. For example, comparing the change in amplitude when moving between earthquakes of varying magnitudes (e.g., evaluating the change from a 2.0 to a 5.0 compared to a 5.0 to an 8.0). Then, students were asked to contrast linear and exponential growth in a new context such as: “Which restaurant chain do you think will have the most restaurants in 12 years, assuming Restaurant A plans to open 3000 restaurants every year, and Restaurant B is going to start with one restaurant and then triple the number of restaurants every year?” Students’ answers to the pre-tests and post-tests were scored for correctness and the level of sophistication of their reasoning. Four independent raters scored each student’s understanding of exponential growth during pre-tests and post-tests with an initial 75% agreement. Any disagreements between the raters were resolved through discussion until 100% agreement was reached.
2.2.2. Simulation Metrics
To analyze students’ use of the simulation, we segmented the videos according to each of seven selected tasks: two tasks from the training cube simulation—make 234 and 431 cubes (hereafter C234, C431)—and five tasks from the earthquake simulation—obtain a Richter scale of 2.0, 3.0, 3.5, 7.0, and 8.0 (hereafter R2, R3, R3.5, R7, R8). Three researchers coded the segmentation of the simulation use videos in terms of (1) time spent on gesture development (i.e., duration between when a task was given and when a student started gesturing; hereafter GD), (2) time spent on gesturing (i.e., duration between when a student started gesturing and when a target quantity (the number of cubes or the size of seismic activity) was submitted; hereafter G), (3) the number of gestures, and (4) the submitted quantity for each task. In addition, through the series of simulation tasks, students were challenged to not only manipulate their gestural inputs, but also verbally communicate their conceptual understandings. Students’ answers to the conceptual questions during the simulation were scored for correctness of their reasoning.
2.3. Methods
We take a sequential explanatory design approach [44] with an initial quantitative phase followed by a qualitative phase. To address the first research question, we conducted Pearson correlation analyses to identify any relationships between the metrics that were generated as students interacted with the simulation. In reporting the results, we followed the guidelines from Evans (1996): an r value of 0.00–0.19 is “very weak”, 0.20–0.39 is “weak”, 0.40–0.59 is “moderate”, 0.60–0.79 is “strong”, and 0.80–1.0 is “very strong”.
To address the second research question, we selected four students to more closely examine the ways in which student reasoning seemed to be supported by the embodied learning environment. We employed a multiple case study design [45] to draw out the potential effects of an embodied simulation by comparing the ways that their reasoning did or did not improve as a result of the simulation phase. To avoid biases from interviewer characteristics such as style and experience, four students who were interviewed by the same interviewer were selected for the case analysis [46]. The four students were identified by matching cases based on their exponential knowledge on the pre-test: Alyssa, Gabby, George, and Rhiannon. Alyssa (3) and Gabby (2) scored low on their exponential knowledge pre-tests, while George (12) and Rhiannon (11.5) scored high on their pre-tests among 24 students (M = 9.35, SD = 4.77). The matched cases allowed us to do a more in-depth, qualitative analysis of how the multimodal learning environment could support student reasoning and impact their learning of exponential growth concepts.
Each of the four case videos was coded for multiple dimensions of student and interviewer interaction using Datavyu qualitative video analysis software [47]. Guided by the recent emphasis on the examination of multimodal interactions (e.g., Birchfield et al. [25], Flood et al. [27], Pogue & Ahyun [33]), we initially observed the selected videos in order to characterize the types of multimodality that students experience in the embodied learning environment; that is, verbal and non-verbal interactions.
For each of the cases, the verbal interactions between the student and the interviewer were coded. Table 1 shows the sample code dialog. After reviewing the rough transcripts of the videos, verbal interactions were grouped into three categories: query (questions from the student or interviewer), clarification (supporting statements from the interviewer to the students during tasks), and utterance (responses or other verbalizations from the student). For both “query” and “clarification”, each verbal interaction was also coded for additional context, indicating that the code was related to “content” (earthquake or exponential content), “simulation” (simulation design features), “gesture” (gestural elements or conventions), or “task” (task procedures). Student utterances were also context-coded as either answers to an interviewer (answer), statements of doubt or uncertainty (uncertainty), verbalizing their thought process (thinking aloud), and verbalized indicators of success (success).
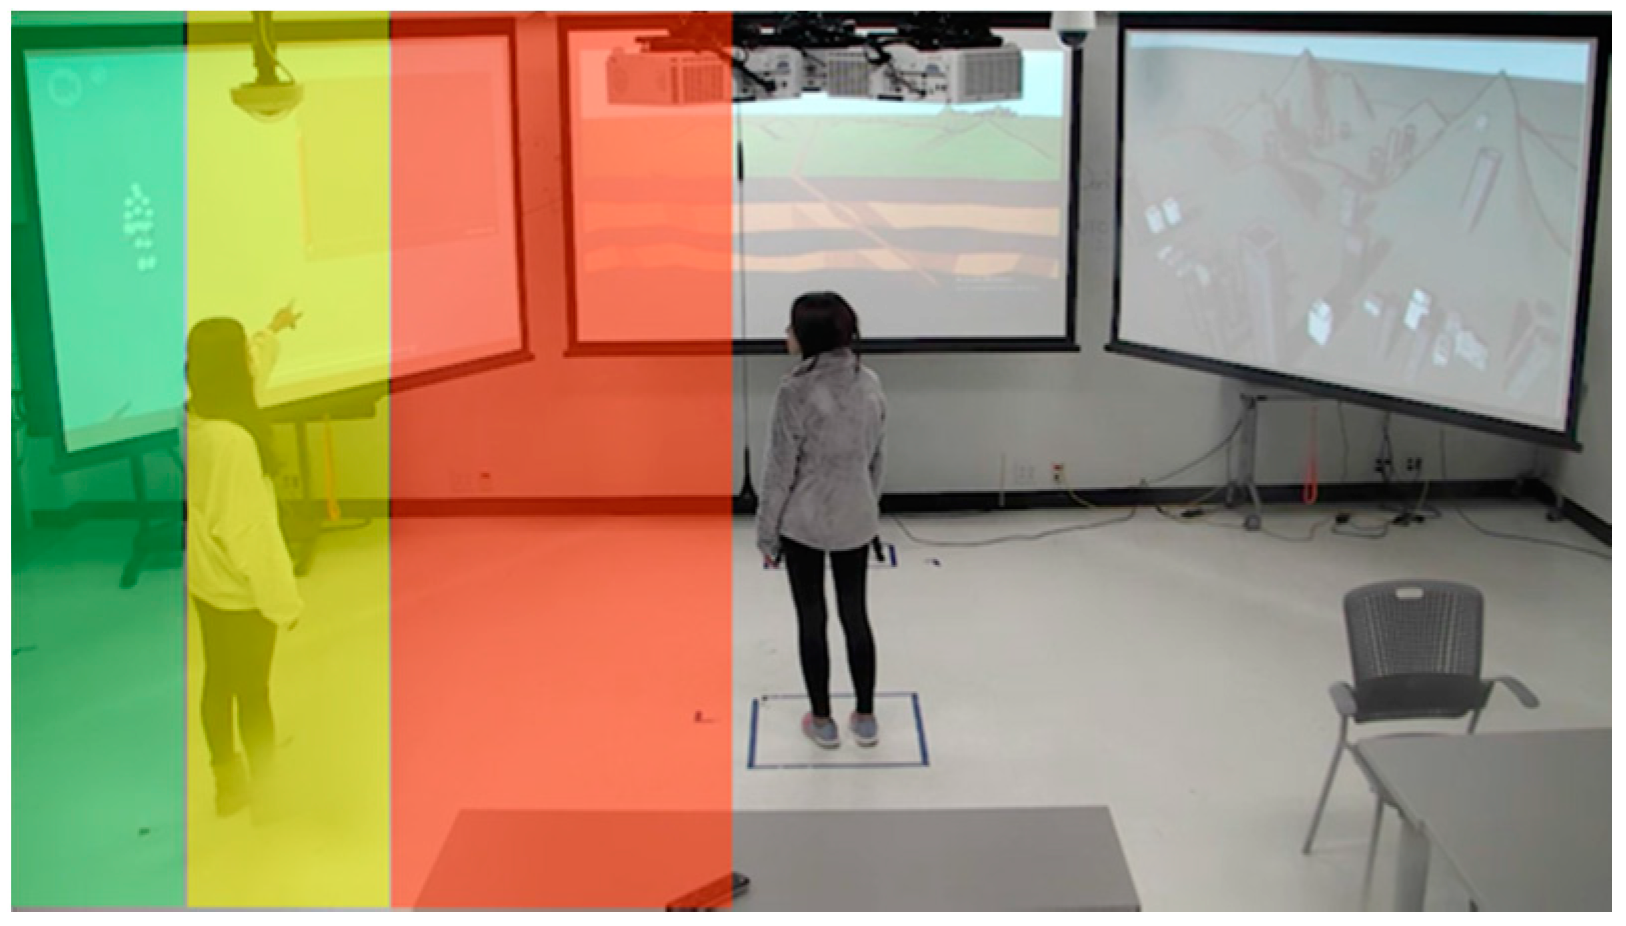
Finally, we then coded non-verbal interactions between the student and the interviewer. We were looking for different types of non-verbal interactions (e.g., facial expressions such as smiles, nods, proximity [32]) during the initial review of the rough transcripts of the videos. This initial analysis showed that physical proximity of the interviewer to the student was particularly notable and may have been related to other student behaviors. Based on this observation, we formalized a coding scheme for describing physical proximity using a color-coded reference video frame shown in Figure 4: “green” (far), “yellow” (mid), or “red” (near). The reference frame zones were determined based on initial video observations and were designed to keep a radius of consistent proximity from left to right of the student and distance from the simulation screens. All of the Datavyu codes were exported using video frame time codes for further analysis.
3. Results
3.1. Relationship between Embodied Interaction Metrics
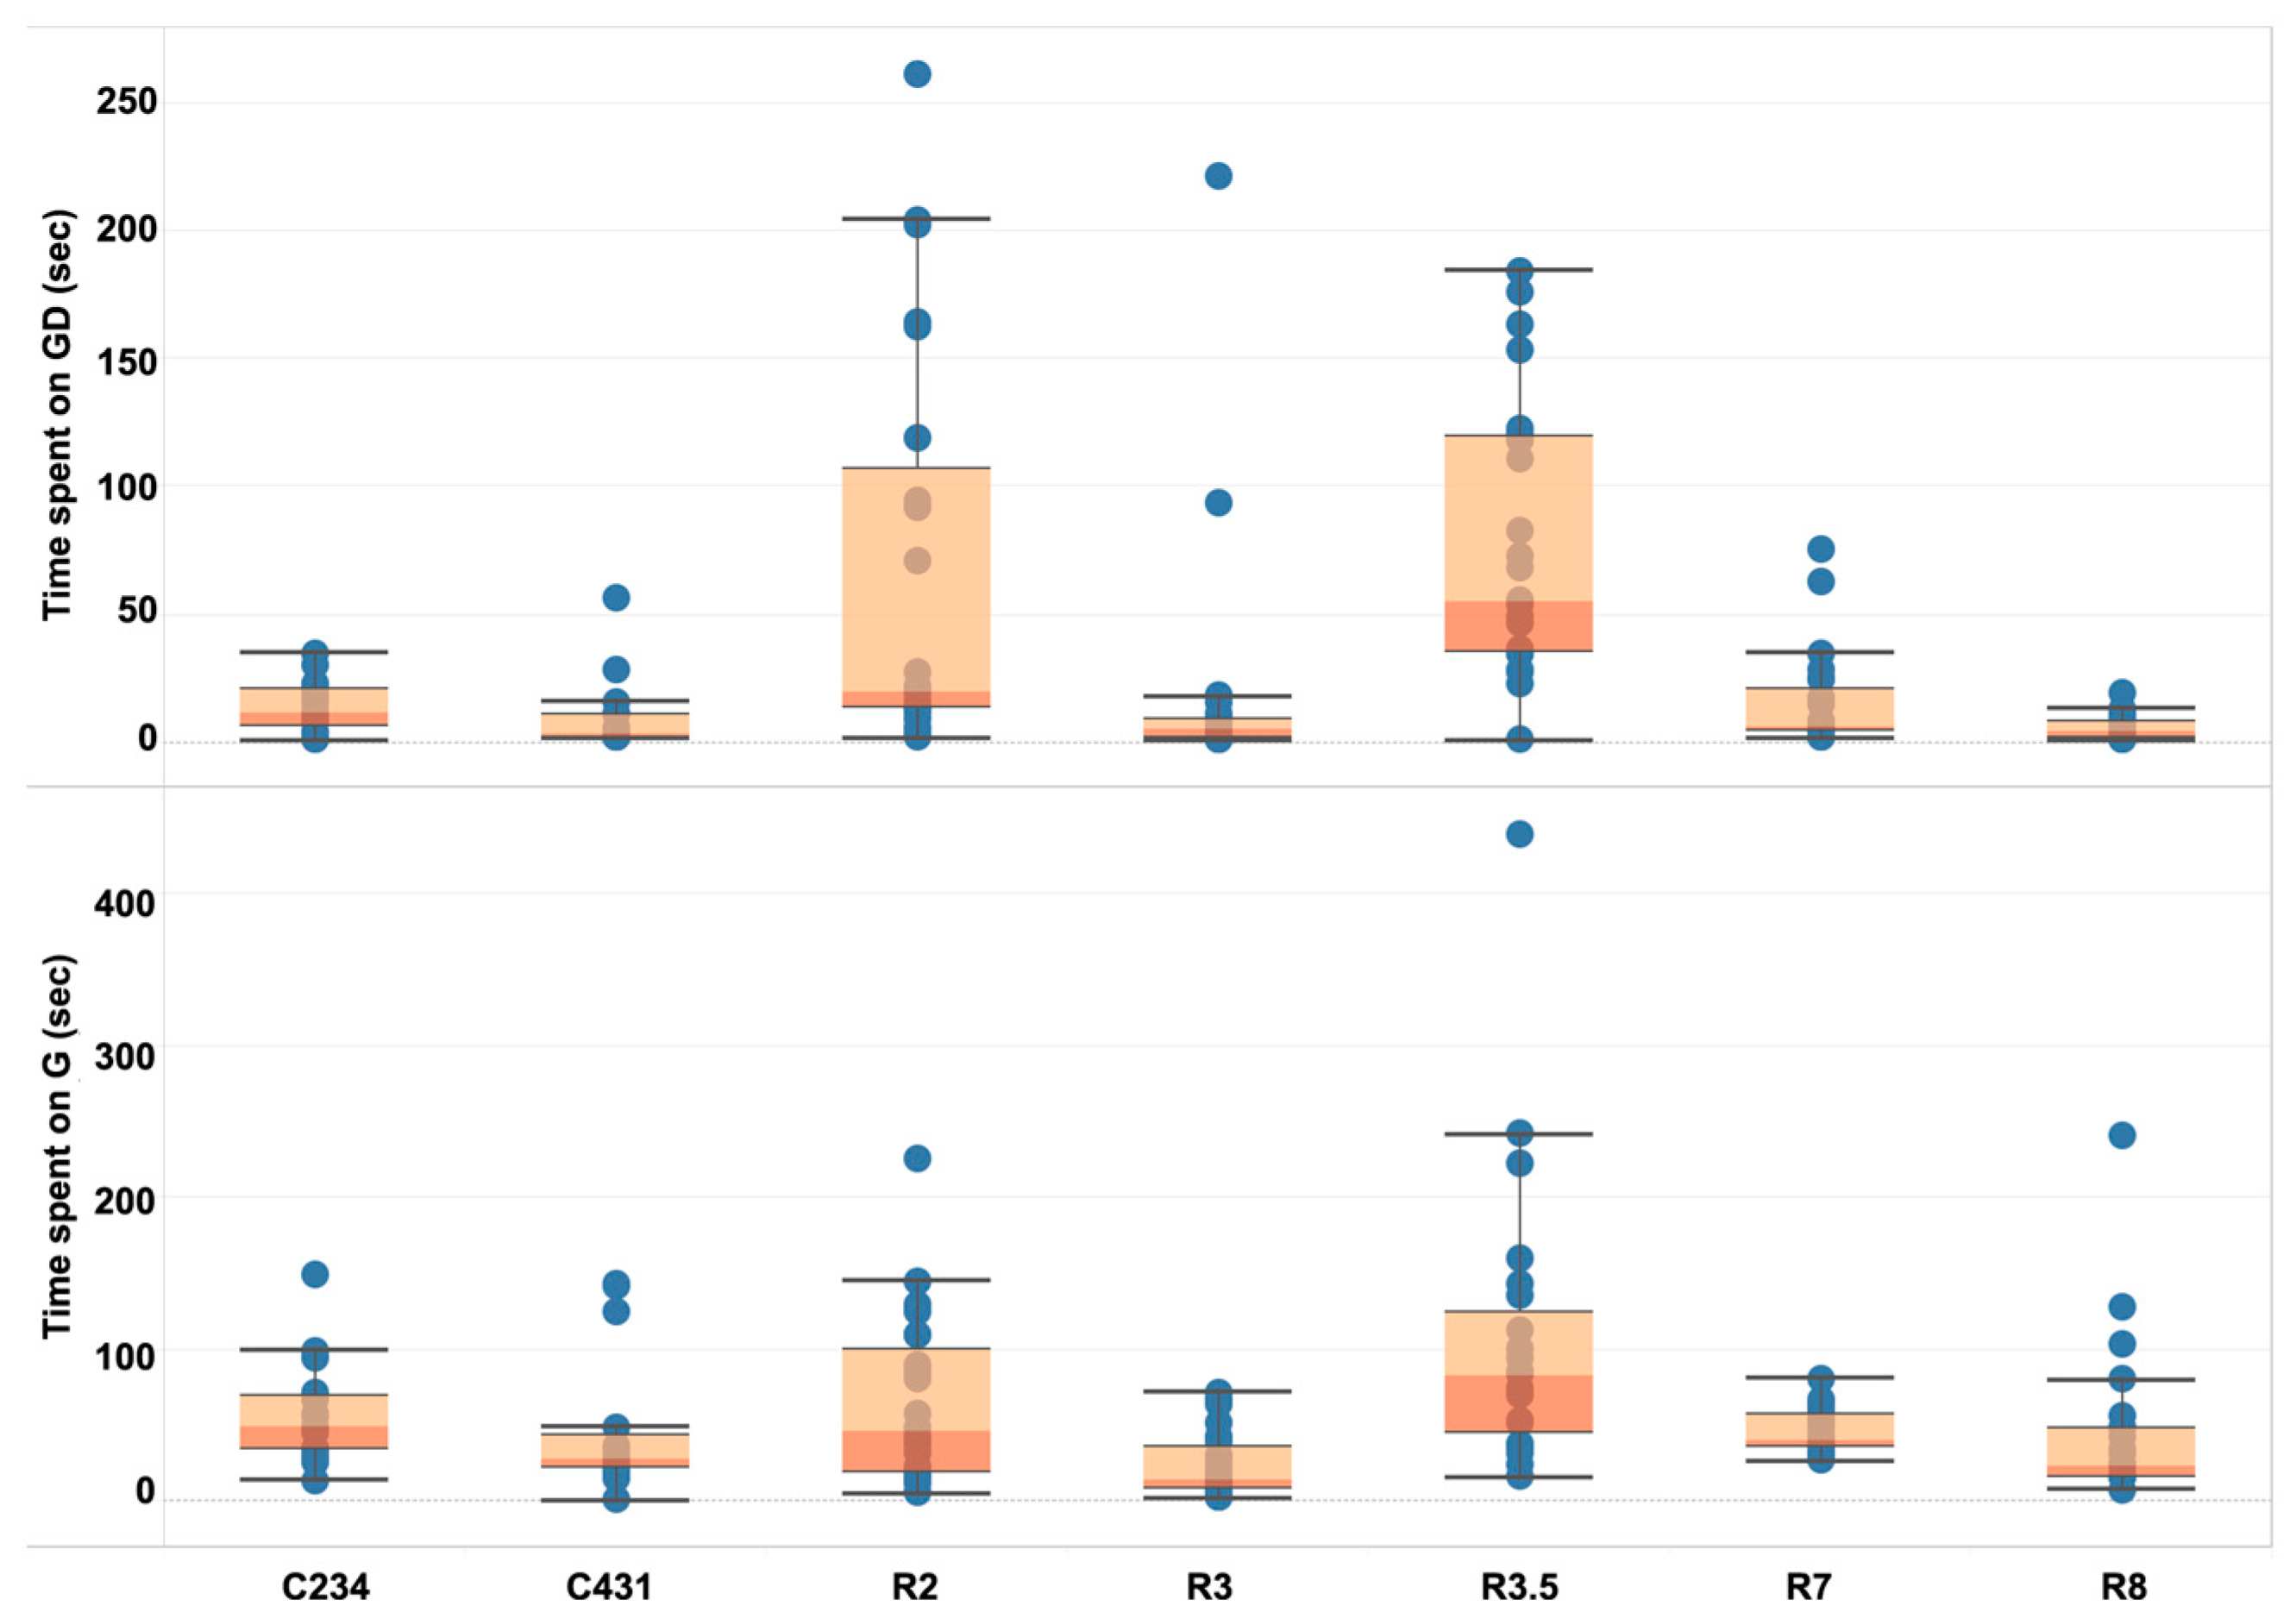
We investigated several interaction metrics that were generated as students used the embodied simulation such as the time spent on gesture development and time spent on gesturing. During the time spent on gesture development, students may be contemplating their gesture options and what the gestures mean, or making a selection. To better understand students’ gestural interactions within this environment, we first examined the overall patterns of students’ time spent on gesture development and gesturing of each task (see Figure 5). The boxplots of two tasks, R2 and R3.5, suggest that students spent time on gesture development quite differently during these tasks compared with the other tasks, which can be partly explained by task complexity: R2 as the first task of the earthquake simulation, and R3.5 as the most challenging task as explained in the ELASTIC3S section above. This is worthy of further investigation into the different factors leading to individual student gestural time.
We further examined the correlations of the following variables: time spent on gesture development, and time spent on gesturing on each task. The results of Pearson correlation analyses showed statistically significant relationships between the time spent on gesturing and the time spent on the gesture development of certain tasks (see Table 2). A strong positive relationship was found between the variables of time spent on gesturing on the first task of both the cube and earthquake simulation, in that the students who tended to spend longer gestural time on the first challenging task of the cube simulation (i.e., C234) also showed longer gestural time on the first task of the earthquake simulation (i.e., R2), in which students are challenged to apply their knowledge acquired during the training simulation to a new context.
Another strong positive relationship was found between the time spent on gesturing and gesture development during the same task (i.e., C431) in that students who tended take a longer time on gesture development also took a longer time gesturing. This strong relationship suggests the students seemed not to completely plan a strategy of how to reach the target quantity before starting a gestural input sequence, and instead spent time developing the next gesture in the sequence in the midst of the task. In the context of the task, this relationship is expected, as the emphasis is on students determining their own sequence of gesture using different math operations that were needed to reach a target quantity of 431 cubes.
In addition, a few significant relationships were found between the gesture development time of a task and the gesturing time of the subsequent task. First, the time spent on gesture development in the cube training simulation (i.e., C431) showed a significant positive relationship with the time spent on gesturing in the following task (i.e., R2; the first task of the earthquake simulation). In addition, for the time spent on gesture development in the most challenging task of the earthquake simulation, R3.5, a weak positive relationship was found with the time spent on gesturing the following task, R7. That is, students whose thinking process took longer before gesturing tended to spend more time gesturing in the following task. To further understand the relationship between the patterns of students’ gestural time and their learning gains on exponential growth knowledge was indicated in Figure 6. Interestingly, most of the students who showed a low gain score are positioned in the bottom left of the plot, which indicated that these students spent less time on gesture development and gesturing in these tasks. Further investigation is needed to see any causal relationship between embodied expressions such as the time spent metrics and learning gains in the future study.
The combined gesture development and gesturing time of each task was also examined to see the relationship with the number of gestures of each task. Noticeably, a significant positive relationship was found between the number of gestures of C234 and the combined times of the following tasks: a moderate correlation with C431 (r = 0.680, n = 23, p < 0.01), a weak correlation with R3 (r = 0.533, n = 23, p < 0.05), and a moderate correlation with R8 (r = 0.668, n = 23, p < 0.01). Since C234 is the first challenging task, the number of gestures can be an indicator of an individual student’s gestural strategy in that a lower number suggests a more efficient strategy, and vice versa. The results indicate that students who tended to make more gestures to get the target quantity (i.e., 234 cubes) had a tendency of taking more time on C431 in that they had trouble developing their own gestural strategy. The tasks in the earthquake simulation require students not only to decide the sequence of gesture using four different math operations, but also understand the relationship between a Richter magnitude and the amplitude of earthquake. In particular, the tasks of R3 and R8 are relatively straightforward. Therefore, students who made more gestures during C234 seemed to take a longer time to complete gestures during these two tasks and also have difficulties understanding how the Richter scale works overall.
An accuracy score of each task was calculated based on a submitted quantity of each task:
For example, while the correct answer for the amplitude of an earthquake that has a Richter scale magnitude of 3.5 is 3610 (i.e., target quantity), a student can submit what they think is the closest amplitude (i.e., actual quantity). The accuracy of the students’ submitted score on R3.5 (i.e., a Richter magnitude of 3.5) showed a significant correlation with their exponential growth knowledge communicated during the simulation (r = 0.543, n = 23, p < 0.01), indicating that R3.5 was a key indicator of students’ conceptual understanding.
3.2. Descriptive Cases
While the descriptive and correlation analyses showed overall patterns for students who participated in the embodied simulation condition, we were interested in more closely examining the ways in which students’ reasoning seemed to be supported by the multimodal learning environment. To achieve this, we selected four students to look at in more depth based on their exponential knowledge on the pre-tests: Alyssa, Gabby, George, and Rhiannon. The matched cases allowed us to do a more in-depth, qualitative analysis of how the multimodal learning environment could support student reasoning and impact their learning gains on exponential growth knowledge.
3.2.1. Gestural Time Spent
The time spent on gesture development and gesturing for each of the case students was compared with the average for the population via a normalized sigmoid function:
For example, a rate close to 0 indicated a longer time spent compared with the average of all of the students, a rate close to 1 indicated a shorter time spent, and a rate close to 0.5 indicated a similar time spent with the average. After examining four students’ different time spent trends using the sigmoid function, the combined gesture development and gesturing time was shown to vary across these students (see Figure 7).
This high-level analysis highlights the gestural ‘time spent’ outliers that invite further exploration with additional data modalities. All four students showed an overall similar pattern of gestural time. The shared time spent patterns across tasks indicated that more time was spent on R2 and less time was spent on R3.5. This pattern may have been influenced by the particular interviewer in these four sessions, who tended to allow the students to spend more time developing the most effective gestural strategies. Outside of this general pattern, there were two instances of decreased time spent: Gabby on C431 (a task involving an extended input sequence), and Alyssa on R2 (a short sequence task and the transition to the earthquake content). This finding will be discussed below in Section 3.2.4.
3.2.2. Proximity between a Student and Interviewer
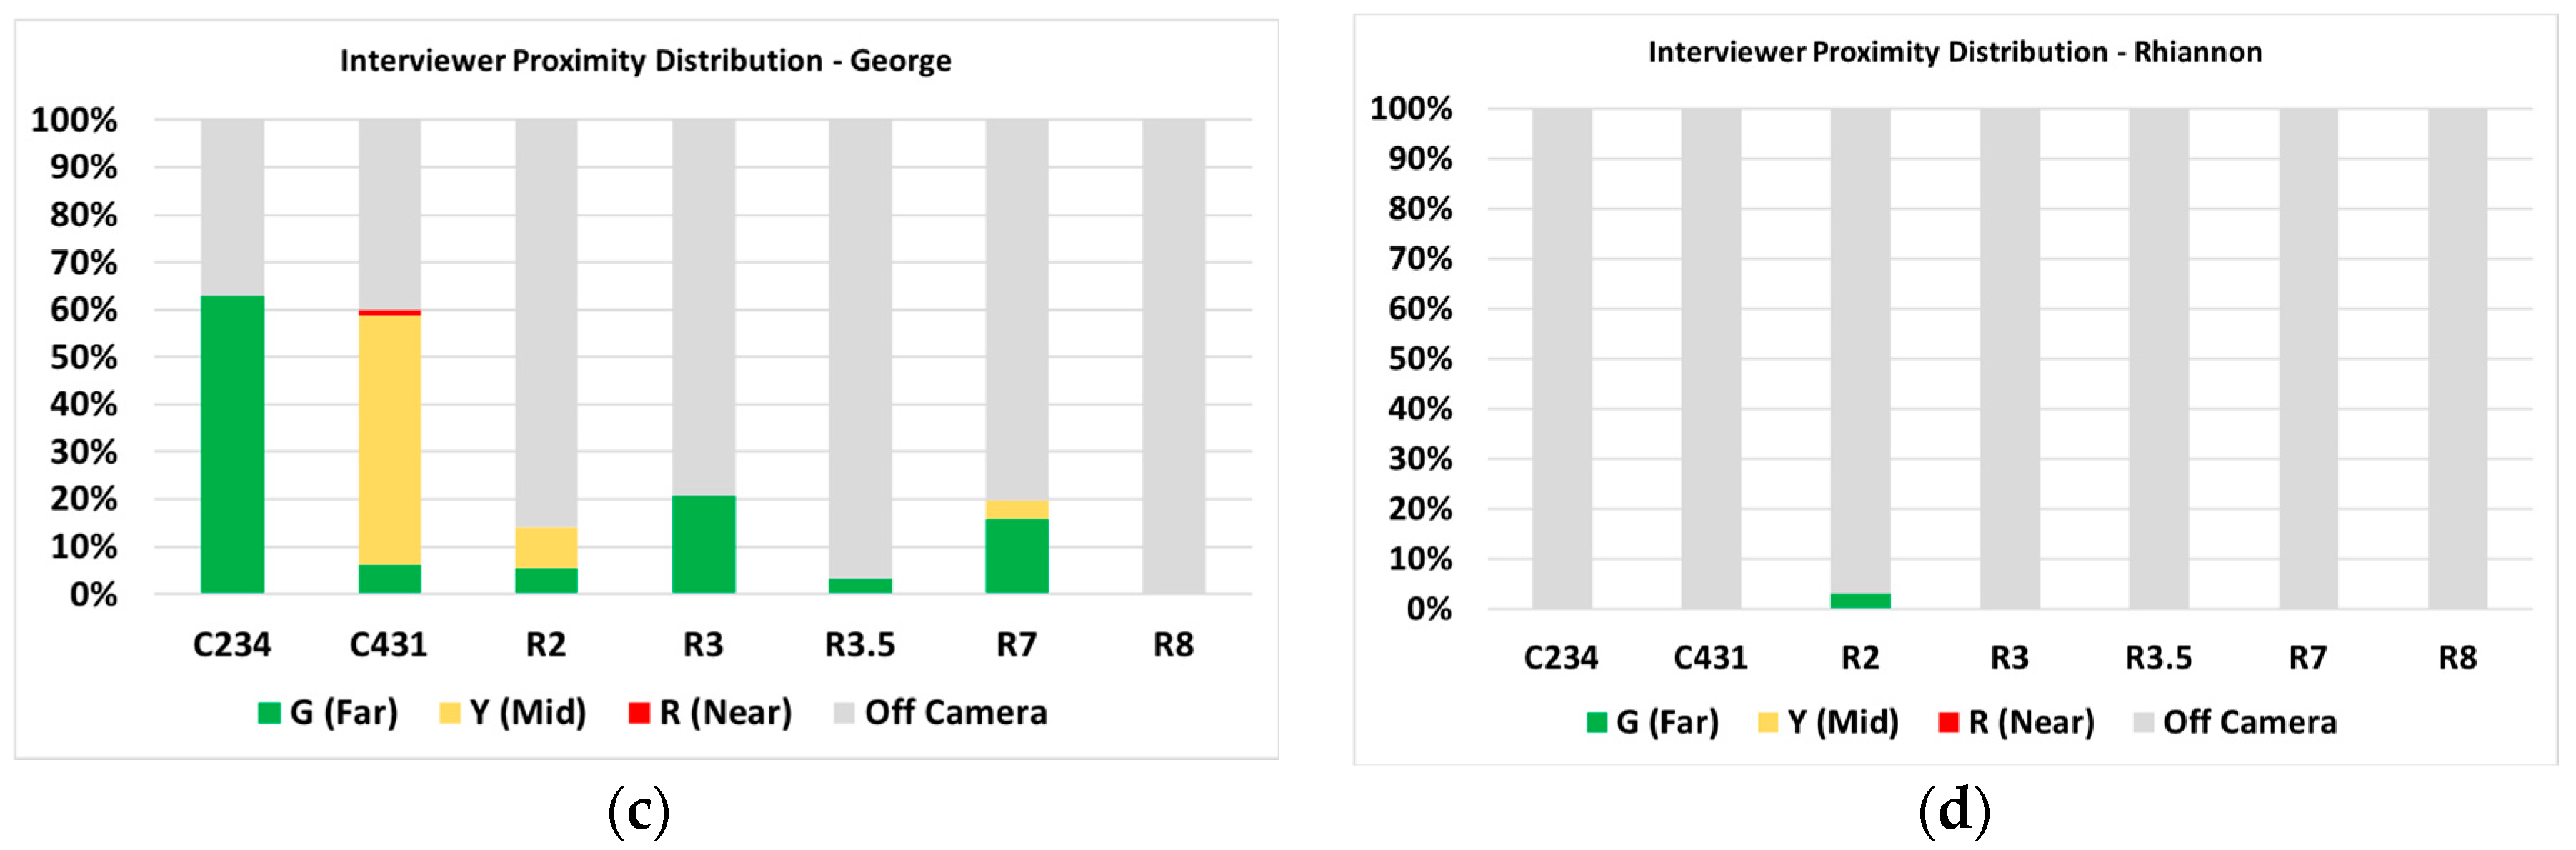
Using the coded proximity times, distributions of the interviewer’s proximity to the student were generated using the total video frames spent in each zone of the reference frame (see Figure 4). As shown in Figure 8, while the type of tasks performed by each student was identical, the interviewer leveraged proximity to varying degrees among the students. When compared with the student’s degree of growth on the exponential concept knowledge from the pre-test to the post-test, the students that showed the least amount of exponential concept gain were also those that had the interviewer in proximity for a larger portion of the total session time: Alyssa and George. Both students’ sessions also had a higher proportion of mid and near proximity time compared with Gabby and Rhiannon. The interviewer’s time spent in near proximity to each student is different between these four students; specifically, two students with a lower conceptual knowledge gain drew the interviewer’s attention over most of the task. This is expected in the type of interviewer–student relationship that was utilized in the sessions, with the interviewer providing conceptual as well as procedural clarifications.
3.2.3. Verbal Discourse
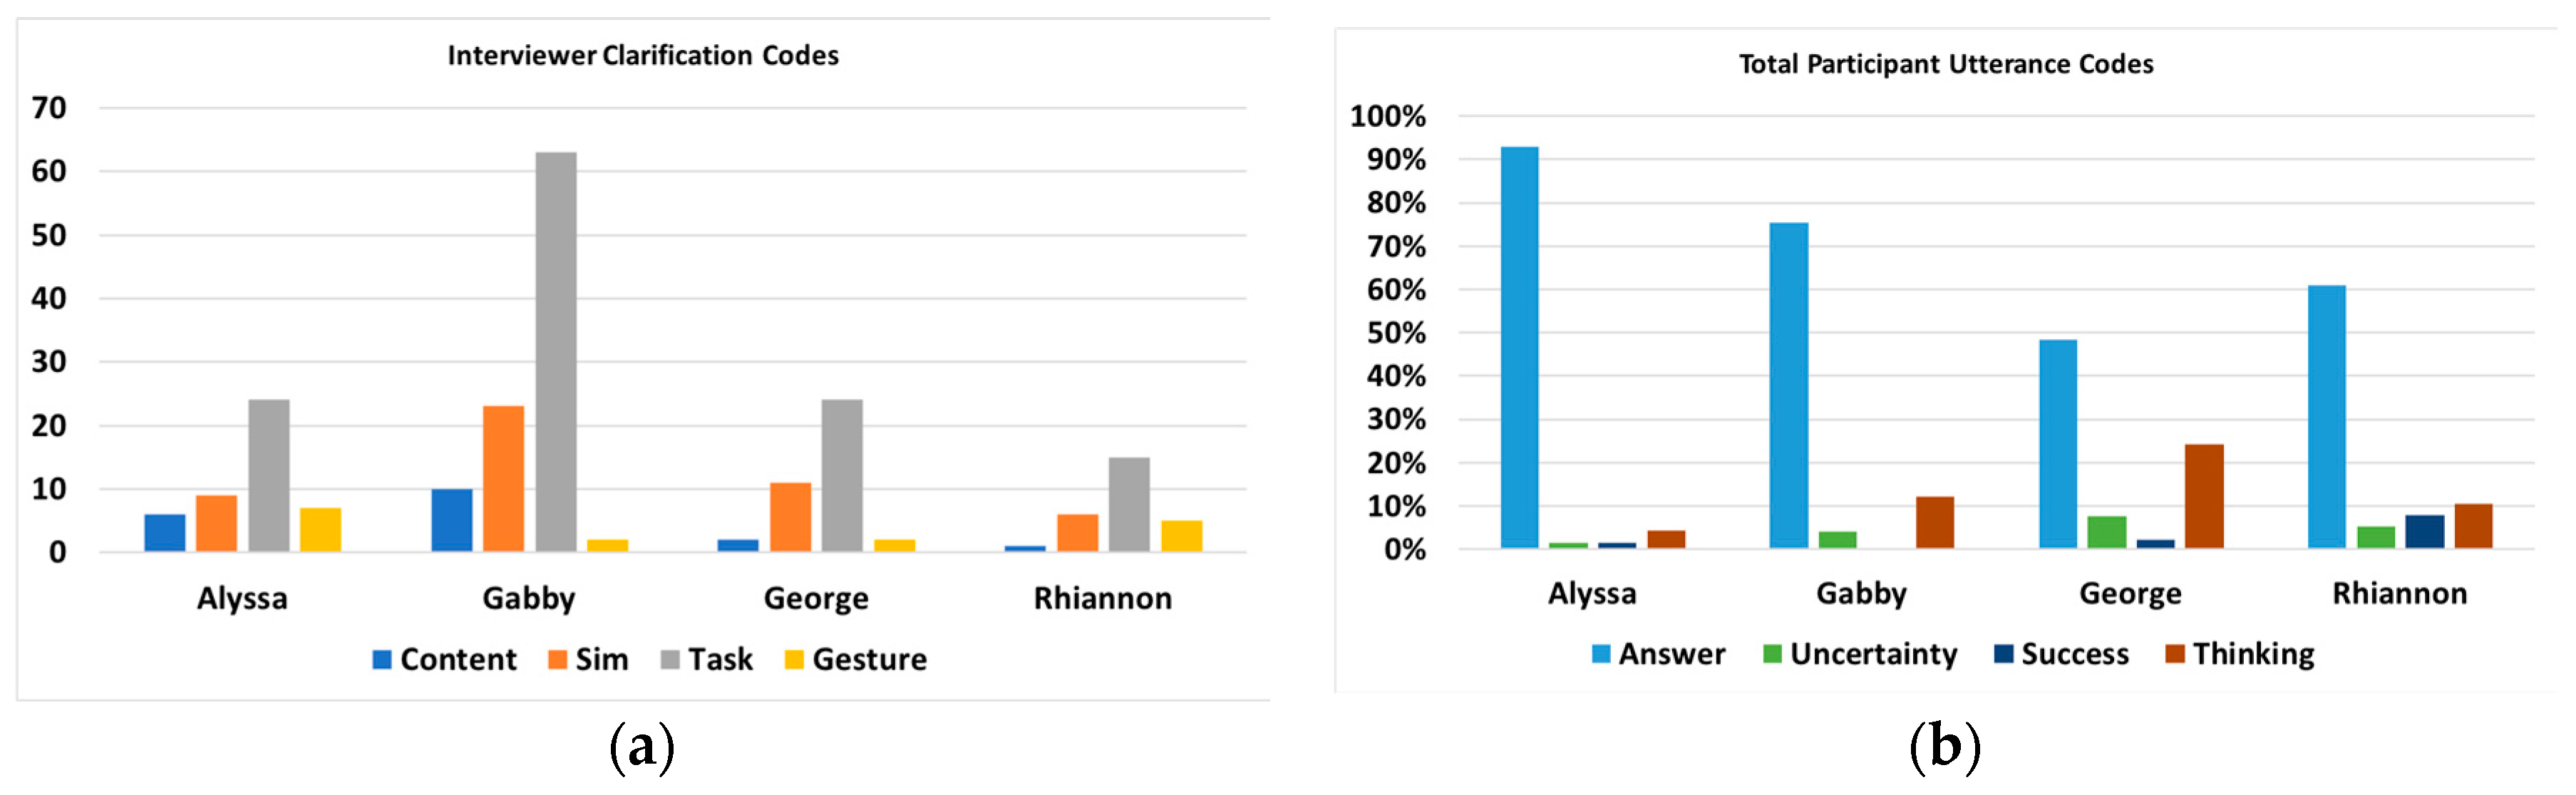
To examine potential relationships between the total amount of interviewer support and student learning gain, clarifying statements by the interviewer and utterances by the student were tallied. The distribution of clarifications and utterances shown in Figure 9 showed several noticeable patterns. While both Alyssa and Gabby entered the simulation sessions with low exponential concepts scores, only Gabby showed growth after completing the simulation. Compared with Alyssa, Gabby had a greater number of clarification interactions with the interviewer, which were primarily clarifications of the specific task and the simulation layout. Gabby also showed an increase in the amount of “thinking aloud” instances when compared with Alyssa. In contrast, George and Rhiannon showed a similar interviewer clarification distribution to Alyssa, but when examining their utterance codes, there was more diversity in their verbal communication.
3.2.4. Learning as Multimodal: Alyssa versus Gabby
Using the gesture performance metrics to aim the spotlight at specific tasks for more in-depth analysis, both Alyssa and Gabby were highlighted for their decreased gestural performance (i.e., longer gestural time spent) on single tasks (see Figure 7). In particular, these students represented different levels of exponential conceptual gain (Mconceptual_gain = 4.41, SD = 3.72, N = 23). Conceptual gain scores were calculated by subtracting the pre-test score from the post-test score. While two students in the high pre-test group showed a low to modest conceptual gain—George (conceptual gain = 2) and Rhiannon (conceptual gain = 4.5)—Alyssa and Gabby showed differences in their conceptual gain. Alyssa scored low (3) on her exponential knowledge pre-test, and showed no growth after interacting with the simulation, scoring a 3 on the post-test (conceptual gain = 0). Gabby also scored low on her pre-test with a 2, but showed learning gains in her post-test with a score of 8 (conceptual gain = 6).
From the coded verbal interaction for Gabby during task C431, several patterns emerged. C431 asked the student to reach a quantity of 431 cubes using their gestures for math operations. While the previous task was presented with the sequence laid out by the interviewer, in this task, the student had to decide the sequence of gestures needed to reach the target quantity on their own. Gabby needed more task-centered clarifications from the interviewer. Her utterances were also task-centric and included several instances of uncertainty and thinking aloud. This pattern of utterances was not seen again until R3.5, which was another long-sequence task, suggesting that she was struggling with planning out her gestural sequences, but showed improvement by R3.5. The interviewer did not utilize proximity to a significant degree during Gabby’s session (each task had the interviewer in proximity less than 35% of the time, and C431 was less than 20%). Table 3 shows the step-by-step clarification support that the interviewer provided Gabby as she worked through the gestural sequence that was needed to reach 431 cubes. It is possible that this level of interviewer clarification resulted from her “uncertain” and “thinking aloud” verbalizations, acting as cues to the interviewer to provide more direct support and contributing to Gabby’s learning gains despite her struggles with the task sequencing. Alyssa’s R2 performance showed a different trend. R2 in this simulation represents a content shift from the cubes simulation (where the goal is to reach a specific numerical goal) to the earthquake simulation. The task of making an earthquake of magnitude 2 is procedurally simple; it only requires two multiplication gestures from the student. However, it might be challenging for some students to interact with the simulation by applying their understanding of the non-linear relationship between a Richter scale and the amplitude of an earthquake. Alyssa showed the highest number of interviewer clarifications (the most for any task during her session) as well as a significant portion (60%) of the task performed while the interviewer was in at least “green” (far) proximity. However, while Alyssa frequently provided answers to interviewer clarification, she showed few verbalizations of uncertainty or instances of thinking aloud. This hints at a larger trend for Alyssa, as across all four case students, she received the most clarifications during R2, as well as multiple instances of gestural clarifications (reminders of how to interact or what can be communicated via the gestures). This showed a potential combination of both difficulty transitioning to the earthquake content, which was perhaps exacerbated by her struggles to interact gesturally with the system, and her lower rate of thinking aloud.
4. Discussion
4.1. Multimodal Interaction Metrics
The results of correlation analyses showed students’ gestural interaction patterns particularly during certain tasks of the simulations (e.g., C431, R2) and the significant relationship between students’ gestural performances of these tasks. A tendency to spend more time gesturing does not always indicate lower performance, suggesting the need to prime students to spend an adequate amount of time constructing and reflecting upon their gestures, particularly during more challenging tasks. Another critical indicator of gestural interaction is the number of gestures performed during a training task, which was in this case C234. This emphasizes the importance of an interviewer or other agent guiding students and confirming their understanding of the meaning of their gestural actions in the early stages of the simulation experience. The significant correlation between the students’ accuracy score of R3.5 and their exponential growth knowledge communicated during the simulation demonstrated that their performance on the most challenging task was a good indication of their overall conceptual understanding. These initial findings suggest possible critical metrics that represent archetypal gestural interactions that could act as indicators of behavior requiring just-in-time feedback. In these cases, real-time feedback may allow a student to take new actions, interpret the system in a different way, and therefore better understand cross-cutting concepts in science [2].
The analysis of four cases showed that the simulation environment acts as a communication platform for students to combine multiple representations to articulate their understanding of non-linear growth within a science context. Several patterns of interaction within the simulation platform were visible that would have remained unaddressed without the close examination of the communication between a student and interviewer recorded in videos, which emphasized the need for exploration with different data modalities [9,10].
Given that most of the session events involving the close proximity of student and researcher showed low conceptual gain, a lower number of close proximity events seemed to indicate a greater learning gain. The protocol followed by interviewers contained no language regarding how to position oneself relative to the student during a simulation session, and besides being conscious of not getting too close to the Kinect sensor, this issue was not discussed by the research team. Questioning the interviewers as to their conscious use of proximity and its assumed effects may shed light on the patterns that have been observed here. Nonetheless, we can at least infer that non-verbal immediacy such as proximity does not always result in higher learning gain. Previous research investigating non-verbal immediacy found inconclusive evidence of its connection to learning gains, but some support for affective learning [33,34,35]. Therefore, physical proximity may be perceived as the norm and less related to student learning in this laboratory environment. Additional forms of non-verbal interactions need to be investigated in order to understand the relationship with student learning.
In addition, the frequency of students’ verbalized uncertainty and acts of “thinking out loud” were more present with the students that entered the simulation with a high conceptual score or showed significant gains during simulation use. While students were prompted early in the interview to think aloud as much as possible, additional protocol reminders to consistently encourage thinking aloud were not explicit. This is consistent with the literature showing that a well-defined think-aloud protocol can lead to increased understanding between an instructor and a student, as well as elicit greater insights into the cognitive processes of learners as they interact with a system [48,49,50].
The analysis of the four selected cases showed that student-initiated verbalizations such as uncertainty or thinking out loud are important factors that are associated with the interviewer’s level of clarification and eventually with the students’ learning gain. This contributes to existing research showing the importance of facilitating students to articulate their gestural interaction strategies as an embodied design guidance [2]. However, this small number of cases is limited to posit their causal relationship. For instance, the physical proximity between the student and the interviewer did not show effects on learning gains; however, it may play a critical role for student engagement. More research is therefore needed on the effects of verbal discourse and non-verbal immediacy in multimodal learning environments.
In summary, the correlation analyses of interaction metrics showed overall trends of students’ simulation use and significant relationships between students’ gestural performances of certain simulation tasks. However, the metrics such as time spent on gesture development or gesturing may imply students’ diverse thinking processes such as preparing gestures, reflecting their knowledge, or communicating with an interviewer. Therefore, we closely examined how students’ reasoning seemed to be supported by the multimodal learning environment using the four selected cases. One notable finding is that during gesture development and gesturing, a student was not only preparing gestures, but also interacting with the interviewer in a variety of ways. The findings highlight the importance of multimodal data to understand how learning occurs in a complex learning environment such as ELASTIC3S, and inform the different types of support that might be needed for an individual student. We have currently begun collecting rich software log data that was generated as a student interacts with the simulation. Since we only recorded video and audio at the beginning of the data collection, we did not include the students’ log data in this study. We believe that the exploration of different metrics using the video recordings informs what types of actions to record to save the time and cost for data management and analysis, and ultimately how to design automated feedback to support student learning in an embodied simulation environment.
4.2. Implications for the Design of Multimodal Learning Environment
The findings from this study revealed that the learning occurred was not confined to a single factor such as the characteristics and behavior of an individual student; rather, it was spread multimodally across a student, an interviewer, and the simulations in the environment. In particular, the ELASTIC3S environment consists of multimodal learning components including different elements of the knowledge-building process embedded in the simulations, a student’s gestural interaction with the simulations, and communication between a student and interviewer. Interpreting the overall results, we believe we have created a platform that will allow us to successfully examine multimodal learning in an environment utilizing different components and technologies (see Figure 10).
The model has the potential to inform the future design and study of multimodal embodied simulation environments. Recent research emphasized the capability of capturing massive amounts of data in different fields of human activity in three-dimensional (3D) space and the feasibility of novel assessment by incorporating multimodal interaction data [7,51]. The practical significance of this study is that it conveys that there is value to investigating ways of understanding learning in this dynamic environment and exploring different metrics generated as students attempt to make sense of the cross-cutting science concepts of scale, proportion, and quantity using a personalized gesture scheme. The multimodal interaction metrics that were investigated in this study can be utilized to design powerful forms of feedback and automated prompts to further enhance student learning and engagement. For example, the number of gestures tracked during the early stages of a simulation or the time spent on gesture and gesture development during any challenging task can provide hints as to whether a student is in need of additional support. Different types of visuals such as a replay of skeletal movements and graphs recorded in any previous stage can be added to support the thinking process of students who are struggling with reasoning or gestures. This suggests that such experiences can better facilitate student understanding when they are provided as explicit just-in-time guidance or personalized instruction based on their tracked progress. The findings also suggest there may be additional metrics that indicate students’ unique interaction behavior and measure their learning or engagement.
Future studies will include additional groups to match log data with recorded videos using the metrics that emerged in this study. Additional data such as the volume or speed of student movement generated from Kinect will be included to investigate the role of gestures in learning in our future study. The massive amounts of dynamic data recorded when students can generate personalized artifacts could be leveraged to improve an individual’s learning experience and system performance. The ELASTIC3S environment is in the laboratory space, which is not a typical learning environment in either a formal classroom or informal setting. However, advanced interaction technologies are now more accessible, and therefore promise to reach more populations of learners in diverse environments. Ultimately, our attempts will provide automated guidance to embed within our simulation theater and discover potential features driven from multimodal data to provide a rigid multimodal analytics framework for embodied simulations for future researchers.
5. Study Limitations
Students’ participation was entire voluntarily, and the participants were randomly assigned to each group: a simulation group and traditional material group. This study only included the participants in the simulation group, in which female participants accounted for 75% of the simulation group. We did not collect the participants’ academic background such as majors and courses they have taken, but these students were recruited from a general educational psychology course in which the majority of students did not have a STEM focus. Readers are cautioned to keep these limitations in mind.
6. Conclusions
Previous studies have shown that the ELASTIC3S simulation has a positive impact on students’ understanding of cross-cutting concepts and content objectives, and suggested the needs of further investigation on critical features that facilitate student reasoning. This study explored metrics that represent multimodal interactions within the simulation platform to further understand how this multimodal learning environment supports student reasoning of exponential growth. The findings highlight the value of a multimodal approach to investigating student learning in an embodied environment. While traditional assessments are valuable metrics for gauging overall learning, relying only on assessments that occur before and after the interaction with the learning environment limits the ability to draw more nuanced conclusions about what is contributing to the change in learner performance. The multimodal data collected in this study highlights the importance of considering different dynamics such as the interviewer–student dynamic, especially in a system emphasizing physicality. The results of this study pave the way for further studies on the potential of multimodal analytics research frameworks and the design of embodied simulations in the future.
Author Contributions
All authors contributed to the conceptualization of the framework and the design of the ELASTIC3S platform. J.K. and J.P. analyzed the data and wrote the first draft. R.L. revised the manuscript and added relevant literature and interpretations of the analysis.
Funding
This research was funded by the National Science Foundation under Grant No. IIS-1441563.
Acknowledgments
We thank the entire ELASTIC3S team for their help with design, development, and data collections. We are especially grateful to Greg Kohlburn who gave advice regarding simulation metrics and Stephanie Sroczynski who assisted the analysis of recorded simulation sessions.
Conflicts of Interest
The authors declare no conflict of interest.
References
- NGSS Lead States. Next Generation Science Standards; The National Academies Press: Washington, DC, USA, 2013. [Google Scholar]
- Abrahamson, D.; Lindrgen, R. Embodiment and embodied design. In the Cambridge Handbook of the Learning Sciences, 2nd ed.; Sawyer, R.K., Ed.; Cambridge University Press: Cambridge, UK, 2014; pp. 358–376. [Google Scholar]
- Black, J.B.; Segal, A.; Vitale, J.; Fadjo, C.L. Embodied cognition and learning environment design. In Theoretical Foundations of Learning Environments, 2nd ed.; Jonassen, D., Land, S., Eds.; Routledge, Taylor & Francis Group: Florence, SC, USA, 2012; pp. 198–223. [Google Scholar]
- DeSutter, D.; Stieff, M. Teaching students to think spatially through embodied actions: Design principles for learning environments in science, technology, engineering, and mathematics. Cogn. Res. 2017. [Google Scholar] [CrossRef] [PubMed]
- Lindgren, R.; Johnson-Glenberg, M. Emboldened by embodiment six precepts for research on embodied learning and mixed reality. Educ. Res. 2013, 42, 445–452. [Google Scholar] [CrossRef]
- Enyedy, N.; Danish, J.A.; Delacruz, G.; Kumar, M. Learning physics through play in an augmented reality environment. Int. J. Comput. Support. Collab. Learn. 2012, 7, 347–378. [Google Scholar] [CrossRef]
- Johnson-Glenberg, M.C.; Birchfield, D.A.; Tolentino, L.; Koziupa, T. Collaborative embodied learning in mixed reality motion-capture environments: Two science studies. J. Educ. Psychol. 2014, 106, 86–104. [Google Scholar] [CrossRef]
- Lindgren, R.; Tscholl, M.; Wang, S.; Johnson, E. Enhancing learning and engagement through embodied interaction within a mixed reality simulation. Comput. Educ. 2016, 95, 174–187. [Google Scholar] [CrossRef] [Green Version]
- Blikstein, P.; Worsley, M.A.B. Multimodal learning analytics and education data mining: Using computational technologies to measure complex learning tasks. J. Learn. Anal. 2016, 3, 220–238. [Google Scholar] [CrossRef]
- Smith, C.; King, B.; Gonzalez, D. Using Multimodal Learning Analytics to Identify Patterns of Interactions in a Body-Based Mathematics Activity. J. Interact. Learn. Res. 2016, 27, 355–379. [Google Scholar]
- Ainsworth, S.; Prain, V.; Tytler, R. Drawing to Learn in Science. Science 2011, 333, 1096–1097. [Google Scholar] [CrossRef] [PubMed] [Green Version]
- Ibrahim-Didi, K.; Hackling, M.W.; Ramseger, J.; Sherriff, B. Embodied Strategies in the Teaching and Learning of Science. In Quality Teaching in Primary Science Education; Springer: Cham, Switzerland, 2017; pp. 181–221. ISBN 978-3-319-44381-2. [Google Scholar]
- Barsalou, L.W. Perceptions of perceptual symbols. Behav. Brain Sci. 1999, 22, 637–660. [Google Scholar] [CrossRef] [Green Version]
- Johnson, M. The Body in the Mind: The Bodily Basis of Meaning, Imagination, and Reason; University of Chicago Press: Chicago, IL, USA, 1987. [Google Scholar]
- Barsalou, L.W. Grounded Cognition: Past, Present, and Future. Top. Cogn. Sci. 2010, 2, 716–724. [Google Scholar] [CrossRef] [PubMed] [Green Version]
- Glenberg, A.M. Embodiment as a unifying perspective for psychology. Wiley Interdiscip. Rev. Cogn. Sci. 2010, 1, 586–596. [Google Scholar] [CrossRef] [PubMed]
- Wilson, M. Six views of embodied cognition. Psychon. Bull. Rev. 2002, 9, 625–636. [Google Scholar] [CrossRef] [PubMed] [Green Version]
- Tomasino, B.; Nobile, M.; Re, M.; Bellina, M.; Garzitto, M.; Arrigoni, F.; Molteni, M.; Fabbro, F.; Brambilla, P. The mental simulation of state/psychological verbs in the adolescent brain: An fMRI study. Brain Cogn. 2018, 123, 34–46. [Google Scholar] [CrossRef] [PubMed]
- Milgram, P.; Kishino, F.A. Taxonomy of Mixed Reality Visual Displays. IEICE Trans. Inf. Syst. 1994, 77, 1321–1329. [Google Scholar]
- Alibali, M.W.; Nathan, M.J. Embodiment in Mathematics Teaching and Learning: Evidence From Learners’ and Teachers’ Gestures. J. Learn. Sci. 2012, 21, 247–286. [Google Scholar] [CrossRef]
- Goldin-Meadow, S.; Cook, S.W.; Mitchell, Z.A. Gesturing gives children new ideas about math. Psychol. Sci. 2009, 20, 267–272. [Google Scholar] [CrossRef] [PubMed]
- Roth, W.M. Gestures: Their role in teaching and learning. Rev. Educ. Res. 2001, 71, 365–392. [Google Scholar] [CrossRef]
- Crowder, E.M. Gestures at work in sense-making science talk. J. Learn. Sci. 1996, 5, 173–208. [Google Scholar] [CrossRef]
- Niebert, K.; Gropengießer, H. Understanding the greenhouse effect by embodiment—Analysing and using students’ and scientists’ conceptual resources. Int. J. Sci. Educ. 2014, 36, 277–303. [Google Scholar] [CrossRef]
- Birchfield, D.; Thornburg, H.; Megowan-Romanowicz, M.C.; Hatton, S.; Mechtley, B.; Dolgov, I.; Burleson, W. Embodiment, multimodality, and composition: Convergent themes across HCI and education for mixed-reality learning environments. Adv. Hum. Comput. Interact. 2008. [Google Scholar] [CrossRef]
- Gellevij, M.; Van Der Meij, H.; De Jong, T.; Pieters, J. Multimodal versus Unimodal Instruction in a Complex Learning Context. J. Exp. Educ. 2002, 70, 215–239. [Google Scholar] [CrossRef]
- Flood, V.J.; Amar, F.G.; Nemirovsky, R.; Harrer, B.W.; Bruce, M.R.; Wittmann, M.C. Paying attention to gesture when students talk chemistry: Interactional resources for responsive teaching. J. Chem. Educ. 2014, 92, 11–22. [Google Scholar] [CrossRef]
- Sankey, M.; Birch, D.; Gardiner, M. Engaging students through multimodal learning environments: The journey continues. In Proceedings of the ASCILITE 2010: 27th Annual Conference of the Australasian Society for Computers in Learning in Tertiary Education: Curriculum, Technology and Transformation for an Unknown Future, Sydney, Australia, 5–8 December 2010; University of Queensland: Brisbane, Australia, 2010; pp. 852–863. [Google Scholar]
- Prain, V.; Waldrip, B. An Exploratory Study of Teachers’ and Students’ Use of Multi-modal Representations of Concepts in Primary Science. Int. J. Sci. Educ. 2006, 28, 1843–1866. [Google Scholar] [CrossRef]
- Frymier, A. A model of immediacy in the classroom. Commun. Q. 1994, 42, 133–144. [Google Scholar] [CrossRef]
- Richmond, V.; Gorham, J.; McCroskey, V. The Relationship between Selected Immediacy Behaviors and Cognitive Learning. In Communication Yearbook 10; McLaughlin, M., Ed.; Sage: Newbury Park, CA, USA, 1987; pp. 574–590. [Google Scholar]
- Andersen, J. Teacher immediacy as a predictor of teacher effectiveness. In Communication Yearbook 3; Nimmo, D., Ed.; Transaction Books: New Brunswick, NJ, USA, 1979; pp. 543–559. [Google Scholar]
- Pogue, L.L.; Ahyun, K. The effect of teacher nonverbal immediacy and credibility on student motivation and affective learning. Commun. Educ. 2006, 55, 331–344. [Google Scholar] [CrossRef]
- Seifert, T. Understanding student motivation. Educ. Res. 2004, 46, 137–149. [Google Scholar] [CrossRef]
- Witt, P.L.; Wheeless, L.R.; Allen, M. A meta-analytical review of the relationship between teacher immediacy and student learning. Commun. Monogr. 2004, 71, 184–207. [Google Scholar] [CrossRef]
- Márquez, C.; Izquierdo, M.; Espinet, M. Multimodal science teachers’ discourse in modeling the water cycle. Sci. Educ. 2006, 90, 202–226. [Google Scholar] [CrossRef]
- Ainsworth, S.; Th Loizou, A. The effects of self-explaining when learning with text or diagrams. Cogn. Sci. 2003, 27, 669–681. [Google Scholar] [CrossRef]
- Ainsworth, S.; Iacovides, I. Learning by constructing self-explanation diagrams. In Proceedings of the 11th Biennial Conference of European Association for Research on Learning and Instruction, Nicosia, Cyprus, 23–27 August 2005. [Google Scholar]
- Cooper, M.M.; Williams, L.C.; Underwood, S.M. Student understanding of intermolecular forces: A multimodal study. J. Chem. Educ. 2015, 92, 1288–1298. [Google Scholar] [CrossRef]
- Won, M.; Yoon, H.; Treagust, D.F. Students’ learning strategies with multiple representations: Explanations of the human breathing mechanism. Sci. Educ. 2014, 98, 840–866. [Google Scholar] [CrossRef]
- Morphew, J.W.; Lindgren, R.; Alameh, S. Embodied ideas of scale: Learning and engagement with a whole-body science simulation. In Proceedings of the Annual Meeting American Educational Research Association, New York, NY, USA, 13–17 April 2018. [Google Scholar]
- Junokas, M.J.; Lindgren, R.; Kang, J.; Morphew, J.W. Enhancing multimodal learning through personalized gesture recognition. J. Comp. Asst. Learn. 2018. [Google Scholar] [CrossRef]
- Alameh, S.; Morphew, J.W.; Mathayas, N.; Lindgren, R. Exploring the relationship between gesture and student reasoning regarding linear and exponential growth. In Proceedings of the International Conference of the Learning Sciences, Singapore, 20–24 June 2016; pp. 1006–1009. [Google Scholar]
- Creswell, J.W. Research Design: Qualitative, Quantitative, and Mixed Methods Approaches; Sage: Thousand Oaks, CA, USA, 2013. [Google Scholar]
- Yin, R.K. Case Study Research: Design and Methods, 3rd ed.; Sage: Thousand Oaks, CA, USA, 2003. [Google Scholar]
- Oltmann, S. Qualitative interviews: A methodological discussion of the interviewer and respondent contexts. Qual. Soc. Res. 2016, 17. [Google Scholar] [CrossRef]
- Datavyu Team. Datavyu: A Video Coding Tool; Databrary Project; New York University: New York, NY, USA, 2014. [Google Scholar]
- Cowan, J. The potential of cognitive think-aloud protocols for educational action-research. Act. Learn. High. Educ. 2017. [Google Scholar] [CrossRef]
- Marco-Ruiz, L.; Bønes, E.; de la Asunción, E.; Gabarron, E.; Aviles-Solis, J.C.; Lee, E.; Traver, V.; Sato, K.; Bellika, J.G. Combining multivariate statistics and the think-aloud protocol to assess Human-Computer Interaction barriers in symptom checkers. J. Biomed. Inform. 2017, 74, 104–122. [Google Scholar] [CrossRef] [PubMed]
- Vandevelde, S.; Van Keer, H.; Schellings, G.; Van Hout-Wolters, B. Using think-aloud protocol analysis to gain in-depth insights into upper primary school children’s self-regulated learning. Learn. Individ. Differ. 2015, 43, 11–30. [Google Scholar] [CrossRef]
- Worsley, M.; Blikstein, P. Leveraging Multimodal Learning Analytics to Differentiate Student Learning Strategies. In Proceedings of the Fifth International Conference on Learning Analytics and Knowledge (LAK ’15), Poughkeepsie, NY, USA, 16–20 March 2015; ACM: New York, NY, USA, 2015; pp. 360–367. [Google Scholar]
Figure 1.
The simulation space configured for motion tracking of a three-screen simulation: (a) ceiling mounted audio and video recording; (b) a student using the earthquake simulation.
Figure 1.
The simulation space configured for motion tracking of a three-screen simulation: (a) ceiling mounted audio and video recording; (b) a student using the earthquake simulation.
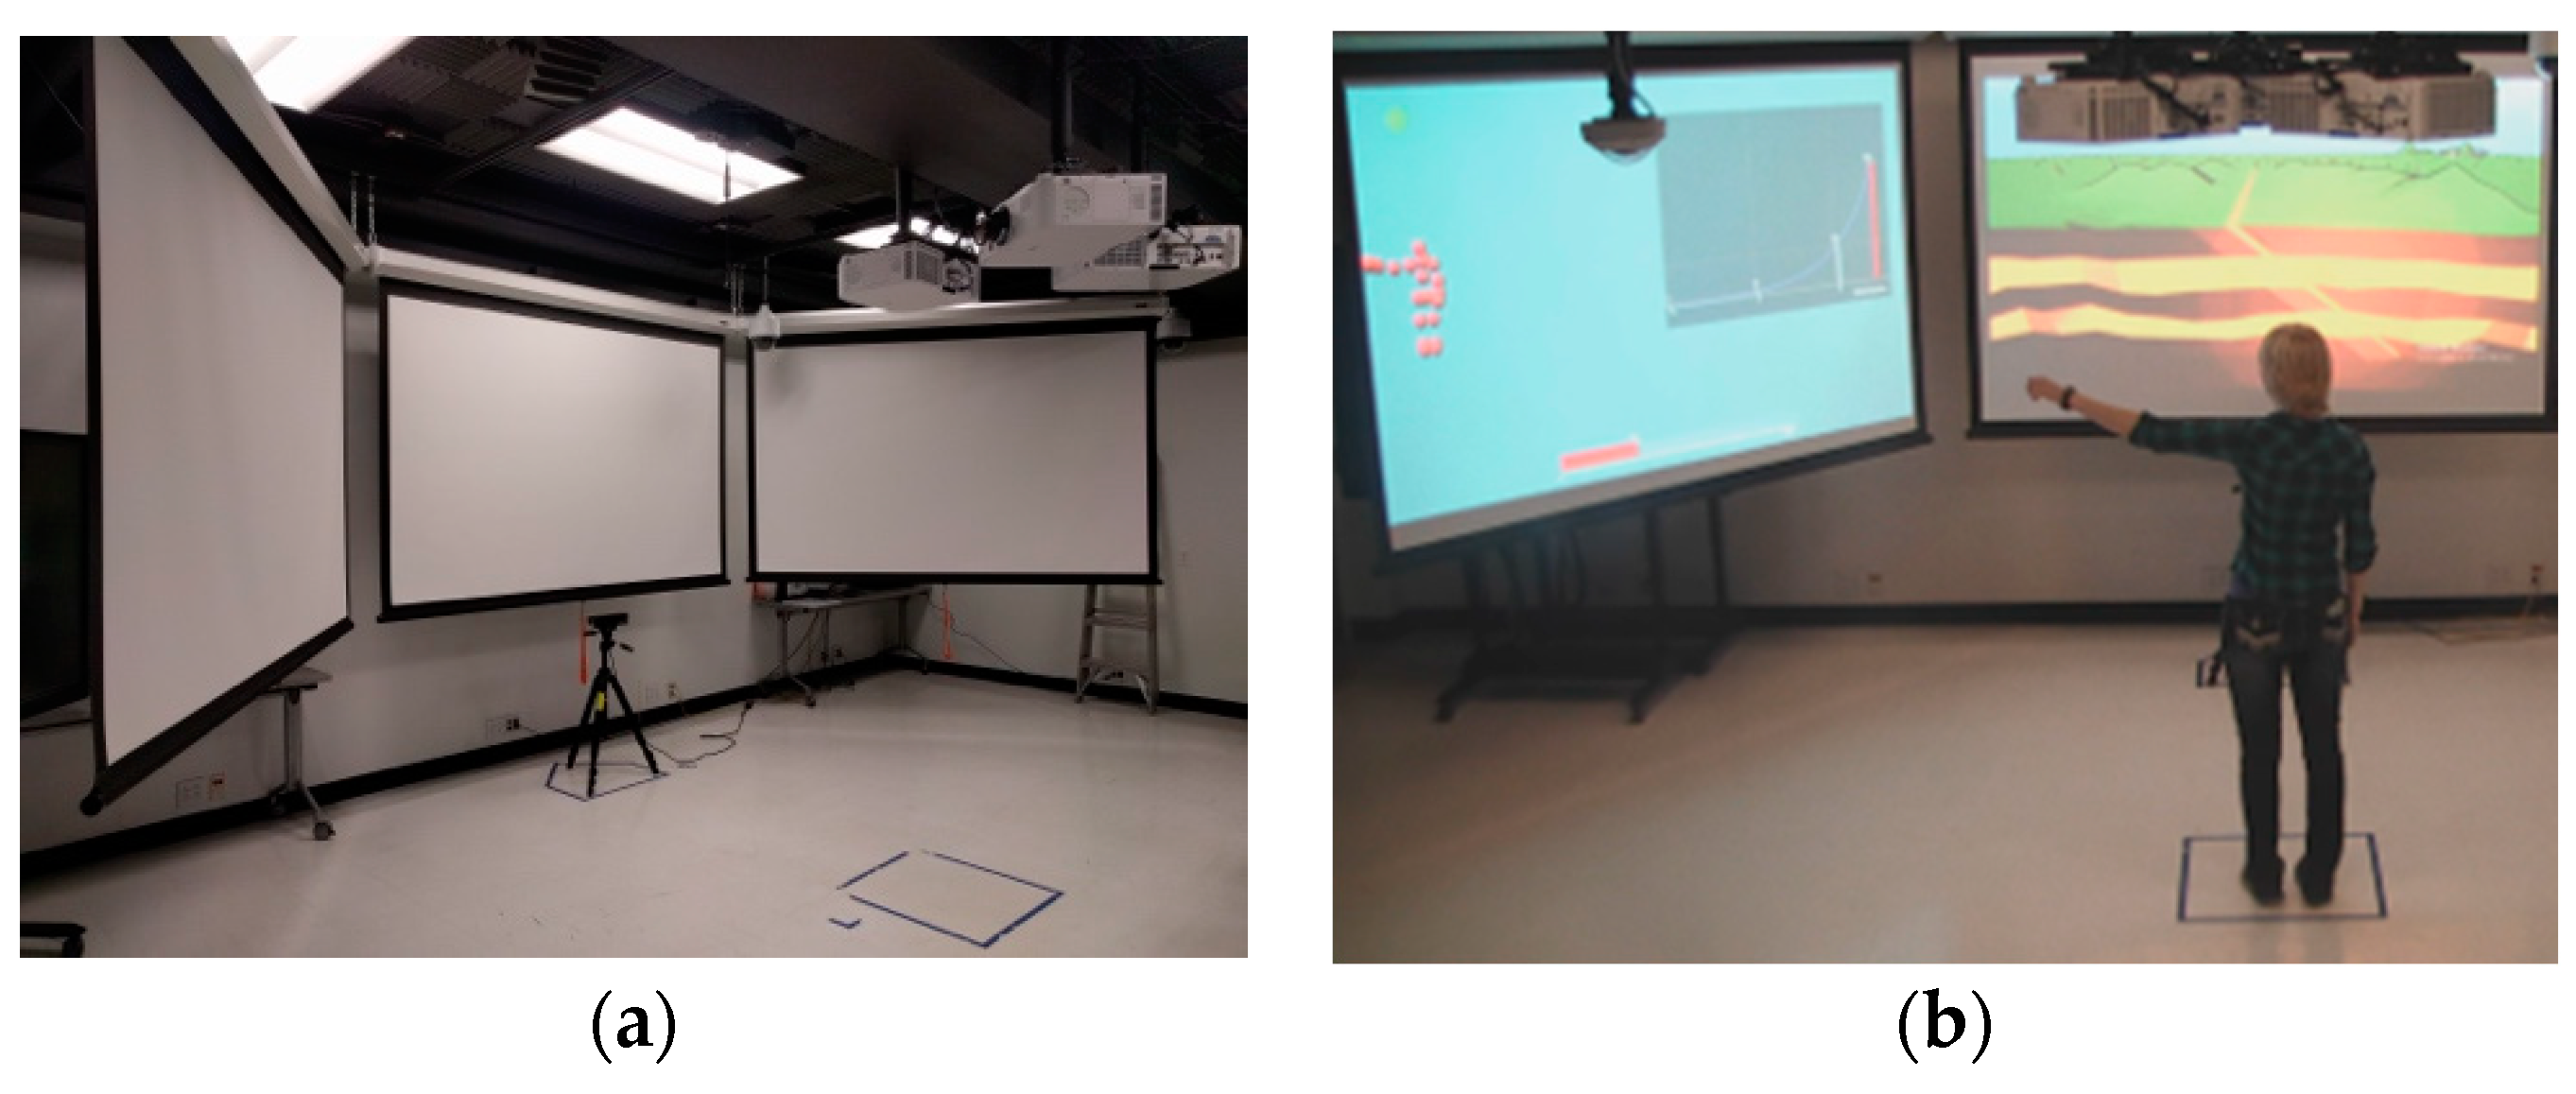
Figure 2.
The student (above) and skeleton (below) showed the steps of making a multiplication gesture: (a) holding her left hand palm up in front of her stomach and extending her right arm; (b) making an overhead sweeping motion with the right arm; (c) folding the right arm such that her right hand meets her left hand in front of her body.
Figure 3.
Three-screen layout of the simulation showing gesture tracking skeleton and graph visualizations (left), earthquake mechanisms and tasks (center), and earthquake effects (right).
Figure 3.
Three-screen layout of the simulation showing gesture tracking skeleton and graph visualizations (left), earthquake mechanisms and tasks (center), and earthquake effects (right).
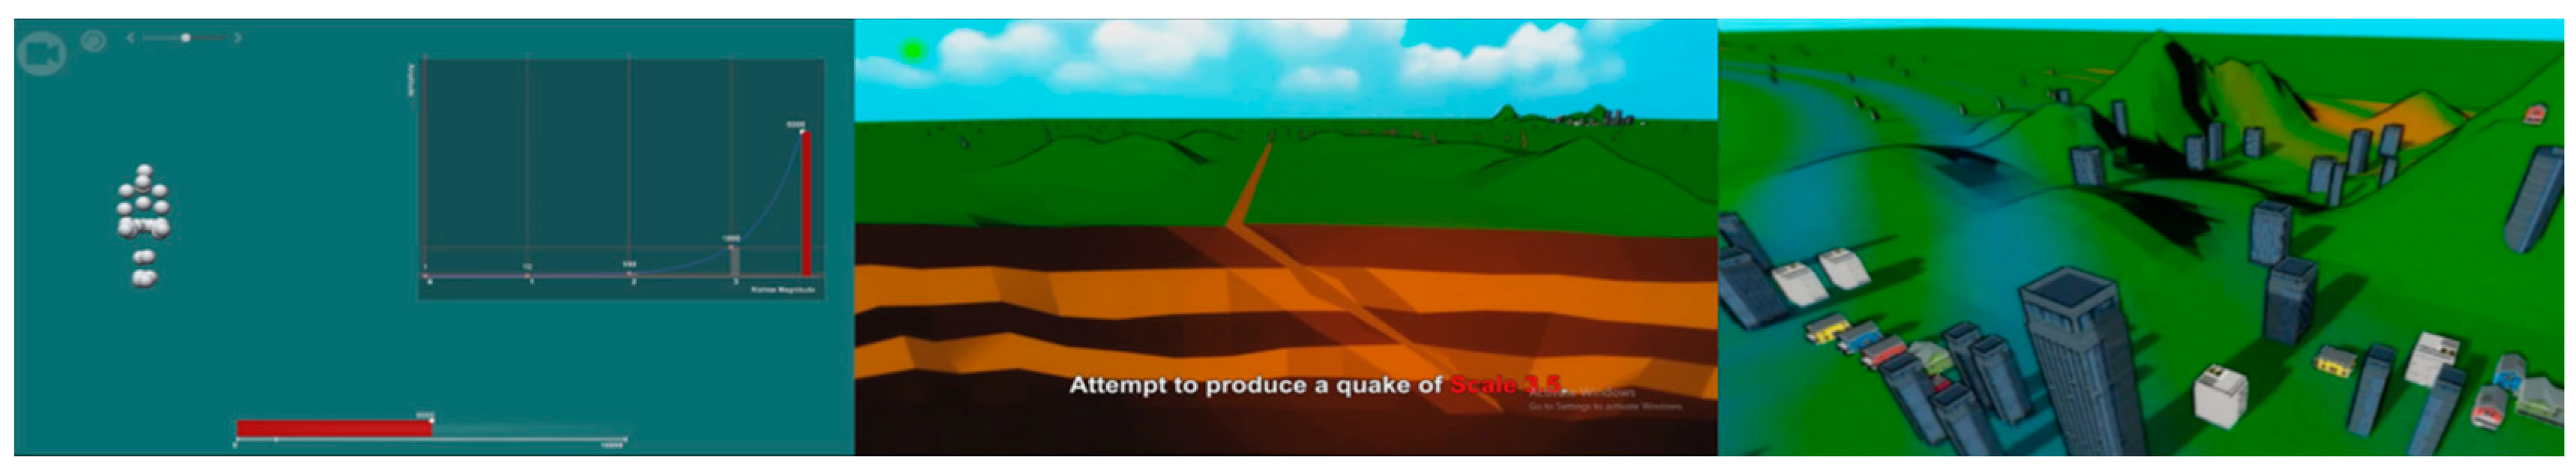
Figure 4.
Reference video frame showing interviewer (left) and student (center) with the color overlay used to code proximity.
Figure 4.
Reference video frame showing interviewer (left) and student (center) with the color overlay used to code proximity.
Figure 5.
Boxplot of students’ time spent on gesture development and the gesturing of each task. Each boxplot includes the information of the minimum, first quartile, median, third quartile, and maximum (from bottom). Each circle represents a single student.
Figure 5.
Boxplot of students’ time spent on gesture development and the gesturing of each task. Each boxplot includes the information of the minimum, first quartile, median, third quartile, and maximum (from bottom). Each circle represents a single student.

Figure 6.
Scatterplot of correlation between the ‘time spent’ variables of GD on C431 and G on R2. Black circles represent students with low exponential growth knowledge gain, and grey circles represent high gain students.
Figure 6.
Scatterplot of correlation between the ‘time spent’ variables of GD on C431 and G on R2. Black circles represent students with low exponential growth knowledge gain, and grey circles represent high gain students.
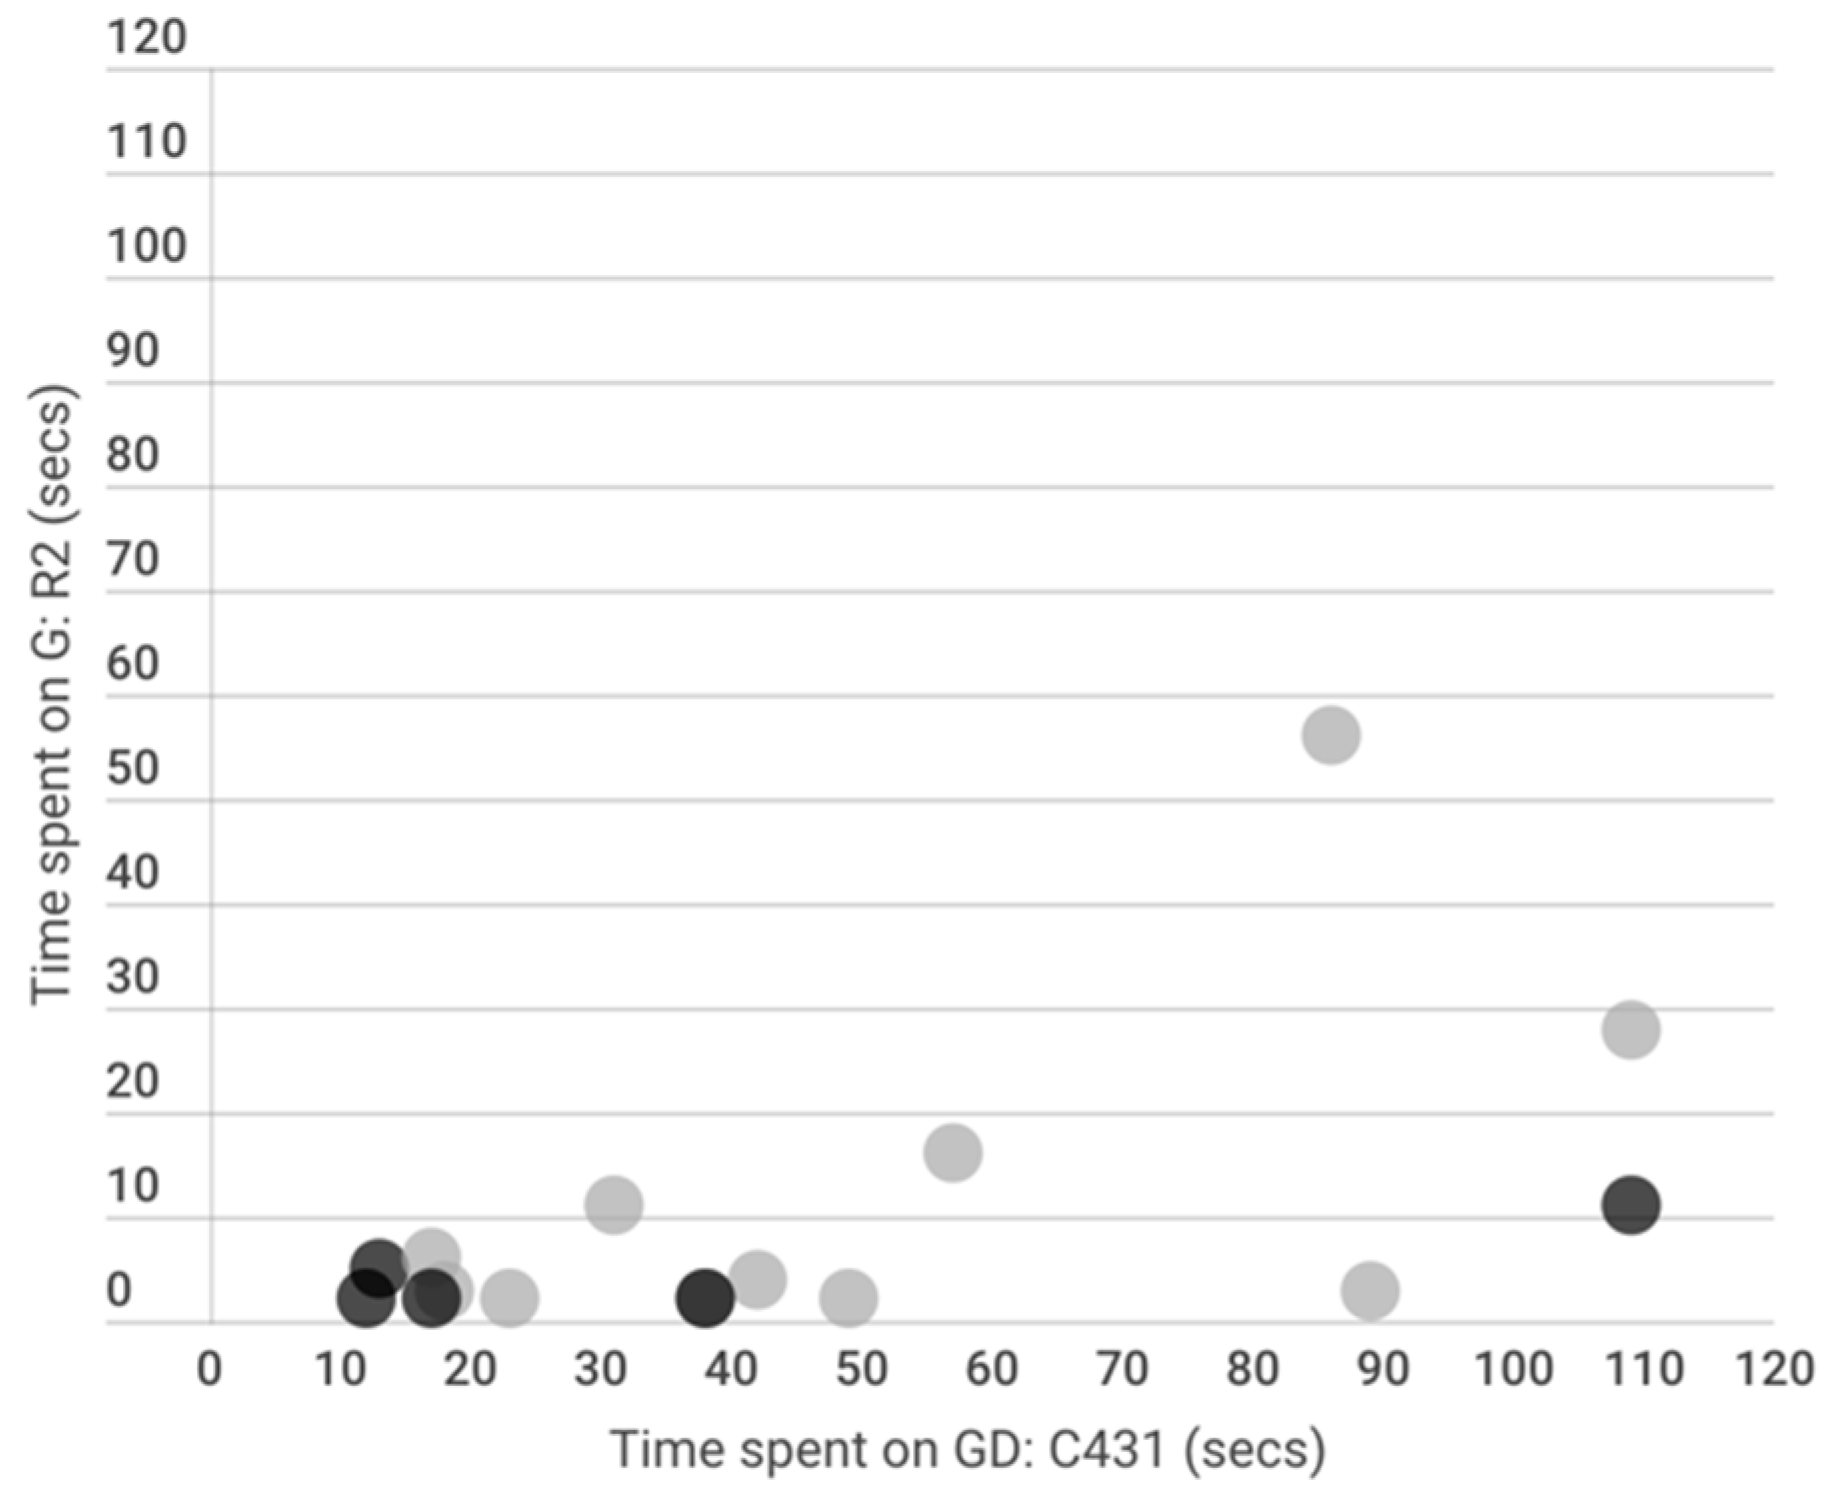
Figure 7.
Normalized sigmoid gesture time spent rate for Alyssa, Gabby, George, and Rhiannon. A score of 0.5 represents the ‘time spent’ performance at the average for the group (N = 24).
Figure 7.
Normalized sigmoid gesture time spent rate for Alyssa, Gabby, George, and Rhiannon. A score of 0.5 represents the ‘time spent’ performance at the average for the group (N = 24).
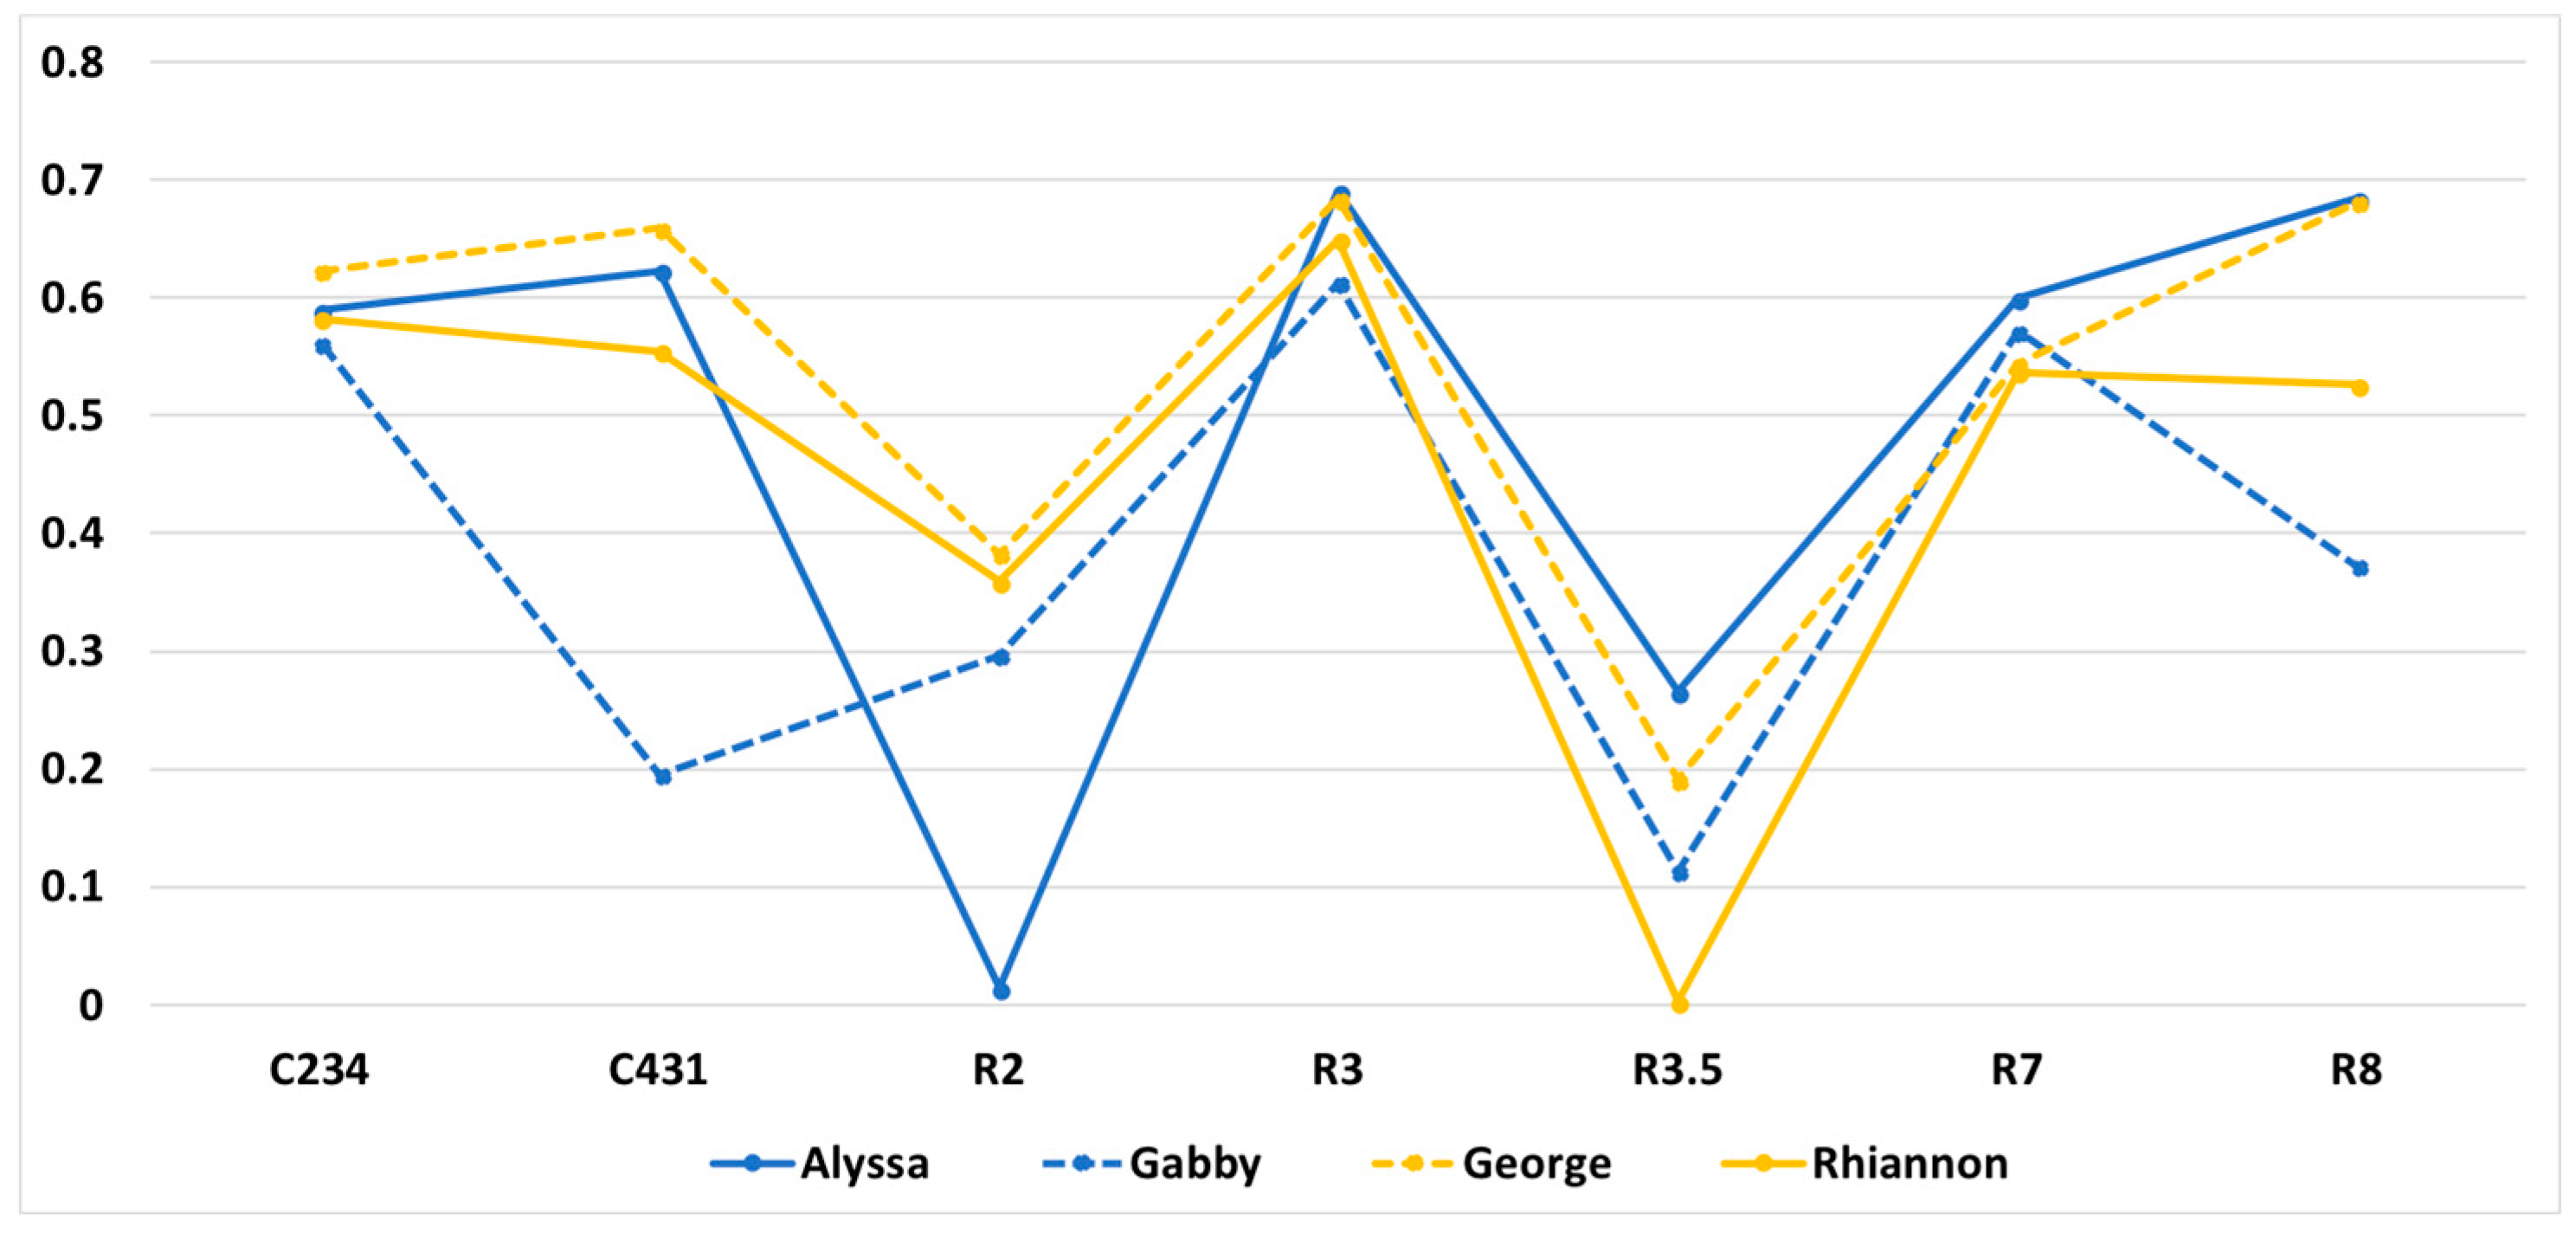
Figure 8.
Interviewer proximity distributions during seven tasks: (a) Alyssa; (b) Gabby; (c) George; (d) Rhiannon.
Figure 8.
Interviewer proximity distributions during seven tasks: (a) Alyssa; (b) Gabby; (c) George; (d) Rhiannon.
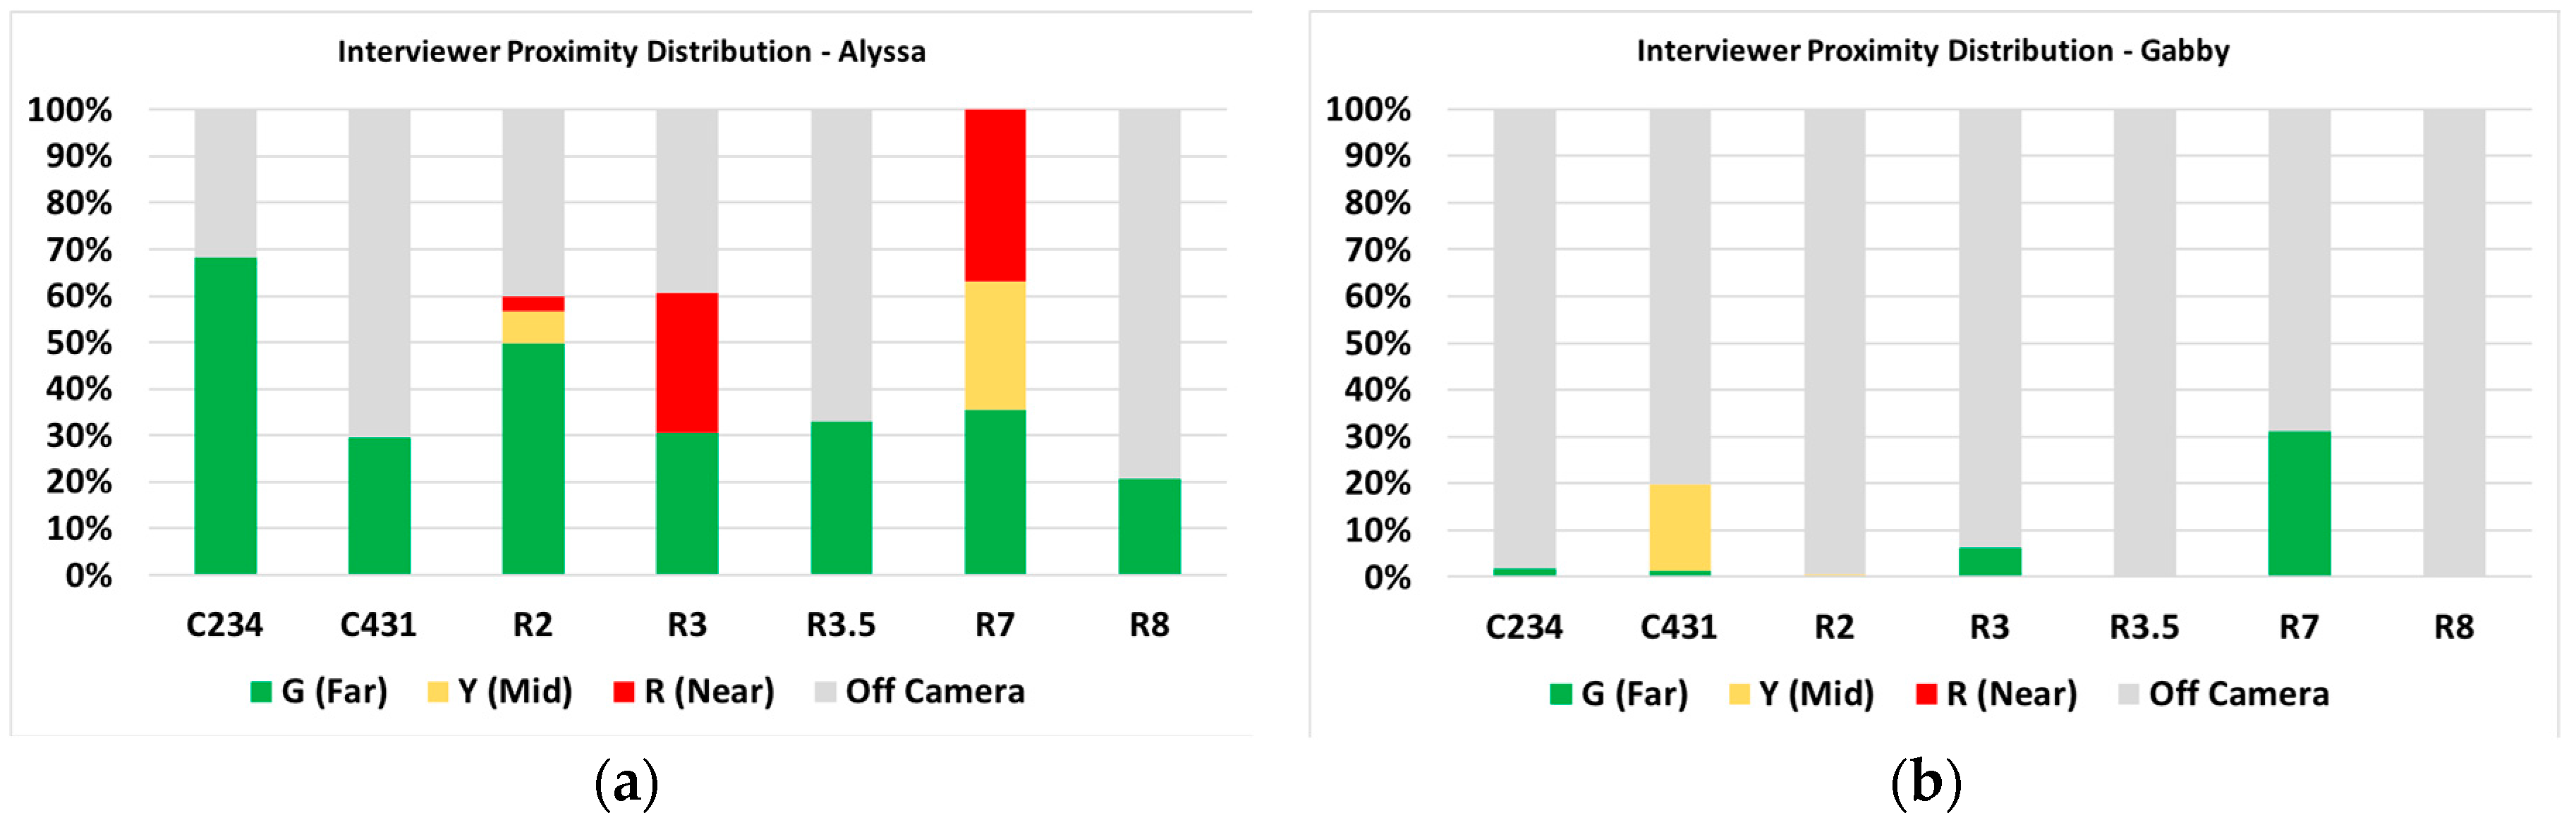
Figure 9.
Total frequencies of interaction codes: (a) interviewer clarification; (b) student utterances.
Figure 9.
Total frequencies of interaction codes: (a) interviewer clarification; (b) student utterances.

Figure 10.
Multimodal learning environment and components.

Table 1.
Coding scheme and sample code dialog.
| Code | Definition | Sample Dialog | |
|---|---|---|---|
| Interviewer | Queries | Questions from interviewer (types: content, simulation, gesture, task) | “Now we want to make 300 cubes. How do you think that we can make 300 with the least number of gestures?” “Describe the damage caused by this earthquake.” |
| Clarifications | Supporting statements from the interviewer to the students during tasks (types: content, simulation, gesture, task) | “So, what are you trying to do?” “Do you want to try to get to that and we can see?” “Think about what you would start with...” | |
| Student | Queries | Questions from student (types: content, simulation, gesture, task) | “I should’ve added three, right?” |
| Utterances | Responses or other verbalizations from the student (types: answer, uncertainty, thinking aloud, success) | “Oh, wait, wait...never mind, I know what I am going to do.” “I think that’s where it will damage it.” “Which graph? Looks like J?” |
Table 2.
Correlations of time spent on gesture development (GD) and gesturing (G) during simulation.
Table 2.
Correlations of time spent on gesture development (GD) and gesturing (G) during simulation.
| C234 | C431 | R2 | R3.5 | R7 | |||||||
|---|---|---|---|---|---|---|---|---|---|---|---|
| GD | G | GD | G | GD | G | GD | G | GD | G | ||
| C234 | GD | 1 | |||||||||
| G | 0.155 | 1 | |||||||||
| C431 | GD | −0.192 | −0.123 | 1 | |||||||
| G | −0.462 | −0.028 | 0.692 ** | 1 | |||||||
| R2 | GD | 0.140 | 0.093 | −0.040 | −0.333 | 1 | |||||
| G | 0.161 | 0.793 ** | 0.567 * | 0.077 | 0.143 | 1 | |||||
| R3.5 | GD | 0.227 | 0.443 | −0.248 | −0.198 | 0.300 | 0.306 | 1 | |||
| G | −0.190 | 0.315 | 0.063 | 0.251 | −0.011 | 0.267 | −0.041 | 1 | |||
| R7 | GD | −0.128 | 0.087 | −0.269 | 0.286 | −0.083 | 0.066 | 0.006 | −0.134 | 1 | |
| G | 0.047 | 0.340 | −0.115 | −0.082 | 0.146 | 0.340 | 0.504 * | 0.238 | 0.174 | 1 | |
Note: ** p < 0.01, * p < 0.05.
Table 3.
C431 dialogue of a student and interviewer.
| Interviewer | Gabby |
|---|---|
| Think about what you would start with... | Uh... |
| I can help you | Um... |
| Ok, so you’ve got four. | |
| So, what are you adding to get to? | [mumbling]...400, and then...31 [mumbling then begins using add gesture] 31 |
| Can you think of a way that might be quicker? | Yeah... there is probably a faster way. |
| I can give you a hint... What’s a quick way you can get to 403? Here, we can do it together. | Um... |
| Step one, I’d say make four cubes, right? | Yeah [gestures to add four] |
| Now, the next number we need is three... Right? | Multiply by 10 then add [gestures times 10] |
| So, what do we have to do to get to 43 now? | [gestures to add three] |
| And then... now we need to get to 431. So, what can we do to get to 430? | Multiply by 10? |
| Ok, yeah... Give that a shot. | [gestures times 10] And then one... [gestures to add one] |
| How are you doing? | Good |
© 2018 by the authors. Licensee MDPI, Basel, Switzerland. This article is an open access article distributed under the terms and conditions of the Creative Commons Attribution (CC BY) license (http://creativecommons.org/licenses/by/4.0/).
Share and Cite
MDPI and ACS Style
Kang, J.; Lindgren, R.; Planey, J. Exploring Emergent Features of Student Interaction within an Embodied Science Learning Simulation. Multimodal Technol. Interact. 2018, 2, 39. https://doi.org/10.3390/mti2030039
AMA Style
Kang J, Lindgren R, Planey J. Exploring Emergent Features of Student Interaction within an Embodied Science Learning Simulation. Multimodal Technologies and Interaction. 2018; 2(3):39. https://doi.org/10.3390/mti2030039
Chicago/Turabian StyleKang, Jina, Robb Lindgren, and James Planey. 2018. "Exploring Emergent Features of Student Interaction within an Embodied Science Learning Simulation" Multimodal Technologies and Interaction 2, no. 3: 39. https://doi.org/10.3390/mti2030039