Parametric Study on Determining Optimum Shading Techniques for Urban High-Rise Dwellings


Department of Architectural Engineering, School of Energy, Geoscience, Infrastructure and Society, Heriot-Watt University, P.O. Box 294 345, Dubai, UAE
*
Author to whom correspondence should be addressed.
Urban Sci. 2019, 3(3), 85; https://doi.org/10.3390/urbansci3030085
Submission received: 27 June 2019
/
Revised: 26 July 2019
/
Accepted: 28 July 2019
/
Published: 30 July 2019
Abstract
:Shading techniques constitute one of the most passive, beneficial strategies for reducing energy consumption in urban dwellings. Shading affects many factors, for example, the solar gains and radiations falling on the façade, which are considered the most significant in increasing the cooling energy demand in hot climates. This paper conducts a parametric study on external and internal shading devices and establishes their impact on energy consumption, daylight levels, and ventilation. The work was conducted using Integrated Environmental Simulation Virtual Environment (IES-VE) and Computational Fluid Dynamics (CFD) numerical methods. The results revealed that optimised shading can influence savings in terms of energy and cooling, in addition to the enhancement of daylighting and reduction of glare. After studying all these factors associated with the different shading techniques investigated, the findings revealed that all shades affect the energy, daylight and ventilation parameters positively. However, despite all external and internal shadings showing improvements, the egg crate shade was determined as that which provided the optimum energy saving, while enhancing daylight and improving natural ventilation for a sustainable building design.
1. Introduction
The radical increase in construction of highly glazed facades for commercial buildings in the UAE over the last years has caused an extraordinary increase in energy consumption and emissions. Highly glazed facades are increasingly constructed to meet the requirements of an international city like Dubai. Since the aesthetic quality of the buildings enhances the context of a city and adds to its culture, this causes an increase in the use of glass due to its pleasing appearance; however, this has resulted in buildings being responsible for a large amount of devastation. High amounts glazing will conduct more solar heat in comparison to an insulated wall which can transmit 30% to 70% of solar radiation to the interior [1]. These massive highly glazed building in the UAE increase the amount of solar gains, and the penetration of heat indoors dramatically adds to the cooling loads during summer. The annual average temperatures are predicated to rise between 1.6 °C and 2.9 °C by the year 2050 compared to the years 1961–1990, while further increases in temperature are expected between 2.3 °C and 5.9 °C by 2100 [2]. Moreover, the electricity consumption for lighting and cooling has increased drastically over the past 24 years, from 5 to 50 billion kWh according to Aboulnaga [3].
In the hot climate of the UAE, the façade materials utilised are the buildings’ key protection layer for occupants from the harsh external climate. Therefore, its essential to control the solar gain transmittance indoors, as the enormous use of glass affects the visual and thermal comfort of occupants, since excessive sunlight penetration has a negative effect on the individual’s health, causing fatigue, seasonal affective disorder, and insomnia [3]. In addition, glazing was misused in 70% of the buildings, causing the daylight factor in commercial buildings to be tremendously beyond the recommended levels [3]. These buildings increase the cooling loads significantly, resulting in glare and visual discomfort, thus the combination of daylighting with high performance artificial lighting can achieve 30%–50% energy savings [3].
Commercial buildings require more energy to maintain thermal comfort, and to this day, highly glazed buildings are still being constructed in the UAE regardless of their environmental impacts. Therefore, this can be offset by implementing shading techniques to provide a sustainable urban design, reduce the heat island effect, and minimise energy consumption [4]. As shadings has a crucial role in reducing the energy consumed for cooling and artificial lighting by declining the transmittance of solar gains, shading can also enhance the daylighting to improve visual comfort, cutting down the requirement for artificial lighting. Since commercial buildings have higher consumption due to the high requirements for the cooling to compensate the continuous external and internal heat gains, shading can be integrated in the buildings design to balance the aesthetic appearance of the building with the context of the city, while controlling the solar gains and radiation to reduce the energy required to maintain the thermal and visual comfort and enhance natural ventilation.
The aim of this paper is to investigate and compare the effects of different external and internal shading techniques, to shed light on the role of shading for the enhanced sustainable design of high-rise glazed buildings. This study first reviews the literature concerning the effect of shading devices on energy efficiency, daylighting, and natural ventilation. Then, it presents the methodology of the building and shading design for external overhangs, horizontal and vertical louvers, and egg crate shading, in addition to internal venetian blinds, roller blinds, vertical internal louvers, and light shelves. This study uses Integrated Environmental Simulation Virtual Environment (IES-VE) for the energy modelling and daylighting, and Computational Fluid Dynamics (CFD) for wind flow simulation. The results were presented for all the shadings examined and further analysis of the results are included to discover the ideal shading. In addition to discussing these results against the existing literature and benchmarks, conclusions are presented with respect to the most suitable shading technique in the UAE.
2. Literature Review
Many studies have highlighted the significance of adopting shading techniques to reduce energy consumption for a more sustainable design. The impacts of various shading devices have been studied individually to find the optimum solution to improve the energy efficiency, thermal comfort, lighting control, and wind flow.
Li, et al. [4] discussed how buildings are one of the major sources of greenhouse gas (GHG) emissions due to the energy required for building operation. Energy consumption can also be influenced by the urban form, which includes solar access and the heat island effect. Therefore, shading is important in controlling energy consumption and (GHG) emissions, which improves building sustainability.
The energy savings were examined by applying three different types of shading at different orientations for an office building in Malaysia, studied by Lau, et al. [5]. The study investigated different cooling loads with different thermal performance and configuration. (IES-VE) was used for simulating shadings, such as horizontal, vertical and egg crate shading, for both studies [5,6]. The glazing was modelled as single 6 mm with a U-value of 6.38 W/m2k, different from the actual building of double glazing and low-e coating, to compare the difference in performance. Results showed energy savings of 1%–3.4% and savings increased to 5%–9.9% when shading is applied to all orientations of low-e glazing [5]. Similarly, a study in Malaysia conducted by Fadzil and Al-Tamimi [6] examined the reduction of cooling loads and solar gain. A fixed shading width of 600 mm was applied to ventilated and unventilated conditions for comparison. The results showed that a reduction in air temperature leads to increasing number of comfort hours by 66.8% and 67% for horizontal and egg crate shading, respectively. While, the number of comfort hours in unventilated and ventilated conditions was 26% and 4.7% for egg crate shading [6].
By implementing active strategies, such as increasing the temperature to 24 °C and upgrading the coefficient of performance from 2.88 to 5.3, the total energy savings reach 65% as discussed by Alkhateeba and Abu Hijlehb [7]. They used (IES-VE) software for evaluating the impact of active and passive measures in a federal building in the UAE, the Ministry of Infrastructure Development (MOID), in Ras Al Khaimah to decrease the electricity demand. Different shading devices were implemented on the southeast and southwest windows, such as the egg crate, vertical fins, and cantilever, concentrating on elevations exposed to solar gain. The results illustrated that egg crate shading had the highest energy savings compared to other shadings. Both passive and active optimal retrofits resulted in reducing the energy from 415.22 MWh to 69.23 MWh.
Freewan [8] investigated the outcome of using shadings on southwest oriented offices at Jordan university for temperature reductions, users’ interface, and visual comfort. (IES-VE) and Radiance software were used for simulation and real experiments performed to study the effect of vertical, diagonal fins and egg crate shadings. The vertical shading was 10 cm width with 7.5 cm gap, diagonal fins of 30 cm, 45° and 17 cm gap, while an egg crate of 10 cm in width with 15 cm gap between vertical fins and 7.5 cm gap between horizontal fins. It was found that the temperature reduction was similar till 13:00; however, diagonal shading showed better performance after that time. Egg crate and vertical fins shading allowed some penetration of light at 15:30 to 16:30 and 13:00 to 18:00, respectively. Diagonal fins performed better when it comes to air temperature and daylight quality, and the egg crate improved the illuminance level and interaction of occupants, while vertical fins allowed more contact with the outdoor environment.
Kim, et al. [9] studied the configuration of an external shading device that was applied to an apartment in South Korea. (IES-VE) was used for a sequence of simulations to compare the energy savings in terms of external shadings and daylighting. Four cases were studied, namely overhang, blind system, light shelves, and experimental shading. For cooling loads, a short overhang of 0.63 m reduced the loads by 1.1 MWh, while longer overhangs of 1.53 m reduced it by 18% (1.9 MWh). While, blinds with between −10° and −80° slat angle had a reduction that ranged between 5.12 and 5.47 MWh, whereas long light shelves of 1.53 m had cooling reduction of 34% with slat angle of 0°, while 0.5 m shelves had reduction of 26%. This shows that the length of the shadings effects the energy consumption.
Peng and Ying [10] discussed the effectiveness of internal shadings devices using Grey relational analysis (GRA) and EnergyPlus. To compare the difference in performance with internal shading, external shading and without shading. The experiment took place in Shanghai, China, in two similar rooms, with and without internal shading, where cooling loads were inspected. Energy saving by external shading was 64.1% compared to internal shading of 56.2%. However, using EnergyPlus for further simulation, it showed that solar transmittance, distance between the window and shading, and solar reflectivity are main aspects that can change the performance of internal shadings. While utilising GRA it was found that visible reflectivity, solar reflectivity, thickness, and infrared hemispherical emissivity are the most important factors to improve internal shading performance.
A comparison between the impacts of different internal shadings on the lighting intensity in office rooms was investigated by Khalid and Othman [11]. Two internal shadings, roller and venetian blinds were experimented by observation and measurement with lux meters in Malaysia. The lux meters were placed at different distances, 1 m, 2 m, 3 m, and 4 m from both closed blinds. Results exemplified that roller blinds had the highest illuminance at noon and the average illuminance level for all distances were 261 lux. The illuminance levels reduced by 37%, 81%, 90% and 96% at each distance measured, respectively. While, the average was 295 lux for venetian blind, the reductions of illuminance level were 30%, 79%, 88% and 94% at distance 1 m, 2 m, 3 m, and 4 m, respectively. This showed that venetian blinds performed better in keeping the illuminance at an ideal level.
Two studies were conducted in Qatar by Ouahrani and Touma using mock up and EnergyPlus [12,13] to inspect the effects of shading and daylighting control on energy savings for external venetian and brise-soleil [12]. The temperatures were set to 24 °C with no internal load and Styrofoam insulation of 0.3 W/m2k. The results illustrated that brise-soleil with inclination 45° and vertical shading had 7.7% and 18.6% of energy savings to south and north orientations, respectively. Meanwhile, the inclination of 90° increased energy savings to 9.1% and 20.6% when blinds were applied, eliminating glare to the south orientation. Energy saving reached 26.1% with shading and lighting control [12]. On the other hand, the energy savings and reduction in carbon emissions were examined by the application of shadings and light control on all orientations [13]. The results showed energy savings of 23.8% and 23.4 kg of CO2 in the south orientation, which further reduced with lighting control to 28.2% and 27.7 kg of CO2. Similar savings in the north orientation, where shading saved 11.6% of energy and 8.7 kg of CO2, however, after combining it with light control, savings increased to 14.1% and 10.5 kg of energy and CO2, respectively. The east and west orientations had savings of 28.3% and 27.9 kg of energy and CO2 when shading is combined with lighting control [13].
Lee and Alshayeb [14] examined the optimal control of shading in a naturally ventilated double skin façade building while maintaining the natural ventilation efficiency with energy saving in University of Kansas, USA. The CFD numerical method was utilised to simulate the air flow. Horizontal and vertical shadings were tested at 0°, 30°, 60°, and 90°. The results illustrated that at 90° degrees the heat transfer into the building is minimised. While, the air velocity at 0° shades was higher than that at 90°. For energy consumption, the horizontal shading at 30°, 60° and 90° had energy savings of 0.4%, 2.6% and 6.4%, respectively. The cooling consumption increased, and heating consumptions dropped at higher angle for both shadings. This showed that horizontal shadings at 90° resulted in the lowest energy consumptions.
Testing the practicality of implementing passive cooling strategies to improve the thermal performance and cut down the consumptions of a residential building in Dubai, UAE, was the purpose of this study conducted by Taleb [15]. Using (IES-VE) and Design Builder software to measure the performance where eight different passive cooling approaches were implemented with shading. Both the software results were compared with the actual measurements. Horizontal louver shadings were placed in the south east orientation with 45° to block solar gains. The results displayed that good shading techniques with double glazing, natural ventilation, in addition to the green roof, resulted in reduction of energy by 23.6% and cooling loads by 9%.
Hammad and Abu-Hijleh [16] investigated the influence of dynamic louvers on energy for an office located in Abu Dhabi. Utilising (IES-VE) to estimate the energy performance by implementing louvers to south, east and west facades. The results illustrated that the savings was 34.02%, 28.57% and 30.31%, in south, east, and west orientations, respectively. Comprehensive analysis demonstrated that the optimal façade static angle was −20°. While the light dimming strategy only saved 24.4%, 24.45%, and 25.19% for south, east, and west orientations, applying fixed louvers at 20° resulted in savings of 31.28%, 26.08% and 25.97% to each orientation, and when glazing with a high shading coefficient was applied, it resulted in savings close to dynamic louvers. This showed that for the east and west façades, the light dimming strategy would be adequate.
Horizontal shading showed a reduction in velocity by 0.3 m/s when implemented on side hung sash window (SHW) with 84% opening and 0.28 m/s when applied to horizontal sliding window (HSW) with 54% opening as investigated by Kannan et al. [17]. Using the CFD numerical method to determine the wind velocities, 30% was the opening of the inlet and outlet windows from the total floor area and 7 m/s was assigned as the outdoor air velocity. This study showed that horizontal shading does influence the air flow when implemented on different window types.
Aerodynamic implication related with shading and windows should be considered when weighing different design decisions as windows and shading techniques can either minimize or enhance the flow of air indoors according to Hildebrand and Wankaeo [18]. A classroom model of dimensions 4.25 × 4.5 × 2.9 m was created to examine the air flow of two types of shade (perforated panel and exterior louvers) in a warm humid climate. The shades had 53% porosity of 100 × 13 mm tilted downwards at 22.5° and spaced at 95 and 190 mm on centre. The results showed that perforated panel had higher velocity ratio at 90° while the louvers had higher velocity ratio at 0° and 45° when tested individually. When combined with double hung and awning windows, it resulted in reduction of 15.8% and 33.2% in velocity ratio for plan view. These results demonstrated that each shading type will result in some change to the velocity of air flow indoors.
There is different literature that has successfully performed energy modelling for some external and internal shadings but failed to extensively provide a data comparison between internal and external shades in terms of energy savings and daylighting. Moreover, there was lack of comprehensive studies that adapted these shading techniques when allocated to high rise commercial buildings in a hot climate. On the other hand, very few studies have investigated the effect of external shading techniques on natural ventilation, as most of the literature only emphasised different window types and positions, but not shading devices. The point of differentiation for this study is the examination of different shading techniques, to compare the energy savings, reduction in cooling demand, and daylighting improvements for external and internal shades, in addition to investigating the influence of different external shades on natural ventilation.
3. Methods
The methodology is split in two sections, namely the use of IES-VE for modelling different shadings to find its effect on energy consumption, cooling loads and daylighting, while CFD is utilised for the numerical analysis of wind flow for external shadings.
3.1. IES-VE Methodology
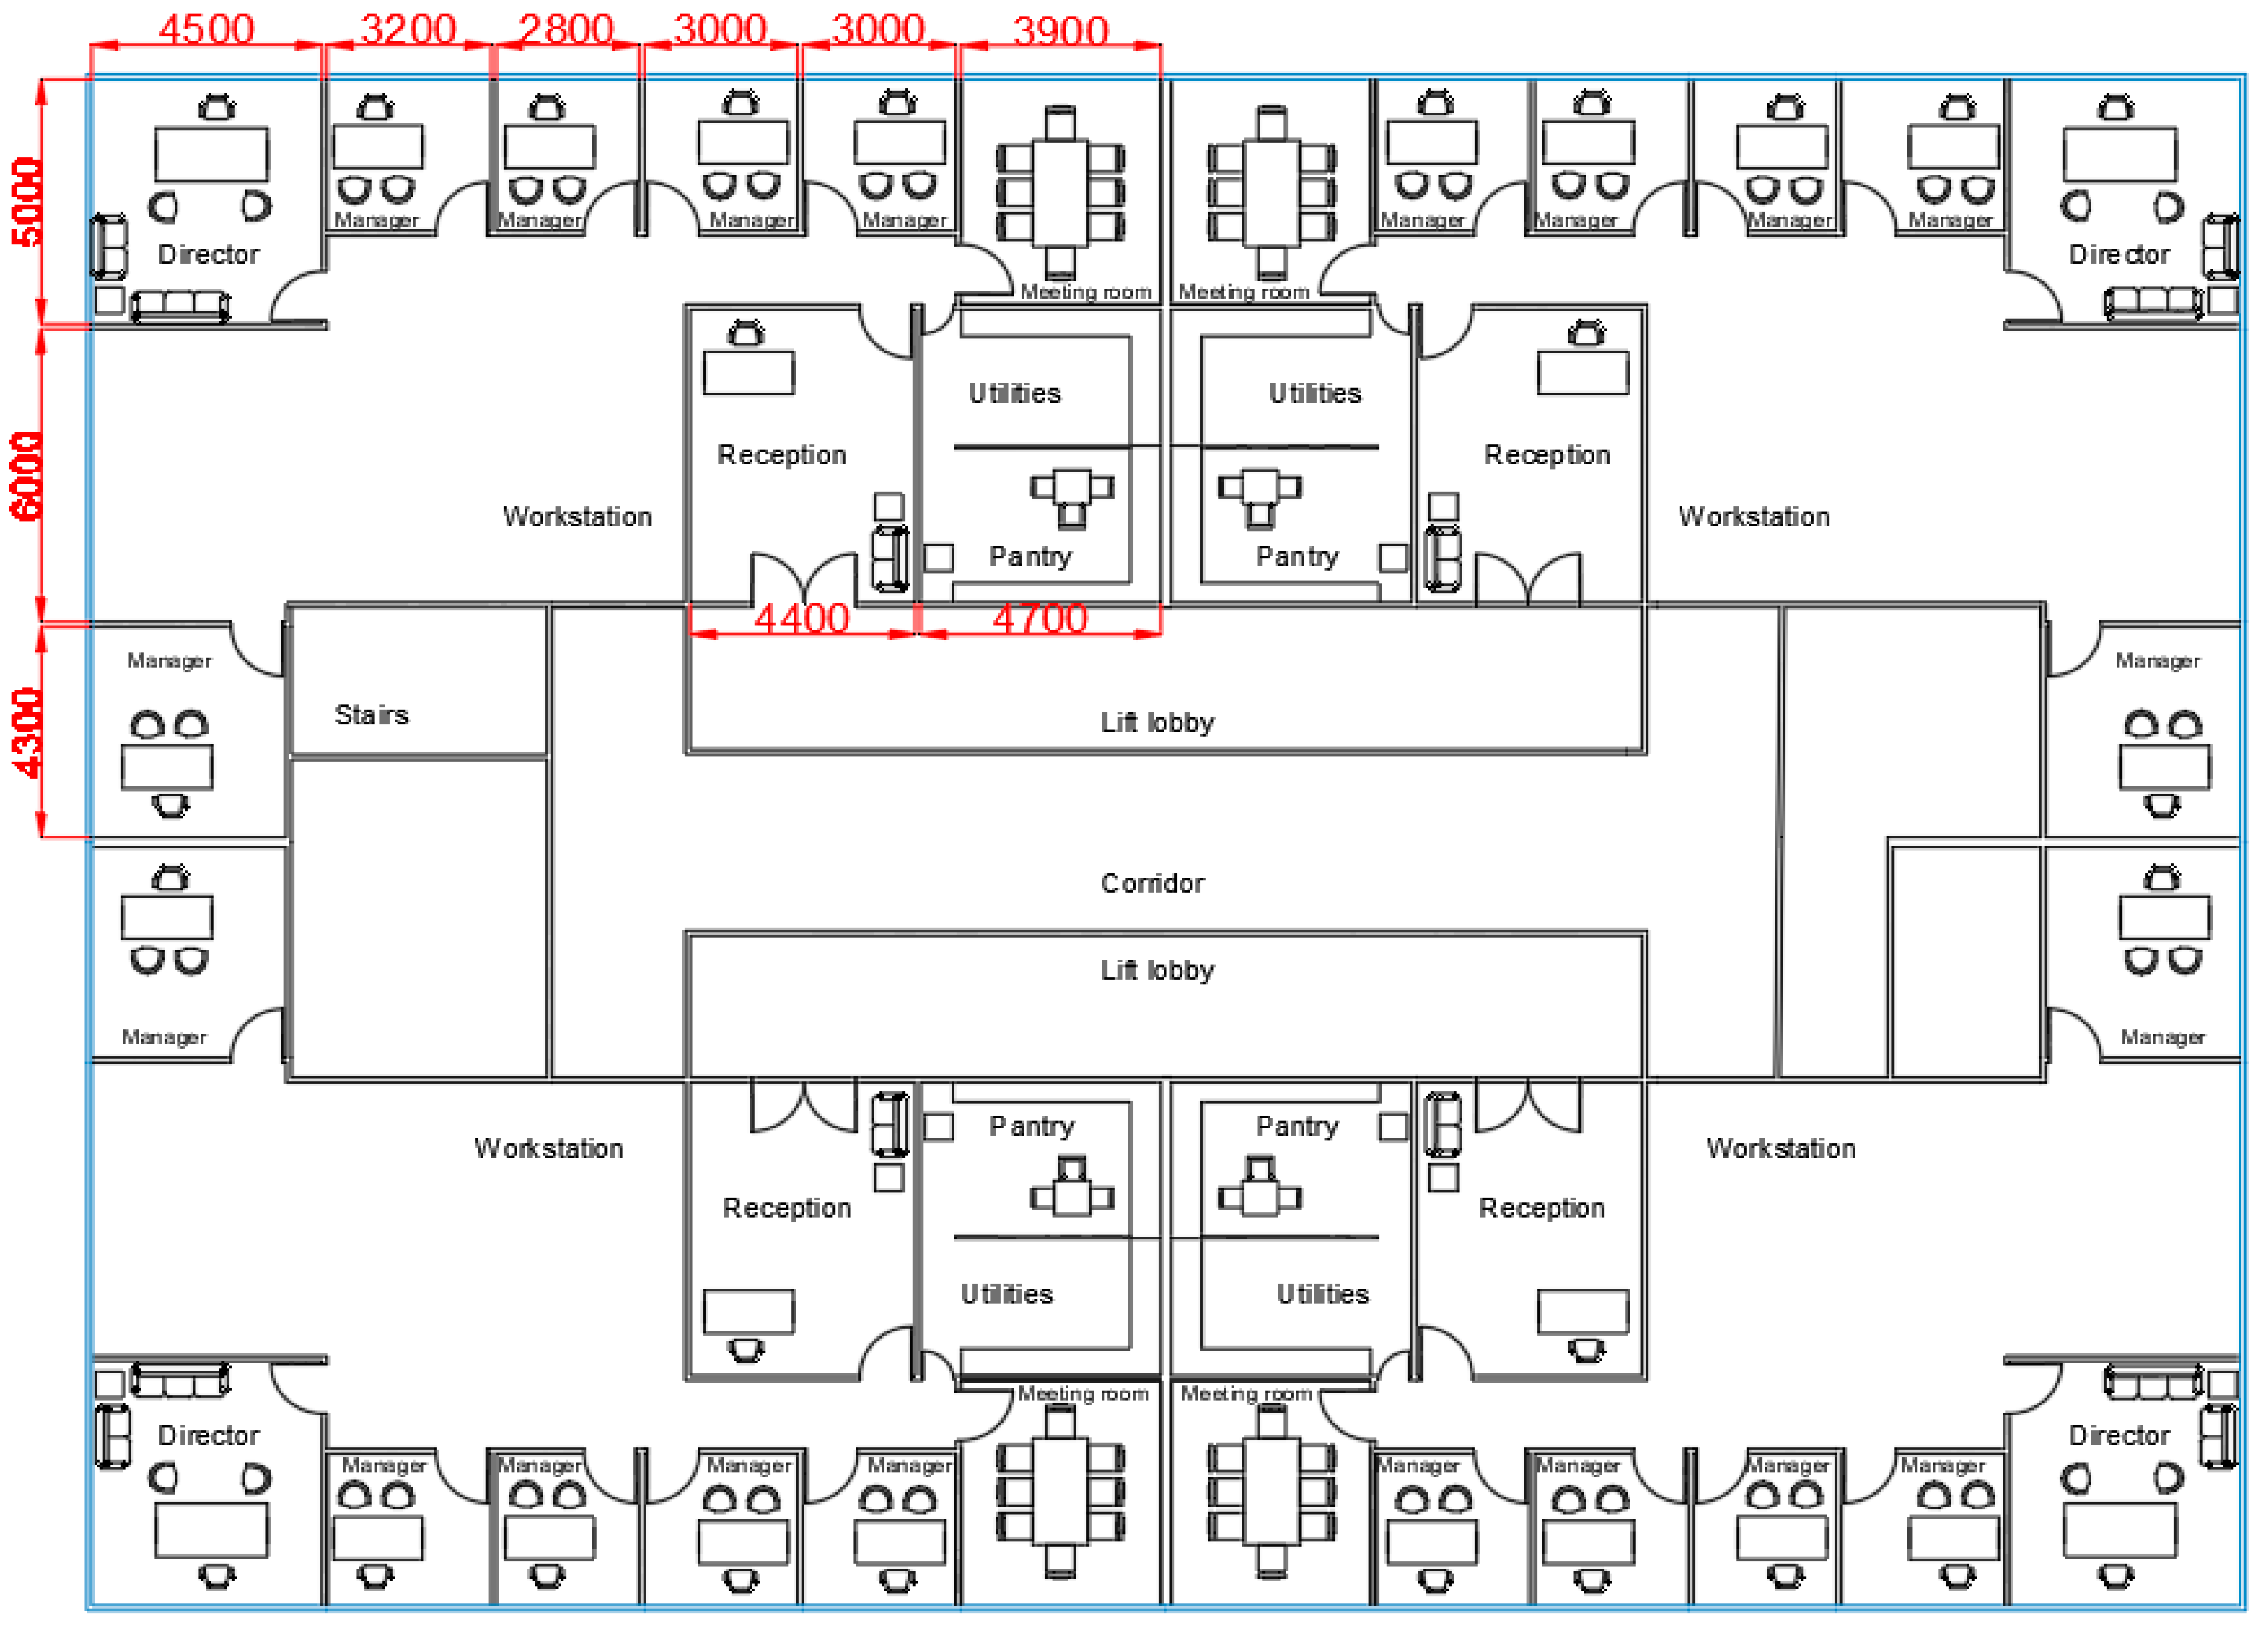
Integrated environmental simulation virtual environment (IES-VE) was used to measure the alterations of energy consumption and cooling loads for different external and internal shading devices. In addition to daylight factor and illuminance levels, IES-VE was used to compare the effect of different shading types. The office building occupied a total area of 43,696.8 m2, height of 136 m and 34 floors, with office space area of 1248 m2 for each floor plan. The floor plan had four offices, each of which is divided into an open plan workstation, manager rooms, and meeting room as shown in Figure 1.
3.1.1. Shading Based on Latitude
The overhang, horizontal and vertical louvers shading dimensions are considered as the functions of the country’s latitude as according to Saifelnasr [19]. As the case study building is in the UAE, the latitude of 26.5° N was used to find the depth of the overhang shading that will be suitable in the UAE to reduce solar gains. The depth by height ratio (d/h), was found out to be 50% for the UAE [19]. This ratio is then multipled by 3 m as the height of the window that needs to be shaded (refer to Equation (1)) to get 1.5 m as the depth of overhang shading. To maintain a constant volume between all the external shadings that are investigated in this study, the depth of the overhang shades is divided by the number of louvers for the horizontal and vertical louvers shading. For an equal comparison between the shades, the louver depth and spacing is kept constant between both the horizontal and vertical louvers (refer to Equation (2)).
The ratio (d/h) in percentage that is found from the design chart in [19] is then calculated using the formula below to get the depth of the horizontal shading (Equation (1)).
Louver depth is then determined by utilising the depth in the previous equation, as shown in Equation (2).
3.1.2. External Shading Devices
Table 1 illustrates all the external shadings that are implemented on the building façades to determine the influence of the shading techniques on energy, cooling, daylighting. All external shades are implemented at 90° degrees for equal comparison, refer to Section 3.1.2.1, Section 3.1.2.2 and Section 3.1.2.3 for further explanation on the methodology of each shade implemented.
3.1.2.1. Overhang Shading
The depth of the overhang shading was represented by a numerical formula and the latitude of the UAE to determine the depth by height ratio which is 50% [19]. Using the first equation, it was investigated that the overhang depth is 1.5 m. The overhang was then applied above each glazing in all floors to maximize the reduction of solar radiation into the offices.
3.1.2.2. Horizontal and Vertical Louvers Shading
The louver depths were determined by using Equation (2) to maintain a constant volume between all the external shadings simulated for fair comparison. The horizontal louvers are designed to be five louvers in each window height; thus, the depth of each louver is 0.3 m with spacing of 0.8 m. This shows that each window will have five shades on each orientation. While the width of the louvers was along the width of the windows of each floor.
On the other hand, the vertical louvers have the same depth of 0.3 m with spacing of 0.8 m for fair comparison. Therefore, 46 shades are applied to north-west and south-east orientations while 34 shadings are applied to south-west and north-east. The height of the vertical louvers is based on the height of the windows, since it is required that the vertical louvers span the whole window height.
3.1.2.3. Egg Crate Shading
The egg crate shading is a combination of horizontal and vertical louvers, thus the dimensions of the louvers utilised previously will be constant to form the egg crate shading applied to all orientations.
3.1.3. Internal Shadings Devices
Table 2 below demonstrates the internal shades considered in this study to examine their influence on energy consumption, cooling demand, and daylighting simulations.
Vertical Internal Blind Shading
Vertical internal blinds are created as a shading in IES-VE Model IT as local shades. The dimensions of the vertical blinds utilised in this study is 0.005 m thick and 0.15 m wide covering window height. The vertical blinds are created to be all around the windows of the building and partially open with a slat angle of 30°.
Roller Blind Shading
Roller blinds are created in the construction template in IES-VE applied all around the windows of the building. The roller blinds used in this research were of the net type material and open weave with a shading coefficient of 0.85 [20].
Venetian Blind Shading
Venetian blinds are internal shading that are commonly used in commercial buildings. The venetian blinds used in this study are created in the construction template in IES-VE is fully open with slat angle of 0°, shading coefficient of 0.61, and short-wave radiant fraction of 0.3. When the blind in partially open with a slat angle of 32° the shading coefficient increases to 0.81 and the short-wave radiant fraction is 0.4 [20]. Both the angles are examined to compare the difference between energy consumption and cooling loads.
Light Shelves Shading
The light shelves utilise the same method of the overhang according to Saifelnasr [19], to find the depth of each shading device. However, the difference between the overhang and the light shelves shading is using the light shelve in the interior of the building windows instead of the exterior as the overhang shading. The light shelves are applied to every window of each floor with depth of 1.5 m where 0.3 m of the shade expand to the exterior and 1.2 m is within the interior of the floor.
3.1.4. Daylighting Simulation
The daylighting factor and illuminance was tested to investigate the lighting levels and daylight factor after implementing every shading technique using the FlucsDL daylighting assessment tool. The lighting analysis is set on the horizontal plane with margin of 0.5 m as recommended by CIBSE guide A [21]. In addition to the receive and reflect light is set to the external room surface and surface from shading bodies, similar setting conducted for the obstruct light. These setting are kept constant for all the external and internal shading techniques.
3.1.5. Model Input Parameters
The model thermal templates were set as shown in Table 3. The building is modelled in a hot climate, and only cooling is set with a constant set point of 23 °C and is set off on the weekends with an infiltration rate of 0.25 ACH (CIBSE guide A, section 5.10.4). According to CIBSE guide A, Table 6.1, the maximum sensible heat gain for lighting was set to 12 W/m2, while equipment is 25 W/m2. For an office building the sensible heat gain is 70 W/p, since occupant’s have a seated job, while occupancy density is 10 m2/person, as referred to Table 6.3, CIBSE guide A. According to CIBSE guide B, Table 2.9 [22], the auxiliary ventilation for offices and washrooms are shown in Table 3. Referring to CIBSE guide A, the auxiliary ventilation is 10 l/s/p for circulation. The same templates are used for all the models for the external and internal shadings.
Zones Profile and Materials
Table 4 demonstrates the zones profiles set for the office building, showing if its either on or off continuously or set to a weekly profile on weekdays from 7 a.m. to 6 p.m. While Table 5 illustrates the materials utilised for the building with their U-values, conductivity, density and specific heat of each layer.
3.2. CFD Methodology
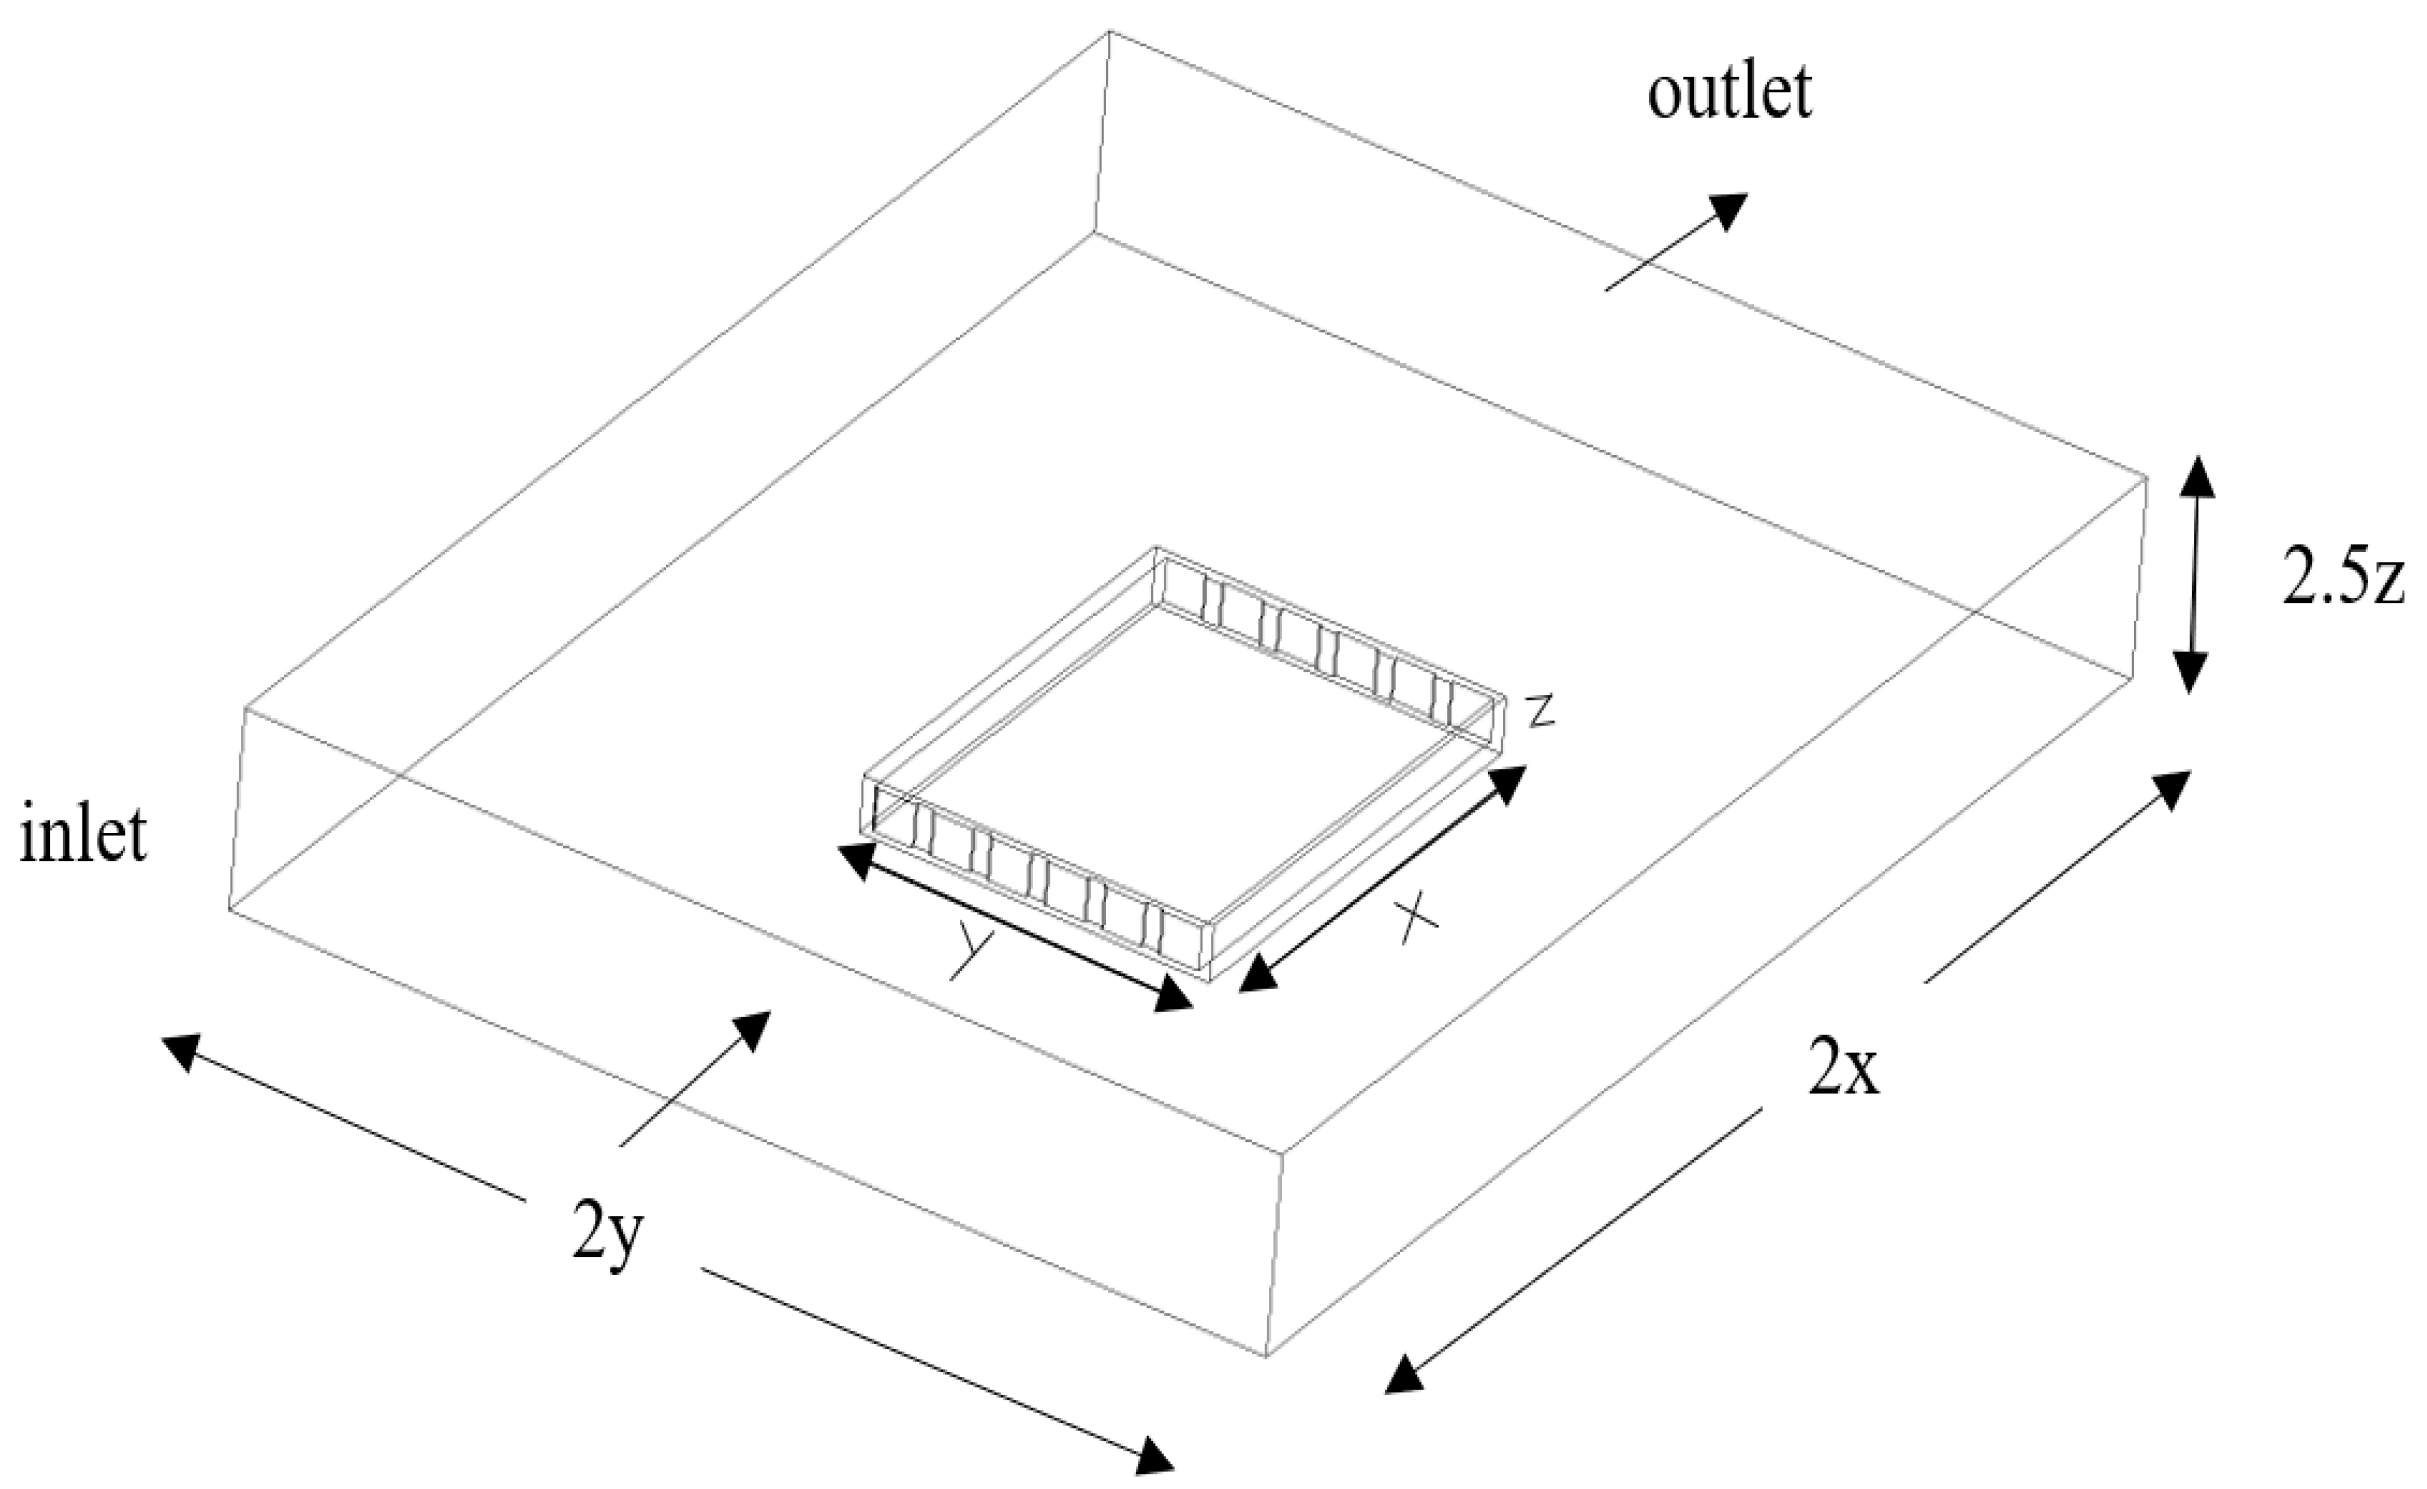
Computational fluid dynamics (CFD) simulation was conducted to measure the difference of air flow velocity when different external shading techniques are applied to the benchmark model, shown in Figure 2. Utilising ANSYS workbench 19.2 to create all the models, as shown in Table 6, which will be used to determine the ideal shading technique in terms of the air velocity flow throughout the space.
3.2.1. Physical Domain
The geometry was created by modelling one floor plan to test the air flow which will be utilised to examine the different external and internal shadings. Firstly, the benchmark was modelled as an open space area creating six windows on each side opposite to each other as the inlet and outlet for the air flow, each window was 3.5 m wide and 3 m high. For simulating the external and internal air flow an enclosure was created of two times the size of the room with height of 10 m, Figure 2. Similarly, all the shadings are added to the benchmark geometry as illustrated in Table 6.
3.2.2. Mesh Statistics
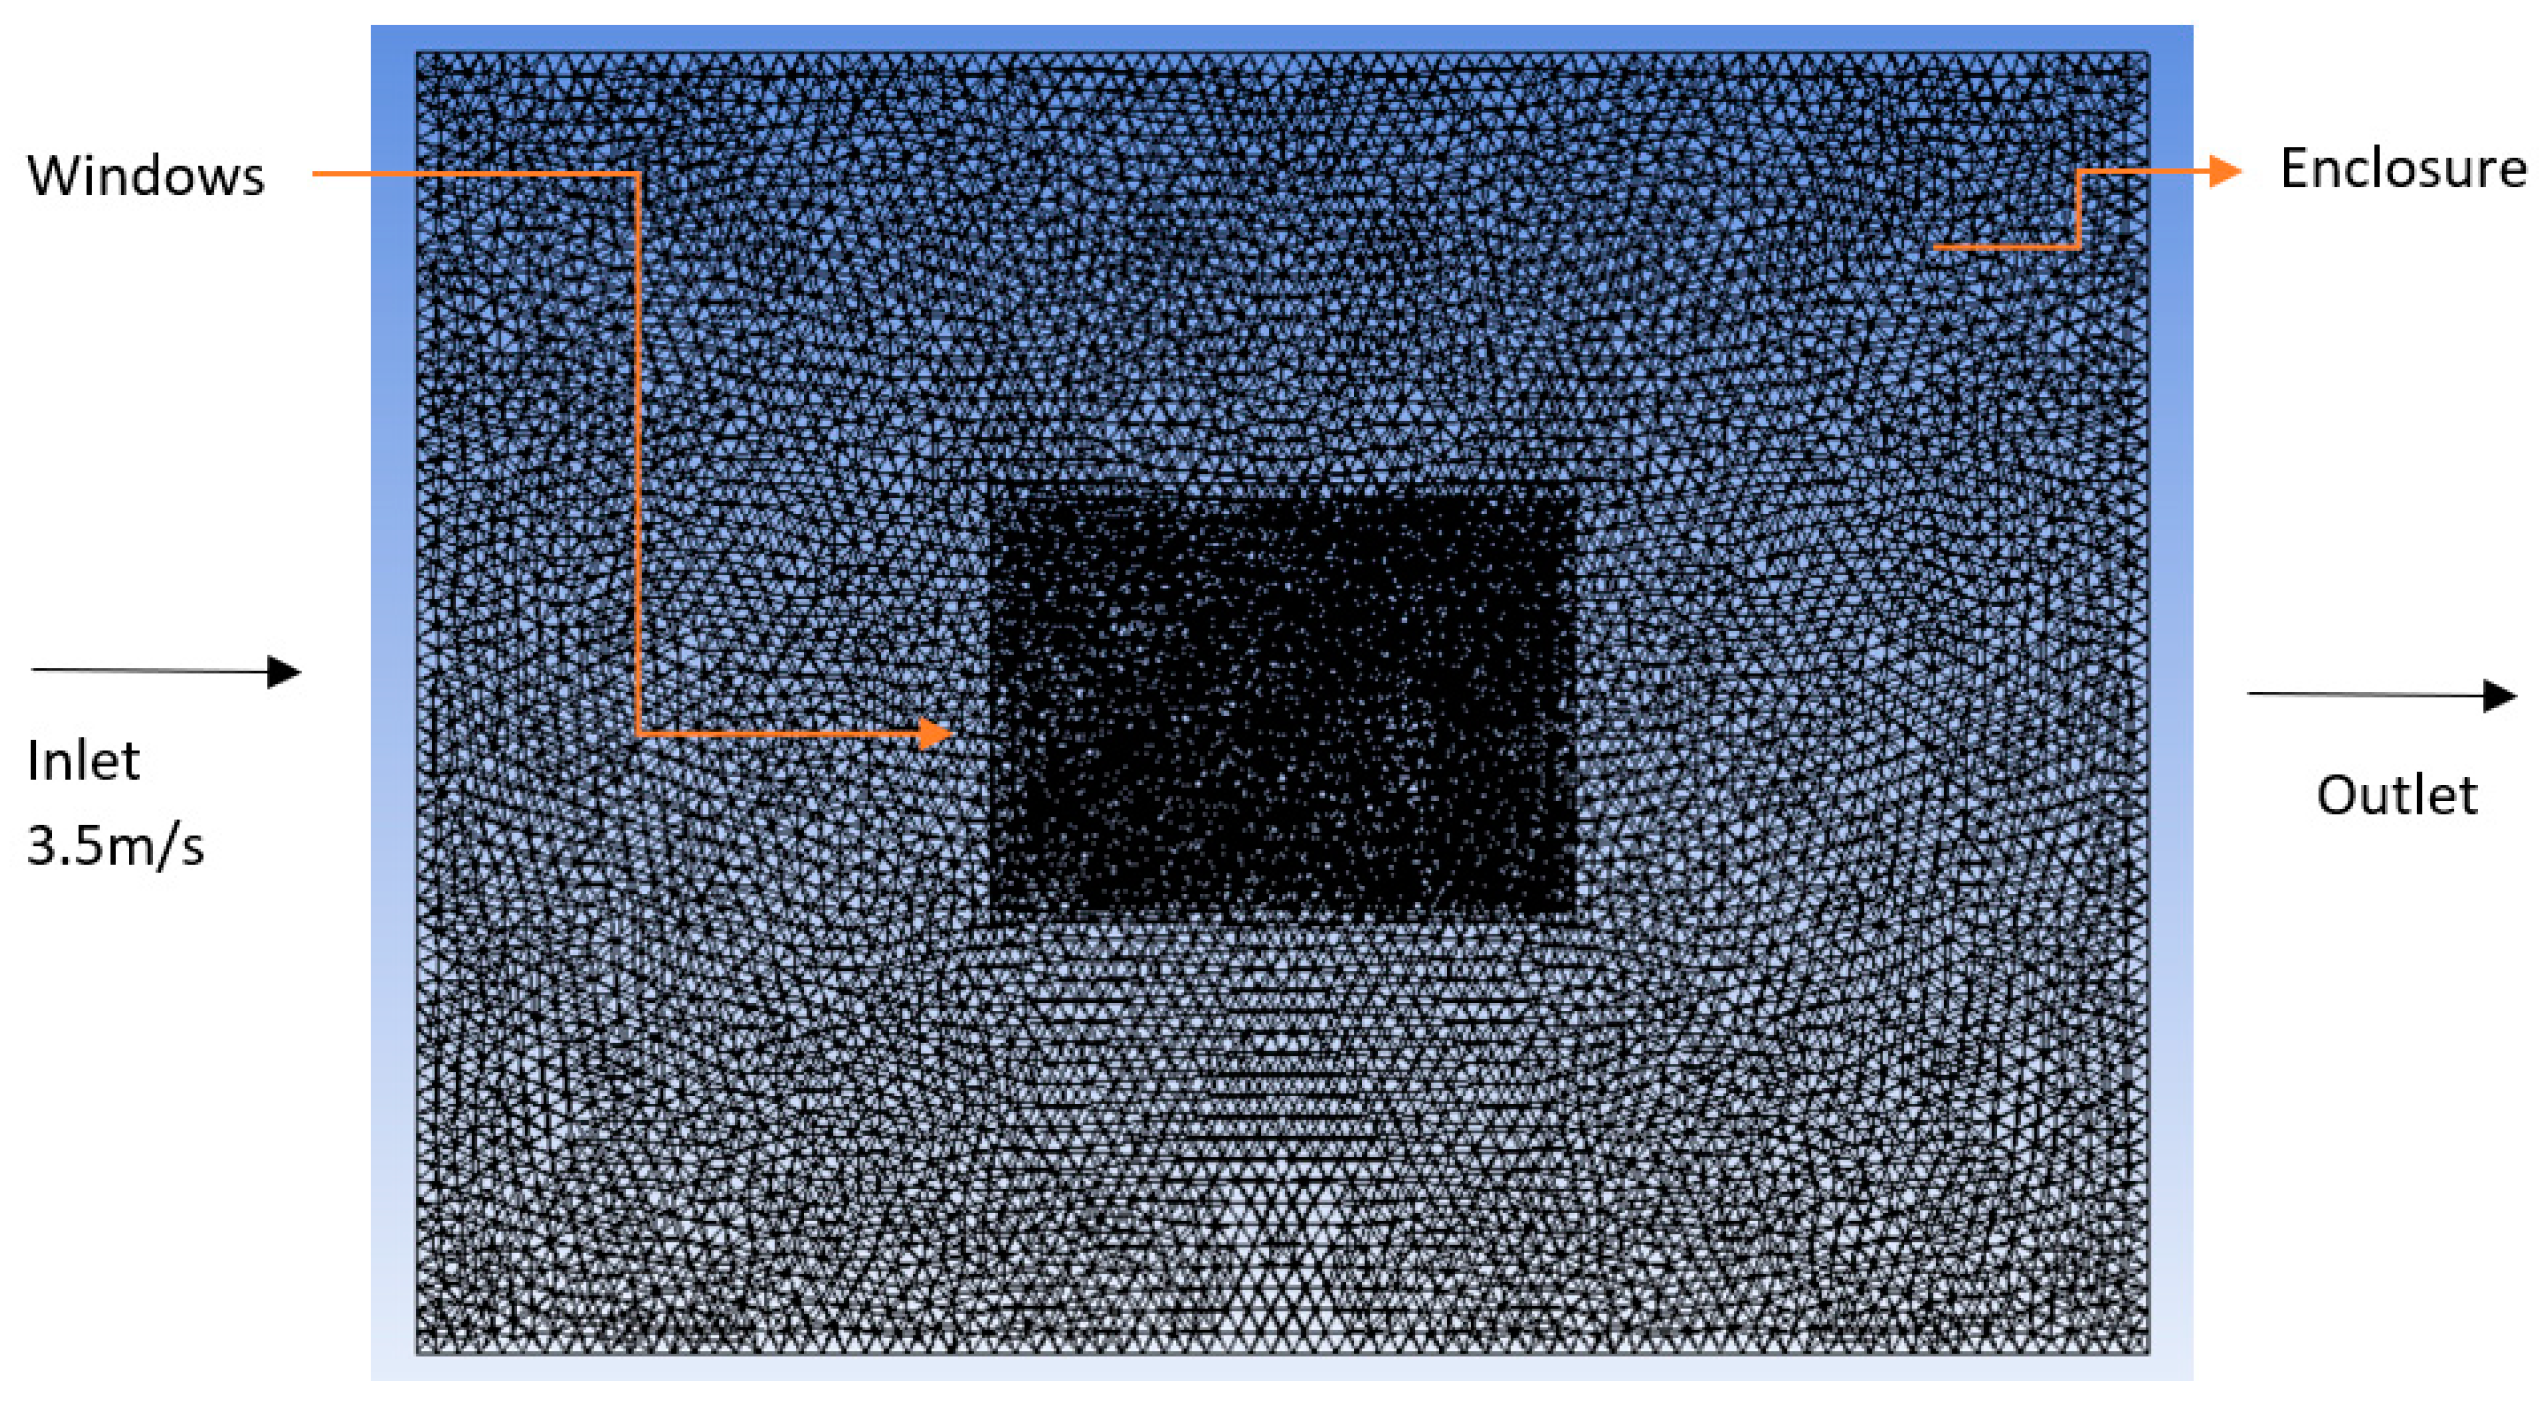
The meshing was set to a fine mesh of element size 1.5 m as shown in Figure 3, presented as one floor plan with the enclosure to simulate the air flow into the office. Meshing element was kept constant to all the shading models for equal comparison. Next, names were assigned to the inlet and outlet on the opposite sides of the model, while the floor plan was named as a room to find the velocities of each model implementing different shades. Table 7 demonstrates the nodes and elements of each external shading technique meshed, where the benchmark model having the lowest element and node values of 255,176 and 51,866 respectively, as a result of no external shading added to it. Whereas the egg crate shading has the highest values of 280,837 elements and 59,213 nodes due to the combination of vertical and horizontal shadings.
3.2.3. Boundary Conditions
The boundary conditions were applied to the CFD model as indicated on Table 8. The materials under setup model was assigned as air for the air flow through the floor and the model viscous was changed to standard k-epsilon equation (k-ε) for turbulent air flow. Inlet air velocity was set to 3.5 m/s in the boundary conditions as mentioned by Ouarda. et al. [23]. Whereas the convergence criteria were set as 1 × 10⁻³ for pressure, momentum, turbulent kinetic energy, turbulent dissipation rate and turbulent viscosity for improved results while the rest is kept as default. All the inputs of the methodology were constant between the simulations carried out for fair comparison, Table 8.
4. Results
The results are divided into two sections, namely the IES-VE section, which shows a comparison of external and internal shadings examined in terms of energy consumption and cooling loads, in addition to the influence of the shadings on daylighting factor and illuminance levels. The CFD section highlights the air flow velocities and contours after implementing the shading technique.
4.1. IES-VE Results
4.1.1. Energy and Cooling Loads
Energy consumption and cooling loads for all external and internal shades simulated are listed in Table 9 below. The benchmark model with no added shading shows the highest energy and cooling values of 19,468,922 kWh and 18,471,650 kWh, respectively. The application of the external shades illustrates that the vertical louvers have the least effect on the energy consumption and cooling loads required for the office with reduction of 5.5% and 11.7% compared to the benchmark model, Table 10. While difference between vertical louvers in comparison to overhangs, and horizontal louvers is 1.91 kWh/m2 and 3.61 kWh/m2. Whereas, the egg crate demonstrates the highest reduction among all the external and internal shading techniques were the energy and cooling loads reached 17,731,153 kWh and 15,581,051 kWh, Table 9, with reductions of 9 and 16%, respectively. This saves almost 40 kWh/m2 of energy compared to the benchmark model, increasing the building sustainability.
On the other hand, the internal shading techniques showed lower savings in terms of energy and cooling loads in comparison to the external shadings. The vertical internal louvers have the lowest reduction of 3.5% and 7.4% for energy and cooling loads, Table 10. Followed by roller blinds that reduced the energy and cooling to 18,732,873 kWh and 16,999,625 kWh, this has savings of 3.8% and 8% respectively. While venetian blind had similar savings of 4.1% and 8.4% in terms of energy and cooling loads, the light shelves showed the highest reduction of 5.6% and 11.7% when compared to the other internal shades. The internal shadings showed the highest variation of 9.3 kWh/m2 between lighting shelves and vertical internal louvers, and 24.8 kWh/m2 compared to the benchmark model.
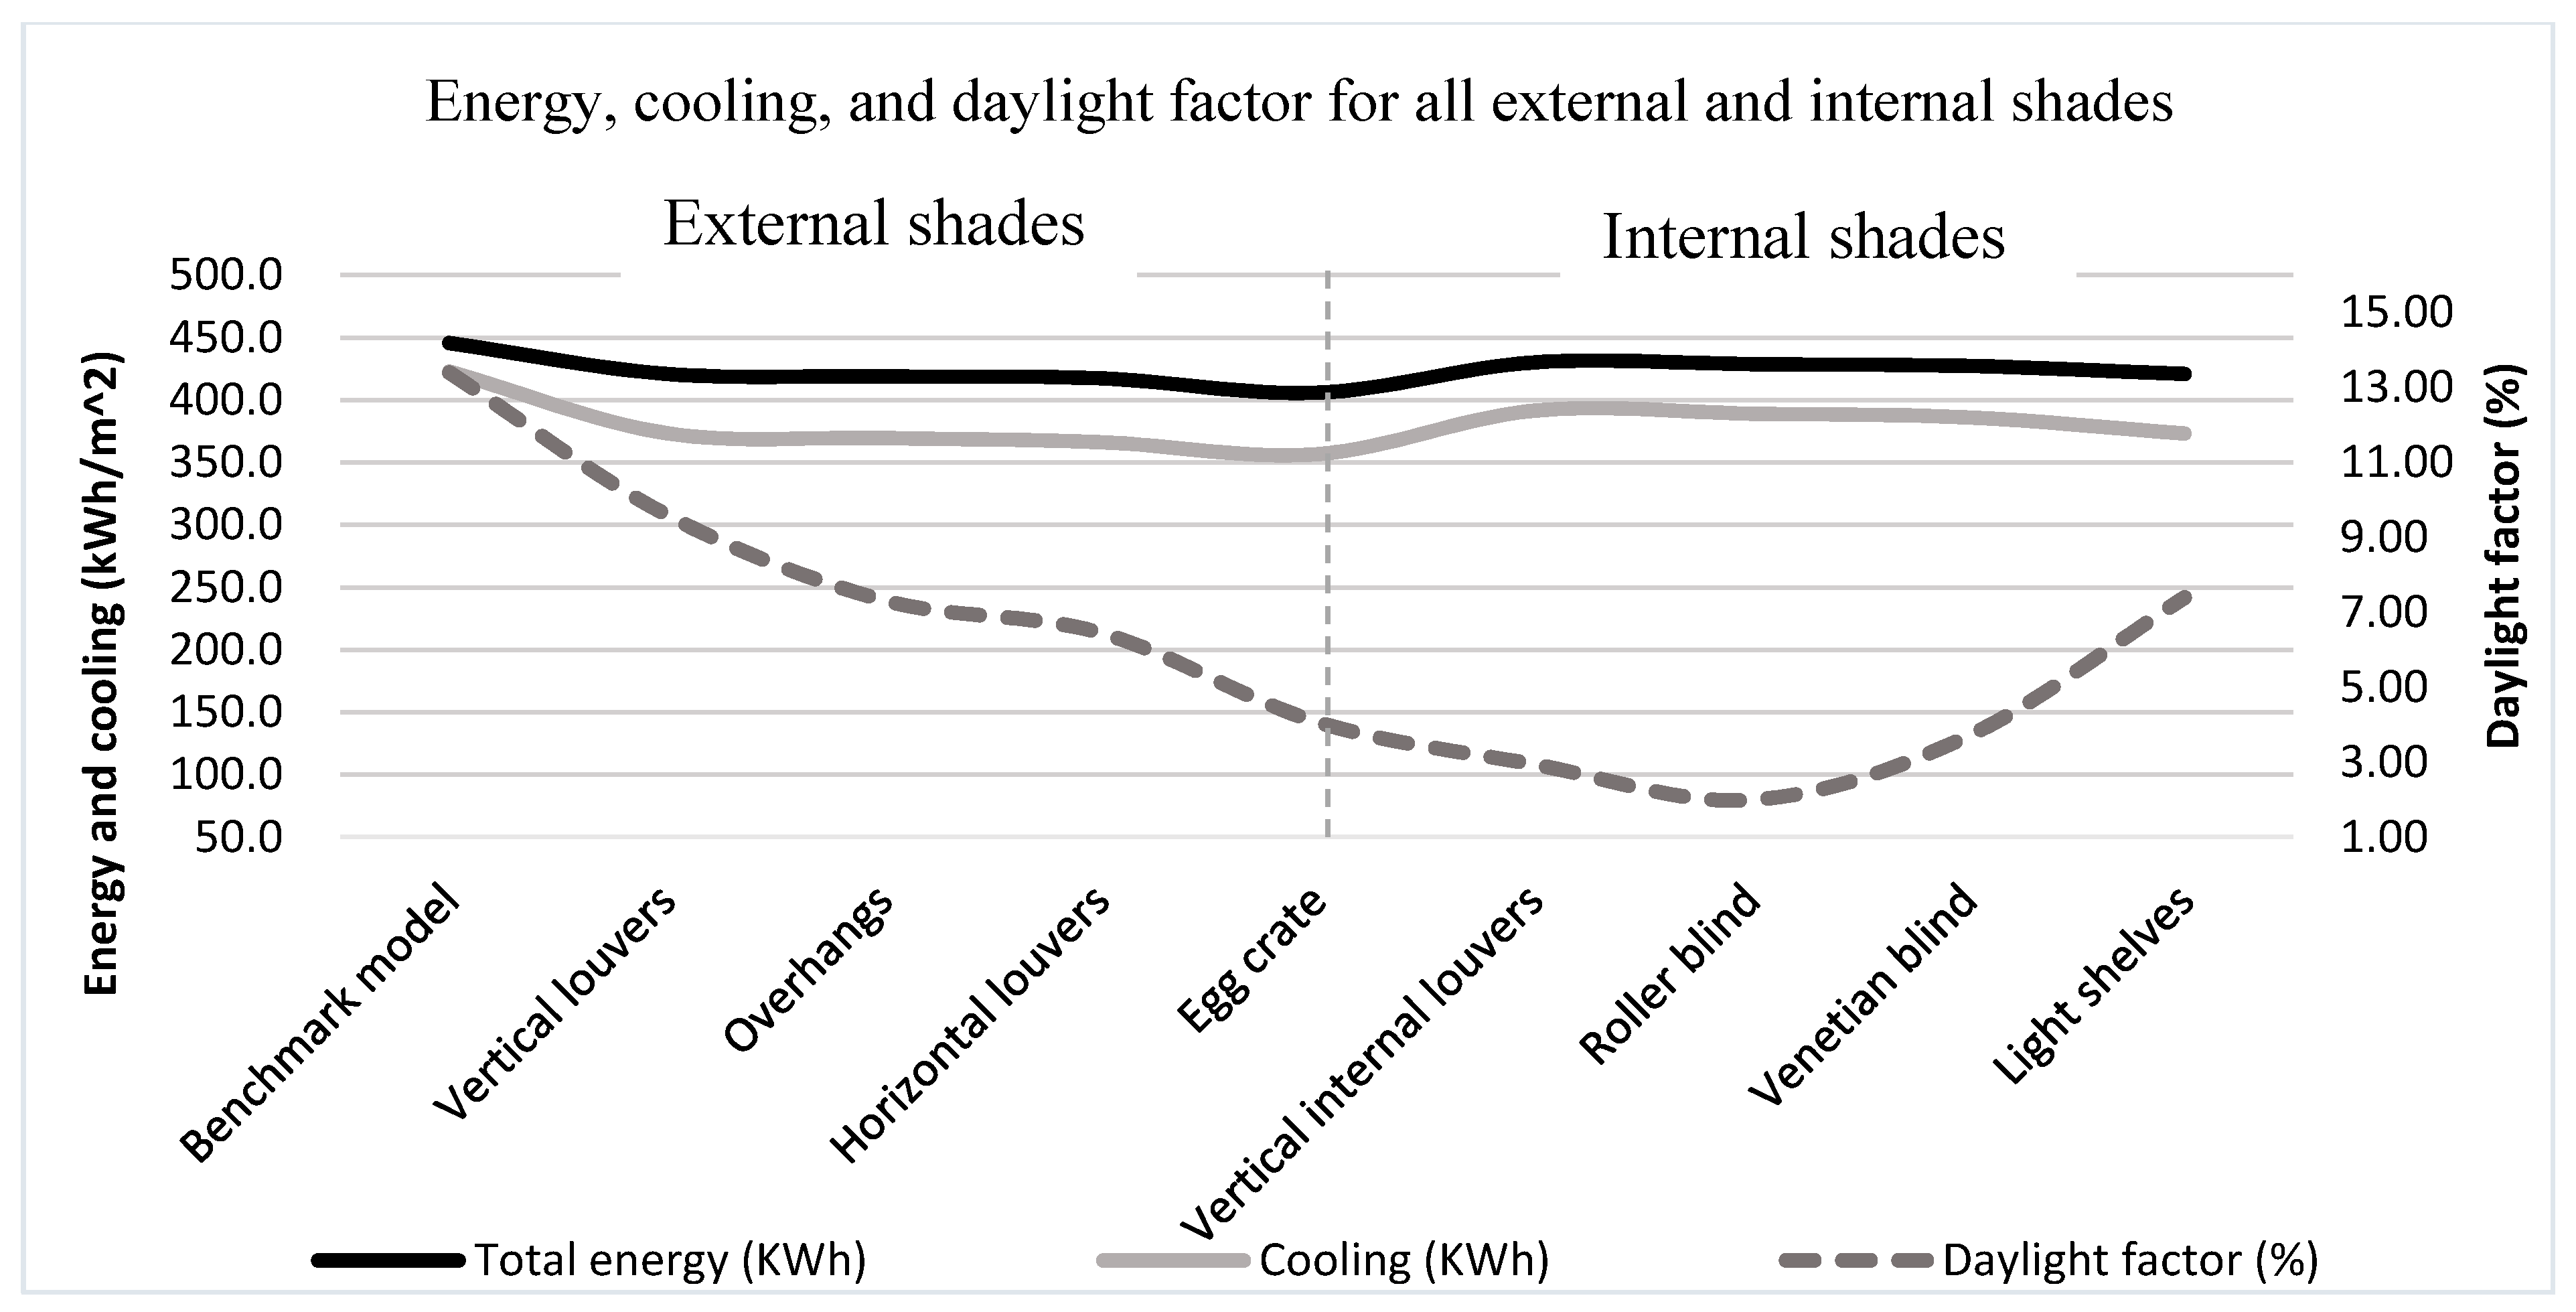
Figure 4 illustrates the comparison between the energy consumption and cooling loads for the benchmark model of 445.5 kWh/m2 and 422.72 kWh/m2 respectively, and all the external and internal shading techniques. This shows that egg crate has the highest savings compared to all shades, this is due to the combination of the horizontal and vertical shading.
The results of energy and cooling loads shows an interconnection with the previous research papers, as similar outcomes are discovered. The egg crate shading shows the highest savings of 9% in comparison to all external and internal shades, followed by both the horizontal louvers and overhangs, referred to Fadzil and AlTamimi [6]. As horizontal shadings effect the solar gains and radiations falling on the building façade, by blocking by the direct radiations, unlike the vertical shading. Since the vertical shades will only block the radiation that is hitting the building from the sides, but when the sun is perpendicular to the façade the vertical shade will be ineffective at 90° degrees. Thus, by tilting the vertical louvers to increase the glazing coverage, it will increase the energy savings. Furthermore, it is obvious that the energy consumption will show an additional reduction in the winter compared to the summer. Since the days in the winter are shorter, consequently, exposure to the sun reduces, hence the solar radiation falling on the façade will reduce, causing lower energy consumption and cooling loads. Additionally, the external temperatures in the winter is cooler, so lower cooling demand is required as the indoor temperatures is comfortable due to lower heat gains through building façade. According to ECON guide 19 [24], for good practice the energy consumed should be 234 kWh/m2, however, that’s for buildings of area 20,000 m2. Since the building designed for this research is more than 40,000 m2 the guideline benchmark would be doubled. This shows that all the models will lay under the good practice for annual energy consumption.
4.1.2. Daylight Factor and Illuminance
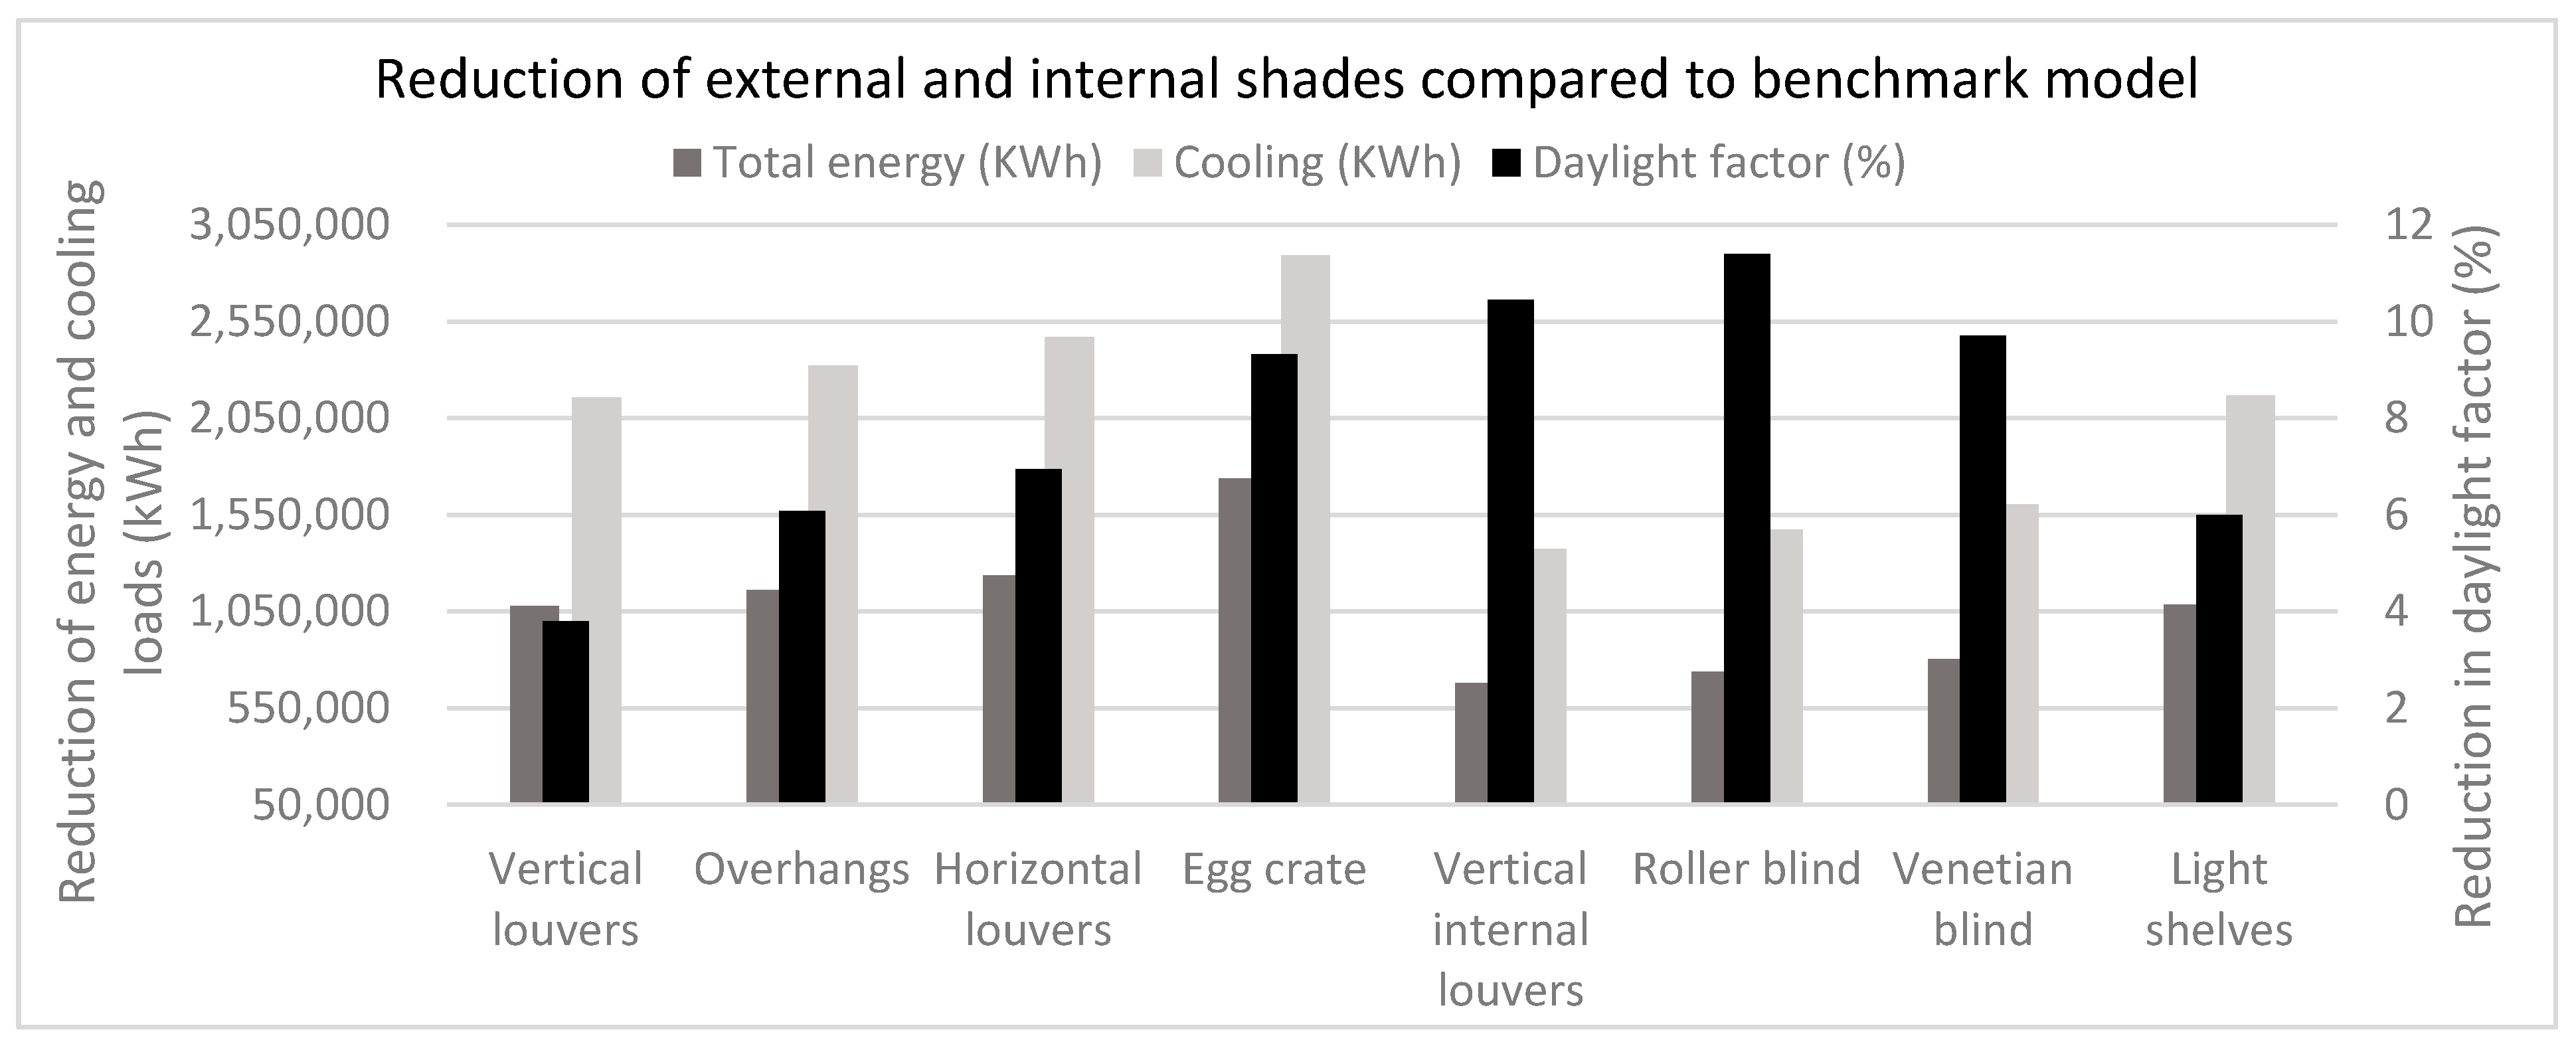
The average daylight factor and illuminance level are illustrated in Table 11 for each of the shades modelled, the benchmark model without shades has daylight factor of 13.4% and 1017.51 lux. The high illuminance levels will cause glare and visual discomfort; therefore, shadings are applied to enhance daylighting. When external shadings such as vertical louvers, overhangs, horizontal louvers and egg crate were implemented, the daylight factor decreased by 3.79%, 6.07%, 6.94%, and 9.32% which dropped the illuminance level to 720.62 lux, 895.85 lux, 483.09 lux, and 309.87 lux respectively, Table 11 and Figure 5. This resulted in decreasing the illuminance level by 29%, 12%, 53%, and 70% for each of the external shades as shown in Table 12.
On the other hand, for the vertical internal louvers, roller blinds and venetian blind has higher reduction in the lighting level compared to external shades, as the daylight factor dropped to 2.95%, 2.0%, and 3.70%, Table 11. Where the roller blinds showed the lowest daylight factor and illuminance levels as it decreased by 85% and 76% as illustrated in Table 12, the light shelve has a higher daylight factor and illuminance level of 7.4% and 533.3 lux which is 4.45%, 5.4% and 3.7% higher than vertical internal louver, roller and venetian blinds. This is due to the reflection of the sunlight into the room as it hits the surface of the light shelves.
Figure 5 expresses the reduction for all the external and internal shades for energy, cooling loads and daylight factor. The roller blind has the highest reduction of 11.4% among all shades and egg crate has the highest reduction between the external shades of 9.32%. This shows that internal shading has more influence on the daylighting levels than external shades, as mentioned by Othman and Khalid [11].
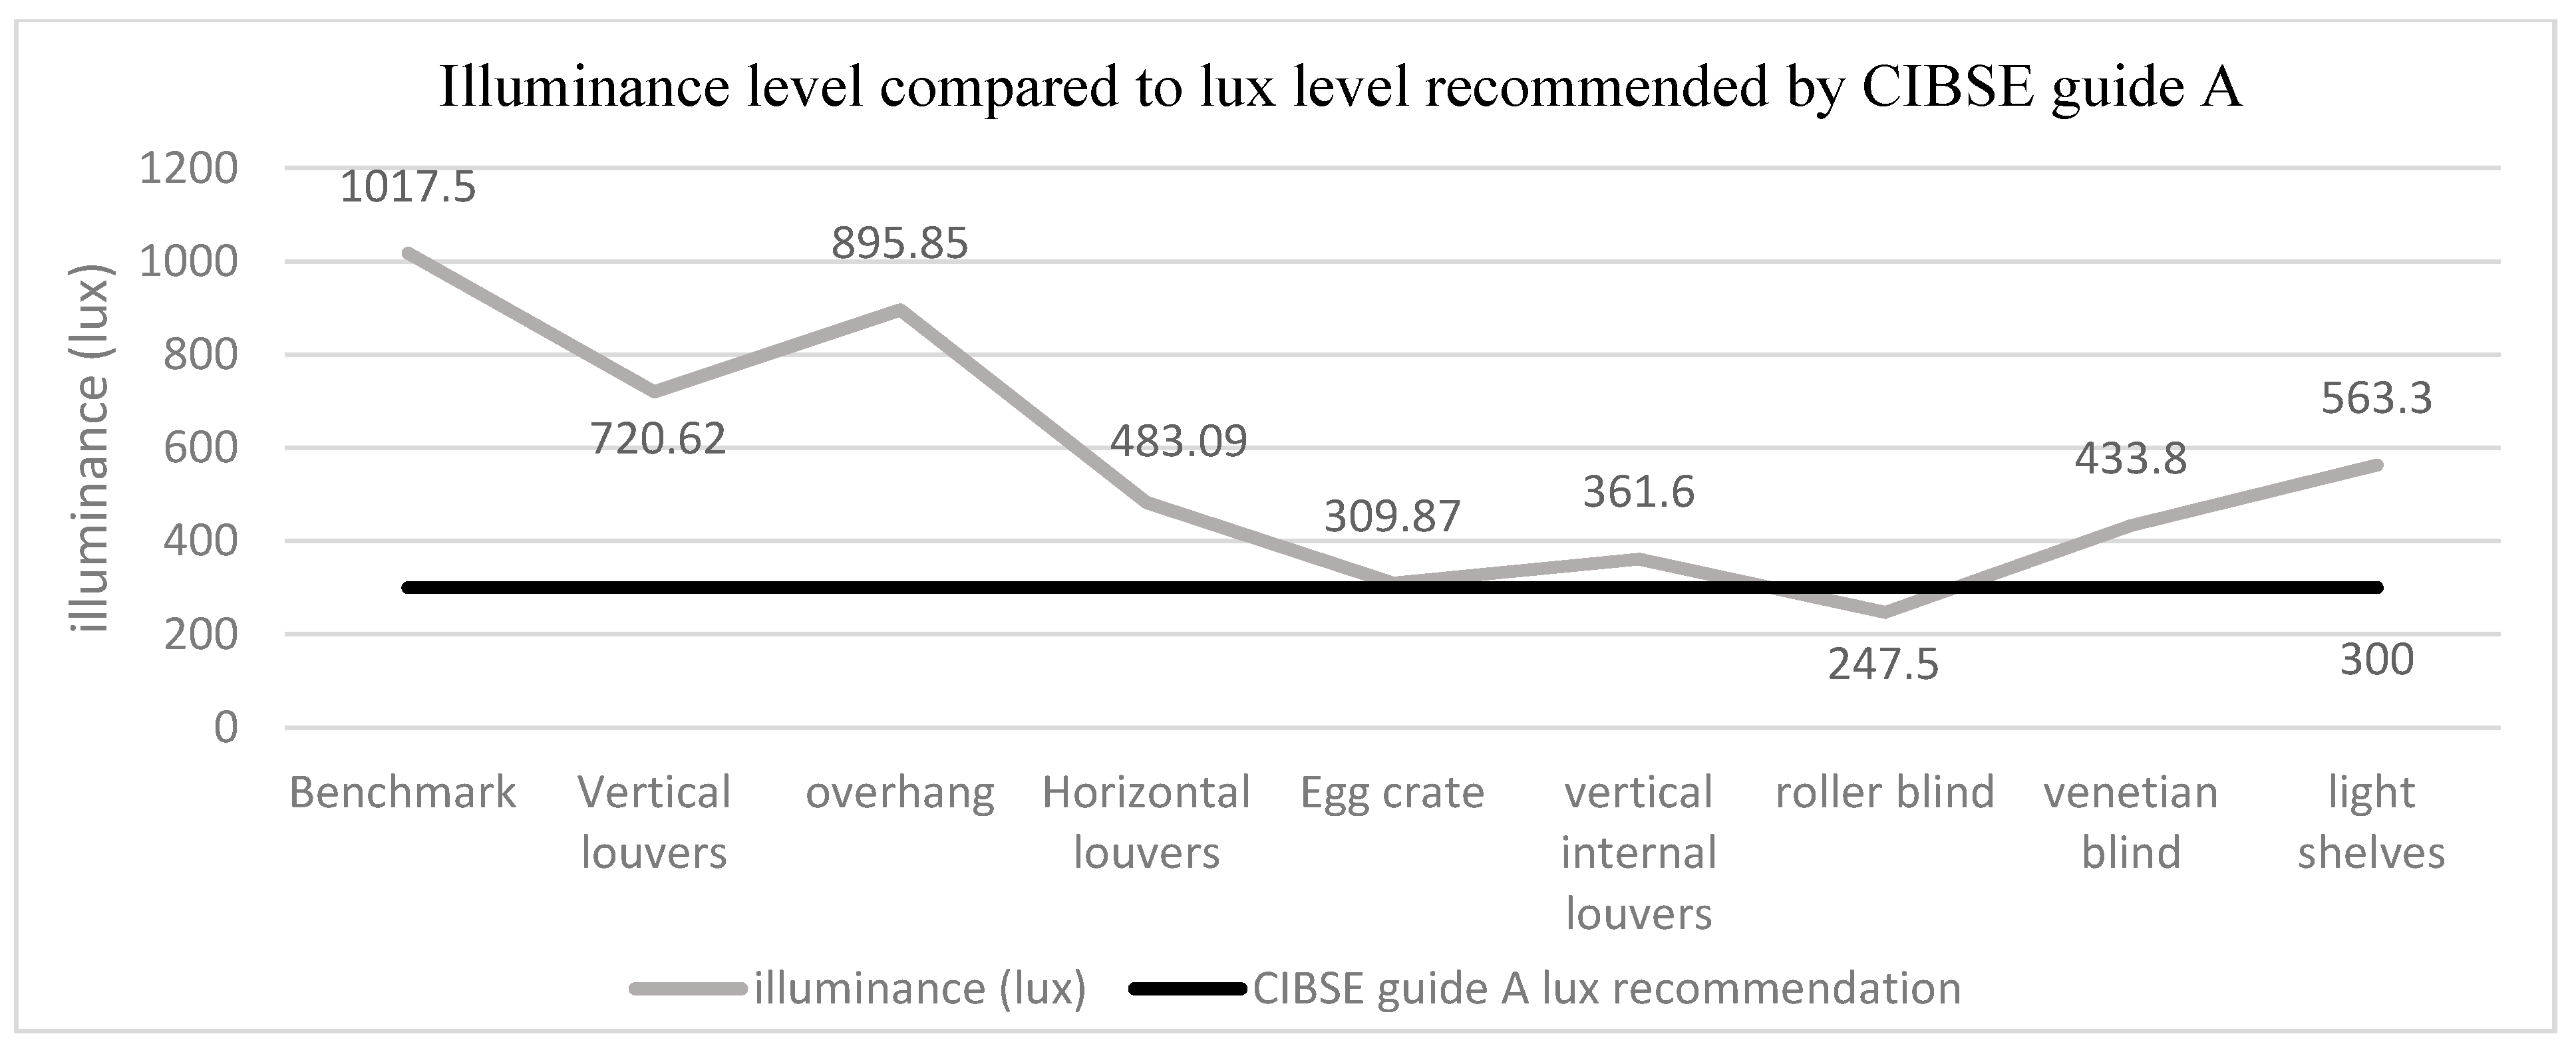
Alternatively, Figure 6 illustrates the external shading compared to the recommend illuminance value as according to CIBSE guide A of 300 lux, where the egg crate demonstrated the closed illuminance levels of 309.87 lux between all the models. Whereas, the overhang shade showed the highest illuminance levels of 895.85 lux, while the shading that has the most influence on the illuminance is the roller blind as the lighting level drops to 247.5 lux. This shows that the most appropriate shading for the office building is egg crate.
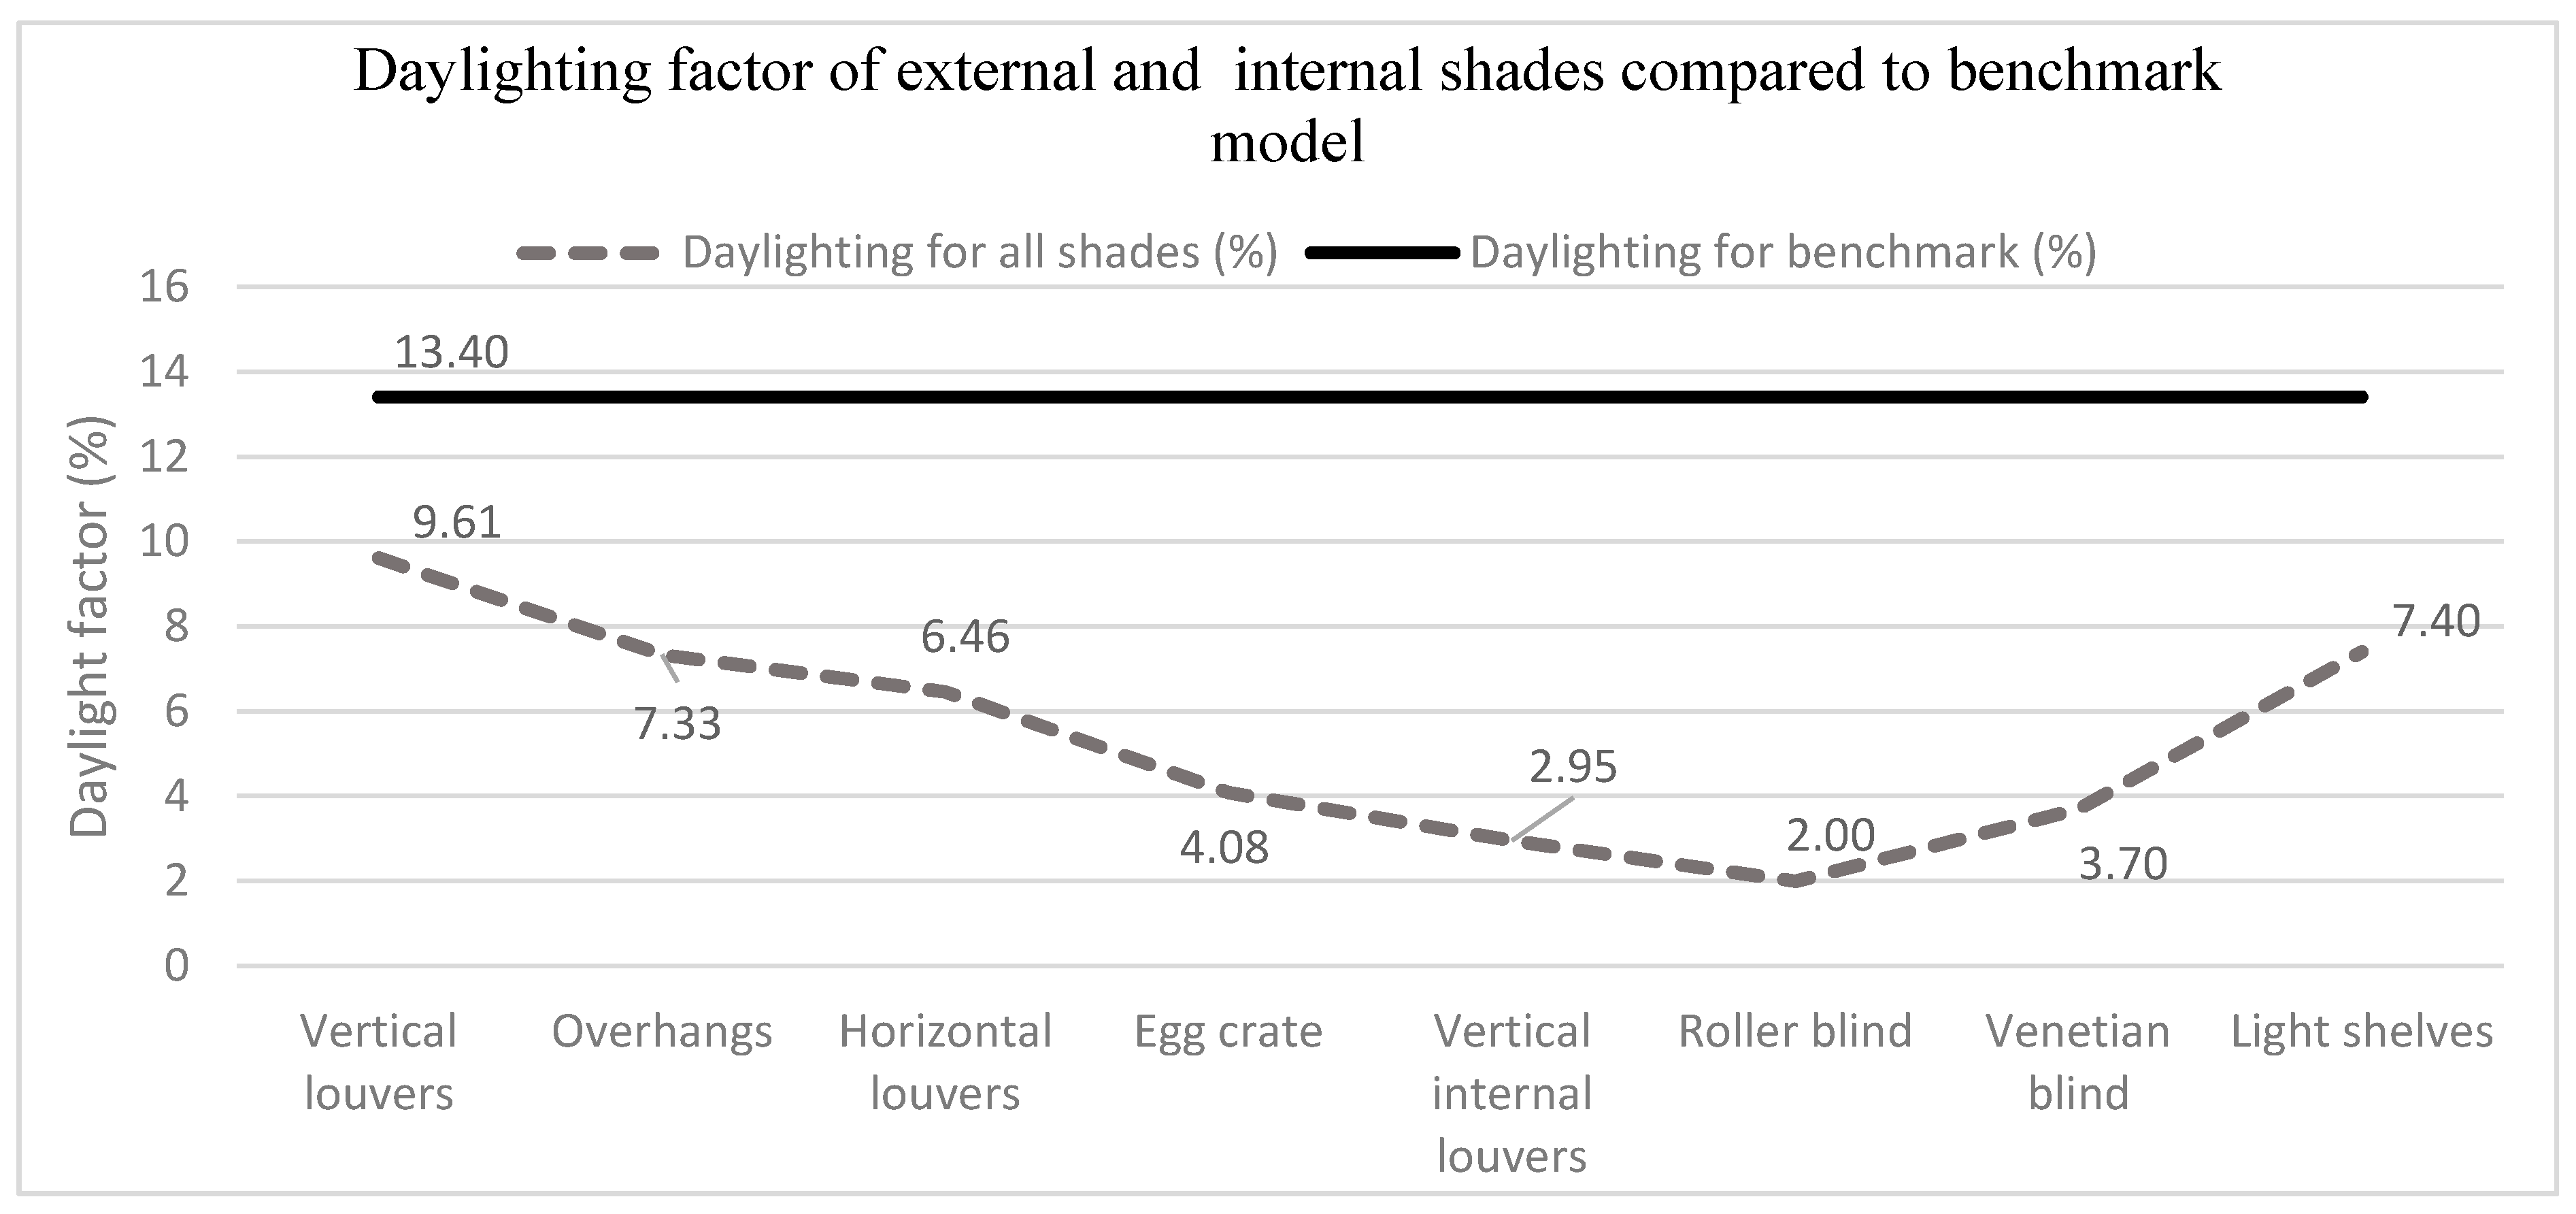
Figure 7 shows the comparison between the benchmark model and all the external and internal shades in terms of daylight factor. The vertical louver shows the lowest reduction in daylight factor as it dropped to 9.61% only, whereas the egg crate has the maximum reduction between external shades as it decreased to 4.08%. The roller blind has the lowest daylight factor of 2%, blocking most of the sun light requiring artificial lighting for suitable illuminance level and visual comfort. However, since the sun falls directly on the building’s façade in the UAE, the building occupants will tend to keep the blind almost fully closed to avoid glare. Hence, the blind was simulated half opened, otherwise the daylighting factor and illuminance levels will be higher.
Table 13 below shows the daylight factors of each zone for all shading modelled on IES-VE FlucsDL daylighting assessment tool. The benchmark model has the highest daylight factor and illuminance levels of maximum 42% and 3254.29 lux. The corner zones showed the highest percentage due to glazing constructed on both wall sides, while the other zones range between 6% to 24%, Table 13. This was followed by vertical louvers and overhang shades with 9.61% and 7.33% average daylight factor and illuminance levels of 720.62 lux and 895.85 lux, Table 11. Whereas the majority of the zone’s daylight factor lay between 3% to 16% for both models, the minimum illuminance level increased to 8.28 lux when overhang shades were applied compared to 5.47 lux for the benchmark model, Table 11. The horizontal louver has a maximum daylight factor and illuminance level of 16.4% and 1245.5 lux which could be in the corner zones where the sunlight penetrates from both window sides, while the average lighting levels are 6.46% and 483 lux. The maximum daylight factor of 10.5% was demonstrated by egg crate shading with the lowest percentage between all external shades, however the minimum daylight factor increased by 1200% compared to benchmark reaching 1.3%, Table 12.
The internal shades showed lower daylight factors when compared to external shades except for egg crate shading. As vertical internal louvers, roller blind and light shelves show highest maximum daylight factors of 13.8%, 12.1% and 29% respectively, Table 11. However, the average daylight factor for vertical internal louvers, roller and venetian blinds were lower than the egg crate by 1.13%, 2.08% and 0.38%. This indicates that the internal shadings influence the average daylight factor more as the light falls directly on the building façade. Unlike the egg crate were the sunlight hit the shading first reducing daylight factor near the windows. Moreover, the vertical internal louvers illustrated an average reduction of 78% and 84% for daylight factor and illuminance level compared to the benchmark, though the minimum lighting values increased by 100% and 364%, respectively. The lowest value for maximum daylight factor is demonstrated by venetian blinds with a maximum daylight factor of 9.6%, although the minimum value increased by 1700% to reach 1.8% compared to 0.1% for the benchmark model, Table 12. The lowest average daylight factor was illustrated by the implementation of roller blinds of 2% and illuminance levels on 247.5 lux. Alternatively, light shelve has the highest average daylight factor of 7.4% between the internal shadings, due to the reflection of the sunlight indoors as it hits the surface of the shading.
The daylight factor of vertical internal louvers, roller, and venetian blinds varies as the percentage of blind opening changes, for instance, roller blind that is fully open will have higher daylight factor. While in all models the daylight factor drops when moving away from the window, which shows that the sunlight does not penetrate to the end side of all the zones, the external shadings have higher daylight factors as compared to the internal shades as discussed by Othman and Khalid [11]. Since the internal shadings has influences daylighting more by blocking the light entering through the windows. While the external shades had a higher impact on the energy consumptions and cooling loads as it blocks the solar gains before entering the space.
4.2. CFD Results
Velocity Profiles
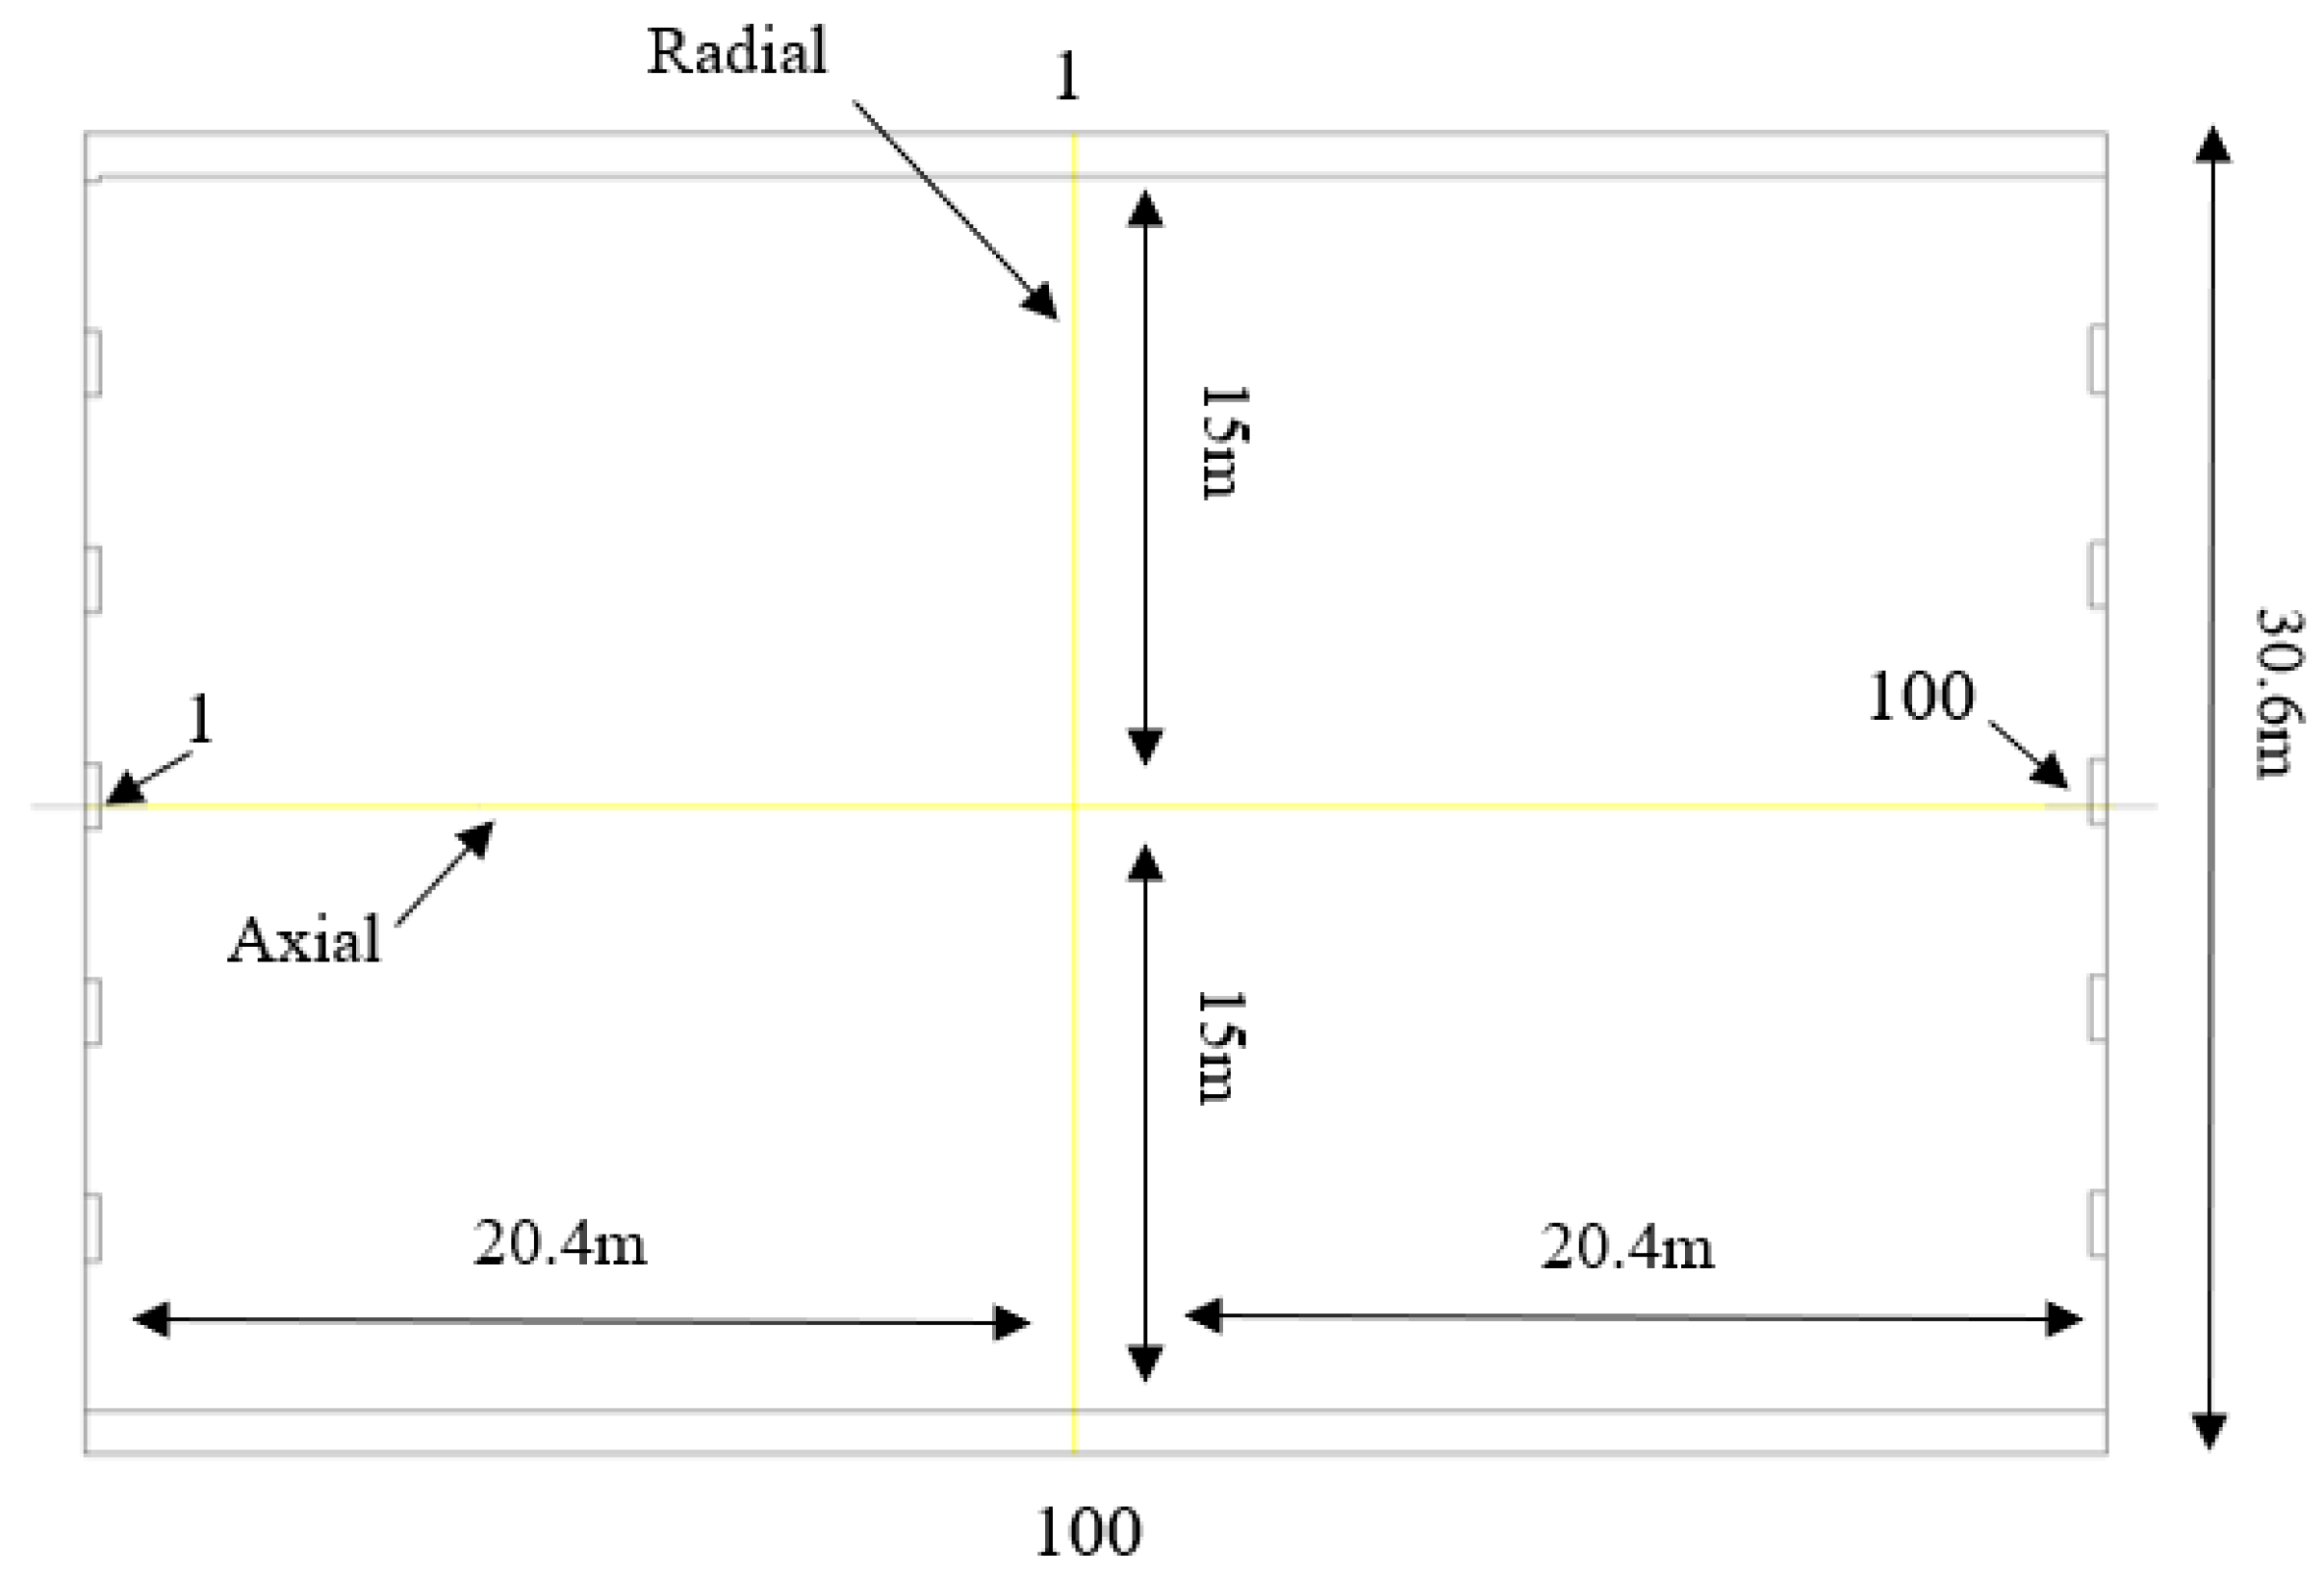
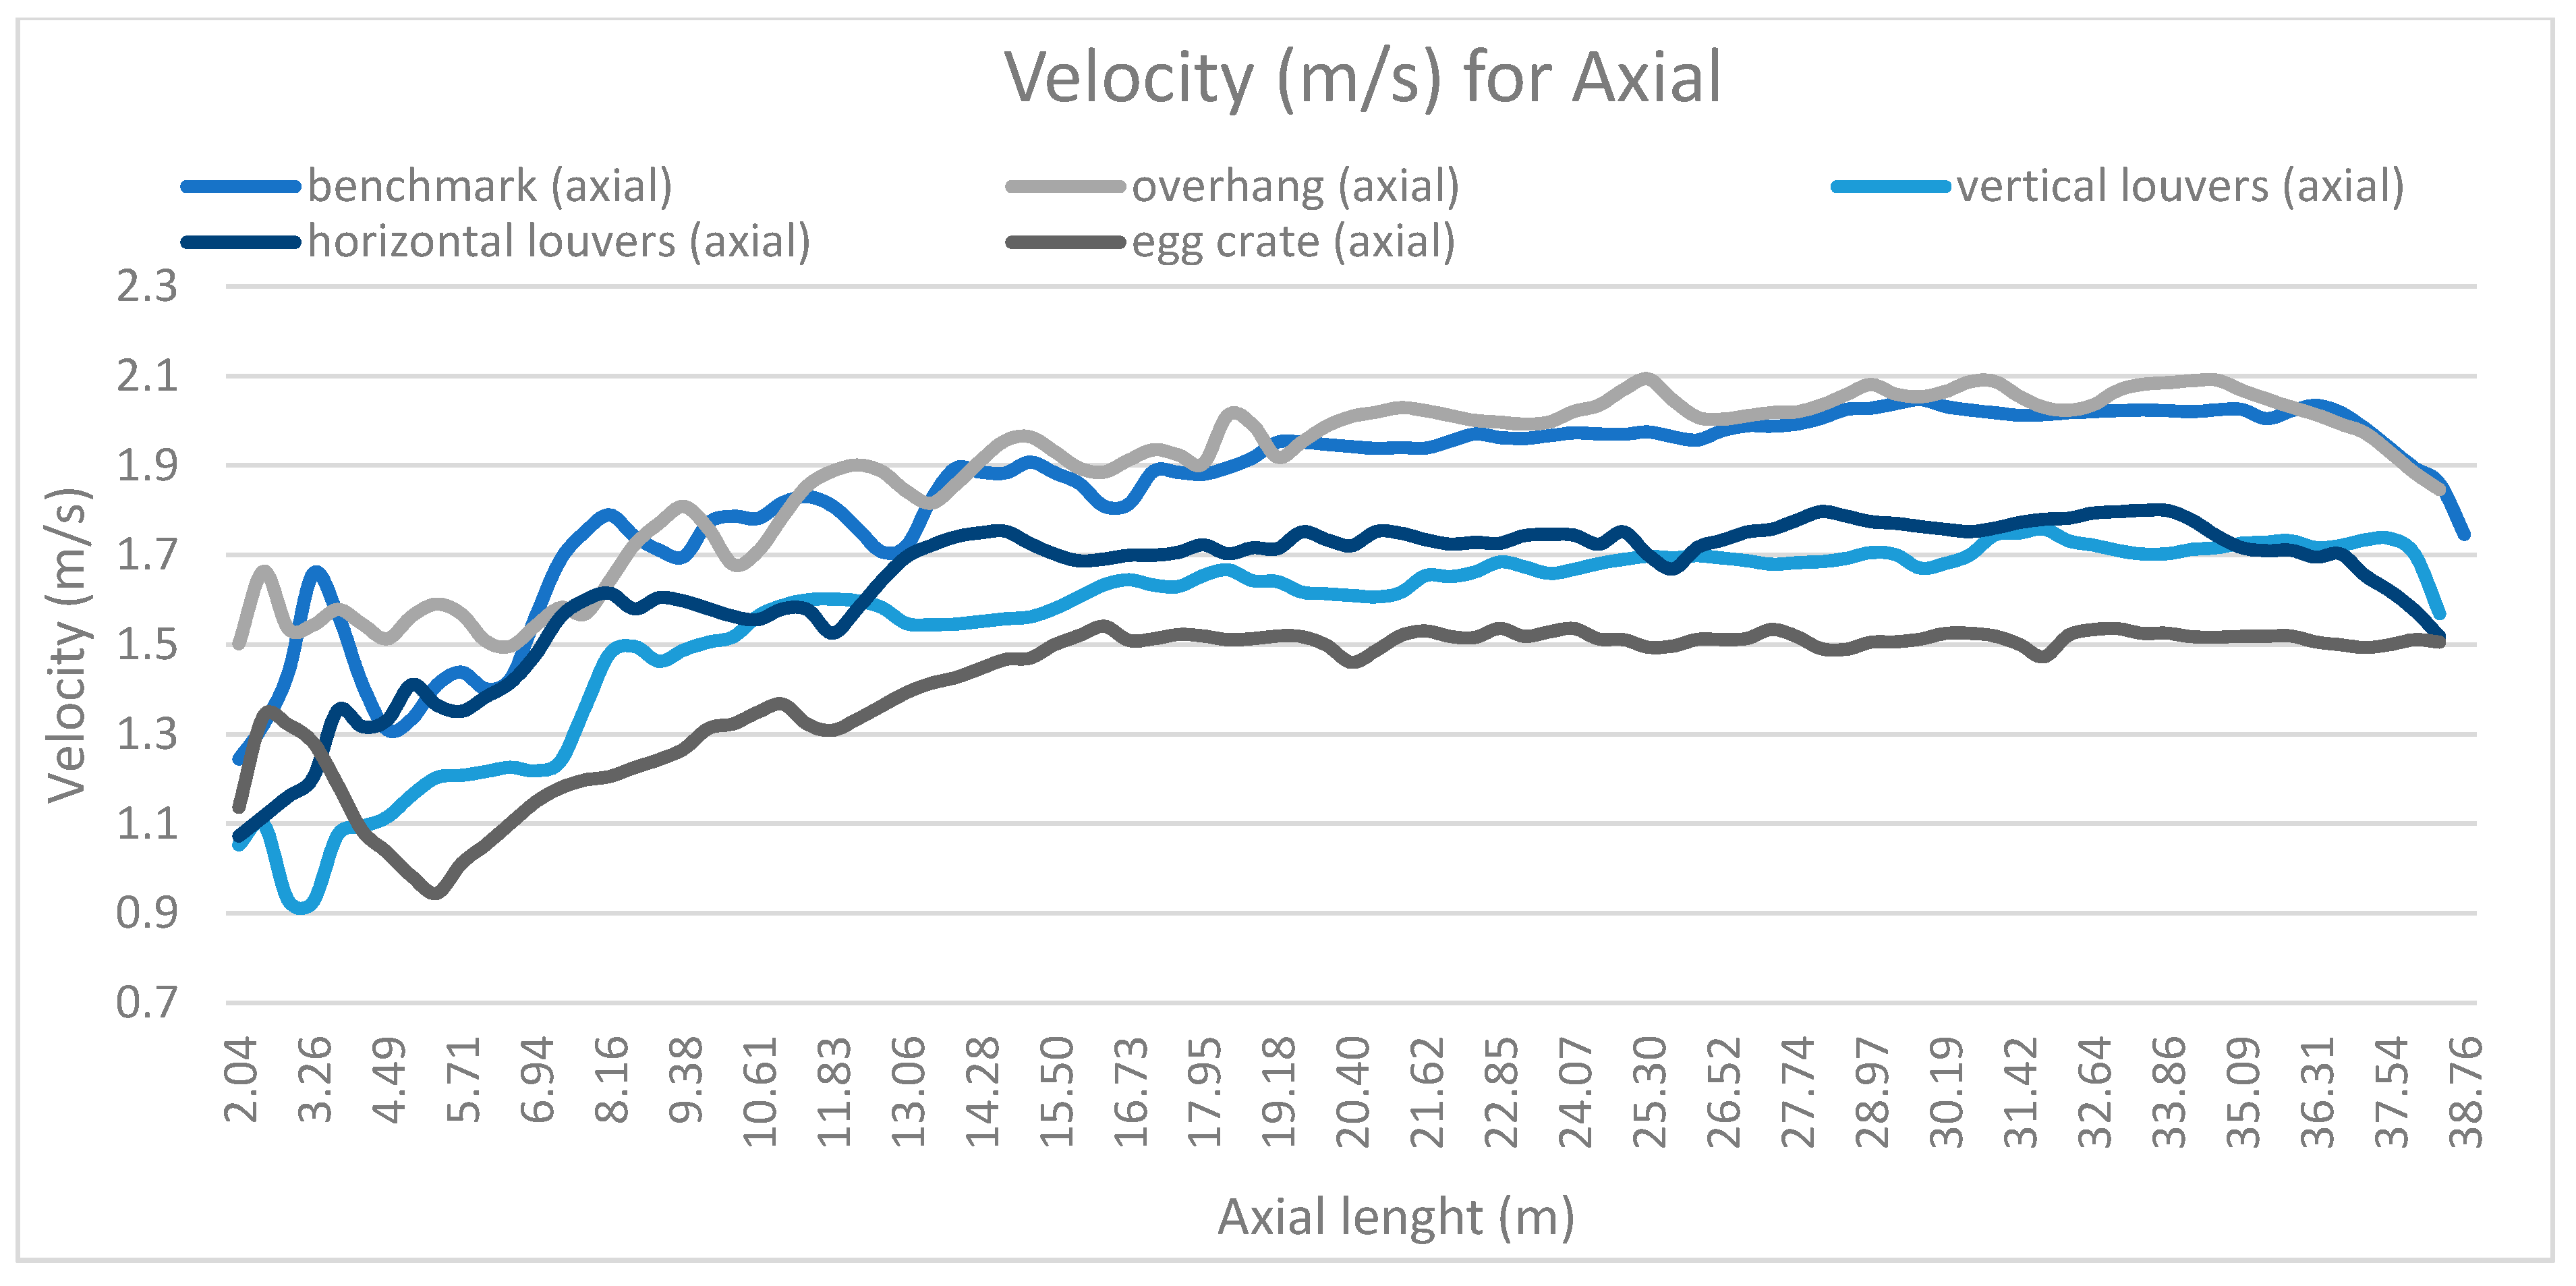
Figure 8 illustrates the Axial and radial directions that was created across each model to get the velocity profiles with horizontal distance of 0.408 m and vertical distance of 0.306 m between each point. Figure 9 shows the direction for the profiles in meters avoiding the points that are intersecting with the walls. An inlet velocity of 3.5 m/s was assigned to each model according to Ouarda et al. [23]. While, Table 14 below demonstrates the velocities through axial and radial directions. The overhang shading shows the highest minimum and average velocity through axial direction when compared to all models with 1.16 m/s and 1.89 m/s respectively. It increases towards the centre of the model as shown in Figure 9 with 57% difference between minimum and maximum values. While the benchmark model has the maximum velocity among all shades, the air velocity is at its maximum near the inlet windows with 2.85 m/s, then declines as the air reaches towards the centre, Figure 9. Moreover, the benchmark model has a higher percentage difference between minimum and maximum velocities of 62% through axial direction, Table 14.
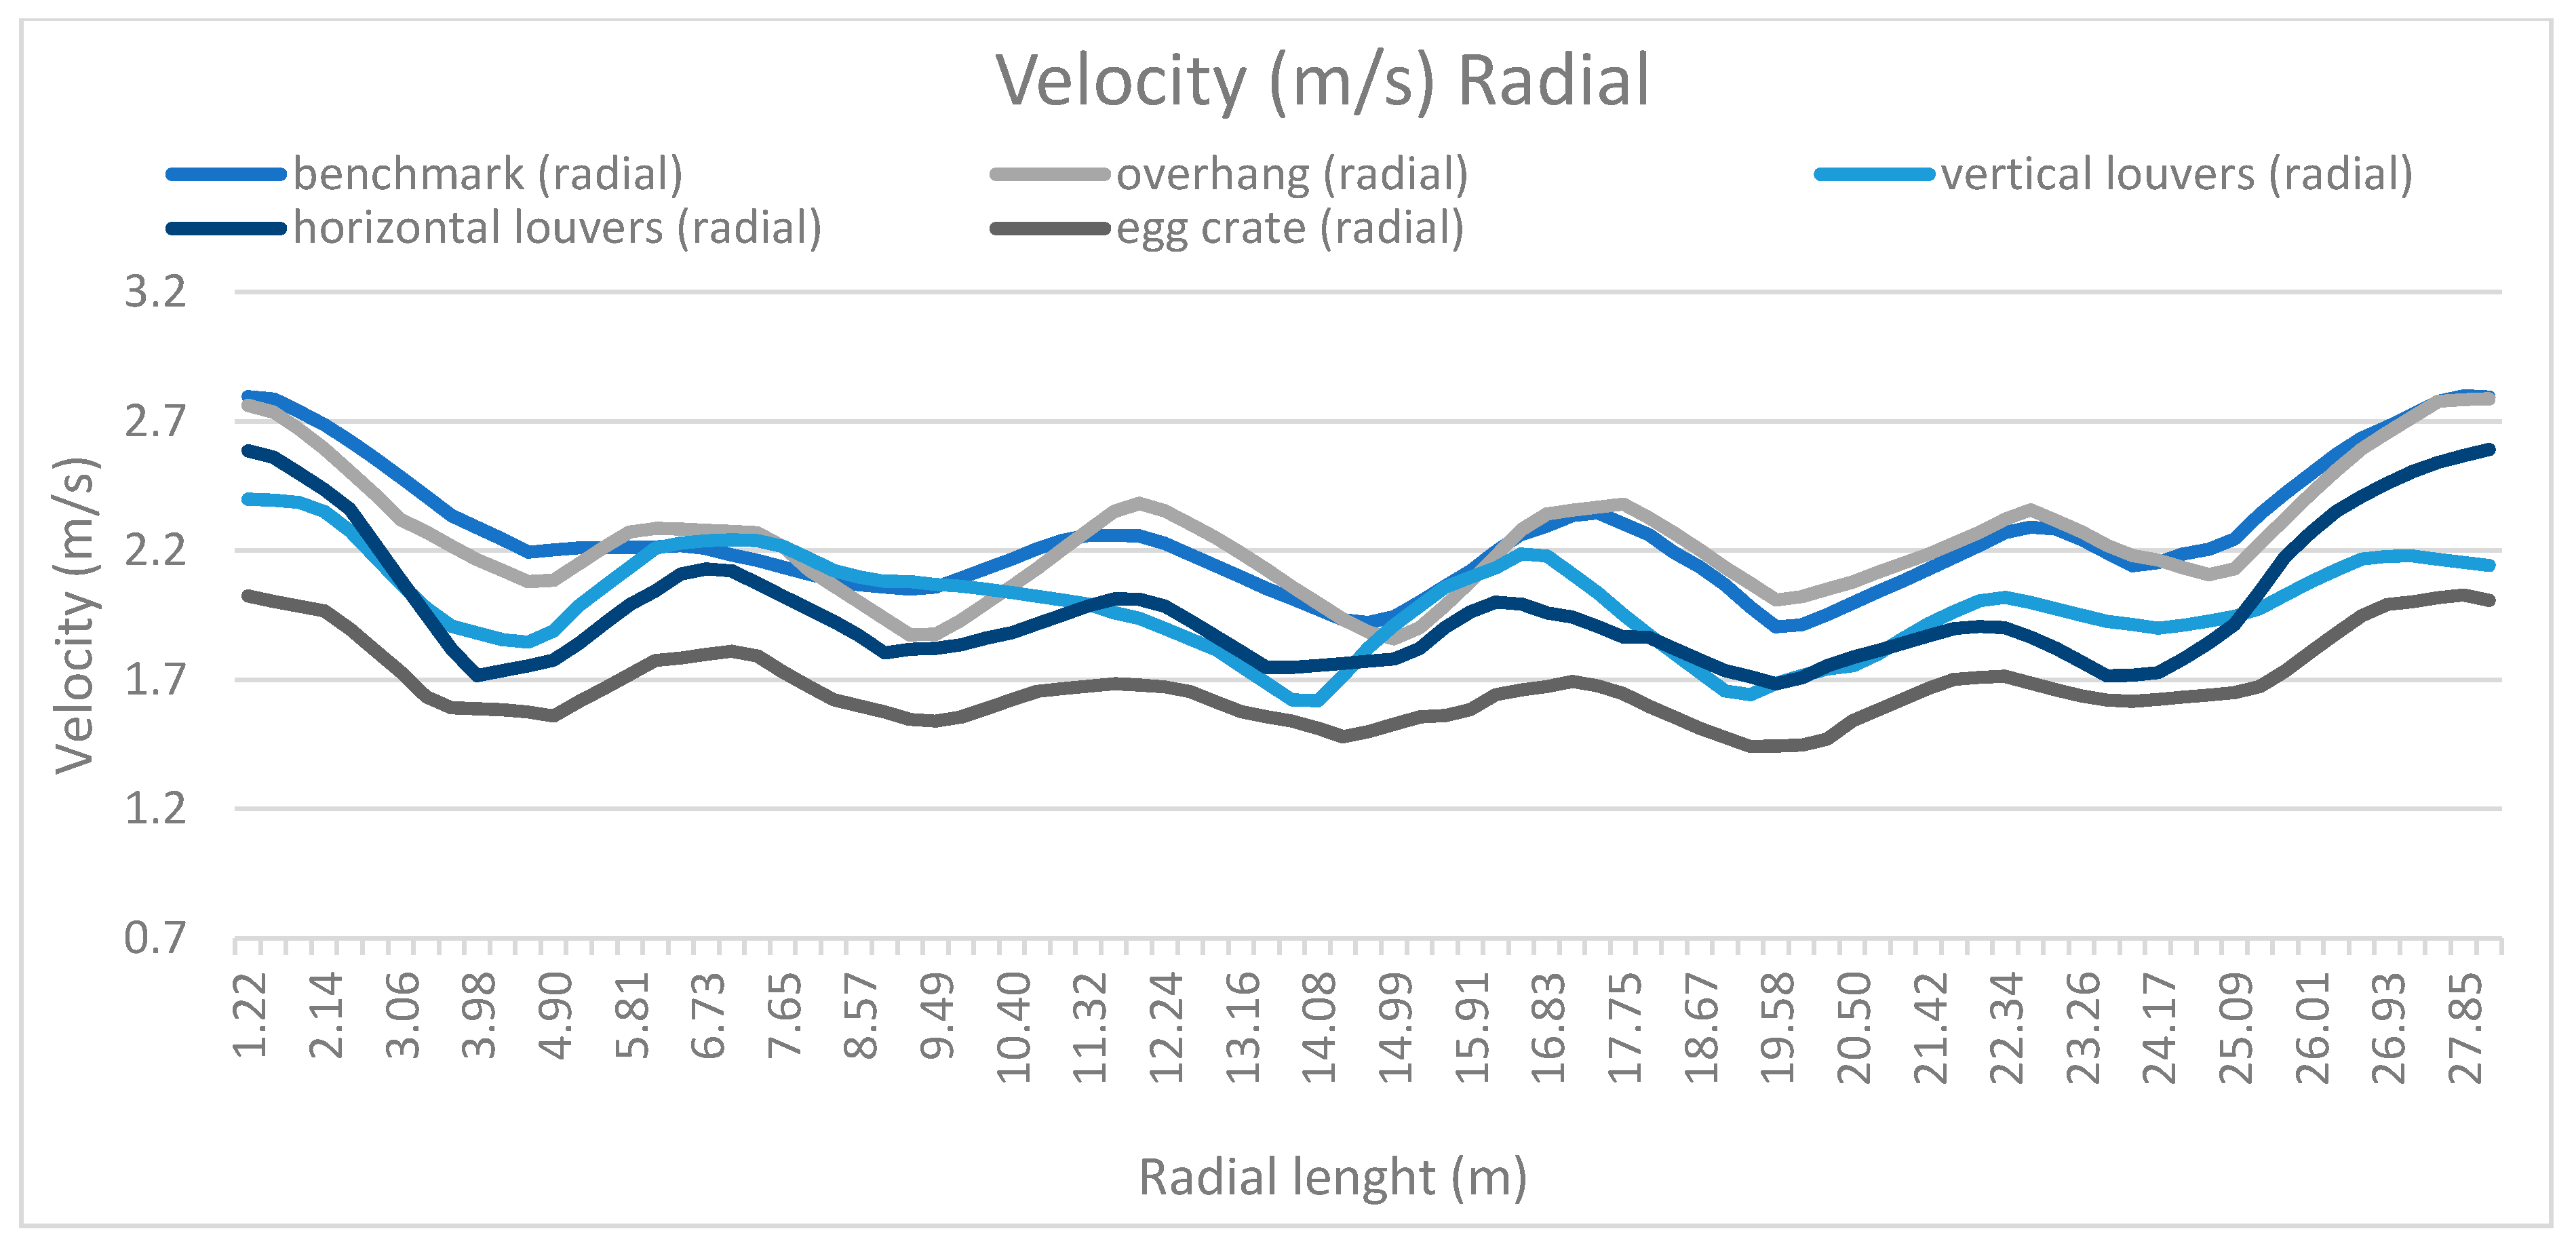
Similarly, through the radial profile (Figure 10), the benchmark model has the highest minimum and average velocities of 1.9 m/s and 2.27 m/s respectively, while the overhang shade shows the highest maximum values of 2.82 m/s. In contrast, the egg crate shading has the lowest velocity through axial and radial directions, with average velocity of 1.42 m/s along the axial direction and 1.7 m/s along the radial direction, and a 90% reduction between minimum and maximum values, Table 14. However, the egg crate shade has the lowest reduction among all shades along the radial direction of 29%. On the other hand, the vertical and horizontal louvers lay between the minimum and maximum values with reduction of 79% and 38% for vertical louvers and 58% and 36% for horizontal louvers along axial and radial directions.
Alternatively, Table 15 demonstrates the reduction by percentage when compared to the inlet velocity of 3.5 m/s along the axial and radial directions for minimum, average and maximum velocities. The egg crate shows the maximum reductions along both axial and radial directions with 59% and 51% reductions, respectively. The benchmark and overhang shades showed the lowest reduction compared to all models ranging between 19% to 69% along the axial direction and from 20% to 47% along the radial direction between the minimum, average and maximum values. Table 15 indicates that the egg crate shading has the maximum percentage reduction, hence it has a higher influence on the wind coming indoors through the windows.
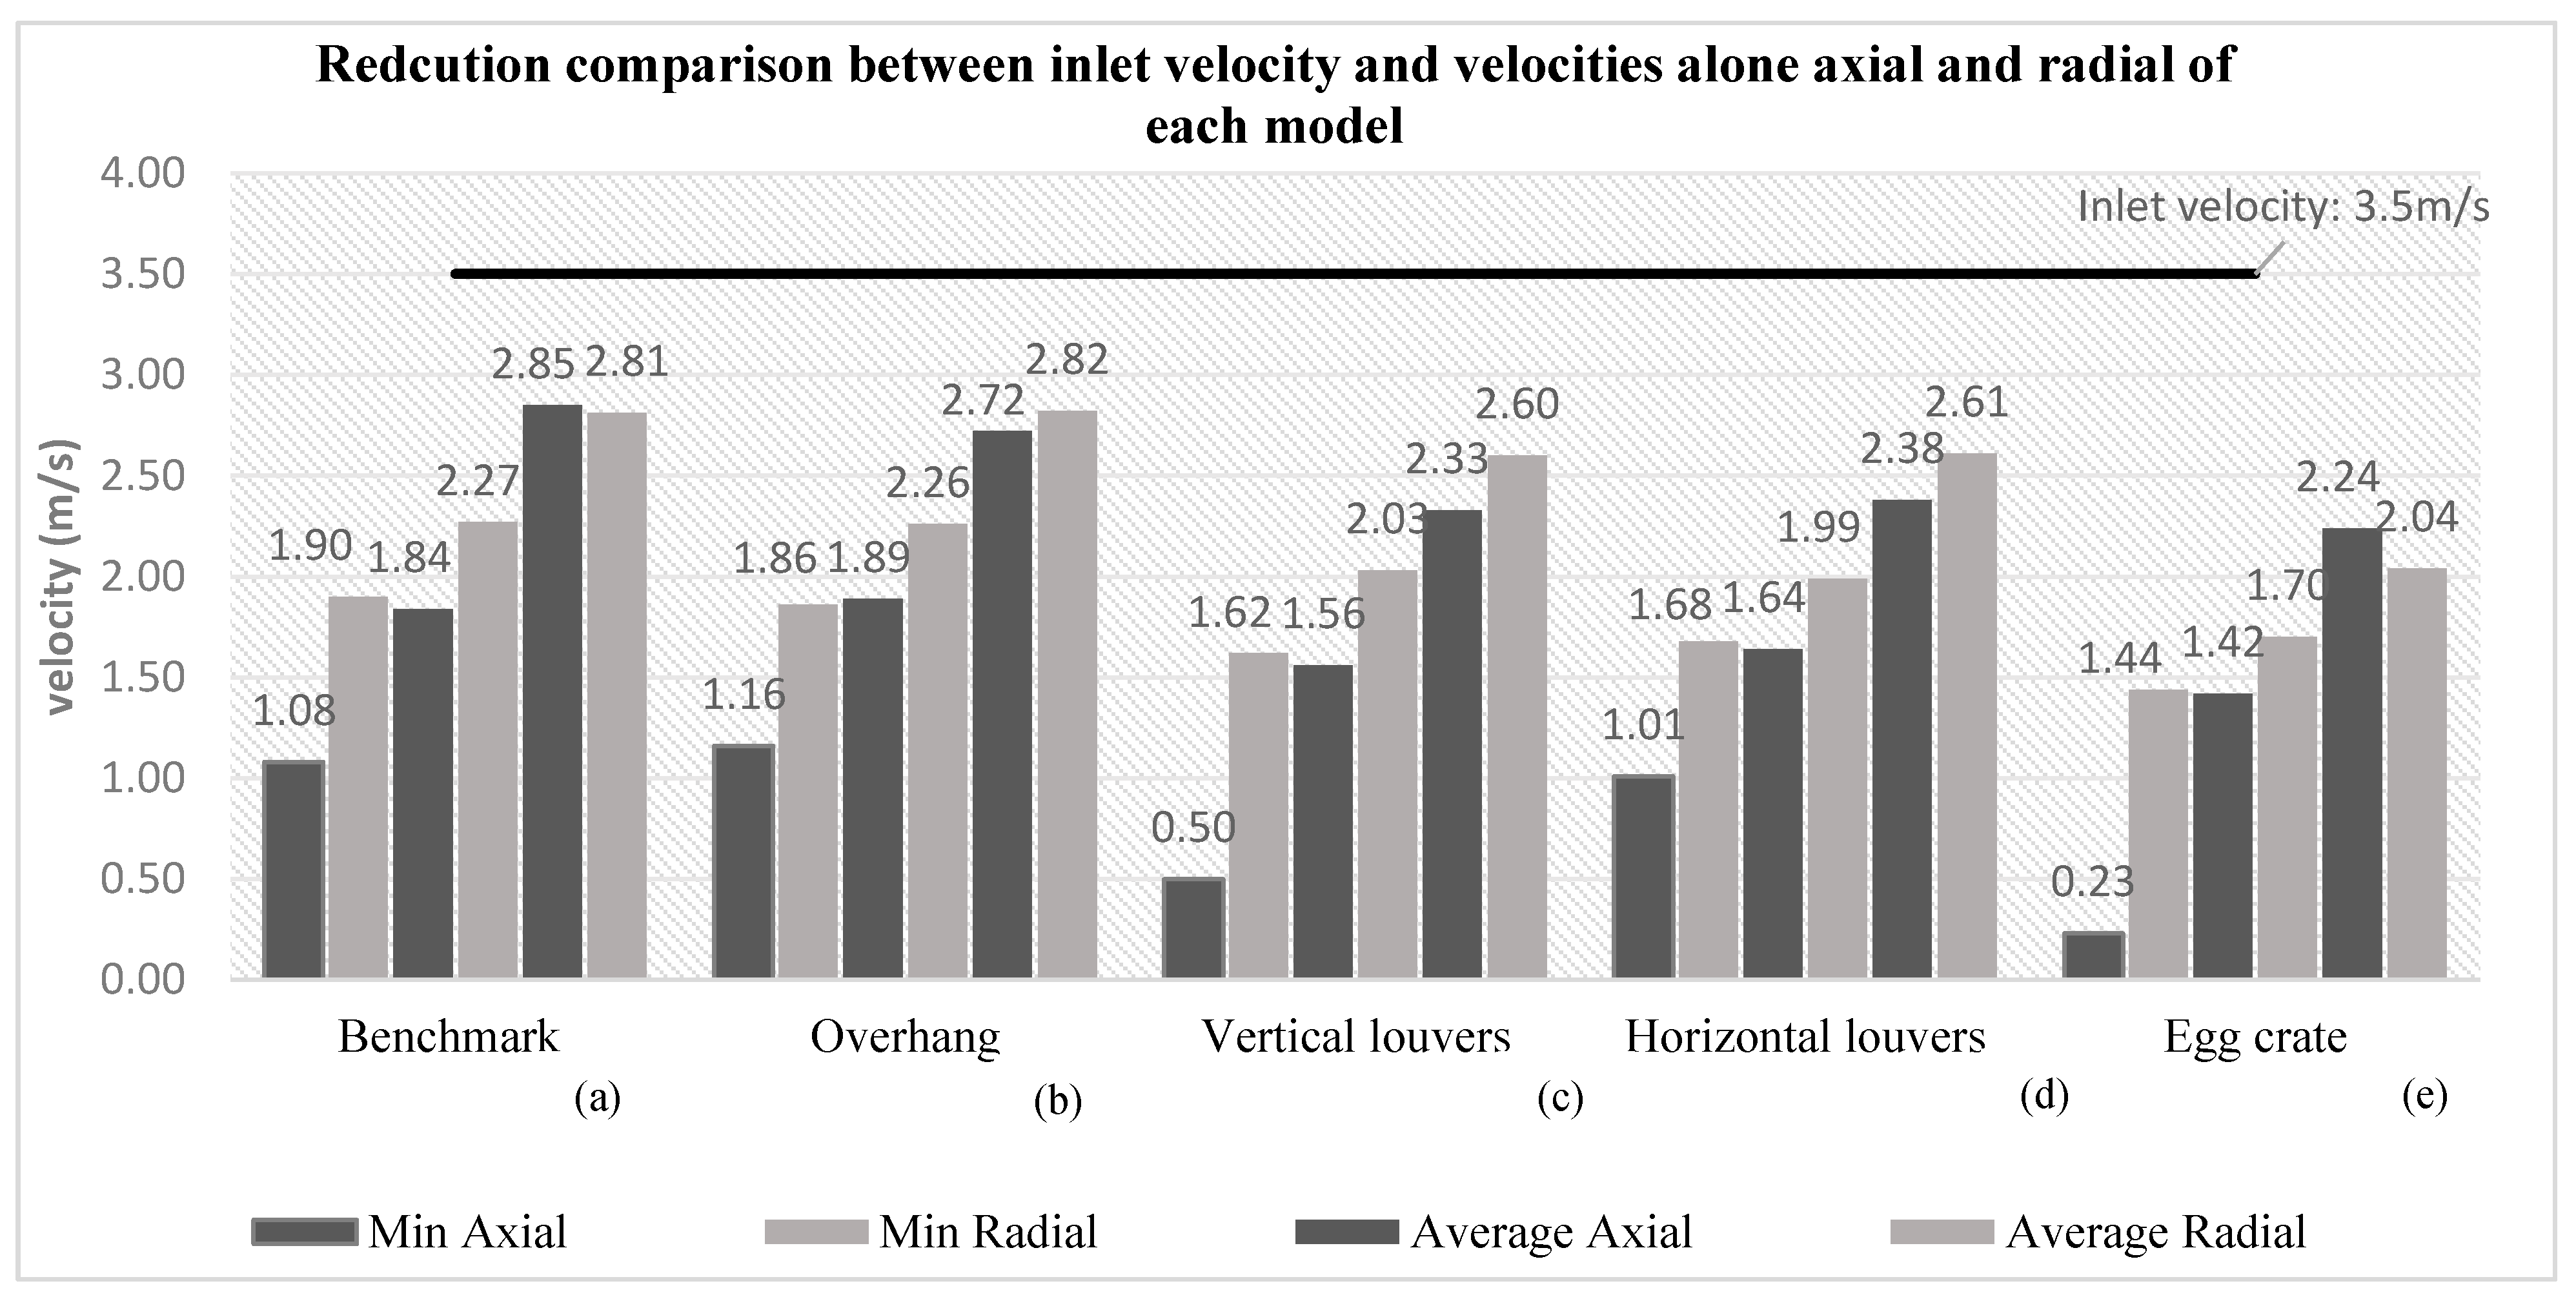
Figure 11 illustrates the reduction of velocities along axial and radial directions when compared to the inlet velocity of 3.5 m/s. This shows that the benchmark model (a) has an average of 1.84 m/s for axial directions with difference of 0.76 m/s and 1.01 m/s between minimum to average and average to maximum velocity. Hence model (a) has no shading so the wind flow is only influenced by the windows and walls. Whereas, overhang model (b) shows a higher average than (a) through the axial direction of 1.89 m/s with 0.73 m/s and 0.83 m/s difference between minimum and average, and average and maximum speeds. This demonstrates that the implementation of the overhang shade increases the flow of air into the space. While the vertical louvers model (c) shows a minimum axial speed of 0.5 m/s which is very low compared to the average speed 1.56 m/s with difference of 1.06 m/s, this shows that air distribution for the model (c) is poor compared to model (a) and (b).
Despite a higher minimum axial speed of 1.01 m/s for horizontal louvers model (d), the overall average speed of 1.64 m/s is low when compared to vertical louvers where the average speed is 1.56 m/s although the minimum axial speed is 0.5 m/s. This illustrates that vertical louvers (c) has more effect on the flow of wind than model (d) as its applied horizontally along the wind flow unlike model (c). On the other hand, regardless of very low minimum axial velocity of 0.23 m/s, the egg crate model (e) shows a higher average velocity of 1.42 m/s. This shows the largest difference between minimum and average velocity of 1.19 m/s and the lowest difference of 0.54 m/s between average and maximum speeds when compared to all models, this makes the air distribution non-proportional. This demonstrates that some parts within the model are receiving low or high wind speed, hence the large variance between minimum, average and low difference between average and maximum speed.
Alternatively, the radial directions for all models are more proportionate for minimum, average, and maximum values. The difference between minimum and average velocities ranged from 0.26 m/s for model (e) to 0.41 m/s for model (d) as the highest difference. Additionally, the difference between average and maximum velocities are 0.54 m/s, 0.56 m/s, 0.57 m/s, 0.62 m/s, and 0.34 m/s for models (a) to (e) respectively. On the other hand, when compared to axial and radial velocities, radial shows higher speeds through all models from minimum to maximum except for maximum benchmark model and egg crate velocities. Hence radial direction has the most influence on the overall average velocities of each model.
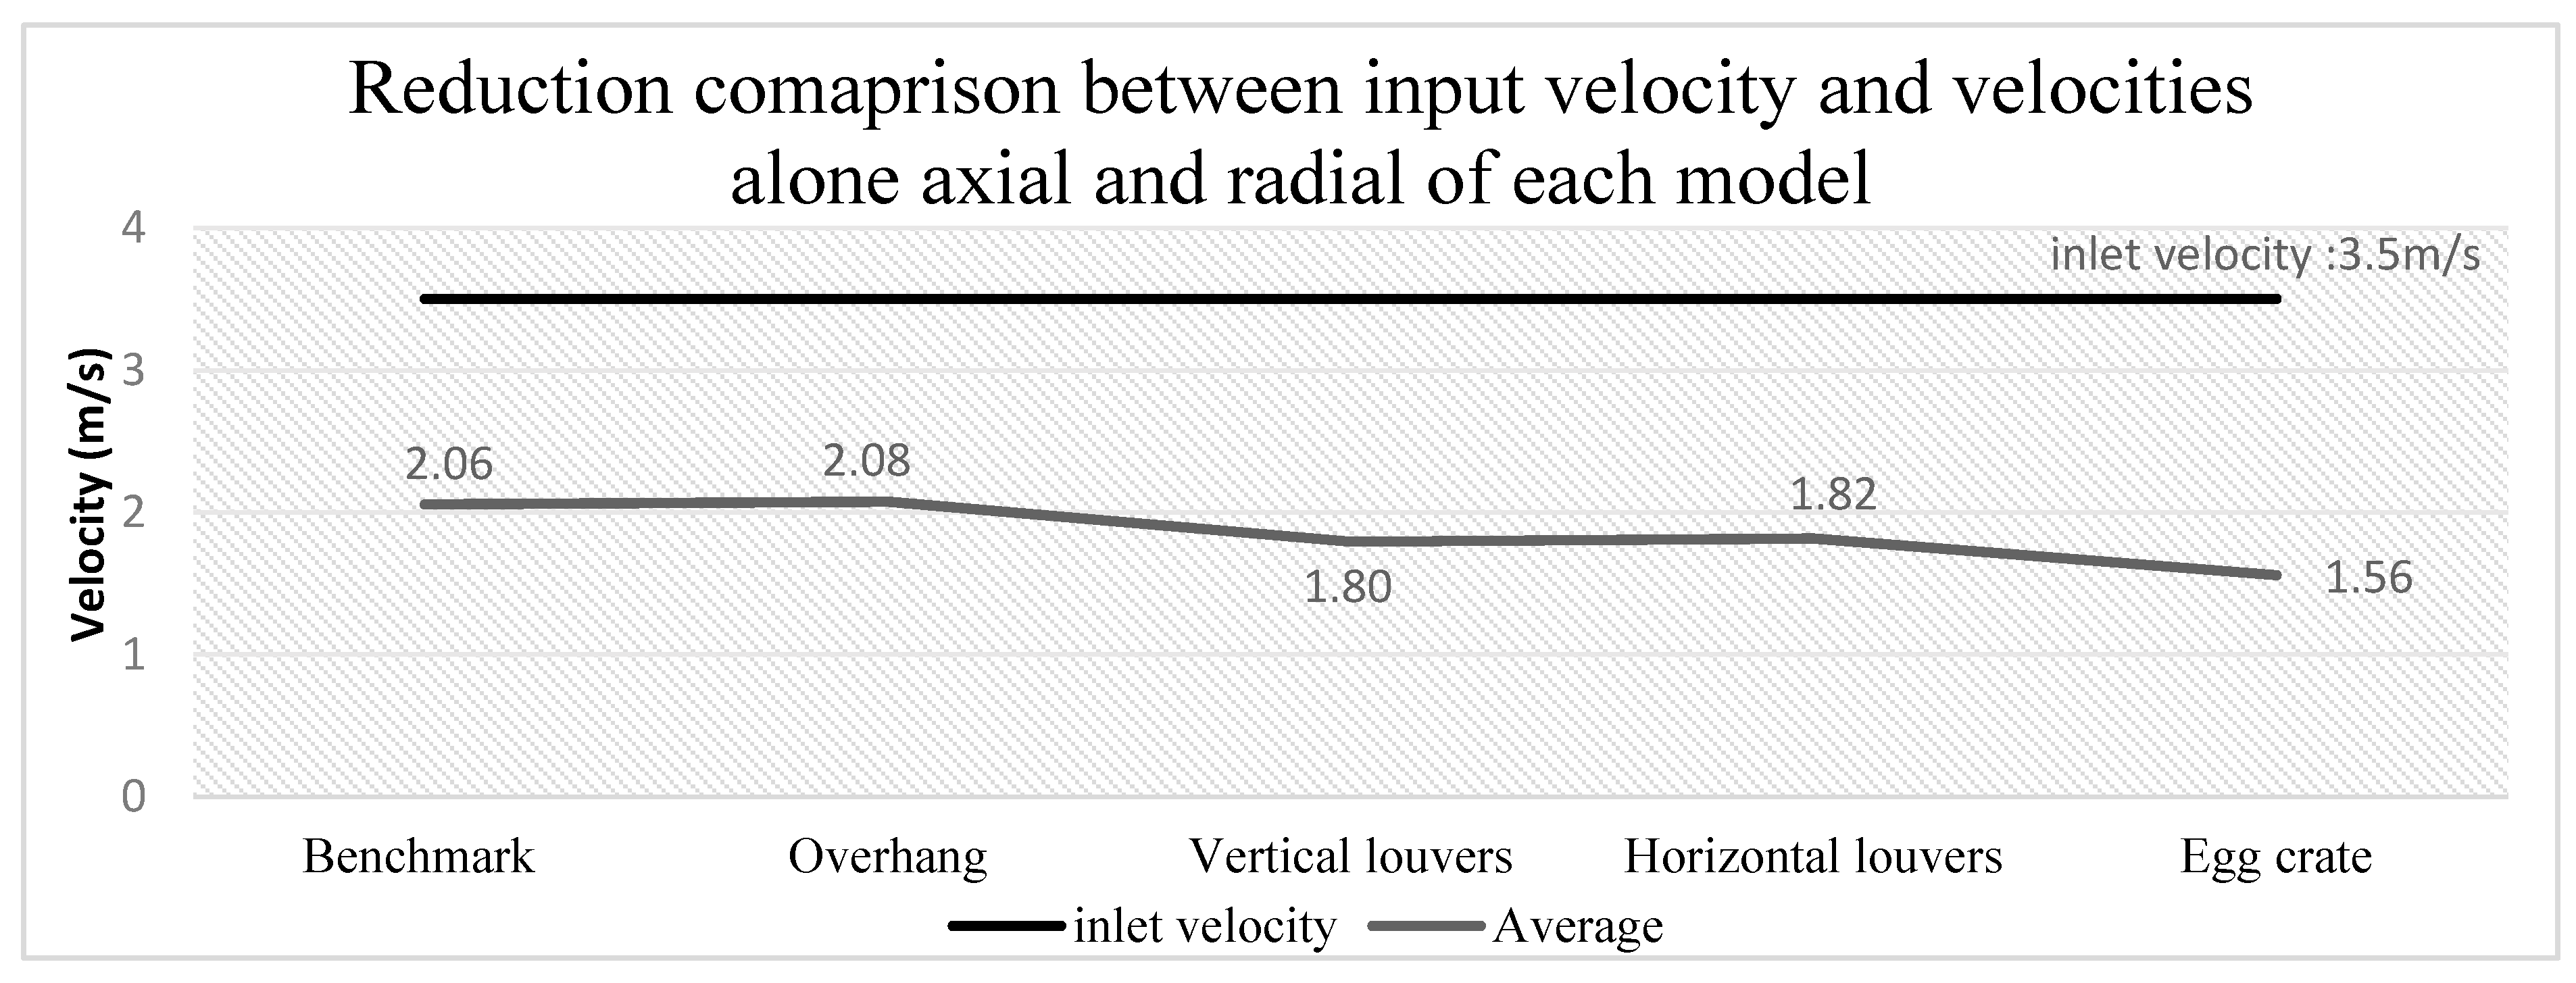
Table 16 shows the average velocities of axial and radial of each model and Figure 12 illustrates the difference between the inlet velocity and the average velocity. The overhang shade has the highest average velocity of 2.08 m/s with variance of 1.42 m/s from inlet velocity. By contrast, vertical and horizontal louvers have an average of 1.80 m/s and 1.82 m/s respectively, with 1.7 m/s and 1.68 m/s reduction in velocity from 3.5 m/s. On the other hand, egg crate shade shows the lowest average velocity of 1.56 m/s (Figure 12) with difference of 55.4% compared to inlet velocity, Table 16.
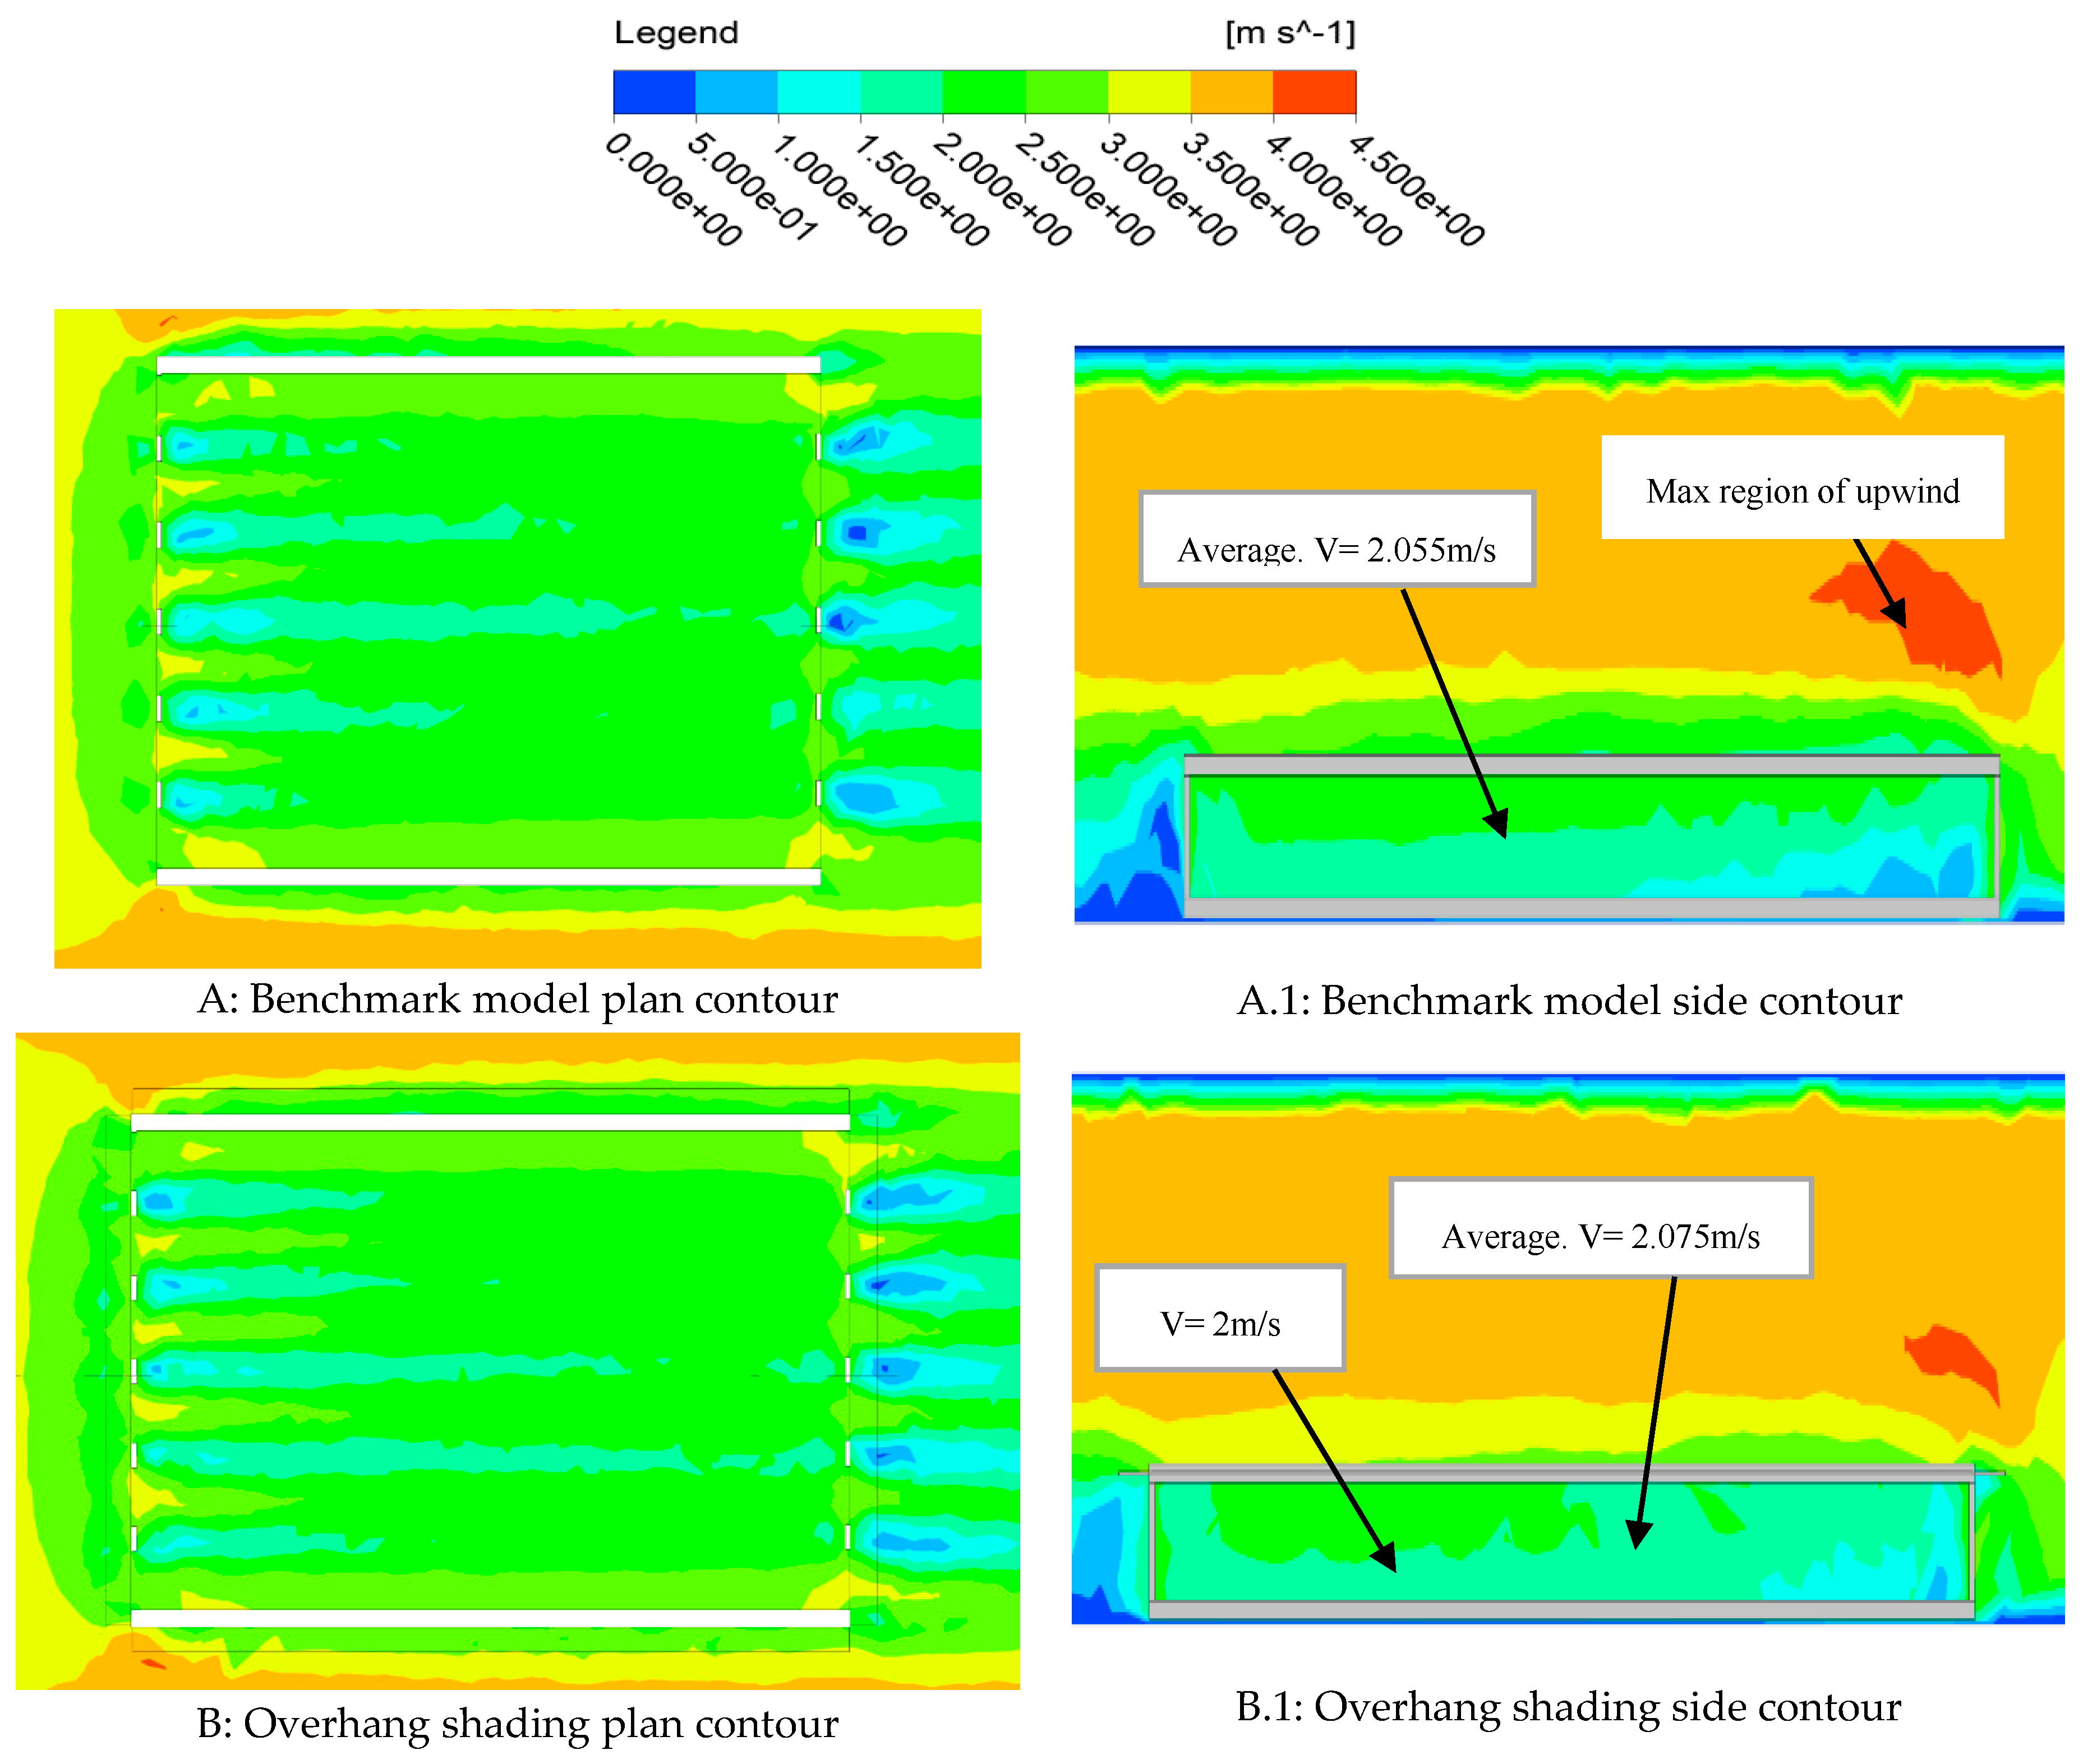
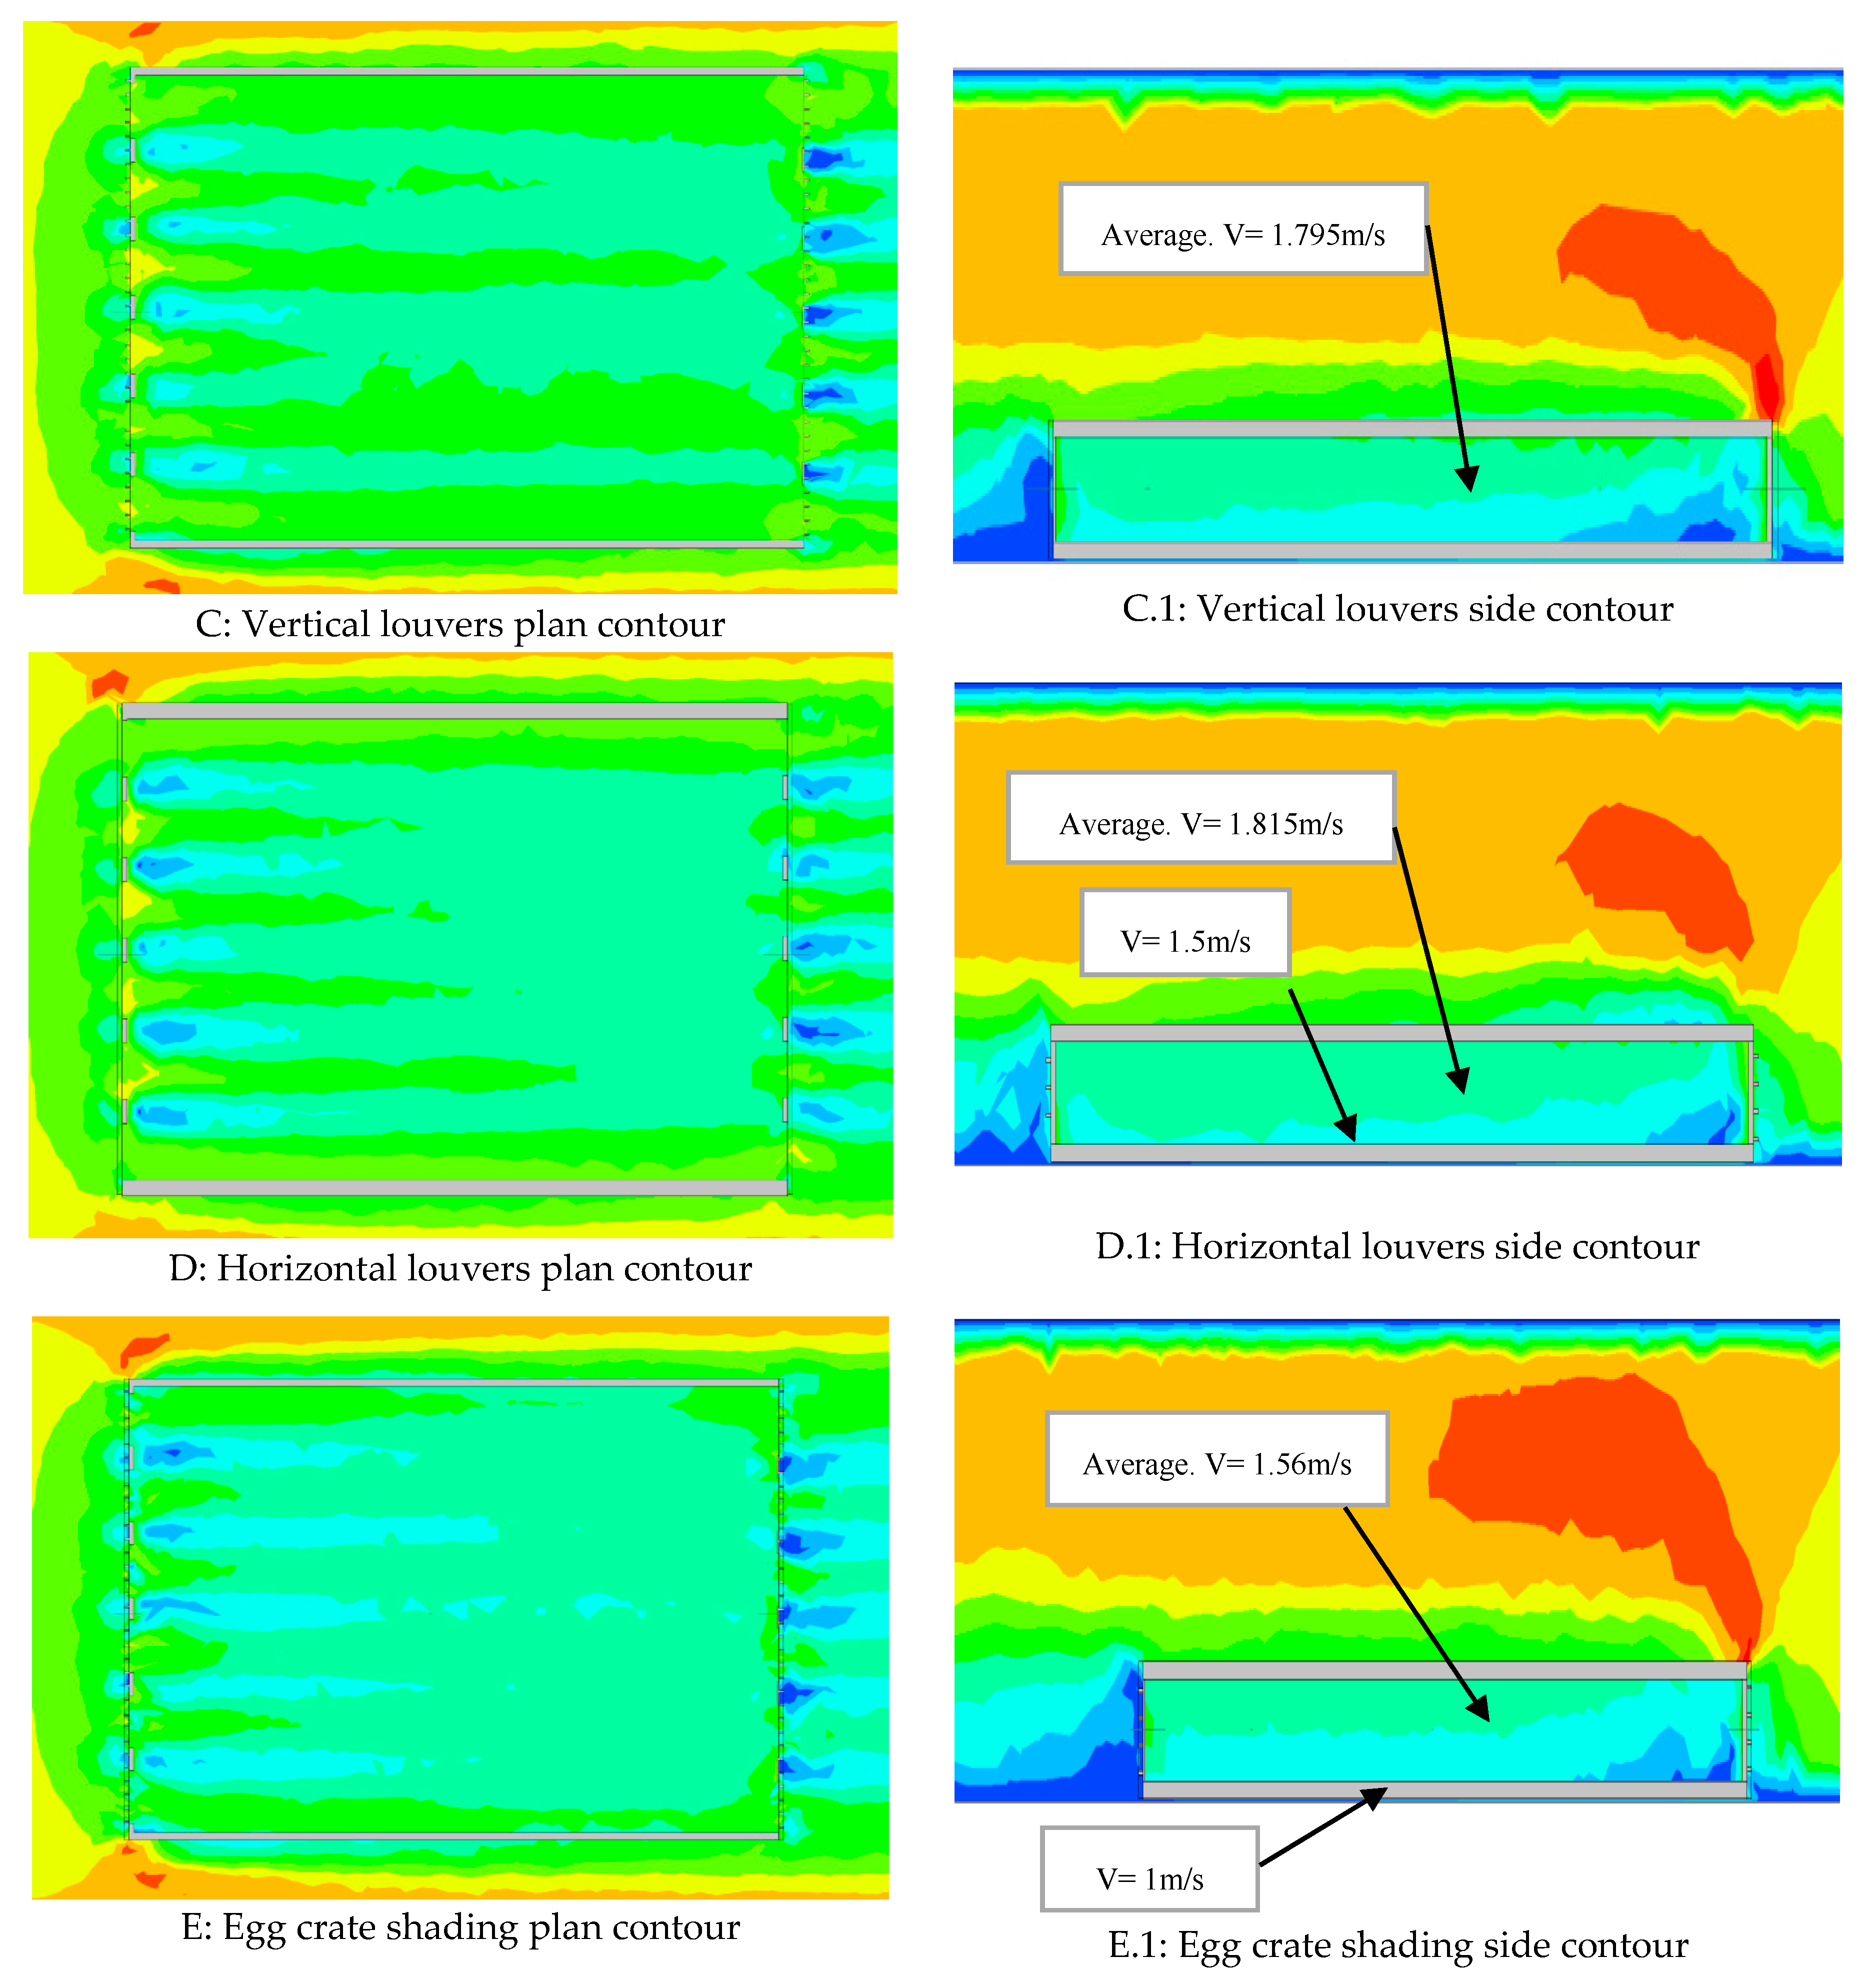
Figure 13 illustrates the plan and side contour of each model simulated using CFD numerical method to compare the air velocity flow for each model. Figure 13 shows the legend which was kept constant for all models to ensure equal comparison. Figure 13A shows the benchmark model contour where the wind speed near the windows ranges between 3 to 3.5 m/s. While the speed reduces to 1 m/s when it hits the walls and has an average of 2.055 m/s within the floor. Whereas Figure 13B illustrates the model after implementing overhang shading which resulted in increasing the average air velocity to 2.075 m/s (Figure 13B.1), this demonstrates that the overhang increases the influence of air into the model. Furthermore, Figure 13C demonstrates that the air speed drops, as the average velocity decreases to 1.795 m/s compared to benchmark and overhang model. This indicates that the more shade implemented on the model, the lower the average wind velocity will get within the floor. Figure 13D shows the horizontal louvers with much lower speed throughout the floor ranging from 1 m/s to 2.3 m/s and it has an average of 1.815 m/s which is higher than vertical louvers, hence the horizontal shade has less influence on the air flow in comparison to vertical shades. Moreover, the egg crate shading has the lowest velocity in evaluation to all models with speed of 1 m/s within most of the floor area and average speed of 1.56 m/s (Figure 13E).
Alternatively, Figure 13A.1–E.1 shows the vertical profiles of all the models, where the wind speed increases as the height increase within the floor level to the ceiling for all the models illustrated in Figure 13. However, the speed reduces as more shade is applied, and consequently, shows a lower wind velocity within the floor for the vertical and horizontal louvers (Figure 13C.1,D.1) and further declines to 1 m/s close to the floor level when egg crate shadings are applied (Figure 13E.1). For the external wind, a region of maximum wind velocity is created at the inlet upwind when more shades are implemented. This indicates that when the speed of 4.5 m/s at the upwind is longer, such as with the egg crate shade (Figure 13E.1) is results in the average wind velocity reducing within the floor as most of the wind flow is going upwards. In the case of the overhang shade (Figure 13B.1) the upwind flow is less. This specifies that most of the wind flow is going into the floor, hence the higher average velocity. Therefore, the period of maximum flow reduces within the floors as the period of maximum velocity increases at the upwind near the windows inlet.
5. Analysis of Results
The results demonstrate that all the external and internal shading does influence the energy and cooling loads when compared to base model with no shadings. The horizontal louvers and overhang shades showed a reduction in energy by 6.3% and 6%, and in cooling by 13.4% and 12.6%, respectively. Vertical louvers show the least savings among external shades, reducing the consumptions by 5.5% and 11.7%. Thus, it can be known that the vertical shade can be effective during the lower sun angle time but does not affect the solar gains and radiation falling directly on the façade in an extreme climate like in the UAE. However, it was noted that if the vertical shades were titled to an angle it may have resulted in higher savings as a larger area of the glazing will be covered.
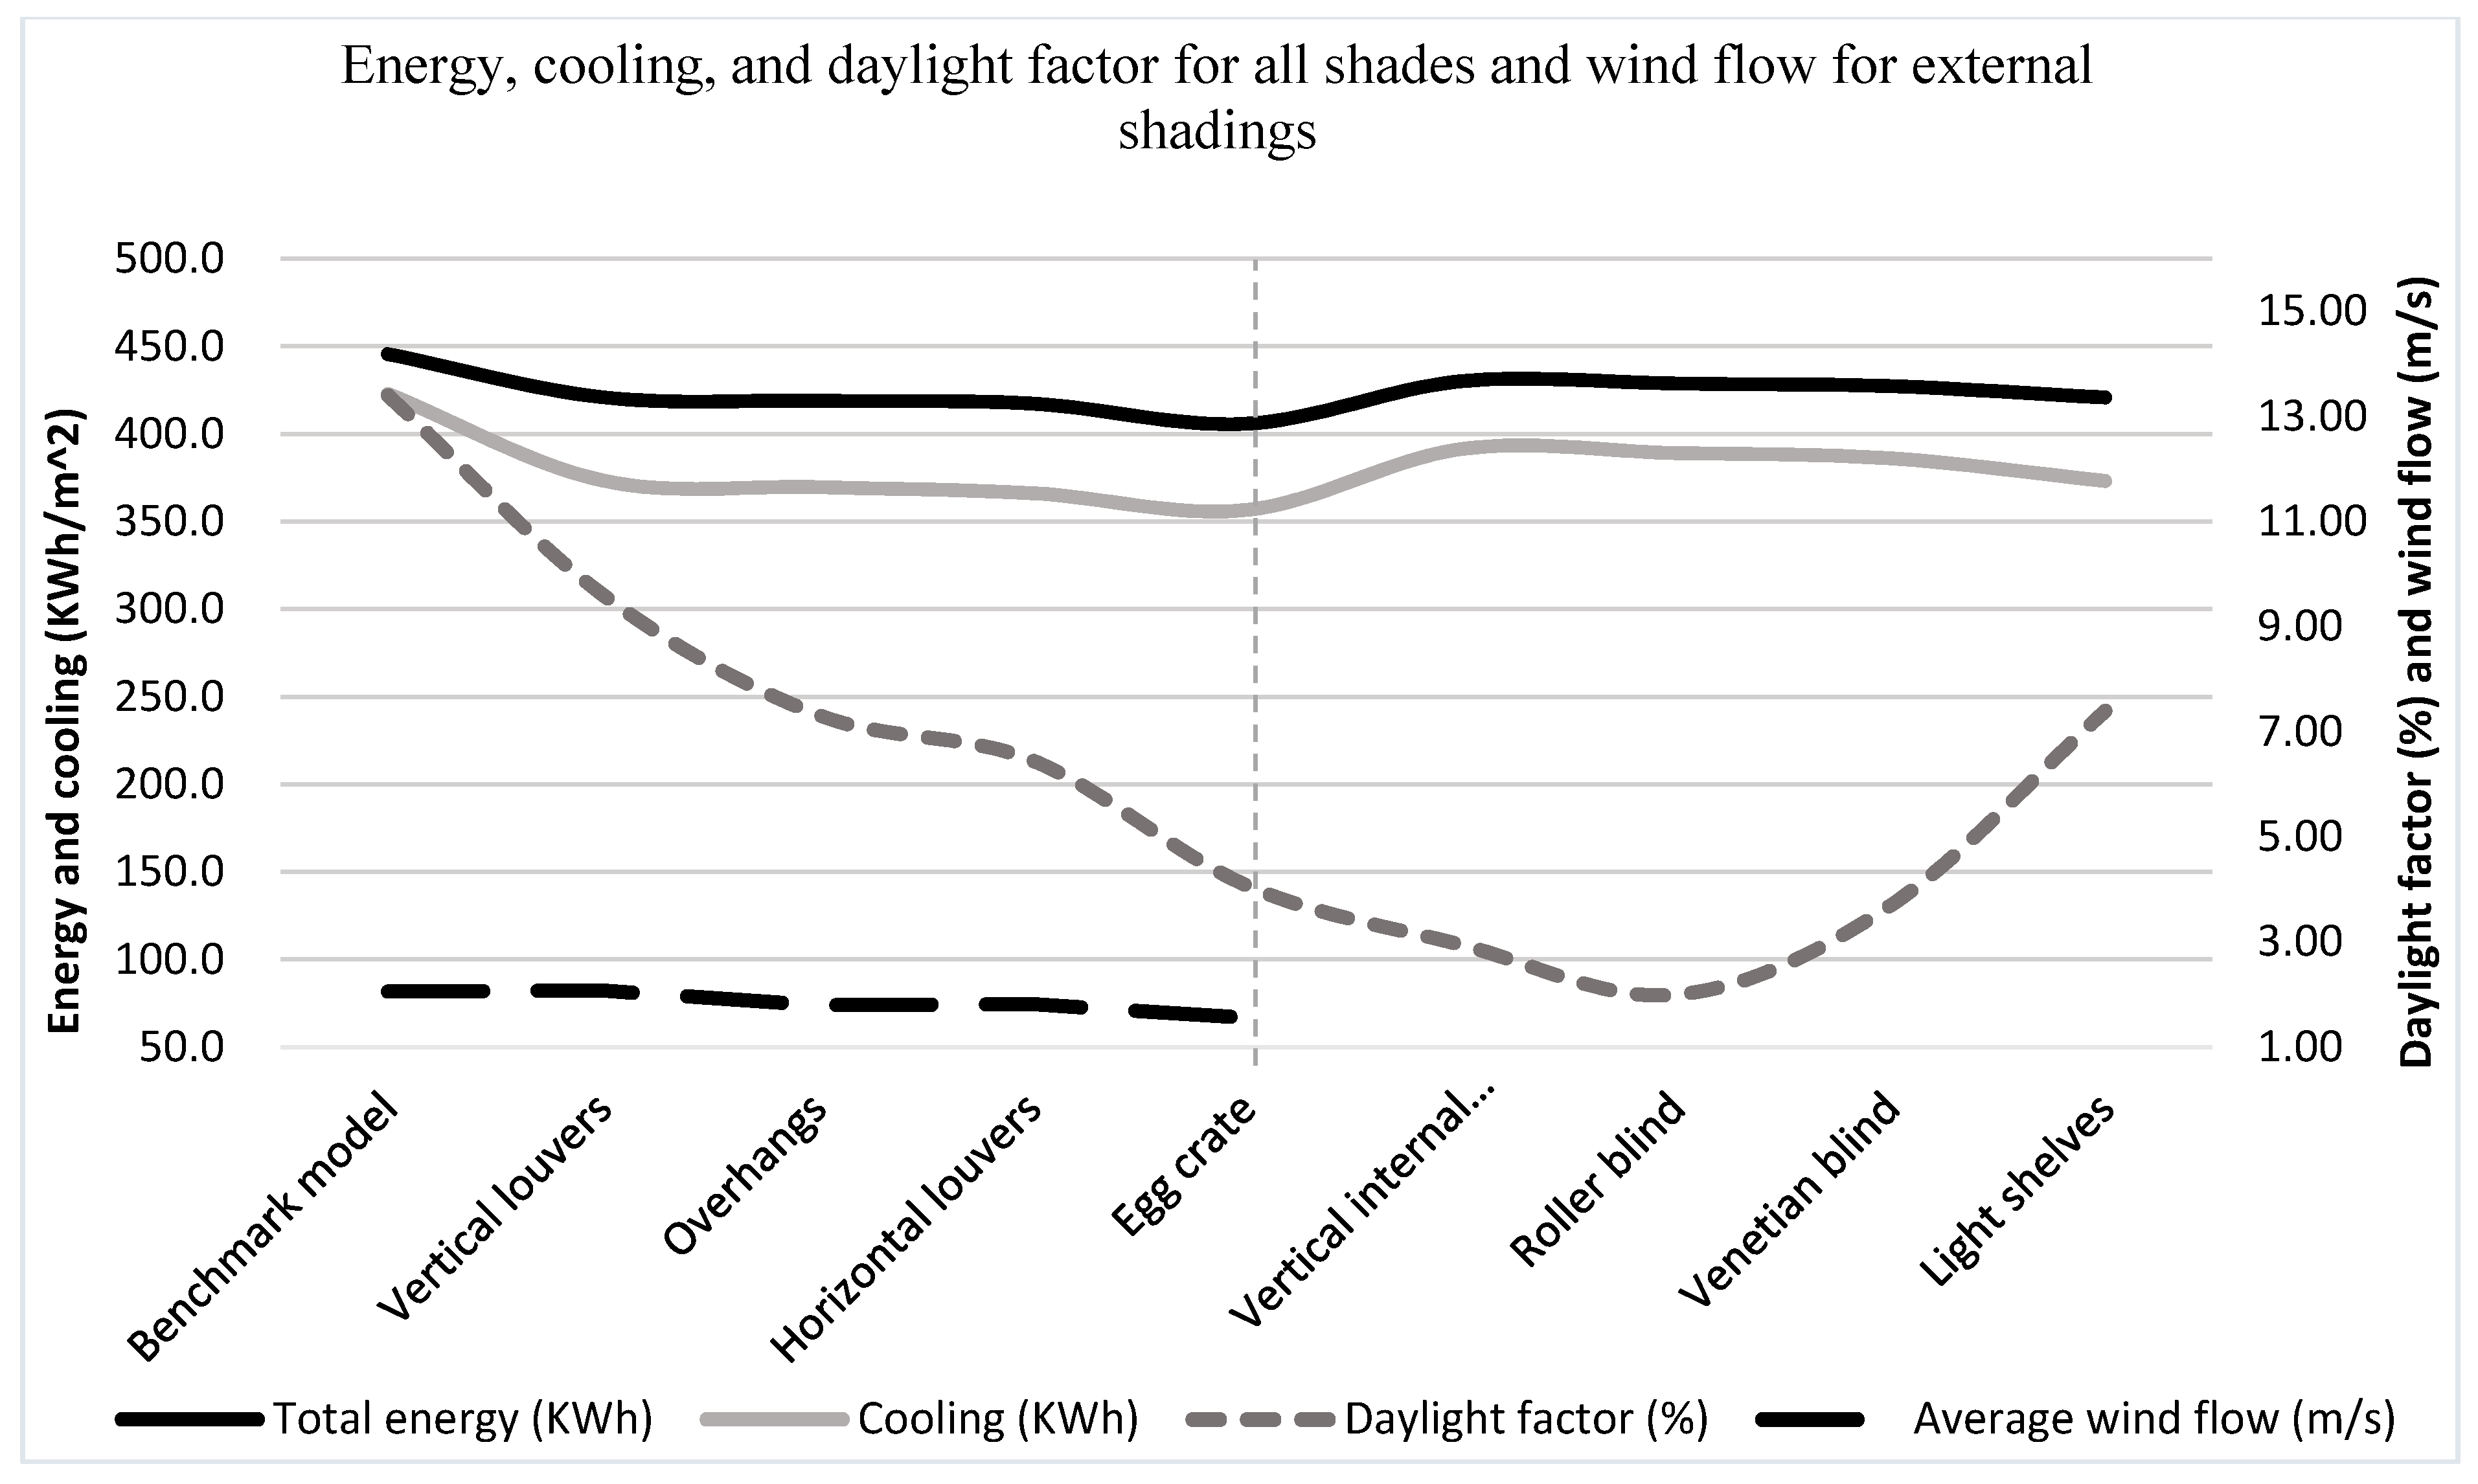
While the egg crate showed the highest reduction in energy as it dropped down to 405.8 kWh/m2 from 445.5 kWh/m2, (Figure 14) which lies under the good practice value mentioned in ECON guide 19 [24]. This demonstrated that the building is designed to follow the guidelines requirements and the implementation of egg crate shading have further improved the savings in energy consumed. Additionally, this resulted in savings of 9% and 16% of energy consumption and cooling loads, moving towards a more sustainable building design. As it decreases the solar gains penetrating indoors from the south orientation, where the horizontal shading will have more influence on the solar gains and radiation. Furthermore, for the east and west orientations when the sun is at a lower angle, vertical shades would be more effective. This would have higher energy savings in cooler climate countries. Hence, the combination of vertical and horizontal louvers will be the most effective shading type in the UAE for cutting off additional energy cooling demand. Subsequently, this will result in lower cooling loads and energy consumed to maintain the thermal comfort to occupants within the building and increase sustainability by avoiding high carbon emissions.
As shading devices applied to buildings influences other factor apart from energy consumption and cooling loads, most importantly the building occupants. Since the windows are the major source of daylighting to building users. Hence, it is critical to take daylighting into consideration when designing shading techniques; therefore, daylighting was considered in this study. All external and internal shades mention above where examined in terms of daylight factor and illuminance levels. It showed that the internal shades had more influence on daylighting as it can totally block the sunlight if the shadings are fully closed. The internal shades such as roller blind, vertical internal louvers, and venetian blind dropped down to 2%, 2.95%, and 3.7%. On the other hand, the external shades allowed higher daylighting, where the egg crate has the most influence on the daylighting levels between the external shading investigated as the daylight factor and lighting levels reduced to average of 4.08% and 309.87 lux, Figure 14. Egg crate shades will only allow diffused lighting indoors that avoids glare. While horizontal louver shading showed higher value of daylight factor and illuminance level of 6.46% and 483 lux. However, according to CIBSE guide A, if the daylight factor is closer to 5% on the horizontal plane, the interior will be daylit even during cloudy days. In addition, CISBE guide A, Table 1.5 recommends a lighting level of 300 lux in offices to avoid glare within the indoor space. Hence, the egg crate would be the most appropriate shading technique to provide the most adequate daylight levels to building users.
Furthermore, as the shading will also influence the air flow through the space in the case of natural ventilation during the winter time, so it was added to this study to ensure appropriate shading type for the UAE’s climate. Since the air velocity within a space effects the convective heat exchange, which effect the thermal comfort of occupancy, therefore the higher velocity can be utilised to offset the warmth sensation that will be caused by high temperatures in the summer. In addition, since the internal shades will be functionable only with the windows are closed, so the benchmark model and the four external shades were only simulated on CFD to determine the effect of the shadings on the air velocity.
The results revealed that the egg crate shade has the highest influence on the wind velocity since it blocks most of the windows vertically and horizontally reducing the average velocity from 3.5 m/s to 1.56 m/s (Figure 14). However, as noticed in the UAE many commercial buildings do not have openable windows, so no natural ventilation and buildings relay fully on mechanical ventilation. In addition, in the extreme climate of the UAE, building occupants prefer to keep the air conditioning on and windows closed for most of the year. Furthermore, during the winter time, the external air velocity may be higher than 3.5 m/s, which will cause higher average velocities within the building space. Therefore, to avoid any discomfort due to wind velocity during the winter, egg crate shading can break down the high air velocities, hence it would be the optimum shading technique in terms of air speed within the indoor space of high-rise commercial buildings.
Based on all those factors mentioned, the ideal shading for high rise commercial buildings is egg crate since it showed the optimum results in almost all the factors that was considered in this study. Where it demonstrated the lowest energy consumption and cooling loads and enhanced the daylighting by allowing diffused light and avoiding glare within the indoor space. In addition to not fully blocking the wind flow through the windows in case it was kept open in the winter time. Therefore, egg crate shading is the optimum shade to be utilised in a hot climate like the UAE.
6. Model Comparison with Literature
The office building was modelled using IES-VE and CFD numerical method to replicate the baseline design of typical commercial buildings in the UAE, as an example of a region with hot climate conditions. The validation of the model was performed by comparing it against pervious literature and industry benchmarks.
Dynamic simulation results of the benchmark model showed that the lowest annual energy consumption to be 405.8 khW/m2 for egg crate model followed by horizontal louvers. This could be validated by both the studies conducted by Fadzil and Al-Tamimi [6] and Alkhateeba and Abu-Hijlehb [7] which showed that the egg crate shading presented the ideal energy savings followed by horizontal shades, similar to this study. Moreover, the energy saving of the shadings simulated in this study ranged from 5.5% to 9% for the external shades, it was confirmed by the study conducted by Lau et al. [5] were the savings ranged between 5% to 9.9%. On the other hand, among internal shades, the light shelves illustrated the highest saving in energy which could be validated with the study undertaken by Kim et al. [9], showing that overall energy saving for longer depth light shelves were the highest against overhang and venetian blinds. Overall, the external shades demonstrated higher savings in energy compared to internal shades as validated by Peng and Ying [10].
In term of daylight factor and illuminance level, again egg crate illustrated the optimum illuminance level of 309 lux, which was validated against the CIBSE guide A unit of 300 lux for office buildings. In addition, it could be confirmed from an experiment conducted by Freewan [8], showing that egg crate had better improvement for illuminance level and interaction of occupants. On the other hand, when comparing different internal shades such as roller blind and venetian blind, venetian blind showed better daylight factor of 3.7% closer to 5% as validated against CIBSE guide A. Moreover, it was confirmed from the experiment conducted by Othman and Khalid [11], showing that the venetian blind shading performs better in maintaining the ideal illuminance level compared to roller blinds.
On the other hand, the egg crate helped in cutting down the wind flow of the office by 55.4% to become 1.56 m/s from inlet velocity of 3.5 m/s. This is the lowest wind flow velocity between all shades examine which is closest to the acceptable value in accordance with ASHRAE (American Society of Heating, Refrigerating and Air Conditioning Engineers) for air velocity to be between 0 to 0.8 m/s [25]. While, ISO (International Organization for Standardization) recommended air velocity to range between 0 to 1 m/s [26]. In addition, this can be validated against both study [17,18] that also showed reduced in the air flow when different shading types were applied with different windows. Since egg crate shading demonstrated the closest value to 1 m/s it was the ideal shading technique among the other shadings simulated.
7. Conclusions
This study aimed to quantify the saving of energy consumed, cooling loads, and influence on daylighting and wind flow achieved when adding shading techniques to a commercial building in Dubai. The IES-VE simulation tool was utilised to determine the savings in terms of energy consumption, cooling loads, and daylighting level, while the CFD numerical method was used to investigate the effect of the shadings on the wind flow. Where eight shadings were examined of which four are external shadings; vertical louvers, overhang, horizontal louvers and egg crate. While the other four are internal shadings; vertical internal louvers, roller blind, venetian blind, and light shelves. To ensure equal comparison among the shades, the volume was kept constant, while the external shades were implemented at 90° angle, whereas the vertical internal shades and venetian blinds were tilted at 30° and 32° angle as per existing literature mentioned previously.
The different factors examined in the study demonstrates that egg crate shading shows the ideal shading technique to be recommended in the UAE. Since it meets all the requirements for the maximum reduction of energy consumption and cooling loads for enhancing sustainable environment by reducing carbon emissions. The energy consumption reduced to 405.8 kWh/m2 from 445.5 kWh/m2, while the cooling loads decreased by 66.15 kWh/m2. In addition to enhancing daylighting for occupant’s visual comfort meeting the required level of 300 lux as recommended by CIBSE guide A. Furthermore, it shows the closest value accepted for wind flow through the windows in case they were kept open in the winter time. Therefore, egg crate shading is the optimum shade to be utilised for commercial buildings in a hot climate like the UAE compared to other types of shading investigated.
Author Contributions
Conceptualization, H.C.; methodology, S.E.; software, S.E.; validation, S.E. investigation, S.E. & H.C.; resources, S.E.; data curation, S.E.; writing—original draft preparation, S.E.; writing—review and editing, H.C.; supervision, H.C.; project administration, H.C.
Funding
This research received no external funding.
Acknowledgments
The authors would like to thank Heriot-Watt University and the School of Energy, Geoscience, Infrastructure and Society for supporting this research.
Conflicts of Interest
The authors declare no conflict of interest.
References
- Jones, P. The design of highly glazed facades and their environmental impact. Adv. Build. Technol. 2002, 2, 1165–1171. [Google Scholar]
- Radhi, H. Evaluating the potential impact of global warming on the UAE residential buildings—A contribution to reduce the CO2 emissions. Build. Environ. 2009, 44, 2451–2462. [Google Scholar] [CrossRef]
- Aboulnaga, M. Towards green buildings: Glass as a building element-the use and misuse in the gulf region. Renew. Energy 2006, 31, 631–653. [Google Scholar] [CrossRef]
- Li, C.; Song, Y.; Kaza, N. Urban form and household electricity consumption: A multilevel study. Energy Build. 2018, 158, 181–193. [Google Scholar] [CrossRef]
- Lau, A.; Salleh, E.; Lim, C.; Sulaiman, M. Potential of shading devices and glazing configurations on cooling energy savings for high rise office buildings in hot humid climates: The case of Malaysia. Int. J. Sustain. Built Environ. 2016, 5, 387–399. [Google Scholar] [CrossRef]
- Fadzil, S.; Al-Tamimi, N. the potential of shading devices for temperature reduction in high rise residential buildings in the tropics. Procedia Eng. 2011, 21, 273–282. [Google Scholar]
- Alkhateeb, E.; Hijlehb, B.A. Potential of upgrading federal buildings in the United Arab Emirates to reduce energy demand. Procedia Eng. 2017, 180, 61–70. [Google Scholar] [CrossRef]
- Freewan, A. Impact of external shading devices on thermal and daylighting performance of offices in hot climate regions. Sol. Energy 2014, 102, 14–30. [Google Scholar] [CrossRef]
- Kim, G.; Kim, J.; Lim, H.; Lim, T.; Schaefer, L. Comparative advantage of an exterior shading device in thermal performance for residential buildings. Energy Build. 2012, 46, 105–111. [Google Scholar] [CrossRef]
- Peng, Y.; Ying, J. Experimental study on the effectiveness of internal shading devices. Energy Build. 2016, 111, 154–163. [Google Scholar]
- Khalid, A.; Othman, A. comparative performance of internal venetian blind and roller blind with respects to indoor illumination levels. Procedia Soc. Behav. Sci. 2013, 101, 542–553. [Google Scholar]
- Ouahrani, D.; Touma, A. Shading and day lighting controls energy savings in offices with fully glazed facades in hot climates. Energy Build. 2017, 151, 263–274. [Google Scholar]
- Ouahrani, D.; Touma, A. Quantifying savings in spaces energy demands and CO2 emissions by standing and lighting controls in the Arabian Gulf. J. Build. Eng. 2018, 18, 429–437. [Google Scholar]
- Lee, J.; Alshayeb, M.; Chang, J. A study of shading device configuration on the natural ventilation efficiency ang energy performance of a double skin façade. Procedia Eng. 2015, 118, 310–317. [Google Scholar] [CrossRef]
- Taleb, H. Using passive cooling strategies to improve thermal performance and reduce energy consumption of residential buildings in UAE buildings. Front. Archit. Res. 2014, 3, 154–165. [Google Scholar] [CrossRef]
- Hammad, F.; Abu-Hijleh, B. The energy savings potential of using dynamic external louvers in an office building. Energy Build. 2010, 42, 1888–1895. [Google Scholar] [CrossRef]
- Kannan, K.; Nagarajan, R.; Dhanalakshmi, M. Influence of external concrete shading devices on internal airflow pattern through windows. Int. J. Civ. Eng. Technol. 2018, 9, 1555–1563. [Google Scholar]
- Hildebrand, P.W. Shading and Cooling: Impacts of Solar Control and Windows on Indoor Airflow. Available online: https://escholarship.org/uc/item/5087z1zd (accessed on 1 April 2019).
- Saifelnasr, S. A design chart to determine the dimensions of a horizontal shading device over an equator-facing window as a function of the latitude and the shading height. Soc. Behav. 2016, 216, 724–735. [Google Scholar] [CrossRef]
- Shading Coefficient and Short-Wave Radiant Fraction for Blinds and Curtains. IES, 2018. Available online: https://help.iesve.com/ve2018/table_8_shading_coefficient_and_short_wave_radiant_fraction_for_blinds_and_curtains.htm?ms=AQAAAAAAAAAAAAAAAAAAAAAAAAAAAAAAAAAAAAAAEA%3D%3D&st=MA%3D%3D&sct=NzIuODAwMDAzMDUxNzU3ODE%3D&mw=MjQw (accessed on 15 December 2018).
- CIBSE. Guide A: Environment Design, 7th ed.; CIBSE: London, UK, 2012. [Google Scholar]
- CIBSE. Guide B: Heating, Ventilation, AC and Refrigeration; CIBSE: London, UK, 2005. [Google Scholar]
- Ouarada, T.; Charron, C.; Shin, J.; Al-Mandoos, A.; Tamimi, M.; Ghedira, H.; Al-Hosary, T. Probability distributions of wind speed in the UAE. Energy Convers. Manag. 2015, 93, 414–434. [Google Scholar] [CrossRef] [Green Version]
- ECON Guide 19; Energy Use in Offices: London, UK, 2000.
- ASHRAE. ASHRAE Standard 55-2010; Thermal Environment Conditions for Human Occupancy; ASHRAE: Atlanta, GA, USA, 2007. [Google Scholar]
- ISO EN 7730. Ergonomics of the Thermal Environment—Analytical Determination and Interpretation of Thermal Comfort Using Calculation of the PMV and PPD Indices and Local Thermal Comfort. ISO EN: London, UK. Available online: https://www.iso.org/standard/39155.html (accessed on 30 July 2019).
Figure 1.
Floor plan (in mm).

Figure 2.
Benchmark model geometry.

Figure 3.
Mesh representation.

Figure 4.
Outcomes of external and internal shade for energy consumption, cooling loads, and daylight factor.
Figure 4.
Outcomes of external and internal shade for energy consumption, cooling loads, and daylight factor.

Figure 5.
Different reductions of external and internal shadings compared to benchmark model (without shades).
Figure 5.
Different reductions of external and internal shadings compared to benchmark model (without shades).

Figure 6.
Illuminance level of shadings compared to CIBSE value.

Figure 7.
Comparison between benchmark and external and internal shades for daylighting factor levels.
Figure 7.
Comparison between benchmark and external and internal shades for daylighting factor levels.

Figure 8.
Axial and radial directions created across all the models.

Figure 9.
Velocity profile for Axial direction (CFD).

Figure 10.
Velocity profile for Radial direction (CFD).

Figure 11.
Comparison in reductions between inlet velocity and velocities alone axial and radial direction of each model
Figure 11.
Comparison in reductions between inlet velocity and velocities alone axial and radial direction of each model

Figure 12.
Comparison of the inlet velcoity and overall average velocity.

Figure 13.
Constant velocity contour levels.


Figure 14.
Outcomes of external and internal shade for energy consumption, cooling loads, daylight factor, and wind flow for external shades.
Figure 14.
Outcomes of external and internal shade for energy consumption, cooling loads, daylight factor, and wind flow for external shades.


Table 1.
External shading simulated.
| Overhang | Vertical Louvers | Horizontal Louver | Egg Crate |
|---|---|---|---|
 |  |  |  |
Table 2.
Internal shading simulated.
| Vertical Internal Louvers | Roller Blinds | Venetian Blind | Light Shelves |
|---|---|---|---|
 |  |  |  |
Table 3.
Thermal templates assigned for the building (CIBSE guide A and B).
| Zones | Cooling | Lighting | People | Equipment | Infiltration | Auxiliary Ventilation |
|---|---|---|---|---|---|---|
| Offices | 23 °C | 12 W/m2 | 70 W/p | 25 W/m2 | 0.25 ACH | 3 ACH |
| Circulation | 23 °C | 12 W/m2 | 70 W/p | - | 0.25 ACH | 10 l/s/p |
| Pantry | 23 °C | 12 W/m2 | 70 W/p | 25 W/m2 | 0.25 ACH | - |
| Washrooms | 23 °C | 12 W/m2 | 70 W/p | - | 0.25 ACH | 3 ACH |
| Lifts | 23 °C | 12 W/m2 | 70 W/p | - | 0.25 ACH | - |
| Stairs | 23 °C | 12 W/m2 | - | - | 0.25 ACH | - |
| Plantrooms | No cooling | 12 W/m2 | - | - | 0.25 ACH | - |
Table 4.
Room profiles boundary conditions.
| Zones | Cooling | Lighting | People | Equipment | Infiltration | Auxiliary Ventilation |
|---|---|---|---|---|---|---|
| Offices | Weekly profile | Weekly profile | Weekly profile | On | On | Weekly profile |
| Circulation | On | On | On | Off | On | On |
| Pantry | Weekly profile | Weekly profile | Weekly profile | Off | On | Off |
| Washrooms | On | On | On | Off | On | On |
| Lifts | On | On | On | Off | On | Off |
| Stairs | On | On | Off | Off | On | Off |
| Plantrooms | Off | Weekly profile | Off | Off | On | Off |
Table 5.
Construction materials (IES-VE).
| Materials | Conductivity (W/mK) | Density (kg/m3) | Specific Heat (J/kg K) | |
|---|---|---|---|---|
| External walls (0.26 W/m2k) | Rainscreen (3 mm) | 50 | 7800 | 450 |
| Cavity (50 mm) | - | - | - | |
| Insulation (81.4 mm) | 0.025 | 20 | 1030 | |
| Cement bonded particle board (12 mm) | 0.23 | 1100 | 0.0522 | |
| Cavity (50 mm) | - | - | - | |
| Plasterboard (12.5 mm) | 0.2100 | 700 | 0.0595 | |
| Internal partition (1.875 W/m2k) | Plaster board (12.5 mm) | 0.2100 | 700 | 1000 |
| Cavity (50 mm) | - | - | - | |
| Plaster board (12.5 mm) | 0.2100 | 700 | 1000 | |
| Glazing (1.57 W/m2k) | Outer pane (6 mm) | 1.0600 | - | - |
| Cavity (50 mm) argon fill | - | - | - | |
| Inner pane (6 mm) | 1.0600 | - | - | |
| Ceiling/floor (internal) (1.048 W/m2k) | Chipboard flooring (20 mm) | 0.1300 | 500 | 1600 |
| Cavity (50 mm) | - | - | - | |
| Screed (50 mm) | 1.1500 | 1800 | 1000 | |
| Reinforced concrete (100 mm) | 2.30 | 2300 | 1000 | |
| Cavity (50 mm) | - | - | - | |
| Plasterboard (12.5 mm) | 0.2100 | 700 | 1000 | |
| Exposed floor (0.22 W/m2k) | Insulation (98.2 mm) | 0.0250 | 700 | 1000 |
| Reinforced concrete (100 mm) | 2.30 | 2,300 | 1000 | |
| Cavity (50 mm) | - | - | - | |
| Chipboard flooring (20 mm) | 0.130 | 500 | 1600 | |
| Roof (0.179 W/m2k) | Insulation (154.4 mm) | 0.030 | 40 | 1450 |
| Membrane (0.1 mm) | 1.0 | 1100 | 1000 | |
| Concrete deck (100 mm) | 2.0 | 2400 | 1000 | |
| Cavity (50 mm) | - | - | - | |
| Plasterboard (12.5 mm) | 0.210 | 700 | 1000 | |
Table 6.
Geometry create in workbench.
| Benchmark Model (Without Shading) | Overhang | Vertical Louvers | Horizontal Louver | Egg Crate |
|---|---|---|---|---|
 |  |  |  |  |
Table 7.
Meshing nodes and elements.
| Model | Nodes | Elements |
|---|---|---|
| Benchmark | 51,866 | 255,176 |
| Overhang | 53,309 | 259,483 |
| Vertical louvers | 54,631 | 264,976 |
| Horizontal louvers | 53,153 | 259,350 |
| Egg crate | 59,213 | 280,837 |
Table 8.
Boundary conditions.
| Parameter | Value |
|---|---|
| Gravity | 9.81 (m/s2) |
| Velocity | 3.5 (m/s) |
| Time | Steady-state |
| Solver type | Pressure based |
| Viscous model | k-epsilon |
| Velocity formation | Absolute |
| Near-wall treatmet | Enhanced wall functions |
Table 9.
Energy and cooling loads of different shading techniques.
| Shading Models | Total Energy (kWh/m2) | Total Energy (kWh) | Cooling (kWh) |
|---|---|---|---|
| Benchmark model | 445.5 | 19,468,922 | 18,471,650 |
| Vertical louvers | 420.9 | 18,390,945 | 16,315,779 |
| Overhangs | 419.0 | 18,307,471 | 16,148,825 |
| Horizontal louvers | 417.3 | 18,233,311 | 16,000,496 |
| Egg crate | 405.8 | 17,731,153 | 15,581,051 |
| Vertical internal louvers | 430.0 | 18,790,363 | 17,099,484 |
| Roller blind | 428.7 | 18,732,873 | 16,999,625 |
| Venetian blind | 427.2 | 18,666,875 | 16,867,633 |
| Light shelves | 420.7 | 18,384,754 | 16,303,394 |
Table 10.
Reduction by percent for energy and cooling loads.
| Shading Reductions | Energy (kWh/m2) Reduction | Energy (kWh) Reduction | Cooling (kWh) Reduction |
|---|---|---|---|
| Vertical louvers | −5.54% | −5.5% | −11.7% |
| Overhangs | −5.97% | −6% | −12.6% |
| Horizontal louvers | −6.35% | −6.3% | −13.4% |
| Egg crate | −8.93% | −9% | −16% |
| Vertical internal louvers | −3.49% | −3.5% | −7.4% |
| Roller blind | −3.78% | −3.8% | −8% |
| Venetian blind | −4.12% | −4.1% | −8.4% |
| Light shelves | −5.57% | −5.6% | −11.7% |
Table 11.
Minimum, average and maximum daylight factor and illuminance level for each model.
| Shading | Minimum | Average | Maximum | |||
|---|---|---|---|---|---|---|
| Daylight factor (%) | Illuminance (lux) | Daylight factor (%) | Illuminance (lux) | Daylight factor (%) | Illuminance (lux) | |
| Benchmark | 0.1 | 5.47 | 13.4 | 1017.5 | 42.9 | 3254.29 |
| Vertical louvers | 0.1 | 4.25 | 9.61 | 720.62 | 27.7 | 2100.77 |
| overhang | 0.1 | 8.28 | 7.33 | 895.85 | 25.5 | 3112.69 |
| Horizontal louvers | 0.1 | 4.77 | 6.46 | 483.09 | 16.4 | 1,245.5 |
| Egg crate | 1.3 | 1.06 | 4.08 | 309.87 | 10.8 | 823.35 |
| vertical internal louvers | 0.2 | 25.4 | 2.95 | 361.6 | 13.8 | 1680.01 |
| roller blind | 0.1 | 0.09 | 2 | 247.5 | 12.1 | 1478.21 |
| venetian blind | 1.8 | 1.71 | 3.7 | 433.8 | 9.6 | 1175.09 |
| light shelves | 0.1 | 1.06 | 7.4 | 563.3 | 29 | 2200.98 |
Table 12.
Difference in lighting levels by percentage in comparison to benchmark model.
| Shading | Minimum | Average | Maximum | |||
|---|---|---|---|---|---|---|
| Daylight factor (%) | Illuminance (lux) | Daylight factor (%) | Illuminance (lux) | Daylight factor (%) | Illuminance (lux) | |
| Vertical louvers | 0% | −22% | −28% | −29% | −35% | −35% |
| overhang | 0% | 51% | −45% | −12% | −41% | −4% |
| Horizontal louvers | 0% | −13% | −52% | −53% | −62% | −62% |
| Egg crate | 1200% | −81% | −70% | −70% | −75% | −75% |
| vertical internal louvers | 100% | 364% | −78% | −64% | −68% | −48% |
| roller blind | 0% | −98% | −85% | −76% | −72% | −55% |
| venetian blind | 1700% | −69% | −72% | −57% | −78% | −64% |
| light shelves | 0% | −81% | −45% | −45% | −32% | −32% |
Table 13.
Daylight factor of the external and internal shadings.
| Shadings | External Shading | Day Lighting Factor |
|---|---|---|
| Benchmark (with no shading) |  |  |
| Vertical louvers |  |  |
| Overhang shading |  |  |
| Horizontal louvers |  |  |
| Egg crate shading |  |  |
| Vertical internal louvers |  |  |
| Roller blind |  |  |
| Automated Venetian blinds |  |  |
| Light shelves |  |  |
Table 14.
Results of axial and radial velocity profiles.
| Shading | Minimum (m/s) | Average (m/s) | Maximum (m/s) | Percentage Difference between Minimum and Maximum (%) | ||||
|---|---|---|---|---|---|---|---|---|
| Axial | Radial | Axial | Radial | Axial | Radial | Axial | Radial | |
| Benchmark | 1.08 | 1.9 | 1.84 | 2.27 | 2.85 | 2.81 | 62% | 32% |
| Overhang | 1.16 | 1.86 | 1.89 | 2.26 | 2.72 | 2.82 | 57% | 34% |
| Vertical louvers | 0.5 | 1.62 | 1.56 | 2.03 | 2.33 | 2.6 | 79% | 38% |
| Horizontal louvers | 1.01 | 1.68 | 1.64 | 1.99 | 2.38 | 2.61 | 58% | 36% |
| Egg crate | 0.23 | 1.44 | 1.42 | 1.7 | 2.24 | 2.04 | 90% | 29% |
Table 15.
Reduction from inlet velocity.
| Shading | Reduction of Minimum Velocity from Inlet Velocity (%) | Reduction of Average Velocity from Inlet Velocity (%) | Reduction of Maximum Velocity from Inlet Velocity (%) | |||
|---|---|---|---|---|---|---|
| Axial | Radial | Axial | Radial | Axial | Radial | |
| Benchmark | 69% | 46% | 47% | 35% | 19% | 20% |
| Overhang | 67% | 47% | 46% | 35% | 22% | 19% |
| Vertical louvers | 86% | 54% | 55% | 42% | 33% | 26% |
| Horizontal louvers | 71% | 52% | 53% | 43% | 32% | 25% |
| Egg crate | 93% | 59% | 59% | 51% | 36% | 42% |
Table 16.
Average velocity of axial and radial for each model.
| Shading | Inlet Velocity (m/s) | Average Velocity of Axial and Radial (m/s) | Percentage Reduction (%) |
|---|---|---|---|
| Benchmark | 3.5 | 2.06 | 41.3% |
| Overhang | 2.08 | 40.7% | |
| Vertical louvers | 1.80 | 48.7% | |
| Horizontal louvers | 1.82 | 48.1% | |
| Egg crate | 1.56 | 55.4% |
© 2019 by the authors. Licensee MDPI, Basel, Switzerland. This article is an open access article distributed under the terms and conditions of the Creative Commons Attribution (CC BY) license (http://creativecommons.org/licenses/by/4.0/).
Share and Cite
MDPI and ACS Style
Omar Elshiwihy, S.; Nasarullah Chaudhry, H. Parametric Study on Determining Optimum Shading Techniques for Urban High-Rise Dwellings. Urban Sci. 2019, 3, 85. https://doi.org/10.3390/urbansci3030085
AMA Style
Omar Elshiwihy S, Nasarullah Chaudhry H. Parametric Study on Determining Optimum Shading Techniques for Urban High-Rise Dwellings. Urban Science. 2019; 3(3):85. https://doi.org/10.3390/urbansci3030085
Chicago/Turabian StyleOmar Elshiwihy, Shorouk, and Hassam Nasarullah Chaudhry. 2019. "Parametric Study on Determining Optimum Shading Techniques for Urban High-Rise Dwellings" Urban Science 3, no. 3: 85. https://doi.org/10.3390/urbansci3030085