Influencing Mechanism Analysis of Urban Form on Travel Energy Consumption—Evidence from Fukuoka City, Japan


1
Department of Architecture and Urban Design, Kyushu University, 3-29-405 Yakuin, Chuo-ku, Fukuoka 810-0022, Japan
2
Department of Architecture and Urban Design, Kyushu University, 6-10-1 Hakozaki, Higashi-ku, Fukuoka 812-8581, Japan
*
Author to whom correspondence should be addressed.
Urban Sci. 2018, 2(1), 15; https://doi.org/10.3390/urbansci2010015
Submission received: 27 December 2017
/
Revised: 28 January 2018
/
Accepted: 11 February 2018
/
Published: 13 February 2018
Abstract
:The increasing threat of transportation energy insecurity, environmental issues and public health issues have led to a growing body of research that looks at the potential contribution of urban planning in reducing travel energy consumption. The sustainable planning strategies aimed at reducing travel energy consumption need to understand the relationships between urban form, travel behavior and energy consumption. This study provided additional insights into the relationships between urban form, travel mode choice and energy consumption via mode-wise (non-motorized, motorcycle, car, bus and rail) stratified models and travel energy consumption model by applying the multiple linear regression model based on 108 zones of Fukuoka city, Japan. This study suggests that urban form makes a major contribution towards conserving travel energy in cities. This study shows that the provision of bus stops and rail stations are essential alongside an increase in road connectivity, otherwise increasing only road connectivity encourages people to use private modes of transport, which is not good for travel energy conservation. The findings suggest that better transit accessibility promotes public mode use, and reduces private mode use and travel energy consumption even where travel distance is longer. Higher density with greater land use mix and better transit accessibility has a more profound influence on increasing use of the non-motorized mode.
1. Introduction
The potential limits to the availability of gasoline and the increasing rate of dependence on the automobile for travel is a growing concern regarding how travel energy consumption in a city can be reduced. In addition to the threat of gasoline insecurity, extensive automobile usage also causes problems in areas of public health and social equity [1] as the transportation sector is responsible for over half of the CO2 emissions from fossil fuel combustion [2]. Previous research [3] has demonstrated that the limited supply of energy can be compensated for by the use of higher-efficiency automobiles, the shift from the automobile to public transportation and a restructuring of cities to encourage the development of new urban centers in a more energy-conserving manner. Also, many studies show that fuel types, vehicle fuel efficiency and vehicle miles traveled could induce less energy consumption [4,5,6]. However, technological interventions and modal shifts have little impact in reducing travel energy consumption without the accompanying planning strategies [7]. Therefore, the question of how to reduce travel energy consumption via the urban planning discipline has become a significant research topic to urban planners and transport planners.
Energy and land use are mutually connected: on the one hand, the production and utilization of energy has impacts on land use and on the other hand, the use of land determines energy consumption [8]. It is often concluded that how urban form is planned and organized determines travel energy consumption to large extent. Similarly, land use planning is widely considered as a fundamental and long-term strategy to reduce automobile use as it determines the basic spatial settings for various activities [5,9]. At the same time, the urban land use-transportation system is such a complex entity that all the components in the system work collaboratively rather than separately [10].
Many studies show evidence that land use and urban design solutions, such as compact development, transit oriented development, neo-traditional neighborhood design, new urbanism and smart growth [11,12,13,14] could induce fewer automobile trips and reduce corresponding travel energy consumption and emissions [4,15,16]. However, the mechanism is unclear on how the urban form affects travel energy consumption [4,17,18,19] as there has been relatively little research, findings are less conclusive and there is limited evidence on how the individual variable of urban form affects travel energy consumption.
A study by Newman and Kenworthy [16] is the first attempt to explore the connections of density and travel energy consumption. They concluded that urban density is the most important factor that effects travel energy. However, they only applied density as the urban form variable. Similarly, research by Banister et al. [20] applied density as the urban form variable and their result showed that there were significant relations between urban form and energy consumption. Likewise, the study by Susilo and Stead [21] showed that commuters who reside in denser urban areas consume less energy compared to commuters who reside in less urbanized areas. Similarly, in the research by Brownstone and Golob [22], only residential density was employed to describe urban form. In contrast, Van de Coevering and Schwanen [23], Stead [24] and Kitamura et al. [25] had different conclusions that urban density is not the main factor for travel energy consumption. Their conclusions are satisfied with some studies that revealed that the impact of density on travel is negligible [19]. The research using only density as a characteristic of urban form is less conclusive in establishing the relationships between the urban form and travel energy consumption. Apart from these arguments, the most important point is that urban form does not have a direct effect on travel energy consumption [10]. It means that urban form affects travel energy consumption through other intermediate variables such as mode choice and travel distance. Travel energy consumption varies greatly for different travel modes; energy consumption for cars is 1.08 tons of standard coal, which is 12 times that of rail transit and 5 times that of buses [26]. Similarly, travel energy consumption varies according to the distance traveled. As the distance from the residence to the city center lengthens, individual travel energy consumption increases [27,28]. Holden and Norland [29] found that residents living in high-density areas consume more energy for long-distance travel.
Furthermore, there are many influencing factors for individual travel mode choices, such as urban form and travel purpose. Many researchers suggest urban forms are significant predictors of transit and non-motorized travel modes [18,30,31,32,33,34]. However, those earlier studies consider only a few measures of urban form (in most of the cases only one measure) to examine the effect of urban form on travel behavior. For example, Bhat and Singh [35] and Dunphy and Fisher [36] have used density whereas Bhat and Pozsgay [37] and Bhat and Zhao [38] have focused on a single measure of accessibility. Some researchers have considered multiple urban form measures jointly; for example, Frank and Pivo [39] consider density and land use, and Kitamura et al. [40] use the density and accessibility measures. Even with many mixed findings [18,19,41,42], there has been a growing recognition that changes in urban form characteristics have a significant impact on people’s travel behavior.
As mentioned above, the previous studies examine either the connections of urban form and travel energy consumption or connections of urban form and travel mode choice considering only single or limited measures of urban form in an isolated way and do not represent the reality. Therefore, this study attempts to include a multiple of urban form measures to understand the relationships between urban form, mode choice and travel energy consumption in an integrated way. Many different measures are available to characterize urban form; it is logical to follow the standard framework instead of a random selection. Therefore, we applied the “5Ds” framework, which is accepted as a standard method and extensively used to characterize land-use characteristics at the micro-scale level in travel behavior research [43,44,45]. Furthermore, this study intends to analyze the entire city of Fukuoka at the micro level based on 108 zones. The “5Ds” framework is ideally suited for measuring all aspects of urban form that effect on travel behavior. The “5Ds” framework includes five dimensions of urban form: density, diversity, design, destination accessibility and distance to transit. Cervero and Kockelman [15] first introduced the “3Ds”—density, diversity and design as measures of the urban form that influence travel. Later, two more “Ds” were developed—destination accessibility and distance to transit [18].
Furthermore, compared to abundant studies on the connections between urban form and mode choice using socio-economic factors as controlling variables, studies on the influences of travel purpose are rare. Unless it is individual travel to perform any activity, there is apparently no use of mode choice and no travel energy consumption for that individual. However, socio-economic factors do not show much evidence on this matter. Different types of travel purposes are different by nature and generate various travel patterns that further affect mode choice and travel energy consumption. There are considerable differences in the transport mode used for different purposes [46]. To some extent, the types of purpose could represent the types of destination locations. Meanwhile, most of the research on travel behavior concentrates on particular types of travel purpose, for example, non-work trip [47], maintenance trip [48], work trip [49] and shopping trip [50]. As the travel activity plays an important role in influencing travel mode choice and energy consumption, different types of travel purposes cannot be neglected.
Therefore, studies to understand the relationships between urban form, mode choice and travel energy consumption deserve further research to provide additional insights on how urban form affects travel energy consumption. The analysis method to achieve this aim is threefold: first, this research analyzes the relationship between urban form on travel mode choice (non-motorized mode, motorcycle, car, bus and rail) by using travel purpose (work trip, study trip, business trip and private trip) as the controlling variable. Second, it analyzes the relationship between mode choice on travel energy consumption by using travel distance as the controlling variable. Third, it analyzes the interrelationship between urban form, mode choice and travel energy consumption and further identifies the influencing factors of travel energy consumption.
2. Materials and Methods
2.1. Study Area
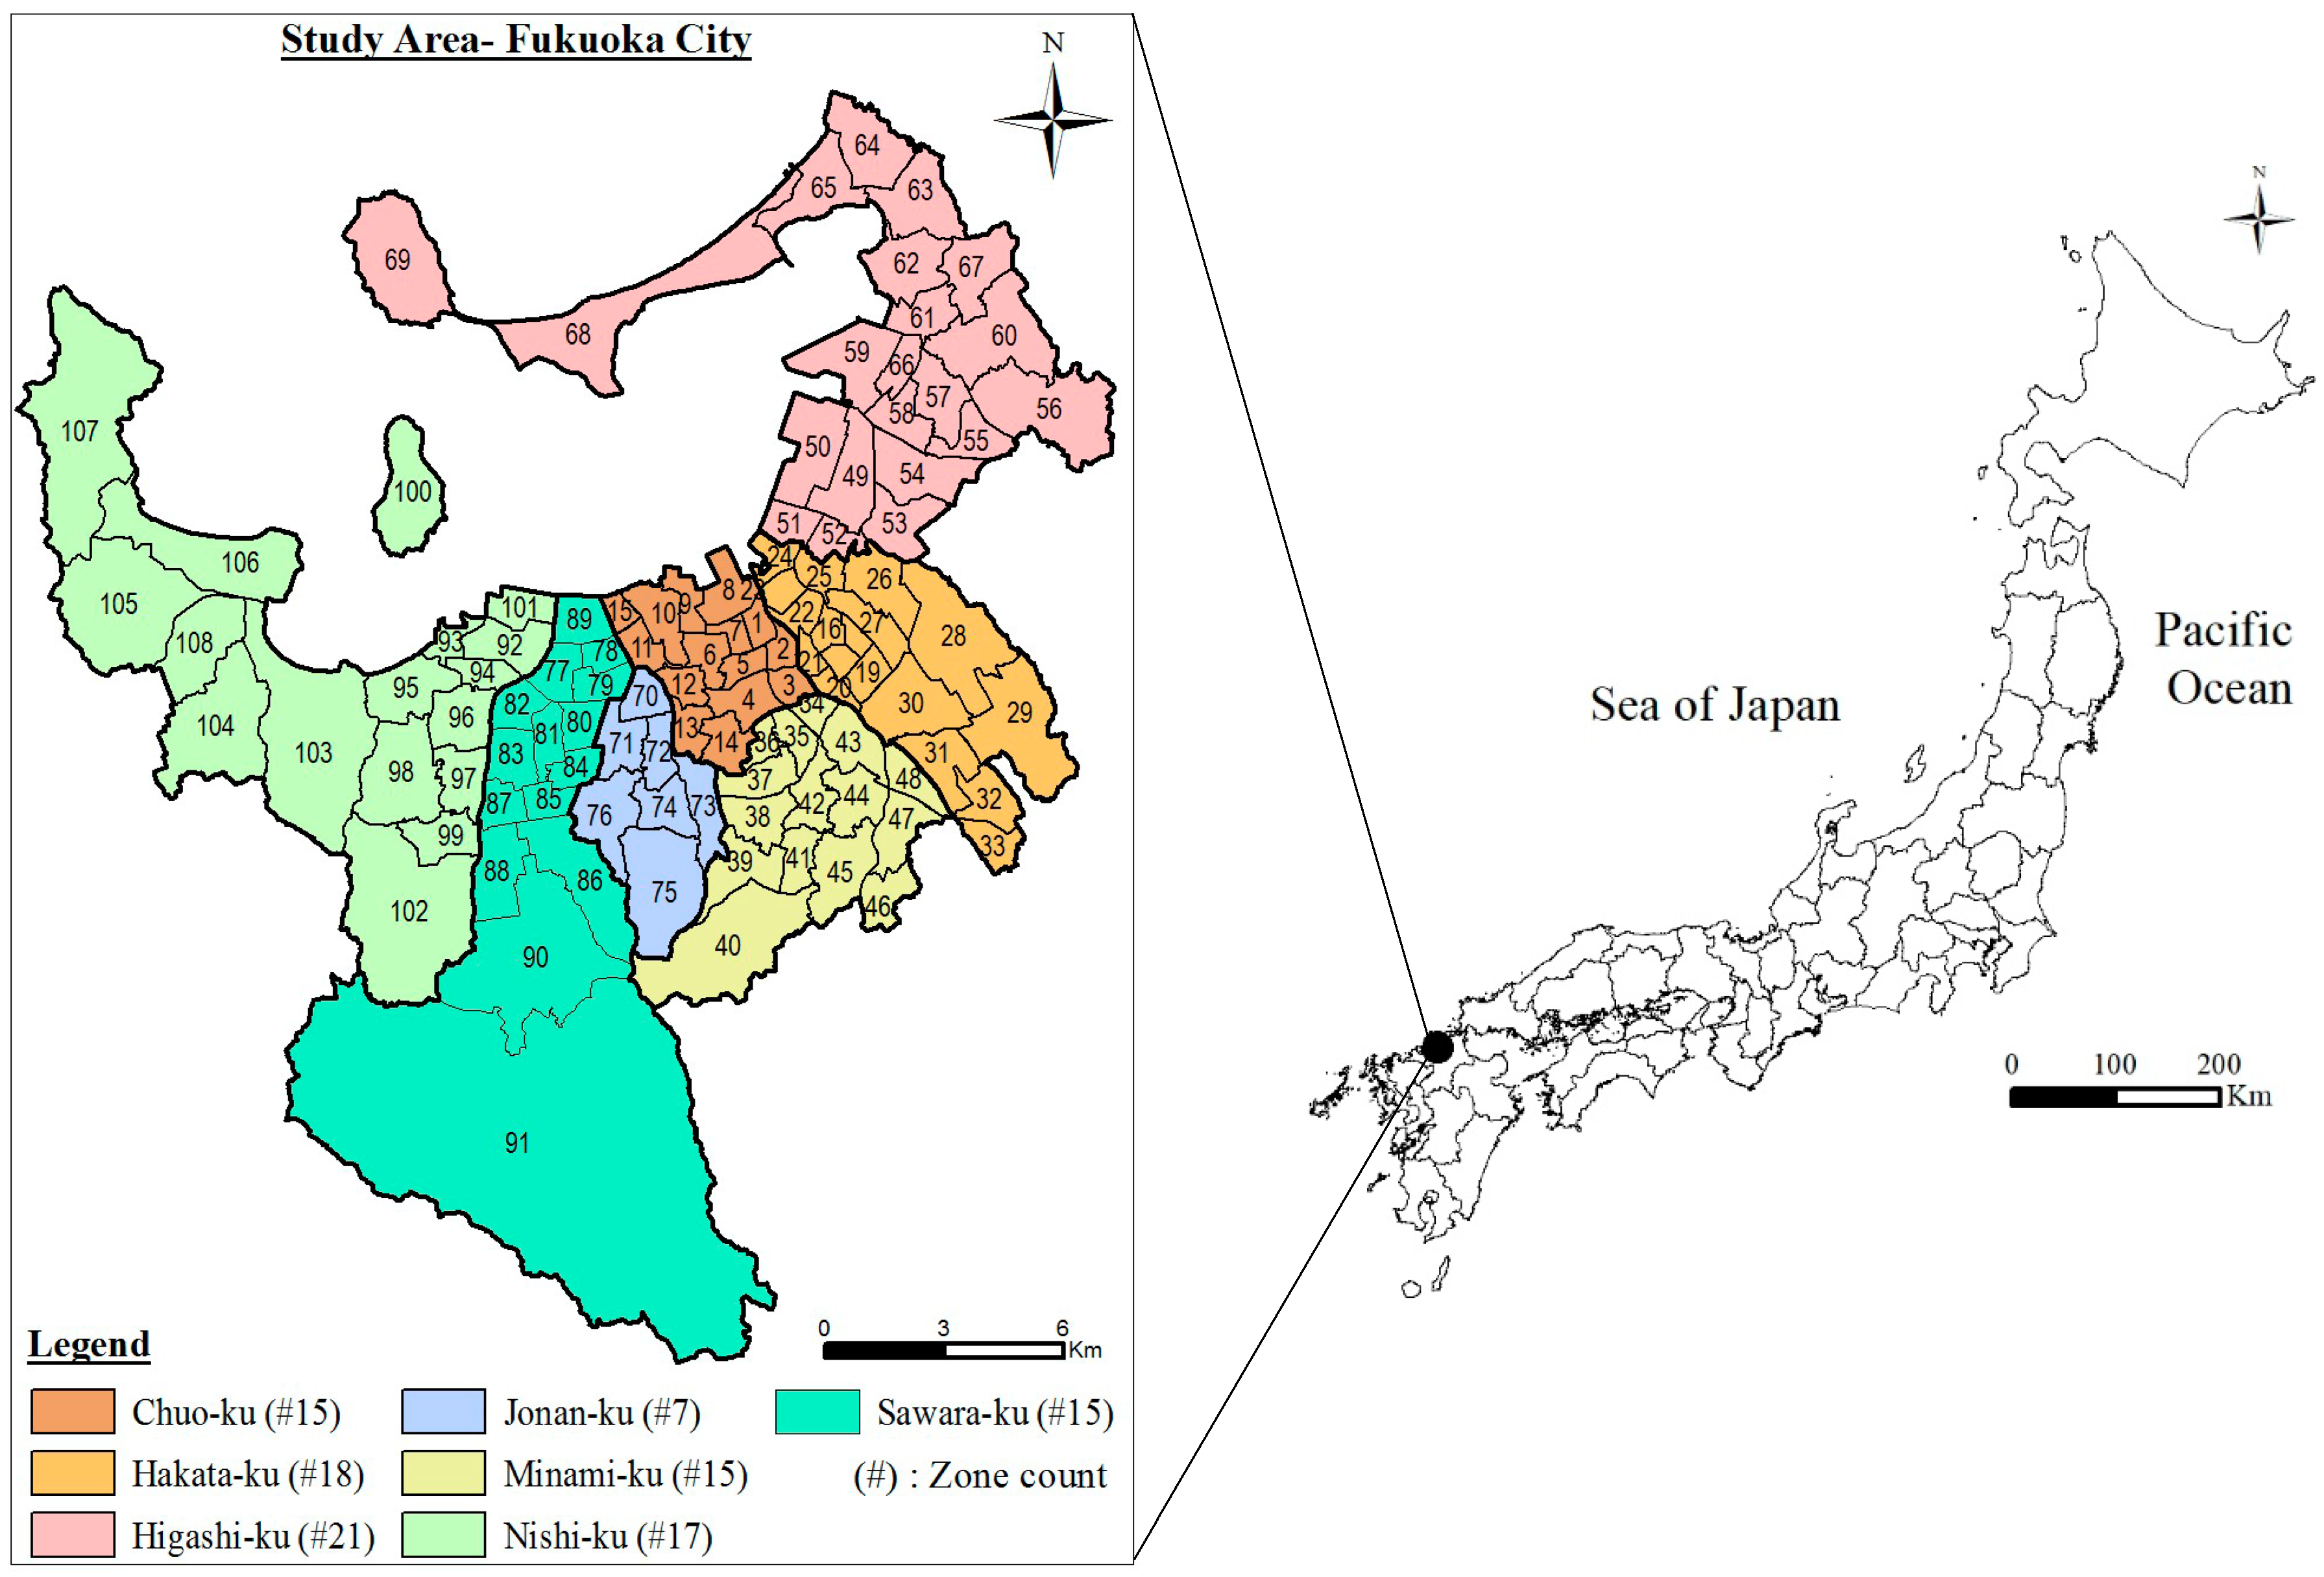
Fukuoka City is the capital of Fukuoka Prefecture, located along the northern shore line of Kyushu Island, Japan. The city covers the area of 340.03 square kilometers, with a registered population of 1.53 million as of 2015 census (Statistics Bureau Japan). Fukuoka first came to be known as the political, economic, and cultural center of Kyushu in the 1930s. Today, it is home to various international organizations, governmental organizations and private enterprises, occupying a central role in travel, information, entertainment and international business. It is the biggest city in Kyushu and is one of Japan’s eight largest cities. It includes 7 wards (ku): Chuo-ku, Hakata-ku, Higashi-ku, Jonan-ku, Minami-ku, Nishi-ku and Sawara-ku (Figure 1). Fukuoka City was ranked 10th of the world’s most livable cities in 2014, ranked 12th in 2015, 7th in 2016 and 14th in 2017, in the Monocle quality of life survey. From 2017, a bus rapid transit (BRT) service has been implemented in central areas of Fukuoka City. In addition, the city government has initiated other strategies such as improving pedestrian roads, bicycle networks and park-and-ride schemes to encourage people to walk and cycle, which further reduces transportation energy consumption and CO2 emission. Japan has no known oil, gas or coal deposits. All commercial fossil fuels are imported from international markets.
In recent decades, temperature rise has been observed in Fukuoka alongside increasing global warming. Also, carbon dioxide emissions are increasing compared with base year 1990. Therefore, an effort to reduce emission has become important. Travel energy consumption causes carbon emissions in the long run since the emissions are mainly caused by burning fossil fuels. Therefore, how to reduce the travel energy consumption is becoming more and more important not only in Fukuoka but all the cities that are undergoing a rapid urbanization and motorization process. For micro-level analysis in this research paper, we analyzed the entirety of Fukuoka via 108 zones (Figure 1). These zones were referred to in the PTS (Person Trip Survey) zone, which is based on the zoning of the Road Traffic Census held in 2005. However, all the PTS zones do not coincide with the Road Traffic Census. In addition, due to unavailability of the PTS zone’s boundary shape file, we traced the map in GIS (Geographic Information System (ArcGIS, 10.3.1, Esri Inc., Redlands, CA, USA) provided by Fukuoka City Government in which 2007 PTS zones were demarcated. Then, we developed a database for each zone using GIS for conducting our research. Basically, these zones are formed based on the elementary school districts to create local communities centered on local government councils. Therefore, individual zone information provides an image of local community and a foundation that can be helpful to undertake development activities in a community. As our research intends to analyze the relationships between urban form, travel behavior and energy consumption at a micro level, the zone-wise information is ideally suited for our research.
2.2. Research Data
This section describes the collection and simulation of the data to construct relevant variables for the research. An integrated dataset that includes urban form, travel behavior and travel energy consumption is vital for the purpose of this study. Each data set is explained below.
2.2.1. Urban form data
The 2007 Person Trip Survey (PTS) data is the latest available data in the case of Fukuoka City. Therefore, we collected urban form data also from 2007 to get the research results more reliable and accurate. This paper included five dimensions—“5Ds”—of urban form (see Section 1). The descriptive results of all urban form-related data is shown in Table 1.
D1 (Density)
The population density of each of the 108 zones was extracted by using a GIS shapefile collected from the Fukuoka City government. To calculate household density, first, we extracted residential areas of each zone and then divided them by the occupied area of the zone. The descriptive result in Table 1 shows that population density ranges from 2.20 to 8827.70 person per km2. The household density is found to range from 0.57 to 204.53 household per km2. This study defines D1 as the central tendency of population density and household density showing its mean value is 1517.35.
D2 (Diversity)
There are many ways to simulate Diversity (D2). However, we applied the widely used method to calculate the land use mix index (entropy) by using Equation (1) [15,30]. In this research, mainly 5 land use types (residential, commercial, industrial, utility facility and public open space) were included in accordance to the highest relevance for daily travel activities. The descriptive result in Table 1 shows that residential land use has the highest share (620,424.30) followed by utility facilities (163,001.74) and commercial land use (141,532.94). The entropy ranges from 0 to 1. The value of 0 represents single land use environment (homogeneity) whereas 1 represents the perfect even distribution of all 5 land uses within the area (heterogeneity). Higher value of land use mix index indicates a more balanced land use pattern.
where Pi = proportions of each of the land use types (in this research; Residential, commercial, industrial, utility facility and public open space) of the total land area; k = number of land use types (in this research; 5).
D3 (Design)
According to Ewing and Cervero [19], design characterizes how friendly the local environment is to non-motorized travel. Design includes street network characteristics such as average block size and connectivity; pedestrian and bicycle network factors (e.g., sidewalk coverage, pedestrian crossings); pedestrian and bicycle amenities (e.g., street trees, parking); and site design metrics such as building setbacks and placement of parking. However, in the case of Fukuoka City, there are no comprehensive databases that gauge the quality of walking environments, parking supplies, landscaping provisions and other detailed features. Therefore, following Ewing and Cervero [19] and Chatman [47] and Zhang [30], we calculated D3 in terms of road intersection. We were provided with the road shapefile with dual lines; however to calculate a number of intersections, we require center line of the road. Therefore, we produced the center line of the road network by using Cartography tools in GIS and then a number of road intersections (both 3-way and 4-way) were calculated using the Spatial Statistics tools in GIS. A road of 1.2 m was also included in the simulation of road intersections, considering travel by walking and cycling as well. It is found that a 3-way road intersection is 4 times more likely than a 4-way road intersection (Table 1). This study defines D3 as the central tendency of 3-way and 4-way road intersection showing its mean value is 225.32.
D4 (Destination Accessibility)
Destination accessibility measures ease of access to trip attractions where a number of jobs or shopping opportunities are available. Following Boarnet et al. [51] and Comendador et al. [52], we measured D4 in terms of the central business district (CBD). The CBD is the location with maximum employment density, the maximum number of trip ends and the maximum rent. With these characteristics, the existing location of Fukuoka City Hall is taken as the CBD for this research. In most of the research, the distance to the CBD is measured as the straight-line distance from the CBD, which does not provide a realistic value. Therefore, we measured the distance to the CBD (D4) from the centroid of each zone by using OD Cost Matrix Analysis in GIS, where the shortest distance is identified in the road map and the distance to the CBD is estimated. The result of the descriptive analysis in Table 1 shows that the distance to the CBD ranges from 0.54 to 33.28 km.
D5 (Distance to Transit)
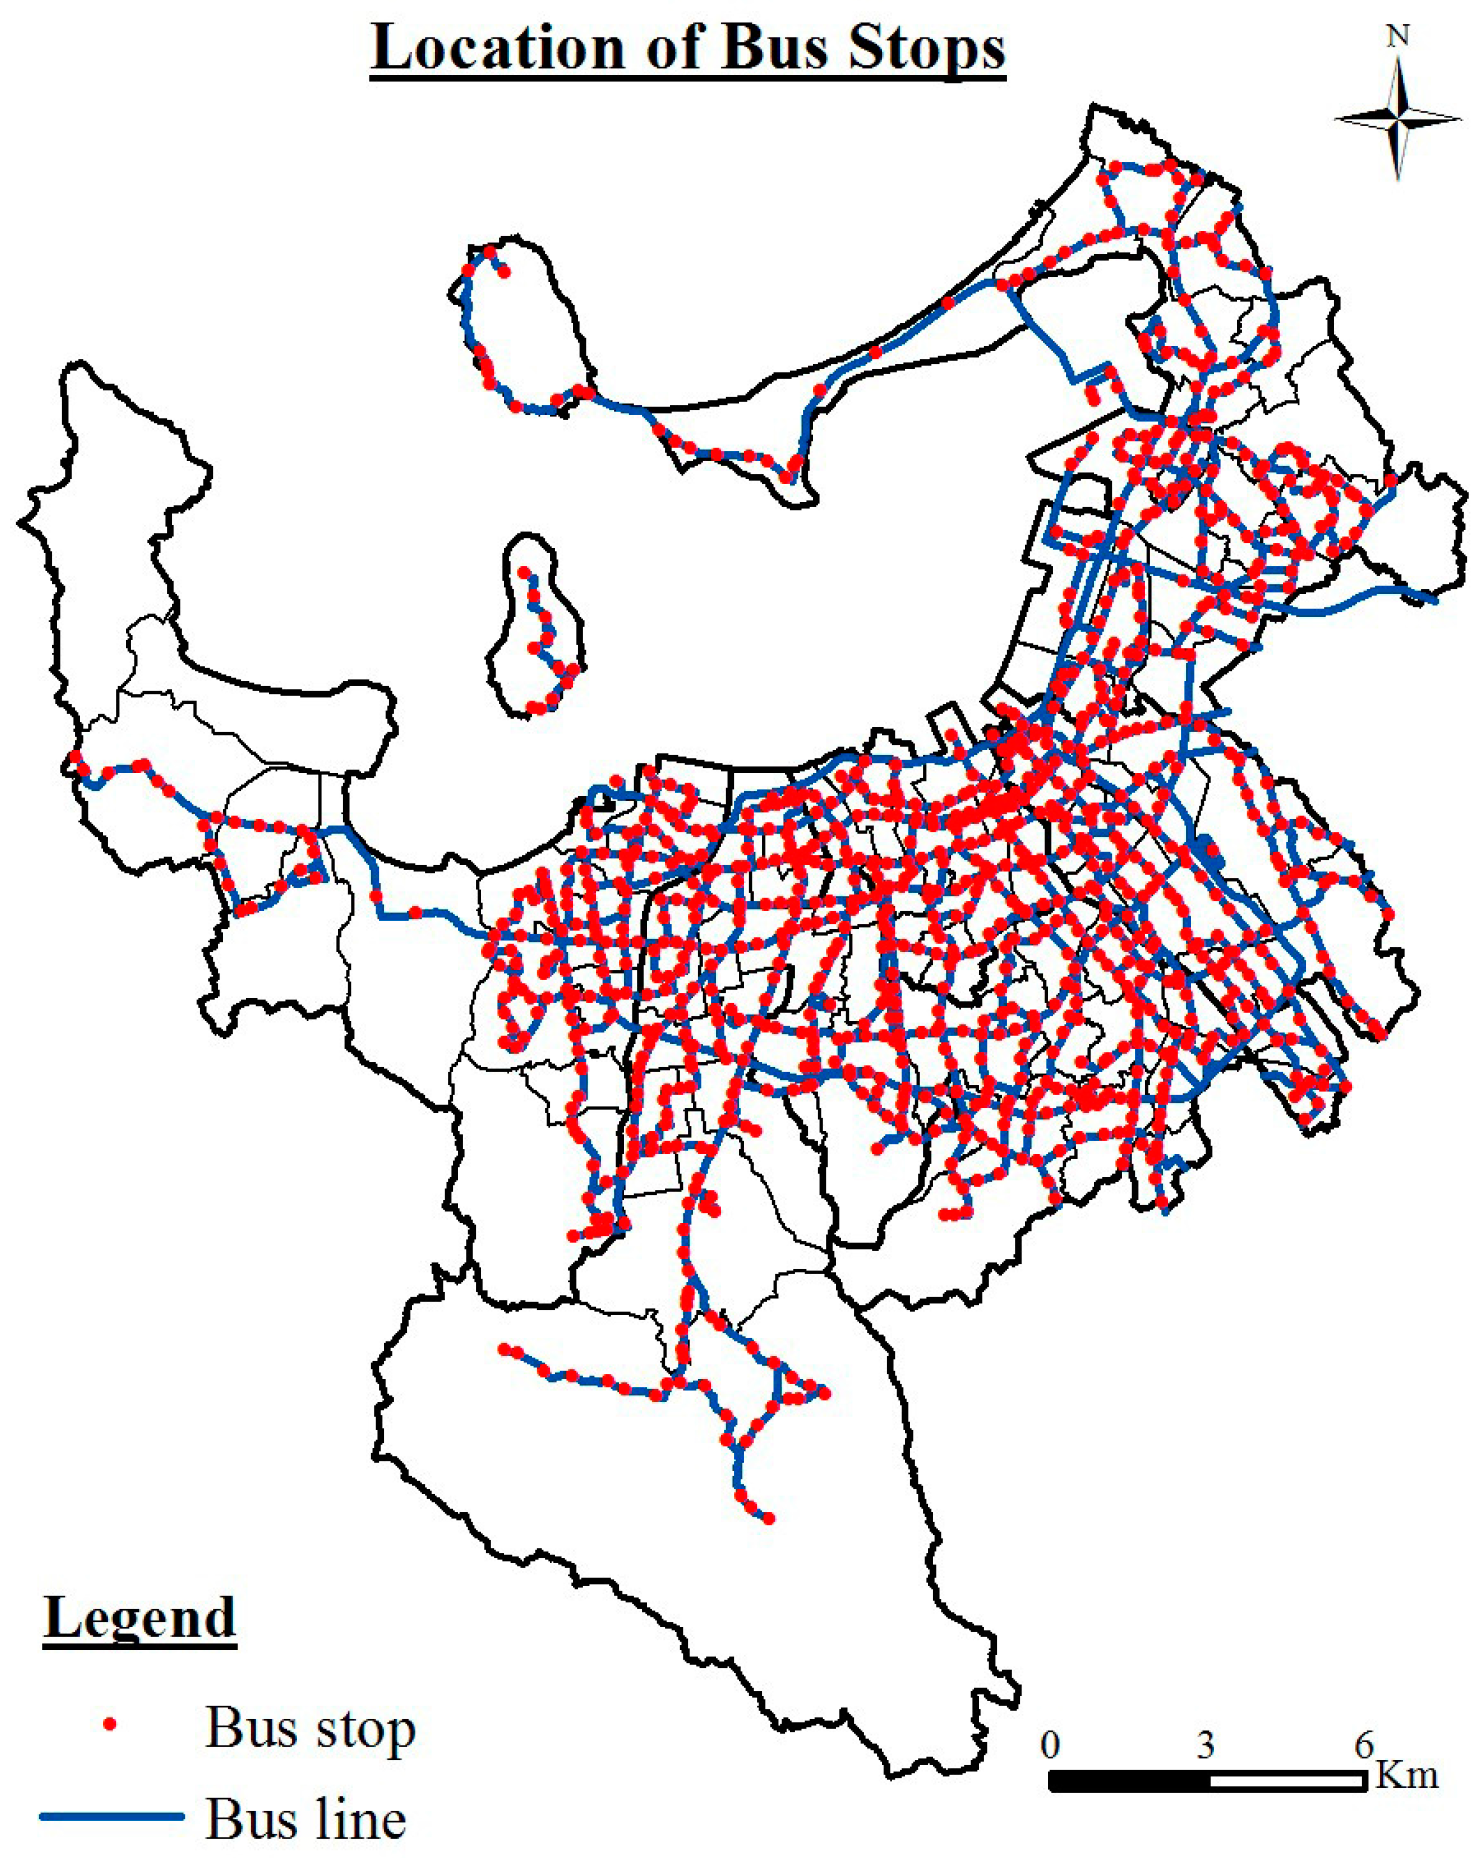
Distance to transit measures access to the nearest transit or transit stop. Some of the studies have used bus stop density [53], rail density [54], distance to nearest bus stop [25] and distance to nearest rail station [55]. In this study, D5 is estimated in terms of bus accessibility and rail accessibility as in the study by Lee et al. [43]. To measure bus accessibility, first, we calculated a number of bus stops in each zone by using Spatial Statistics tools in GIS. Then bus accessibility is defined as the total number of bus stops in a zone divided by its land area (Table 2). In Fukuoka City, three major bus companies operate: Nishitetsu, Showa and JR Kyushu. Nishitetsu Bus covers almost all of Fukuoka, while Showa Bus operates in the western region and JR Kyushu operates in the eastern region. Express buses are also available through Nishitetsu and JR Kyushu and they connect Fukuoka to other major cities within and outside Kyushu. However, the number of bus users has decreased due to the declining population and the bus lines have been abolished abruptly. As the population become more aged, it is expected that more people will find it difficult to drive, so it is necessary to secure alternative transportation modes in areas where bus routes are expected to be abolished.
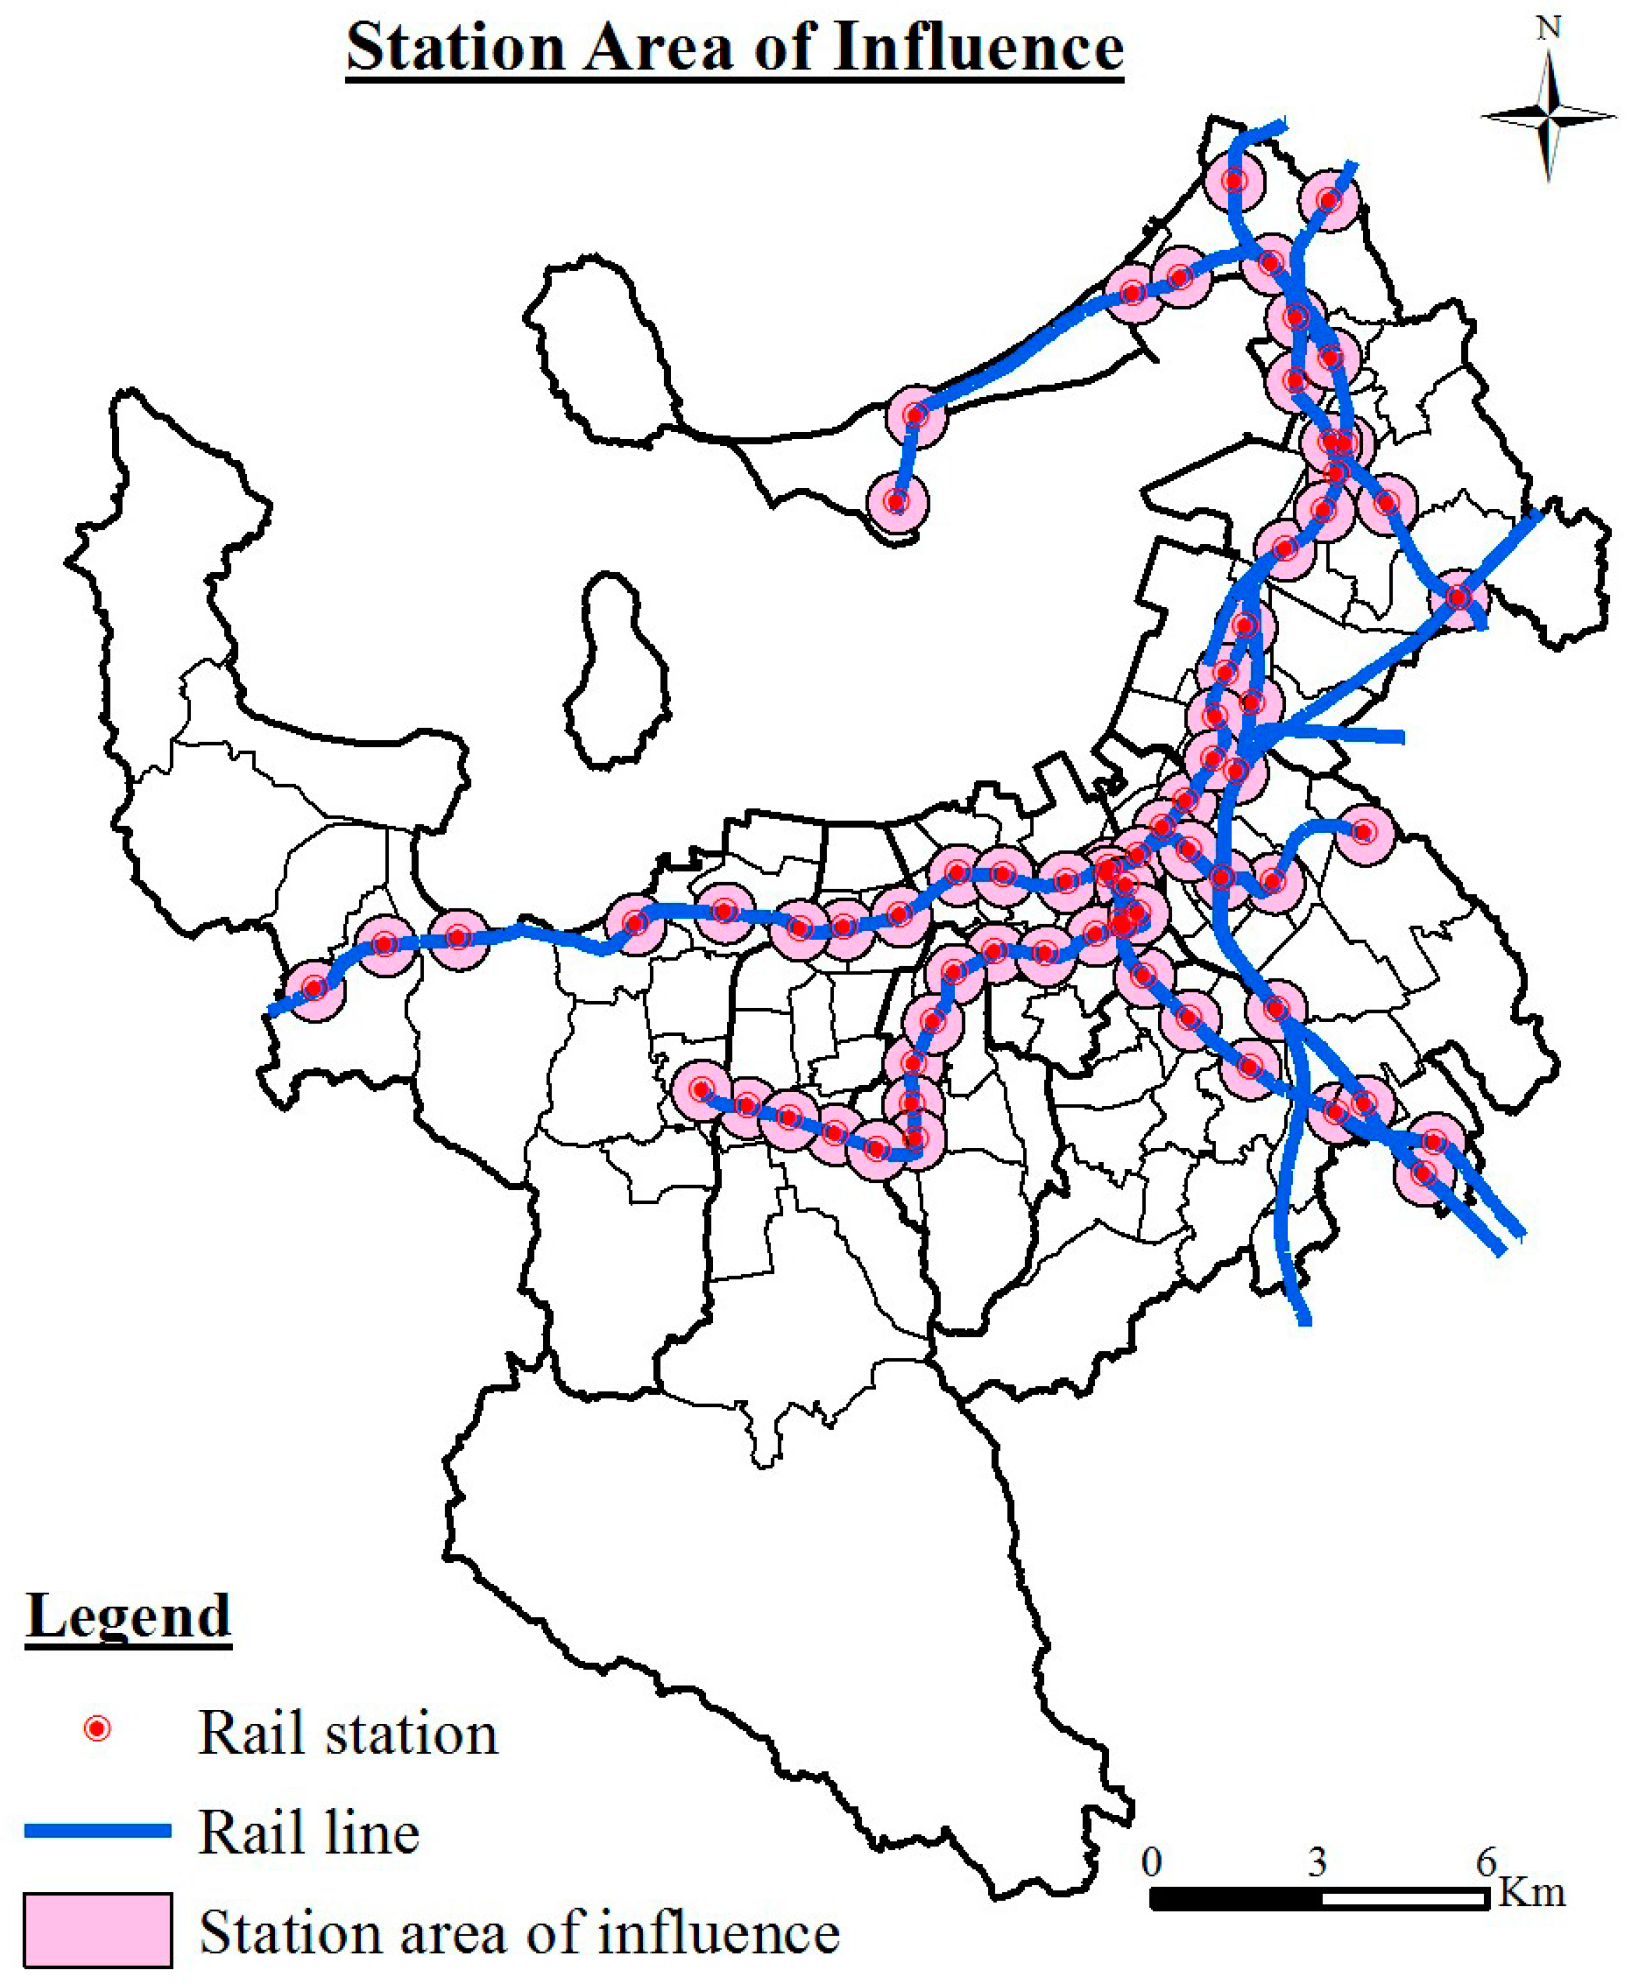
To estimate rail accessibility, first, we calculated a station area of influence equal to a circle with a radius of 0.55 km (avg. walking distance) whose center is a subway or rail station [43]. Then rail accessibility is estimated as the station area of influence in a zone divided by its total land area (Table 2). The subway system in Fukuoka has three lines. There are two railway companies: JR Kyushu and Nishitetsu. Nishitetsu operates several lines in Fukuoka Prefecture. JR Kyushu is one of the privatized companies of Japan National Railways which provides a network of railway lines to the whole of Kyushu. Construction and improvement of rail stations and bicycle parking lots have been carried out to facilitate efficient coordination between railway systems.
Figure 2 shows the location of bus stops and bus routes in Fukuoka City, whereas Figure 3 shows the rail stations, rail routes and station area of influence. The descriptive result (Table 1), Figure 2 and Figure 3 demonstrate that some zones do not have bus and rail facilities and also it reflects that rail accessibility is very low when compared to bus accessibility in Fukuoka City. D5 is defined as the central tendency of bus accessibility and rail accessibility, showing its mean value is 3.70.
2.2.2. Person Trip Survey (PTS) Master Data
This study utilizes micro data at the 4% level provided by the Fukuoka City Transportation Planning Section of the 2007 PTS data. In this research, we used PTS data from the 2007 survey, which is the latest survey data available for Fukuoka City. PTS is a person-based travel survey conducted every ten years by the Ministry of Land, Infrastructure and Transport (MLIT). Daily travel is collected using one-day trip diaries for all household members in selected households. This research covered 135,302 respondents in which the male population was found to be 63,298 and female population was 72,004. The minimum, mean and maximum age is 6, 42 and 91 years respectively. We considered all the age groups in this research as we analyze the influence of various travel purposes on different mode choices. For example, a 6-year-old child may go to school by walking, whereas a 42-year-old man may go to work by private car or rail due to the long distance. This study considered the travel that was generated only within Fukuoka City and the total travel trips included in this research was 3,451,683.
We included both walk and bicycle under non-motorized mode type. From the results of the descriptive analysis (Table 3), car is found to be the most highly used mode for travel in the sample with a mean of 20,328.07 and standard deviation of 9920.83, followed by non-motorized mode and rail. However, the minimum trip value for rail use is also 0 (Table 3), which meant in some zones, people do not use rail for travel at all. This is due to unavailability of rail stations in these zones. This result is supported by the descriptive result summary in Table 1. In the case of bus use, the minimum trip value is 52 (Table 3) whereas Table 1 shows that some zones do not have bus stops and so bus accessibility has a minimum value of 0. This highlights that people use bus as a travel mode even if the trip origin has no bus accessibility. Likely they must walk or cycle or park and ride to use the bus. Among other travel modes, motorcycle use was found to be very low (Table 3). This is likely due to the higher aging population in Fukuoka City. In the case of travel purpose, private trip had a mean value of 10,960.44 and standard deviation of 9492.27, showing that people travel most for private purposes, followed by work and business (Table 3). Furthermore, number of work trips and business trips are almost the same, which indicates that Fukuoka City is a hub to various organizations, private enterprises, local and international businesses.
2.2.3. Travel Energy Consumption Estimates
Travel energy consumption of one day by an individual in each zone was estimated using Equation (2) as defined in the study by Jiang et al. [27]. We summed up each motorized mode (motorcycle, car, bus and rail) for each purpose (work, study, business and private) and multiplied by distance traveled for that purpose and energy intensity for that mode type (Table 4). The difference to the study by Jiang et al. [27] is that they calculated the mode’s energy intensity using the vehicle’s fuel economy and the fuel energy content factor. However, in Japan, the integration of energy intensity and trip length is generally used [56] to estimate transportation energy consumption. We also collected the energy intensity data from 2007 to make the research result more consistent (Table 4). The travel distance is the shortest travel distance calculated by using OD Cost Matrix Analysis in GIS. The average travel distance is 1274.70 km with the standard deviation of 469.62. The estimated total travel energy consumption per zone ranges from 21,049.16 to 921,277.26 MJ/person/day.
where, EC = Total Travel Energy consumption (MJ/person/day); n = Total number of travel mode; j = Travel mode type {Motorcycle, Car, Bus, Rail}; m = Total number of travel purpose; i = Travel purpose {Work, School, Business, Private}; Tij = Travel for purpose ‘i’ by mode ‘j’; Di = Travel Distance for travel purpose ‘i’ (km); EIj = Energy Intensity factor for travel mode ‘j’ (MJ/person/km).
2.3. Database Construction and Analysis Method
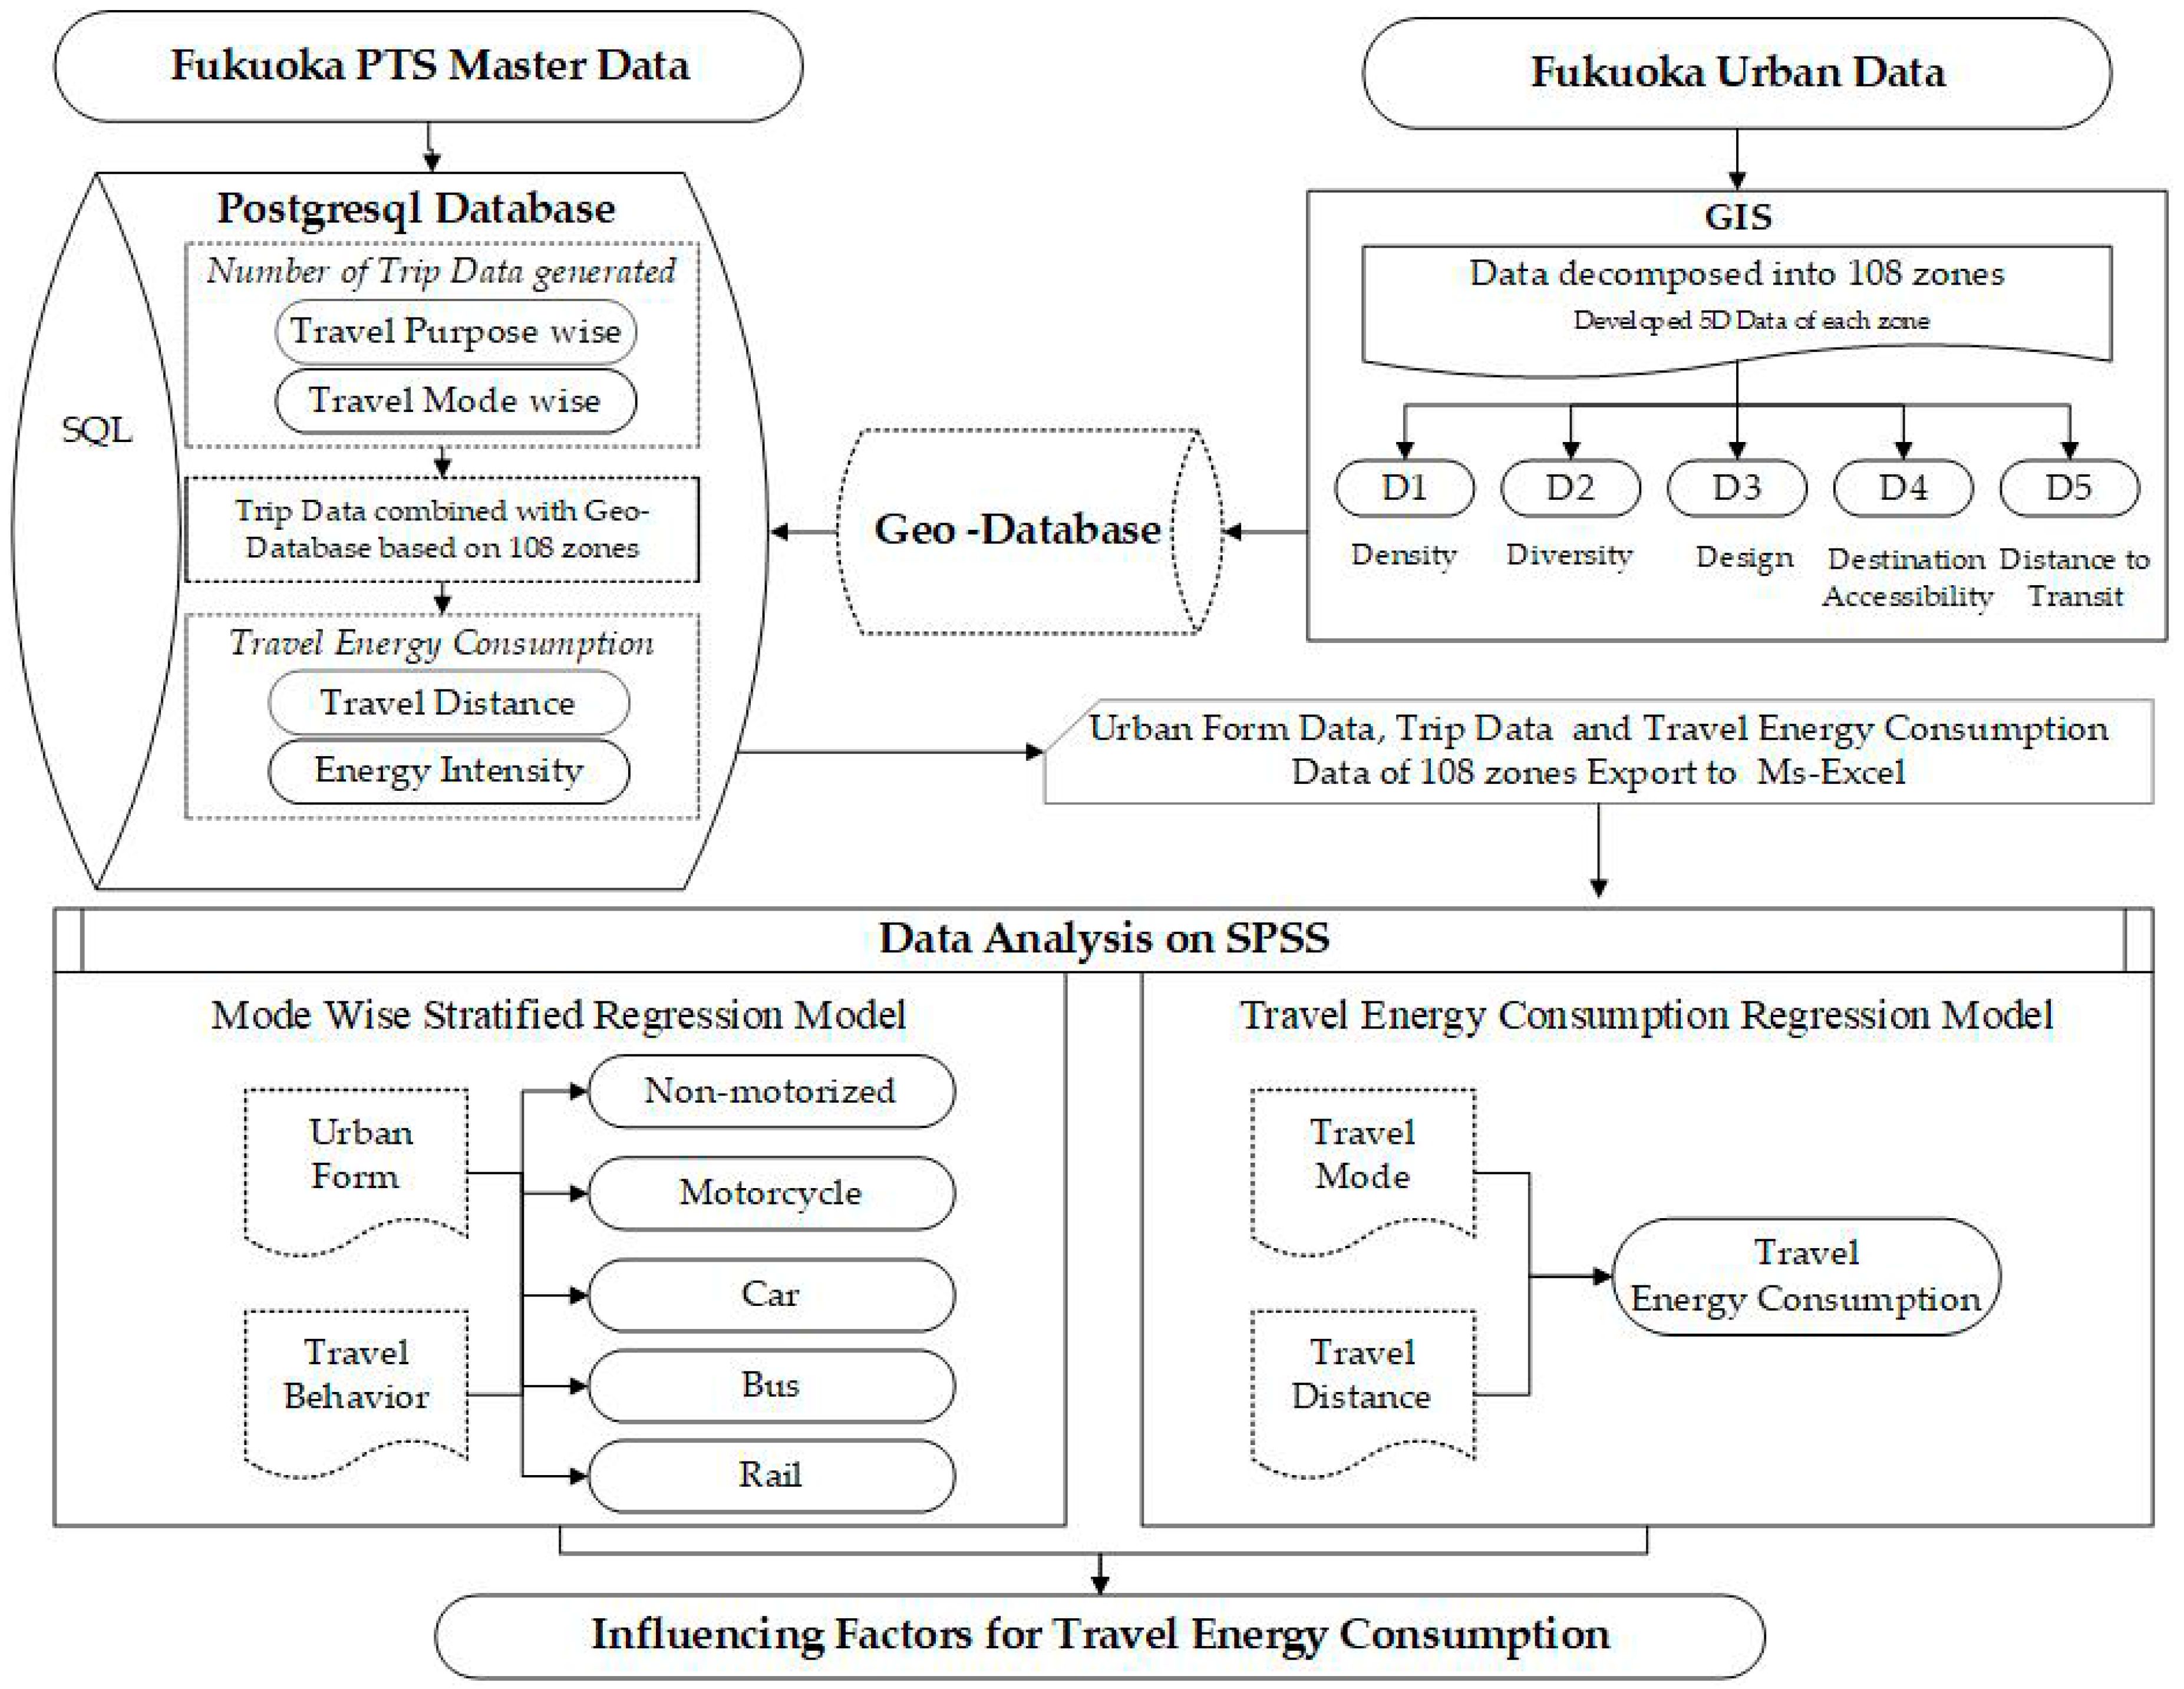
After collecting and simulating the required data (see Section 2.2), we constructed the database including urban form, travel behavior and travel energy consumption for each of the 108 zone (Figure 1) for analysis purposes (Figure 4). To create the geo-database including all the 5Ds of each of the 108 zones, we collected various variables of urban form (D1 density, D2 diversity, D3 design, D4 destination accessibility and D5 distance to transit) and processed it in GIS. The created geo-database was utilized to get an overview of the data and management of the data. The database was then inserted into the Postgresql database, version 9.3; to combine with PTS master data (Figure 4). The PTS master data was inserted into the same Postgresql database in which urban data (5Ds) of 108 zones were presented. The number of trips (travel purpose wise and travel mode wise) was calculated by using SQL (Structural Query Language). Then, trip data was combined based on 108 zones (Figure 4). Using this trip data of 108 zones and additional variables of travel distance and energy intensity factor for travel mode, travel energy consumption of each of the 108 zones was estimated.
The constructed information of each of the 108 zone (urban form, travel behavior and travel energy consumption) was exported to MS-Excel in order to make it importable in SPSS and further to apply the Multiple Linear Regression Model (MLRM) analysis. The data analysis was conducted by using the statistical software package SPSS 23.0.
In this research, two separate MLRMs were performed. In the first phase of MLRM, urban form variables (D1 density, D2 diversity, D3 design, D4 destination accessibility and D5 distance to transit) and trip behavior variables (trip for work, school, business, private) were chosen as independent variables where travel mode choice is used as a dependent variable. In the second phase of MLRM for energy consumption, the independent variables consist of mode choice for travel (non-motorized, motorcycle, car, bus and rail) and travel distance. The dependent variable is total travel energy consumption. Variable selection is carried out on the basis of literature review and a good understanding of travel behavior so as to develop a regression model that is robust and to explain dependent variables y.
Multiple Linear Regression Model (MLRM) Analysis was applied as an analysis method since it is widely recognized and the most popular model to analyze when many factors may have relationships with dependent variables. In this research, the dependent variables y (mode choice for mode-wise stratified model (Table 5) and travel energy consumption for regression model of travel energy consumption (Table 6) involve the effect of a very large number of factors (independent variables xi).
In the MLRM, the dependent variable is described as a linear function of the independent variables xi, as follows:
where, y = Dependent variable; xi = Independent variable (i = 1, 2, … n); β0 = Constant (y-intersect); βi = Regression coefficient of the variable xi (i = 1, 2, …, n); = Error.
The slope β of the regression line is called the regression coefficient. It provides a measure of the contribution of the independent variable x towards explaining the dependent variable y. The coefficient of determination R2 (Table 5, Table 6) is a measure of how well the regression model describes the observed data. The general rule of thumb is that the number of samples or observations should be at least 20 times greater than the number of variables under study. So this study satisfies the rule of thumb.
We checked the models of both mode-wise stratified and travel energy consumption for possible multicollinearity between the independent variables using VIFs (variance inflation factor) and found that it was not a problem as VIFs < 10 [58] and also Tolerance > 0.2 [59] is satisfactory. However, for work trips, tolerance was found to be 0.152, which is nearly 0.2 if we consider a round figure. Therefore, we decided not to exclude this variable from the model. The tested result is shown in Table 7.
3. Results
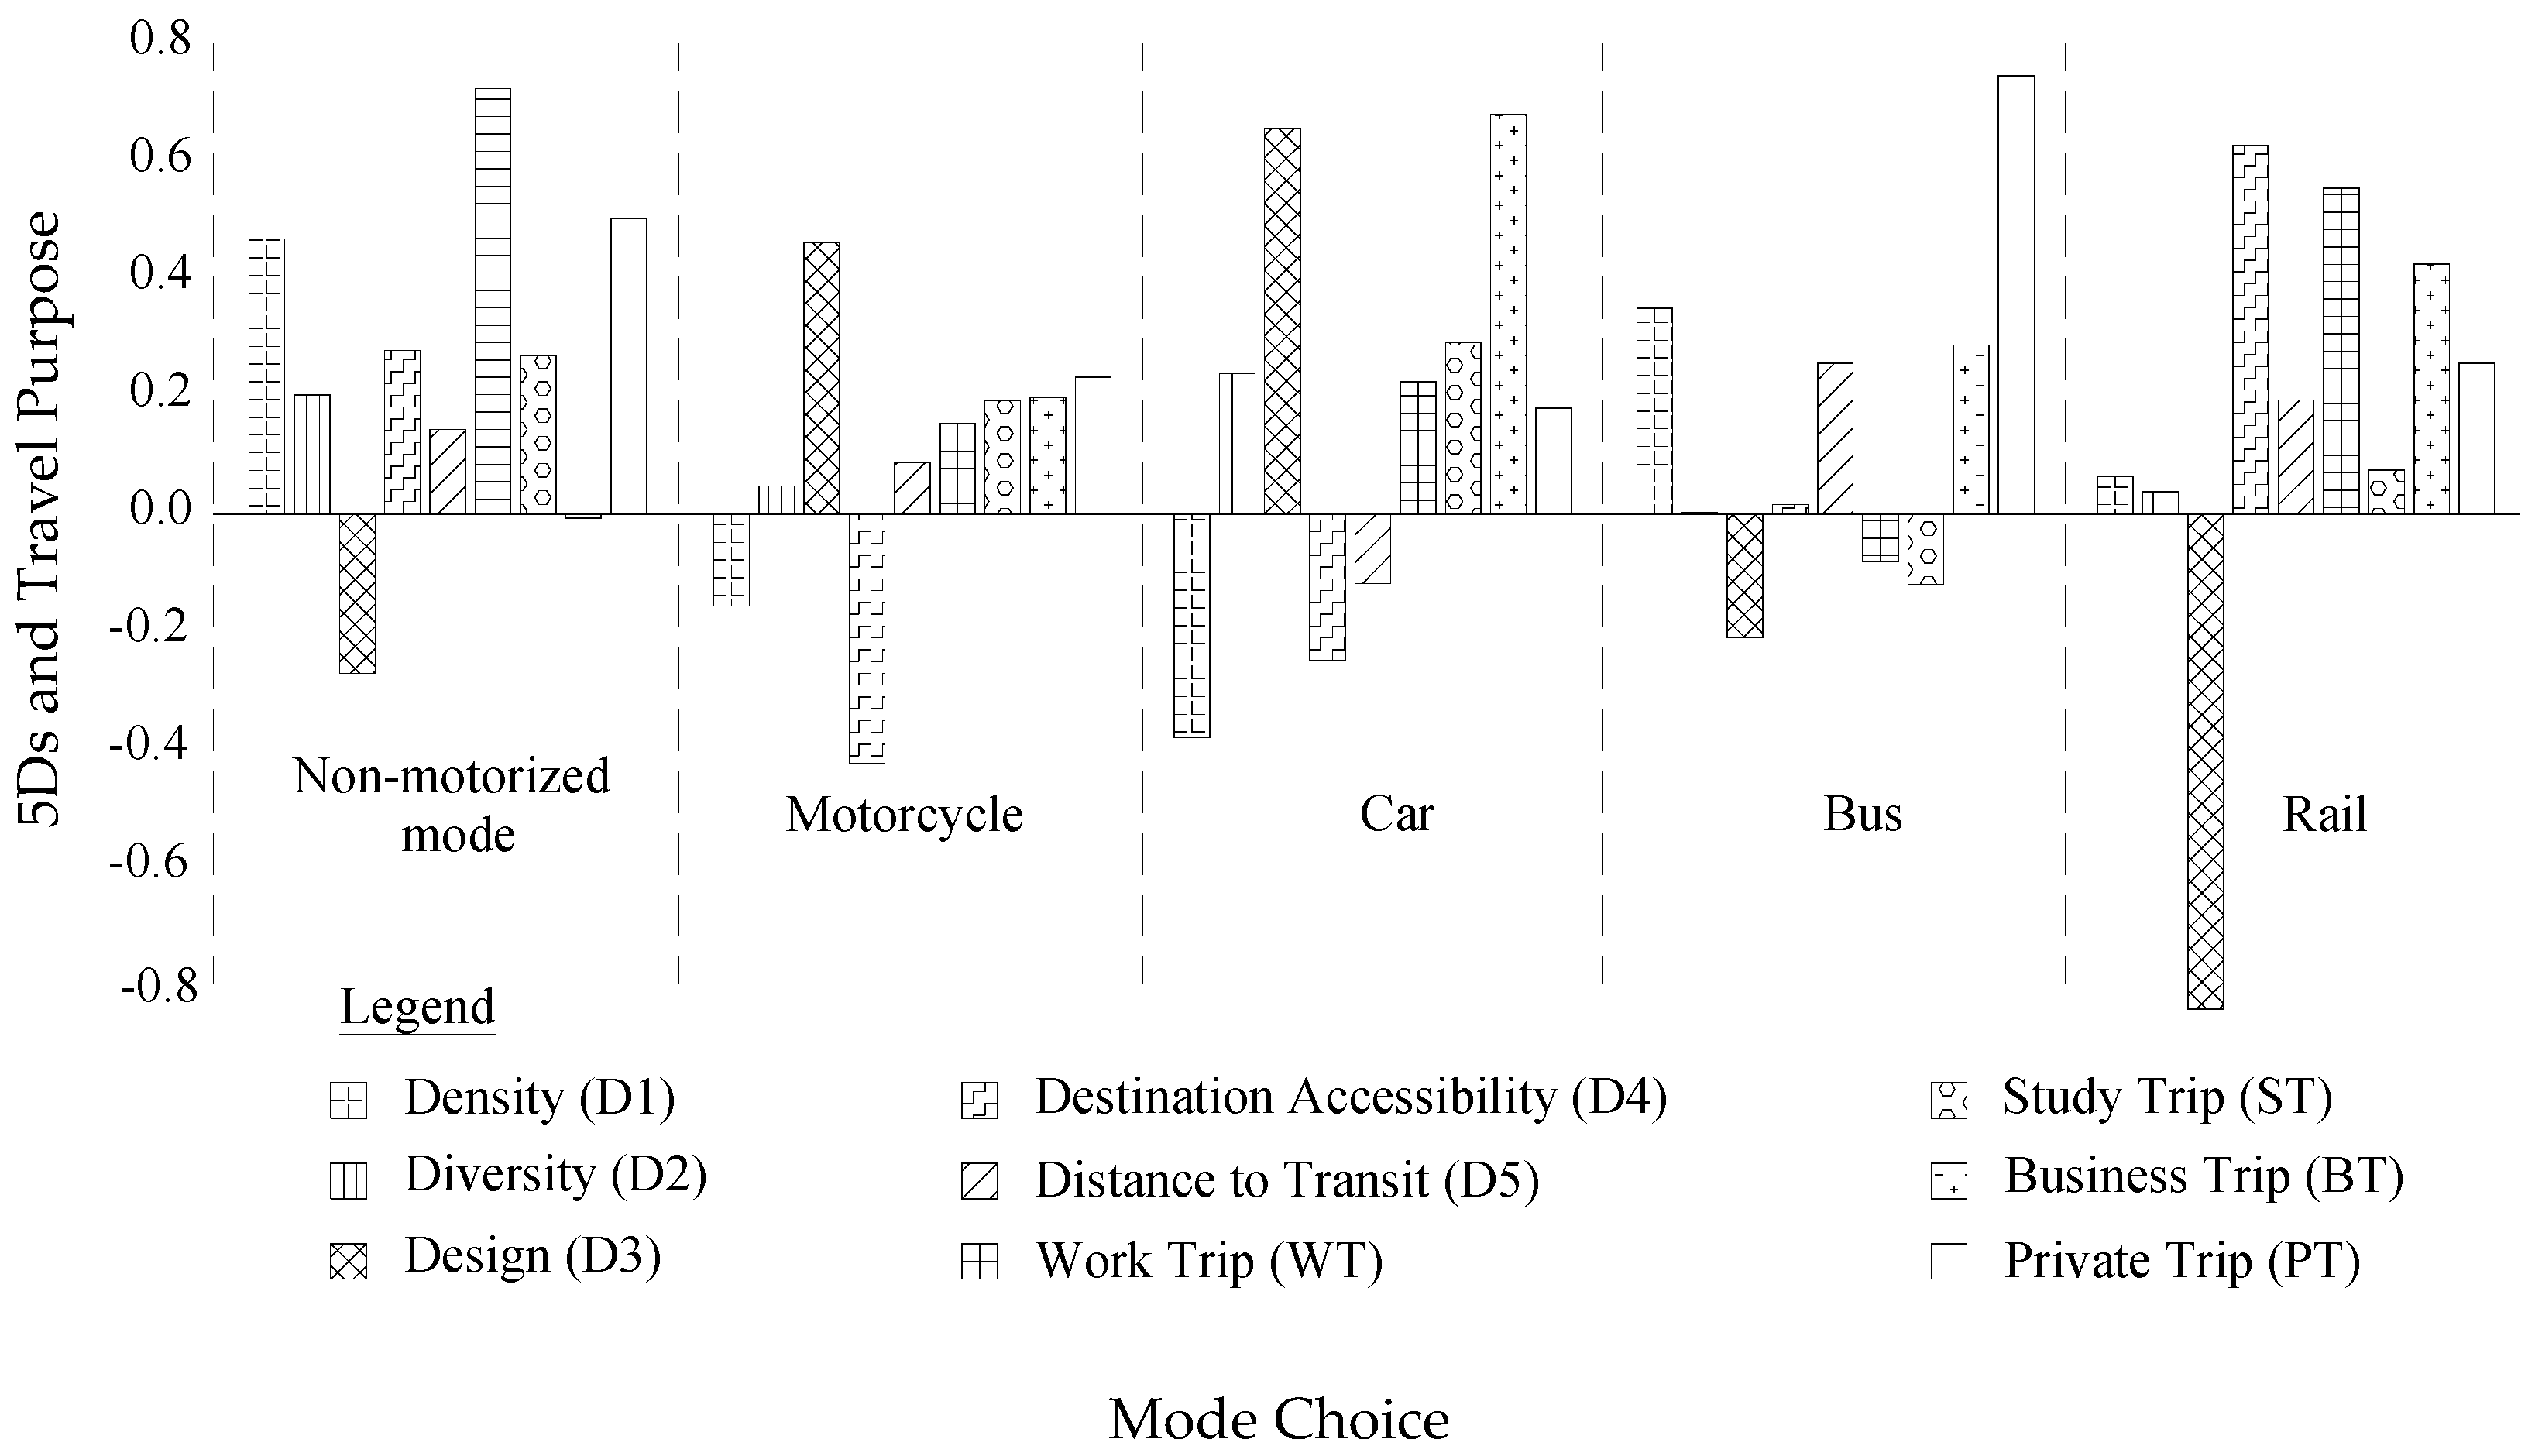
In this section, the summary of mode-wise regression analysis based on independent variables of urban form and controlling factor of travel variables are described. The results of the mode-wise stratified models by Multiple Linear Regression Models are shown in Table 5. Among the models, the model for non-motorized mode showed a better model fit with 90% variance (R2 = 0.901, p-value < 0.000). All the models showed variation above 60%, which indicates a good model for each dependent variable. Here, we summarized only the significant association (p < 0.001, p < 0.05) of independent variables with mode choice.
The non-motorized regression model showed that density (D1) indicated significant positive association with non-motorized mode (p = 0.000). Design (D3), as measured by road intersection, is inversely predictive of non-motorized mode (p = 0.035). Destination accessibility (D4) is positively associated (p = 0.05). Among travel variables, work trip (WT), study trip (ST) and private trip (PT) are positively significant on non-motorized mode choice (p = 0.000), whereas business trip (BT) is inversely associated but has very low significance.
The regression result for motorcycle was 62% (R2 = 0.618, p-value < 0.000). Among urban form variables, design (D3) and destination accessibility (D4) are significant for motorcycle use (p < 0.05). All the travel variables are positively associated with motorcycle use. However, only study trip (ST) and business trip (BT) are significant (p < 0.05).
The regression results for car showed 83% (R2 = 0.833, p-value < 0.000). Density (D1) and design (D3) are significant (p = 0.05 for D1 and p = 0.000 for D3) for car use. Similar to motorcycle use, all the travel variables are positively associated with car use but significant only for study trip (ST) and business trip (BT) (p < 0.05).
The regression result for bus was 67% (R2 = 0.666, p-value < 0.000). Only Density (D1) showed a significant effect (p ≤ 0.05) on bus use among the urban form variables. Among travel variables, business trip (BT) and private trip (PT) are positively significant (p = 0.004 for BT and p = 0.000 for PT) on bus use.
The regression result for rail was 61% of (R2 = 0.612, p-value < 0.000). Design (D3) showed significant inverse association with rail (p = 0.000). Similarly, the positively significant relation (p < 0.05) between destination accessibility (D4), which indicates that rail use is increased, as increase in distance from CBD. For rail use, all the trip purposes showed positive association with rail use but only work trip (WT) and business trip (BT) are significant (p = 0.020 for WT and p = 0.000 for BT).
The regression model for travel energy consumption was 84% variance (R2 = 0.835, p-value < 0.000) as shown in Table 6. This indicates a good model fit where car use and travel distance (TD) are positively significant (p = 0.000) with increase in travel energy consumption. However, non-motorized mode showed a significant inverse association (p = 0.012) with travel energy consumption.
4. Discussion
The model results of travel energy consumption indicate that private mode (motorcycle and car) and travel distance are major factors for increasing energy consumption (Table 6, Figure 5 and Figure 6). This result is well known and seems obvious. However, our research also highlights the influencing factors of travel energy consumption by analyzing the factors that affect mode choice (Figure 6). The model results indicate that the effect of public mode (bus and rail) on energy consumption is very low compared to private mode (Table 6), though it is worth highlighting the factors that affect bus and rail use since non-motorized mode is not feasible for long-distance travel Therefore, public mode is a better alternative to private mode when considering reduction of energy consumption.
Diversity (D3) is found to be the key factor for increasing private mode use and subsequently increasing energy consumption. More road intersections provide greater road connectivity and more routing options, which, in turn, attract people to use private mode for their convenience. This result is consistent with the research result by Stevens [60] who found that designing streets to make them more walkable is not effective. Also, the research by Marshall and Garrick [61] showed that increasing major road intersection density increases the amount of driving by approximately 1.3 km (0.8 miles) per person per day. However, this result is in contrast to that of Ewing and Cervero [19], who found that D3 had the largest influence on public mode use due to more routing options and short access distances. Therefore, this result highlights that road connectivity is not quite enough to encourage people to use public mode, but need to provide adequate numbers of bus stops and rail stations simultaneously at walking distances along extended routes.
The effect of density (D1) is negative for both car use and motorcycle use as expected: low density areas have a higher probability of using private modes. D1 was the key factor for promoting non-motorized mode. The result suggests that people tend to walk or use a bicycle in dense and higher land use mix areas (D2). High mixed land use areas create shorter distances that contribute to non-motorized mode. However, D2 does not show any supporting role for reducing private mode use. This suggests that whether or not there is a balance of residential, commercial, industrial, utility facilities and public open space, it is irrelevant for people’s choice of using private mode. This is likely due to people not necessarily being employed or doing the shopping in the same area where they live. Therefore, mixed land use planning is not an effective strategy for reducing private mode use and therefore is irrelevant to travel energy consumption.
As for destination accessibility (D4), the shorter the distance to the CBD, the more use of private mode increased. This meant that private mode use is increased in and near the CBD areas. Conventional wisdom holds that as a distance to the CBD increased, travel distance by car increased. This does not appear to be the case once other variables are controlled.
This result showed that poor transit accessibility (D5) encourages people to drive a car. This is consistent with our intuition that unavailability of bus stops and rail stops at walking distance is likely to encourage use of private mode. D5 is not found significant for non-motorized modes at the individual level. However, when controlling other predicators, it showed the expected and meaningful result. According to Ewing and Cervero [19], in the case of the public mode, it almost always requires a walk at one or both ends of the trip. According to research of Stevens [60], the influence of distance to transit by walking is statistically significant. This result suggests that increasing non-motorized mode use is possible even in the areas further away from the CBD if it has higher density, higher land use mix, and better accessibility to transit. Also, the positive relationship between D5 and public mode use was consistent with the research findings of Ewing and Cervero [19], who found that public mode was the most sensitive mode to the distance to the nearest transit stop. Due to the very meaningful sign associated with D5 in Table 5, results of this research highlight that D5 is the factor that influences all mode choices; non-motorized mode, private mode and public mode.
This study suggests that to promote public mode, it is better to understand the influencing factors of individual public modes so as to make effective countermeasures accordingly. In this study, D1 and D5 are found to be influencing factors for bus use whereas D3 and D4 showed significant effect on rail use. However, most of the studies have combined bus and rail, under a single category: public mode [30].
Among the travel variables, business trip (BT) showed significant positive effect on both private mode and public mode. This means that higher BT increases the likelihood of driving a car and using public mode; however, the magnitude of the influence on bus and rail is significantly smaller than car. Also, the result showed that the car is used for shorter BT whereas public mode is used for longer BT. The reason for using car may be that BT does not follow the same routes every day. The salesman, for example, may be constrained by having to carry samples or by having to visit a number of destinations in a single day. Furthermore, in the case of using a car, it is more likely that the destination has poor transit accessibility. Use of motorcycle is almost same for all the purposes, which indicates that trip purpose does not have an effect on motorcycle use.
Increase in non-motorized mode is strongly related with increase in work trip (WT), study trip (ST) and private trip (PT). This is because of the concentration of various facilities in the dense and transit accessible areas. For reasons mentioned above, non-motorized mode is less used as BT increases.
It is found that people use bus more often for PT. Compared to rail, travel by bus takes more time possibly due to many stop points. Time is not a prime consideration in PT, because people travel for private purposes such as leisure activities when they have free time. This result is consistent with [62], who concludes that shopping and associated activities are linked closely to the use of public transportation. However, increase in rail use is found for WT, indicating that people living further away from CBD use rail to travel a longer distance for work purposes. In summary, trip purposes significantly influence travelers’ mode choice behavior towards public mode. This indicated that interventional policy should be developed with respect to different trip purposes.
5. Conclusions
The rapid urbanizing and motorizing in Fukuoka indicate that travel energy consumption increases rapidly. The growing energy use of urban transport not only increases energy insecurity but also increases environmental pollution and negatively affects public health. Therefore, how to reduce travel energy consumption is becoming an increasingly important question in Fukuoka and also other cities that experience rapid urbanization and motorization. To identify the influencing factors for travel energy consumption, first, it is necessary to understand the interrelationship between urban form, travel behavior and energy consumption. Although past literature has extensively investigated the relationship between urban form and travel energy consumption, the result was less conclusive as the variables of urban form used for analysis were limited. This study included the urban form variables defined by the mostly widely used “5Ds” framework. These are Density (D1), Design (D2), Diversity (D3), Destination accessibility (D4) and Distance to transit (D5). A number of studies have analyzed the relationship between urban form and mode choice, but using travel purpose as a controlling variable is rare. This study attempts to analyze in a holistic manner, purely with the respect to travel behavior.
This study provided additional insights into the relationships between urban form, mode choice and travel energy consumption by applying the multiple linear regression model based on the 108 zones of Fukuoka City, Japan. The importance of urban planning as a tool to reduce travel energy consumption has been underestimated, possibly because the disciplines of urban planning and travel behavior are traditionally considered as separate issues; and also because of challenges in analysis due to the complex interrelationships between urban form, travel behavior and travel energy consumption. This study dealt with these methodological challenges for modeling and analyzing the complex relationships between urban form (measured by 5Ds framework), travel purpose, mode choice, travel distance and energy consumption. In the first phase, we developed mode-wise stratified regression model and in the second phase, we developed a regression model of travel energy consumption. This paper analyzed the influencing factors of travel energy consumption, presented quantitative measures for travel energy consumption control in urban areas and also, provided theoretical support. This result is supportive for prediction of travel energy consumption in the case of Fukuoka city and also can be used as a reference for further research on how to reduce travel energy consumption via urban planning.
The study results find that 5Ds affect mode choice and travel energy consumption differently. Density (D1) influences non-motorized mode. The highest influencing factor for the increasing private mode was design (D3). The increase in road intersections provides better connectivity but the lack of bus stops and rail stations at a walking distance might stop people from using public mode and as a result, they tend to use private mode. Therefore, this study highlights that provision of bus stops and rail stations are essential with the increase in road connectivity to promote public mode, reduce private mode use and consequently reduce travel energy consumption. From a policy standpoint, the choice to promote an increase in transit stops might actually have no effect on transit use until and unless a density threshold is met, at which point it becomes necessary to provide transit service in the area.
In addition, the result indicates that the zones with low D1 and poor accessibility to public mode (D5) are found likely to increase car use. The findings suggest that even with long travel distance (TD), reduction of private car and promotion of public mode is observable if transit accessibility is better. The result showed that public mode use is higher as the CBD becomes further away, whereas private mode is highly used in the areas closer to the CBD. Therefore, policy strategies (e.g., parking charge, CBD entry tax) that aim at reducing private mode and travel energy consumption need to focus mainly in and around CBD areas. The findings show that mixing of land uses (D2) is not effective in reducing private mode use and on travel energy consumption. The findings of this study may have important implications for policymakers and urban and transport planners to make effective countermeasures for reducing private mode use and travel energy consumption.
It should be noted that this study has several limitations. One limitation is that this study uses objective measures of the urban form. Scholars have emphasized subjective measures such as perceptions of street environment and a person’s residential self-selection also have direct effects on travel behavior. Therefore, both objective and subjective measures should be included in future research.
Acknowledgments
This research is supported by the Japanese Government MEXT Scholarship under SGU framework (176595). We like to thank the Fukuoka City Office for providing Person trip survey (PTS) master data and urban data. Also, special thanks to Rabindra Maharjan (Software engineer) for assisting in Postgresql database.
Author Contributions
Sarita Maharjan came up with the original idea for this article; Sarita Maharjan and Naoki Tsurusaki collected data; Sarita Maharjan designed the research framework, performed Regression analysis and wrote the paper; Naoki Tsurusaki and Prasanna Divigalpitiya provided guidance, comments and key suggestions to polish the article. All authors read and approved the final version.
Conflicts of Interest
We declare that we have no conflict of interest.
References
- Yang, J.; French, S. The travel-obesity connection: Discerning the impacts of commuting trips with the perspective of individual energy expenditure and time use. Environ. Plan. B 2013, 40, 617–629. [Google Scholar] [CrossRef]
- United States Environmental Protection Agency (EPA). Available online: https://www.epa.gov/ghgemissions/sources-greenhouse-gas-emissions#transportation (accessed on 3 November 2017).
- Romanos, M.; Prastacos, P.; Hatmaker, M. Transportation Energy Effect on Urban Growth: Results of Simulations. Transp. Res. Rec. 1974, 480, 60–70. [Google Scholar]
- Cervero, R.; Murakami, J. Effects of Built Environments on Vehicle Miles Traveled: Evidence from 370 US Urbanized Areas. Environ. Plan. A 2010, 42, 400–418. [Google Scholar] [CrossRef]
- Ewing, R.; Bartholomew, K.; Winkelman, S.; Walters, J.; Chen, D. Growing Cooler: The Evidence on Urban Development and Climate Change; Urban Land Institute: Washington, DC, USA, 2008; ISBN 978-0-87420-082-9. [Google Scholar]
- Litman, T. Efficient vehicles versus efficient transportation. Comparing transportation energy conservation strategies. Transp. Policy 2005, 12, 121–129. [Google Scholar] [CrossRef]
- Troy, A. The Very Hungry City: Urban Energy Efficiency and the Economic Fate of Cities; Yale University Press: New Haven, CT, USA; London, UK, 2012; ISBN 978-0-300-19835-5. [Google Scholar]
- Walker, G. Energy, land use and renewables: A changing agenda. Land Use Policy 1995, 12, 3–6. [Google Scholar] [CrossRef]
- Hong, J.; Shen, Q.; Zhang, L. How do built environment factors affect travel behavior? A spatial analysis at different geographic scales. Transp. J. 2014, 41, 419–440. [Google Scholar] [CrossRef]
- Liu, C.; Shen, Q. An empirical analysis of the influence of urban form on household travel and energy consumption. Comput. Environ. Urban Syst. 2011, 35, 347–357. [Google Scholar] [CrossRef]
- Congress for the New Urbanism; Talen, E. Charter of the New Urbanism, 2nd ed.; McGraw-Hill Education: New York, NY, USA, 2013; ISBN 978-0071806077. [Google Scholar]
- Duncan, M.J.; Winkler, E.; Sugiyama, T.; Cerin, E.; duToit, L.; Leslie, E.; Owen, N. Relationships of Land Use Mix with Walking for Transport: Do Land Uses and Geographical Scale Matter? J. Urban Health Bull. N. Y. Acad. Med. 2010, 87, 782–795. [Google Scholar] [CrossRef] [PubMed]
- Duany, A.; Speck, J.; Lydon, M. The Smart Growth Manual, 1st ed.; McGraw-Hill Education: New York, NY, USA, 2009; ISBN 9780071376754. [Google Scholar]
- Crane, R. The influence of urban form on travel: An interpretive review. J. Plan. Lit. 2000, 15, 3–23. [Google Scholar] [CrossRef]
- Cervero, R.; Kockelman, K. Travel demand and the 3Ds: Density, Diversity and Design. Transp. Res. D 1997, 2, 199–219. [Google Scholar] [CrossRef]
- Newman, W.G.; Kenworthy, J.R. Gasoline consumption and cities. J. Am. Plan. Assoc. 1989, 55, 24–25. [Google Scholar] [CrossRef]
- Boarnet, M.G. A broader context for land use and travel behavior, and a research agenda. J. Am. Plan. Assoc. 2011, 77, 197–213. [Google Scholar] [CrossRef]
- Ewing, R.; Cervero, R. Travel and the built environment: A synthesis. Transp. Res. Rec. Transp. Res. Board 2001, 1780, 87–114. [Google Scholar] [CrossRef]
- Ewing, R.; Cervero, R. Travel and the built environment: A meta-analysis. J. Am. Plan. Assoc. 2010, 76, 265–294. [Google Scholar] [CrossRef]
- Banister, D.; Watson, S.; Wood, C. Sustainable Cities: Transport, Energy, and Urban Form. Environ. Plan. B Plan. Des. 1997, 24, 125–143. [Google Scholar] [CrossRef]
- Susilo, Y.O.; Stead, D. Urban form and the trends of transportation emissions and energy consumption of commuters in the Netherlands. In Proceedings of the 87th Annual Meeting of the Transportation Research Board, Washington, DC, USA, 13–17 January 2008. [Google Scholar]
- Brownstone, D.; Golob, T.F. The impact of residential density on vehicle usage and energy consumption. J. Urban Econ. 2009, 65, 91–98. [Google Scholar] [CrossRef]
- Van de Coevering, P.; Schwanen, T. Re-evaluating the Impact of Urban Form on Travel Patterns in Europe and North-America. Transp. Policy 2006, 13, 229–239. [Google Scholar] [CrossRef]
- Stead, D. Relationships between land use, socioeconomic factors, and travel patterns in Britain. Environ. Plan. B Plan. Des. 2001, 28, 499–528. [Google Scholar] [CrossRef]
- Kitamura, R.; Mokhtarian, P.L.; Laudet, L. A micro-analysis of land use and travel in five neighborhoods in the San Francisco Bay Area. Transp. J. 1997, 24, 125–158. [Google Scholar] [CrossRef]
- Wang, B.; Shao, C.; Ji, X. Influencing Mechanism Analysis of Holiday Activity-Travel Patterns on Transportation Energy Consumption and Emission in China. Energies 2017, 10, 897. [Google Scholar] [CrossRef]
- Jiang, Y.; Zegras, P.C.; He, D.; Mao, Q. Does energy follow form? The case of household travel in Jinan, China. Mitig. Adapt. Strateg. Glob. Chang. 2015, 20, 701–718. [Google Scholar] [CrossRef]
- Naess, P. Residential location, Travel, and Energy Use: In the Hangzhou metropolitan area. J. Transp. Land Use 2010, 3, 27–59. [Google Scholar] [CrossRef]
- Holden, E.; Norland, I.T. Three challenges for the compact city as a sustainable urban form: Household consumption of energy and transport in eight residential areas in the greater Oslo region. Urban Stud. 2005, 42, 2145–2166. [Google Scholar] [CrossRef]
- Zhang, M. The Role of Land Use in Travel Mode Choice: Evidence from Boston and Hong Kong. J. Am. Plan. Assoc. 2004, 70, 344–360. [Google Scholar] [CrossRef]
- Handy, S.; Boarnet, M.; Ewing, R.; Killingsworth, R. How the built environment affects physical activities: Views from urban planning. Am. J. Prev. Med. 2002, 23, 64–73. [Google Scholar] [CrossRef]
- Badoe, D.A.; Miller, E.J. Transportation-Land-use Interaction: Empirical Findings in North America, and their Implications for Modeling. Transp. Res. Part D Transp. Environ. 2000, 5, 235–263. [Google Scholar] [CrossRef]
- Handy, S. Methodologies for Exploring the Link between Urban Form and Travel Behavior. Transp. Res. Part D Transp. Environ. 1996, 1, 151–165. [Google Scholar] [CrossRef]
- Cervero, R. Transit-based housing in California: Evidence on ridership impacts. Transp. Policy 1994, 1, 174–183. [Google Scholar] [CrossRef]
- Bhat, C.R.; Singh, S.K. A Comprehensive Daily Activity-Travel Generation Model System for Workers. Transp. Res. A 2000, 34, 1–22. [Google Scholar] [CrossRef]
- Dunphy, R.T.; Fisher, K. Transportation, Congestion, and Density: New Insights. Transp. Res. Rec. J. Transp. Res. Board 1996, 89–96. [Google Scholar] [CrossRef]
- Bhat, C.R.; Pozsgay, M.A. Destination Choice Modeling for Home-Based Recreational Trips: Analysis and Implications for Land-use, Transportation, and Air Quality Planning. Transp. Res. Rec. 2002, 1777, 7–54. [Google Scholar]
- Bhat, C.R.; Zhao, H. The Spatial Analysis of Activity Stop Generation. Transp. Res. B 2002, 36, 593–616. [Google Scholar] [CrossRef]
- Frank, L.; Pivo, G. Impacts of Mixed Use and Density on Utilization of Three Modes of Travel: Single-occupant Vehicle, Transit, and Walking. Transp. Res. Rec. 1994, 1466, 44–52. [Google Scholar]
- Kitamura, R.; Akiyama, T.; Yamamoto, T.; Golob, T. Accessibility in a metropolis: Toward a better understanding of land use and travel. Transp. Res. Rec. 2001, 1780, 64–75. [Google Scholar] [CrossRef]
- Banister, D. Viewpoint: Assessing the reality-Transport and land use planning to achieve sustainability. J. Transp. Land Use 2012, 5, 1–14. [Google Scholar] [CrossRef]
- Handy, S.; Cao, X.; Mokhtarian, P. Correlation or causality between the built environment and travel behavior? Evidence from Northern California. Transp. Res. Part D 2005, 10, 427–444. [Google Scholar] [CrossRef]
- Lee, G.; Jeong, Y.; Kim, S. Impact of individual traits, urban form, and urban character on selecting cars as transportation mode using the hierarchical generalized linear model. J. Asian Archit. Build. 2016, 15, 223–230. [Google Scholar] [CrossRef]
- Lee, J.; Jin, N.; Lee, S. Built Environment impacts on Individual Mode Choice: An Empirical Study of the Houston-Galveston Metropolitan Area. Int. J. Sustain. Transp. 2012, 8, 447–470. [Google Scholar] [CrossRef]
- Boarnet, M.G.; Joh, K.; Siembab, W.; Fulton, W.; Nguyen, M.T. Retrofitting the Suburbs to Increase Walking: Evidence from a Land-use-travel Study. Urban Stud. 2011, 48, 129–159. [Google Scholar] [CrossRef] [PubMed]
- Feng, J. The Built Environment and Active Travel: Evidence from Nanjing, China. Int. J. Environ. Res. Publ. Health 2016, 13, 301. [Google Scholar] [CrossRef] [PubMed]
- Chatman, D.G. Residential Self-selection, the Built Environment, and Non-work Travel: Evidence Using New Data and Methods. Environ. Plan. A 2009, 41, 1072–1089. [Google Scholar] [CrossRef]
- Anable, J.; Gatersleben, B. All work and no play? The role of instrumental and affective factors in work and leisure journeys by different travel modes. Transp. Res. Part A Policy Pract. 2005, 39, 163–181. [Google Scholar] [CrossRef]
- Cullinane, S. The relationship between car ownership and public transport provision: A case study of Hong Kong. Transp. Policy 2002, 9, 29–39. [Google Scholar] [CrossRef]
- Handy, S.L.; Clifton, K.J. Local shopping as a strategy for reducing automobile travel. Transportation 2001, 28, 317–346. [Google Scholar] [CrossRef]
- Boarnet, M.G.; Michael, G.; Tracy, E.M. Walking, Urban Design, and Health: Toward a Cost-benefit Analysis Framework. JPER 2008, 27, 341–358. [Google Scholar] [CrossRef]
- Comendador, J.; Floridea, D.C.; Maria, E.L.; Juan, C.G.P. Built Environment and Social Capital Variables Influence on Travel Behavior: The Case of Two Waves Panel Survey in Madrid. 2015. Available online: https://trid.trb.org/view/1336623 (accessed on 12 February 2018).
- Ewing, R.; Guang, T.; Goates, J.P.; Zhang, M.; Greenwald, M.J.; Joyce, A.; Greene, W. Varying Influences of the Built Environment on Household Travel in Nine Diverse Regions of the United States. Urban Stud. 2014, 52, 2330–2348. [Google Scholar] [CrossRef]
- Sung, H.; Sugie, L.; Sungwon, J. Identifying the Relationship between the Objectively Measured Built Environment and Walking Activity in the High-density and Transit 34 oriented City, Seoul, Korea. Environ. Plan. B Plan. Des. 2014, 41, 637–660. [Google Scholar] [CrossRef]
- Naess, P. Residential Location Affects Travel Behavior—But How and Why? The Case of Copenhagen Metropolitan Area. Prog. Plan. 2005, 63, 167–257. [Google Scholar] [CrossRef]
- Choi, H.; Nakagawa, D.; Matsunaka, R.; Oba, T.; Yoon, J. Estimating the efficiency of transportation energy consumption based on railway infrastructure and travel behavior characteristics. Int. J. Railw. 2013, 6, 33–44. [Google Scholar] [CrossRef]
- EDMC. Energy and Economic Statistics Manual; EDMC: Tokyo, Japan, 2011. [Google Scholar]
- Myers, R.H. Classical and Modern Regression with Applications, 2nd ed.; Duxbury/Thomson Learning: Pacific Grove, CA, USA, 1990; ISBN 978-0534380168. [Google Scholar]
- Menard, S. Applied Logistic Regression Analysis, 2nd ed.; Quantitative Applications in the Social Sciences; Sage University: Thousand Oaks, CA, USA, 2002; p. 106. [Google Scholar]
- Stevens, M.J. Does Compact Development Make People Walk and Use Transit? Available online: https://www.hendrix.edu/uploadedFiles/Departments_and_Programs/Business_and_Economics/AMAES/Stevens%20-%20MAER-Net.pdf (accessed on 2 May 2017).
- Marshall, W.E.; Garrick, N.W. Community design and how much we drive. J. Transp. Land Use 2012, 5, 5–21. [Google Scholar] [CrossRef]
- Aditjandra, P.T.; Cao, X.; Mulley, C. Exploring changes in public transport use and walking following residential relocation: A British case study. J. Transp. Land Use 2016, 9, 77–95. [Google Scholar] [CrossRef]
Figure 1.
Study area.
Figure 2.
Location of bus stops.

Figure 3.
Station area of influence.
Figure 4.
Database construction and analysis method.
Figure 5.
Effect of mode choice and travel distance on Travel energy consumption.
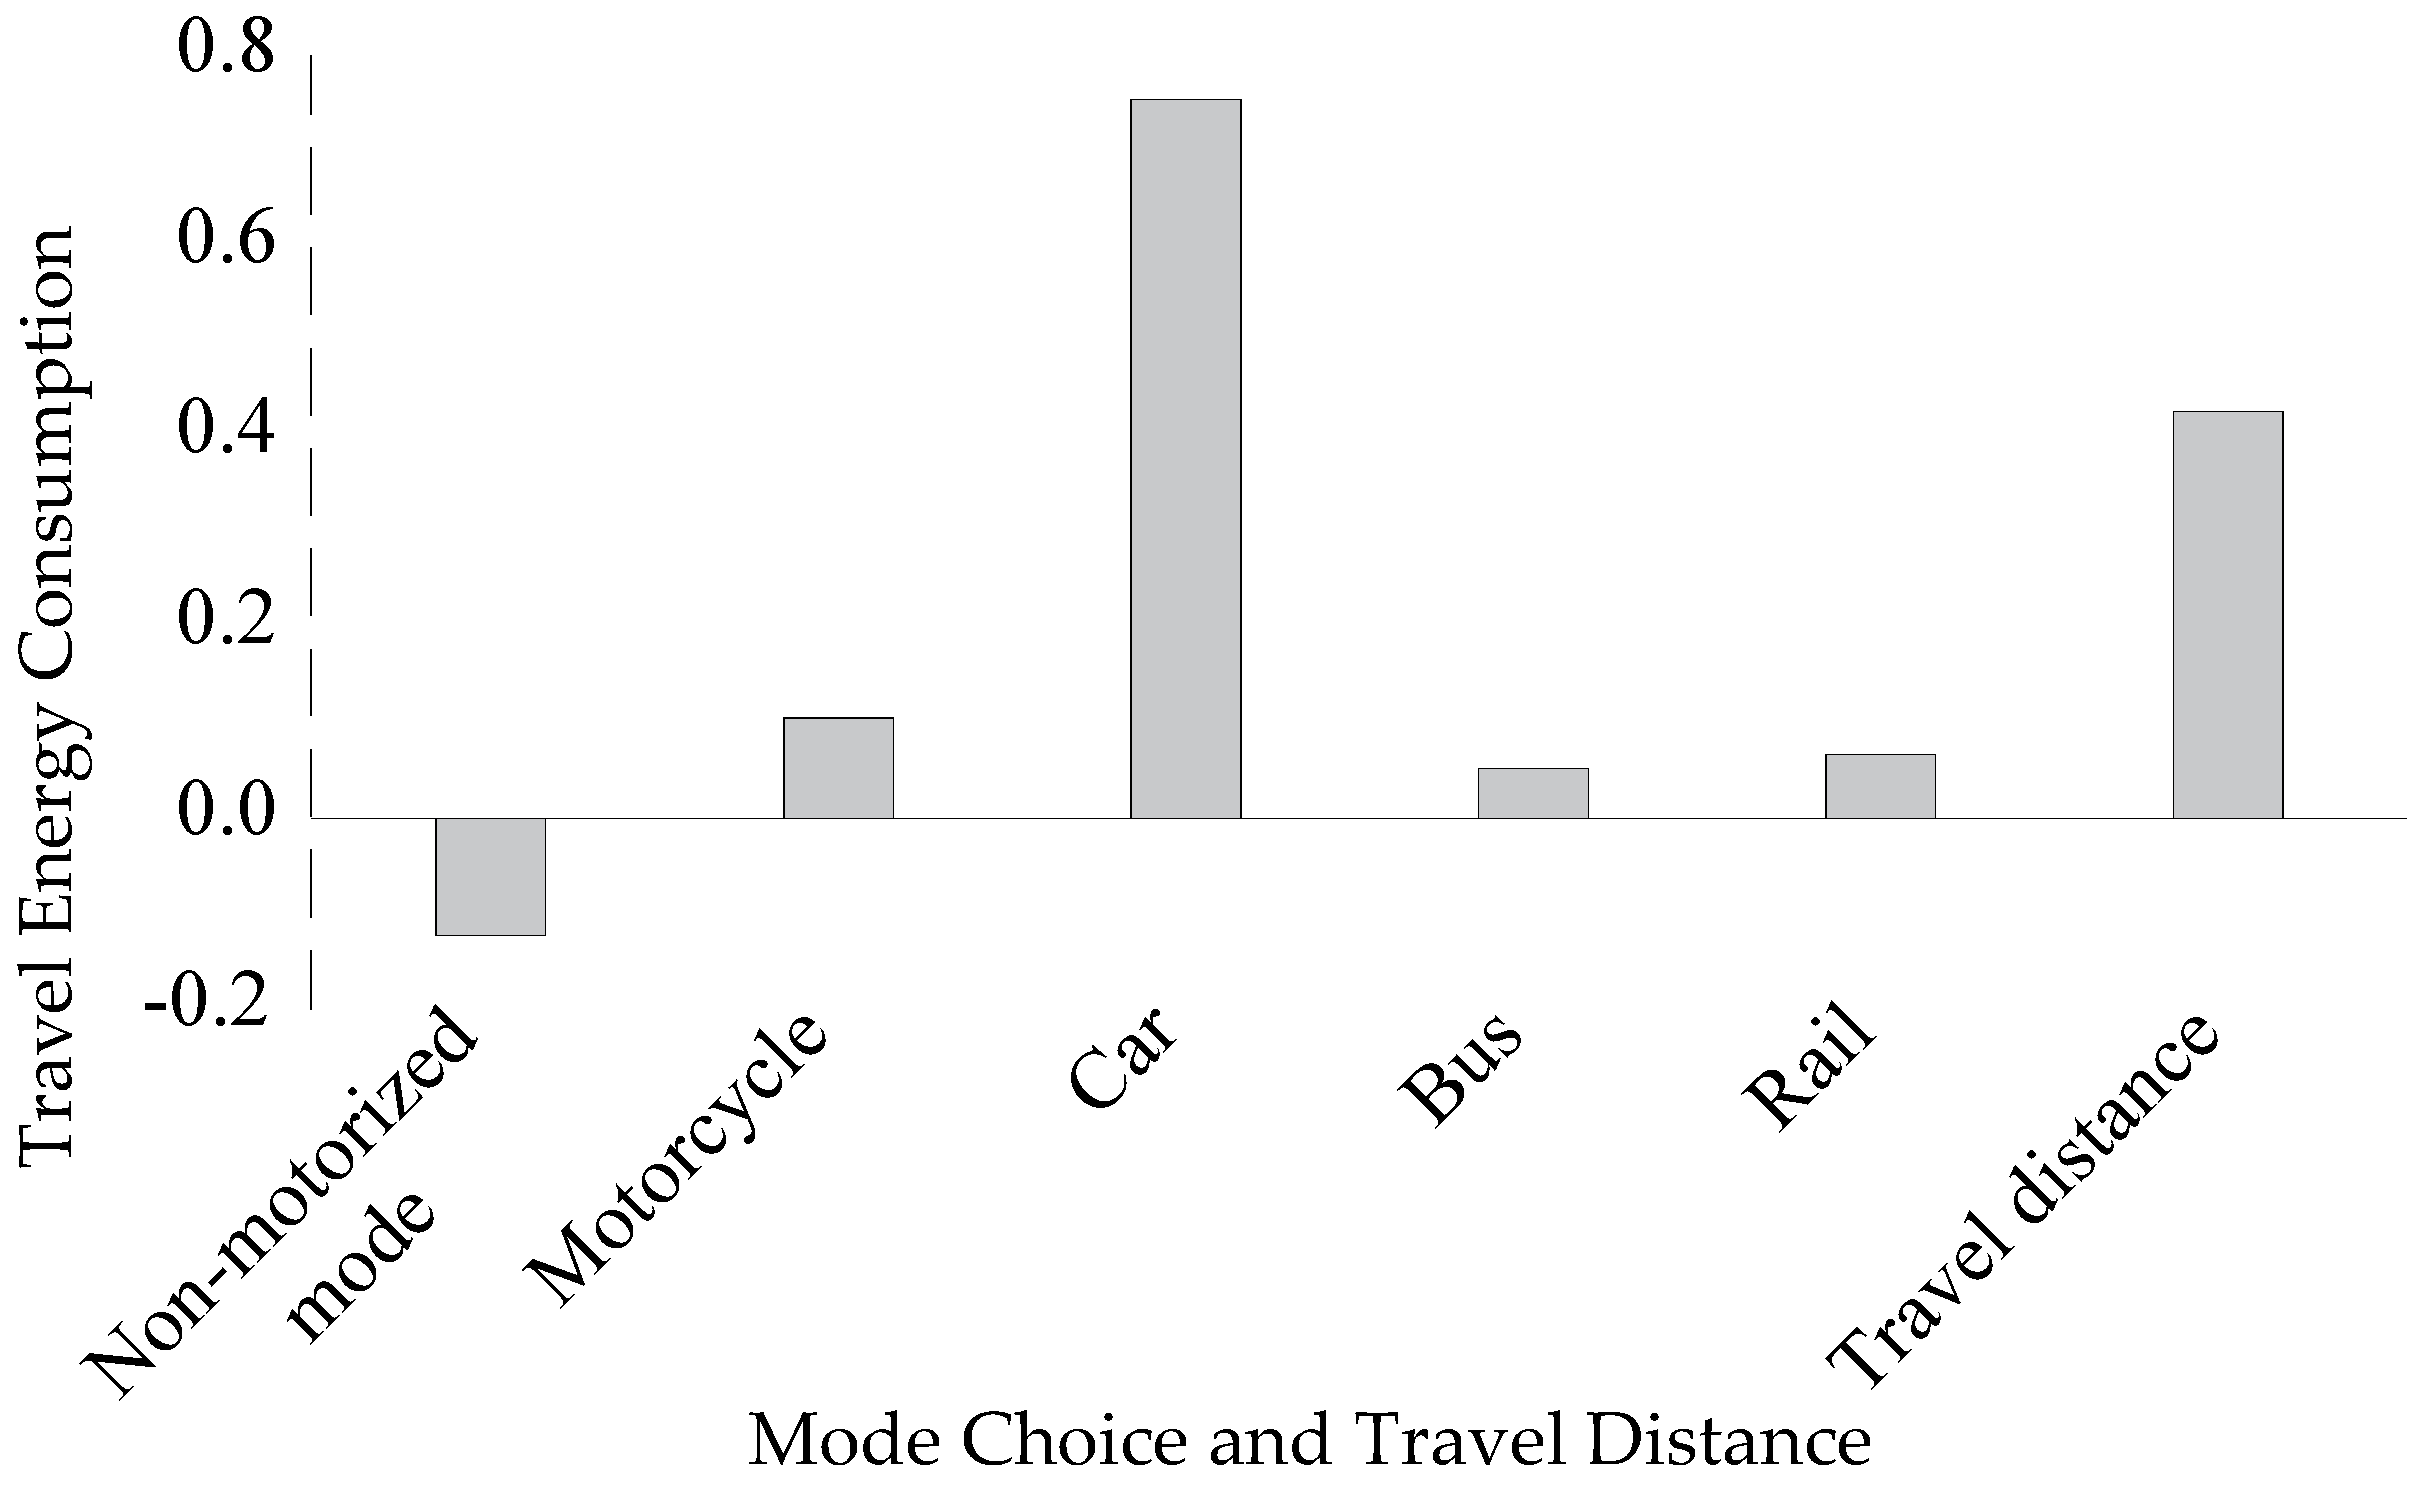
Figure 6.
Effect of 5Ds and travel purpose on mode choice.


Table 1.
Descriptive result summary—urban form variables.
| Mean | Std. Deviation | Minimum | Maximum | |
|---|---|---|---|---|
| D1 (Density) | 1517.35 | 837.84 | 1.47 | 4465.68 |
| D2 (Diversity) | 0.50 | 0.13 | 0.08 | 0.71 |
| D3 (Design) | 225.32 | 149.82 | 14.00 | 963.00 |
| D4 (Destination accessibility) | 7.75 | 5.44 | 0.54 | 33.28 |
| D5 (Distance to transit) | 3.70 | 2.52 | 0.00 | 14.98 |
| Population density | 2965.10 | 1642.92 | 2.20 | 8827.70 |
| Household density | 69.59 | 51.31 | 0.57 | 204.53 |
| Residential | 620,424.30 | 377,577.69 | 3960.74 | 1,593,349.49 |
| Commercial | 141,532.94 | 115,696.76 | 10,996.62 | 701,403.56 |
| Industrial | 43,025.45 | 77,121.95 | 0.00 | 414,676.16 |
| Utility facility | 163,001.74 | 119,038.56 | 22,143.02 | 596,110.10 |
| Public open space | 135,147.15 | 357,009.31 | 0.00 | 3,123,214.52 |
| Road intersection 3-way | 363.11 | 263.65 | 24.00 | 1746.00 |
| Road intersection 4-way | 87.54 | 45.83 | 4.00 | 218.00 |
| Distance to CBD | 7.75 | 5.44 | 0.54 | 33.28 |
| No. of bus stops | 9.61 | 5.16 | 0.00 | 27.00 |
| Influence of rail station | 455,843.81 | 496,092.78 | 0.00 | 2,252,447.65 |
| Bus accessibility | 7.07 | 4.92 | 0.00 | 28.95 |
| Rail accessibility | 0.34 | 0.36 | 0.00 | 1.46 |
Table 2.
Variables related to D5 (Distance to Transit).
| Bus accessibility = No. of bus stops/Total land area (km2) |
| Rail accessibility = Station area of influence (km2)/Total land area(km2) |
Table 3.
Descriptive result summary—travel variables.
| Mean | Std. Deviation | Minimum | Maximum | |
|---|---|---|---|---|
| Walk | 11,377.15 | 7288.11 | 419.00 | 55,410.00 |
| Bicycle | 7388.93 | 4664.86 | 64.00 | 23,657.00 |
| Non-motorized mode | 18,766.07 | 11,292.24 | 552.00 | 76,000.00 |
| Motorcycle | 1712.29 | 1090.39 | 0.00 | 7510.00 |
| Car | 20,328.07 | 9920.83 | 1258.00 | 60,297.00 |
| Bus | 4742.15 | 6726.95 | 52.00 | 65,870.00 |
| Rail | 5302.06 | 7677.31 | 0.00 | 72,111.00 |
| Work Trip (WT) | 8648.35 | 5912.59 | 179.00 | 49,975.00 |
| School Trip (ST) | 3720.44 | 2411.98 | 0.00 | 12,313.00 |
| Business Trip (BT) | 8630.81 | 7020.09 | 692.00 | 54,547.00 |
| Private Trip (PT) | 10,960.44 | 9492.27 | 314.00 | 90,391.00 |
Table 4.
Energy intensity factor for travel modes.
| Travel mode | Motorcycle | Car | Bus | Rail |
|---|---|---|---|---|
| Energy intensity factor (MJ/person/ km) [57] | 1.2 | 2.41 | 0.72 | 0.20 |
Table 5.
Mode wise stratified regression model.
| Independent Variables | Non-Motorized Mode | Motorcycle | Car | Bus | Rail | ||||||||||
|---|---|---|---|---|---|---|---|---|---|---|---|---|---|---|---|
| B | T | p | B | T | p | B | T | p | B | T | p | B | T | p | |
| Constant | −2.387 | −2.647 | 0.009 | 0.465 | 0.425 | 0.672 | −0.349 | −0.342 | 0.733 | −0.525 | −0.424 | 0.673 | −2.023 | −1.292 | 0.199 * |
| Urban form variables | |||||||||||||||
| Density (D1) | 0.477 | 4.002 | 0.000 ** | −0.160 | −1.104 | 0.272 | −0.386 | −2.862 | 0.005 * | 0.362 | 2.211 | 0.029 * | 0.067 | 0.324 | 0.747 |
| Diversity (D2) | 0.209 | 1.679 | 0.096 | 0.047 | 0.311 | 0.756 | 0.242 | 1.717 | 0.089 | 0.006 | 0.034 | 0.973 | 0.041 | 0.191 | 0.849 |
| Design (D3) | −0.277 | −2.135 | 0.035 * | 0.469 | 2.977 | 0.003 ** | 0.669 | 4.556 | 0.000 ** | −0.215 | −1.204 | 0.231 | −0.856 | −3.798 | 0.000 ** |
| Destination Accessibility (D4) | 0.285 | 1.910 | 0.050 * | −0.430 | −2.379 | 0.019 * | −0.253 | −1.498 | 0.137 | 0.019 | 0.095 | 0.925 | 0.636 | 2.458 | 0.015 * |
| Distance to Transit (D5) | 0.147 | 1.472 | 0.144 | 0.089 | 0.735 | 0.464 | −0.120 | −1.058 | 0.293 | 0.261 | 1.905 | 0.060 | 0.200 | 1.155 | 0.251 |
| Travel variables | |||||||||||||||
| Work Trip (WT) | 0.737 | 5.348 | 0.000 ** | 0.156 | 0.931 | 0.354 | 0.230 | 1.474 | 0.144 | −0.080 | −0.424 | 0.673 | 0.565 | 2.359 | 0.020* |
| Study Trip (ST) | 0.237 | 3.532 | 0.000 ** | 0.198 | 2.115 | 0.036 * | 0.297 | 3.389 | 0.001 ** | −0.122 | −1.146 | 0.255 | 0.077 | 0.572 | 0.568 |
| Business Trip (BT) | −0.006 | −0.086 | 0.932 | 0.203 | 2.290 | 0.024 * | 0.690 | 8.332 | 0.000 ** | 0.295 | 2.935 | 0.004 ** | 0.431 | 3.393 | 0.000** |
| Private Trip (PT) | 0.508 | 4.547 | 0.000 ** | 0.238 | 1.755 | 0.082 | 0.187 | 1.475 | 0.143 | 0.758 | 4.934 | 0.000 ** | 0.260 | 1.341 | 0.183 |
| Summary Statistics | |||||||||||||||
| p-value | 0.000 ** | 0.000 ** | 0.000 ** | 0.000 ** | 0.000 ** | ||||||||||
| R | 0.949 | 0.786 | 0.913 | 0.816 | 0.782 | ||||||||||
| R-square (R2) | 0.901 | 0.618 | 0.833 | 0.666 | 0.612 | ||||||||||
Note: B means Unstandardized regression coefficient, T means test coefficient, p means Significance, ** means p < 0.001 and * means p < 0.05.
Table 6.
Travel energy consumption regression model.
| Independent Variables | Travel Energy Consumption | ||
|---|---|---|---|
| B | T | p | |
| Constant | 0.041 | −2.640 | 0.010 |
| Non-motorized mode | −0.122 | −2.542 | 0.012 * |
| Motorcycle | 0.107 | 1.577 | 0.118 |
| Car | 0.747 | 15.154 | 0.000 ** |
| Bus | 0.052 | 1.004 | 0.318 |
| Rail | 0.065 | 1.538 | 0.127 |
| Travel Distance (TD) | 0.424 | 5.263 | 0.000 ** |
| Summary Statistics | |||
| p-value | 0.000 ** | ||
| R | 0.914 | ||
| R-square (R2) | 0.835 | ||
Note: B means Unstandardized regression coefficient, T means test coefficient, p means Significance, ** means p < 0.001 and * means p < 0.05.
Table 7.
Multicollinearity test.
| Stratified Mode Choice Models | Travel Energy Consumption Model | ||||
|---|---|---|---|---|---|
| Independent Variables | Collinearity Statistics | Independent Variables | Collinearity Statistics | ||
| Tolerance | VIF | Tolerance | VIF | ||
| Density (D1) | 0.379 | 2.635 | Non-motorized mode | 0.345 | 2.896 |
| Diversity (D2) | 0.425 | 2.356 | Motorcycle | 0.451 | 2.215 |
| Design (D3) | 0.293 | 3.418 | Car | 0.433 | 2.311 |
| Destination Accessibility (D4) | 0.246 | 4.067 | Bus | 0.521 | 1.918 |
| Distance to Transit (D5) | 0.838 | 1.193 | Rail | 0.577 | 1.732 |
| Work Trip (WT) | 0.152 | 6.560 | Travel Distance | 0.757 | 1.322 |
| School Trip (ST) | 0.310 | 3.229 | |||
| Business Trip (BT) | 0.362 | 2.764 | |||
| Private Trip (PT) | 0.281 | 3.559 | |||
© 2018 by the authors. Licensee MDPI, Basel, Switzerland. This article is an open access article distributed under the terms and conditions of the Creative Commons Attribution (CC BY) license (http://creativecommons.org/licenses/by/4.0/).
Share and Cite
MDPI and ACS Style
Maharjan, S.; Tsurusaki, N.; Divigalpitiya, P. Influencing Mechanism Analysis of Urban Form on Travel Energy Consumption—Evidence from Fukuoka City, Japan. Urban Sci. 2018, 2, 15. https://doi.org/10.3390/urbansci2010015
AMA Style
Maharjan S, Tsurusaki N, Divigalpitiya P. Influencing Mechanism Analysis of Urban Form on Travel Energy Consumption—Evidence from Fukuoka City, Japan. Urban Science. 2018; 2(1):15. https://doi.org/10.3390/urbansci2010015
Chicago/Turabian StyleMaharjan, Sarita, Naoki Tsurusaki, and Prasanna Divigalpitiya. 2018. "Influencing Mechanism Analysis of Urban Form on Travel Energy Consumption—Evidence from Fukuoka City, Japan" Urban Science 2, no. 1: 15. https://doi.org/10.3390/urbansci2010015