According to the Plan: Testing the Influence of Housing Plan Quality on Low-Income Housing Production


Department of Landscape Architecture and Regional Planning, UMass Amherst, MA 01003, USA
Urban Sci. 2018, 2(1), 1; https://doi.org/10.3390/urbansci2010001
Submission received: 10 October 2017
/
Revised: 4 December 2017
/
Accepted: 14 December 2017
/
Published: 22 December 2017
Abstract
:For more than 20 years, scholars have assessed a plan’s content to determine the plan’s quality, with quality serving as a proxy for planning efficacy. However, scholars rarely examine the relationship between a plan’s quality and the plan’s intended outcome. Thus, it is unclear whether quality influences planning outcomes or even advances equity. To close this gap, this study assessed a non-random sample of housing plans from 43 cities in California’s Los Angeles and Sacramento regions to observe how cities accommodated low-income housing needs and to observe whether each plan’s quality influenced low-income housing production. The analysis indicates that the plans identified 42 different planning tools to accommodate low-income housing needs, and nearly 60% of the implementing objectives proposed construction programs. Quality is influential after the city’s location, land-use, population, and the plan’s compliance with state housing law are taken into account. In summary, quality illuminated how these cities accommodated low-income housing needs and, in conjunction with other city conditions, quality influences low-income housing production. Due to this non-random sample, this study calls on planning scholars to subject quality to more empirical tests on planning outcomes in other areas to increase quality’s importance in scholarship.
1. Introduction
After more than 20 years of studies, is there any evidence indicating that a plan’s quality has any influence on the plan’s intended outcome? Quality is a descriptive method that scholars use to assess a plan’s content. Depending on the plan’s level of detail, scholars will assess the plan’s goals, facts, and implementing policies, assign those items dichotomous (0, 1), ordinal (0, 1, 2), and/or interval (0, …, n) values, and subsequently calculate an overall quality score. Plans with high scores are promoted as high quality, with quality representing planning efficacy. However, what is often missing from these studies is an analysis linking the plan’s quality with the plan’s intended outcome.
If a plan focused on mitigating environmental hazards (e.g., earthquakes, floods, or hurricanes) and received a quality assessment, shouldn’t planning practitioners know whether the plan’s quality might reduce physical damage or mortality? Similarly, if a plan focused on implementing smart growth, sustainability, or transportation, shouldn’t planning practitioners know whether the plan’s quality might influence sprawl, vehicle miles travelled, and/or auto dependence? While quality adroitly describes a plan’s content, quality’s influence on planning practice is debatable. Unlike collaborative, communicative, incremental, and/or mediation approaches, as well as the breadth of studies extolling scholars to improve plan quality discourse [1,2], there is no evidence to date that planning practitioners consider quality an important planning approach. Perhaps this lack of evidence is because scholars rarely test the influence of quality on outcomes, because to do so would require a more stringent analysis [3].
As a former planning practitioner, I suggest that quality scholars consider the concerns of practitioners. Reflecting on Baer’s research on plan evaluation, quality has been a discussion only among scholars [4] (p. 332). To include practitioners, the quality scholars must focus on the object that is central to many planning functions, the reduction of uncertainty in future outcomes [5]. This shift in discourse means that the quality scholars must begin to systematically test the influence of quality on plans’ intended outcomes. If scholars find that quality influences outcomes, then I suggest that quality should be positioned as a method for assessing plans during plan creation, not post-hoc [6]. Currently, quality scholars assess plans after the horses have left the gate. By shifting quality to draft plan assessments, planning practitioners may improve a final plan’s intent, content, and outcomes. If quality is found to have no influence after many studies, then how should this discourse relate to planning practice? Scholars can quantify how quality has filled many journals, populated many conference sessions, and graduated many doctoral students. However, quality gives short shrift to the field’s foundation: planners and their efforts to reduce uncertainty in future outcomes [7].
In this paper, I have two aims: to explore whether quality influences a plan’s intended outcome and whether quality advances equity. As mentioned previously, much of the quality discourse focuses on natural hazards or the environment. These are areas in which federal, state, and local agencies share congruent interests to reduce physical damage and human mortality [8]. With low-income housing, however, tensions arise among those agencies as well as between planners, city councils, and residents [9]. Furthermore, due to decreased government budgets and increasing needs, planning scholars and practitioners should move toward planning outcomes that promote equity and provide material wellbeing [10]. To achieve my aims, I assess the quality of housing plans from cities in California’s Los Angeles and Sacramento regions.
Since 1969, California’s Housing Element Law has required all cities to create a housing plan that details how each city will accommodate its current and future low-income housing needs. These housing plans contain goals, facts, and objectives; identify households by income; establish how many low-income housing units are expected to be constructed during a five- to eight-year period; and undergo a state compliance assessment. Conceivably, California and its city planners expect that the effort embedded in these housing plans will increase the housing options for low-income households. Thus, there are two research questions: How do cities from the Los Angeles and Sacramento regions accommodate low-income housing needs? Does the quality of a city’s housing plan influence the city’s low-income housing production?
The assessment of housing plans from 43 cities indicated that planners employed 42 different planning tools to accommodate low-income housing needs, and nearly 60% of the objectives facilitated low-income housing with construction programing. However, roughly 52% of the objectives could not be effectively evaluated because those objectives specified ongoing outcomes (e.g., continuing to refer households to fair-housing agencies) as opposed to quantifiable outcomes (e.g., constructing 10 low-income units in 5 years). Regarding quality, this study employed three measures of quality to represent three interpretations of the Housing Element Law (i.e., narrow, wide, and widest). Independently, quality was not associated with low-income housing production. When tested with other variables, the quality of the housing plan influenced low-income housing production after the city’s location, land-use, population, and the plan’s compliance with state housing law were taken into account. Because this study employs a non-random sample, these inferences are limited to the sample.
Following this introduction is background on quality and California’s Housing Element Law. The subsequent literature review analyzes research on housing plans and their influence on low-income housing. The methods section explains transforming housing plan content into reliable test data. The results section discusses how cities from the Los Angeles and Sacramento regions accommodated low-income housing needs and whether the quality of the housing plans from these cities influenced low-income housing production. Lastly, the discussion section calls on planning scholars to increase the influence of quality. In the quality discourse, scholars use the terms quality and plan quality interchangeably; however, this paper will use quality. In addition, the Housing Element Law will be referenced as the law and compliance means that a housing plan complies with a state law.
2. Background
2.1. Quality
What is quality? In planning, quality is a method with which scholars assess a plan’s content against an organized and subjective criteria that epitomizes planning theory or implements best practices [2] (p. 433). To complete a quality assessment, a scholar completes the following procedures. First, a scholar (or the initial coder) creates a protocol that lists specific items that are pertinent to understanding the phenomena. The items assessed are usually a plan’s facts, goals, and implementing policies. Second, depending on the plan’s level of detail, the scholar scores each item with zero if the item was not present in the plan, one if the item was present but lacked detail, or two if the item was present and detailed. Third, the scholar sums the item totals and then assigns the plan an overall quality score. The plan’s score determines if it was considered high- or low-quality. To increase the reliability of the protocol and the validity of the scholar’s analysis, many (but not all) scholars enlist a second coder who also assesses either a sample or all of the plans in question. With a second coder, the reliability and validity of the overall analysis can be measured by percentage agreement or by probability (e.g., Cohen’s kappa, Krippendorff’s alpha), with the latter preferred. The scholar might also submit the protocol to a scholarly review. Lastly, the scholar might interview planners in order to triangulate the quality assessment.
In 1994 and after the award of an NSF grant, a team of scholars completed the first series of studies that assessed the quality of comprehensive plans as they related to natural hazards (e.g., Philip Berke at Texas A & M University; Raymond Burby at the University of New Orleans; Linda Dalton at Cal Poly San Luis Obispo; John DeGrove and Susan Trevarthen at the Florida Atlantic University; Steven French at the Georgia Institute of Technology; Edward Kaiser and Dale Roenigk at the University of North Carolina; and Peter J. May at the University of Washington). Using a natural experiment that compared mandate states (i.e., requires a plan) to non-mandate states, the cities adhering to coercive mandates (i.e., penalties) produced more plans than non-mandate cities [11]. Cities adhering to comprehensive mandates (e.g., imposes deadlines, guidelines, and/or regulations) produced plans of higher quality than non-mandate cities [12]. Mandates that enhanced a city’s planning capacity (e.g., provides technical assistance and/or grants) led to high quality plans [13]. However, coercive mandates that reduced local autonomy may lead to “calculated commitments” to state goals, as evidenced by Hoch’s finding of “mediocre” affordable housing plans in Illinois, for example [14] (p. 174), [15] (p. 96).
Because quality “is straightforward to understand and use” and maintains “low barriers to entry as a research method,” many scholars embraced quality to explore natural hazards and environmental planning [2] (p. 434; Table 1). Deyle and Smith, for example, focused on coastal storms to determine whether mandates produce local-level plans that accomplish the goals of higher-level governments [8]. After examining 18 plans from Florida counties and cities, the authors found that those plans marginally complied with the mandate (facts were 64% in compliance, goals were 50%, and policies were 48%). Interviews revealed, however, that the state agency only evaluated a plan’s evacuation policies (one of five topics) due to “political pressure and administrative capability,” leading to questions of plan and agency effectiveness [8] (p. 462).
Brody integrated adaptive management with land-use to examine the quality of plans from communities that are subject to repeated natural disasters [16]. Adaptive management emphasizes learning from natural resource policy implementation and echoes Friedmann, who theorized planning as a heuristic process in which planners and the planning process improve via transactive experiences [17,18]. After assessing two waves of plans from Florida and Washington, Brody determined that the plans’ overall quality had increased; however, the passage of Washington’s Growth Management Act, which required compliant plans by 1994, may have intervened. Inferentially, Brody determined that a community’s 1991 plan quality was positively associated with the community’s 1999 plan quality, raising the issue of plans with templated content.
As the quality discourse gained stature, scholars extended the method to sustainability, smart growth, and transportation plans. Regarding sustainability, Berke and Conroy gathered a national sample of 30 plans and found no difference in the quality of plans organized with and without sustainability concepts [19]. Furthermore, the sustainability plans promoted the attainment of a livable built environment rather than promoting polluter penalties, regionalism, or equity. Regarding smart growth, Edwards and Haines assessed 30 comprehensive plans and determined that Wisconsin’s small cities and towns produced plans of low quality [20]. The authors rightly concluded that smart growth’s urban focus on “compact, mixed use, and pedestrian-friendly” development might overlook “stabilizing and revitalizing agriculturally based economies” [20] (pp. 61–62). However, the authors did not assess Wisconsin’s mandate. If Edwards and Haines found the higher-order mandate inconsistent with smart growth concepts, then it would follow that the lower-order plans would be of questionable quality.
Regarding transportation, Jones, Evenson, Rodriguez, and Aytur assessed 46 voluntary pedestrian and bicycle plans from North Carolina cities and counties [21]. The authors noted that high quality plans shifted resources to match priorities, specified implementation timelines, identified funding, and designated one person to manage implementation. However, cities with high quality plans also had pedestrian injury rates that were higher than the state average. This last finding echoed May and Burby, who found that voluntary plans may contain more innovative policies than mandated plans, but, as a group, voluntary cities may be at a higher risk due to these cities’ lower commitment to mitigate documented hazards [14].
As a discourse, quality’s contributions to planning scholarship are notable. Quality illuminates the effect of mandates that require a plan response, and quality allows scholars to examine a community’s planning and values. As advanced by Kaiser, Godschalk, and Chapman, a plan should establish a community’s vision, communicate that vision to interested parties, and guide the decisions of community leaders and planners [22]. However, the degree to which a plan complies with any mandate may also depend on whether the community’s values align with the mandate’s goals, the mandate’s parameters, and the planning department’s administrative capacity [13,23,24].
In planning education, and due to its roots in content analysis [25], quality can be taught in all planning programs because it provides a qualitative counterbalance to quantitative instruction. Quality also embeds planners in planning theory. As noted by Forester, who channeled Habermas, a planner’s actions are attention shaping and may lead to a dialectic communication between planners and the larger community [26]. A quality assessment describes what is and what is not in a plan and, as a result, the plan’s content (or lack thereof) influences community discussions. Lastly, quality also expands scholarly discourse. Because a plan is the unit of analysis and plans are produced in other fields (e.g., biology, climate change, economic development), non-planning scholars can adapt the method to assess their respective plans. However, quality’s relevance to planning is conditioned by one’s definition of planning. Is planning a process or is it object-oriented [27]? In 1973, Wildavsky defined planning as the “ability to control the future by current” actions, only to conclude that plans are nothing more than a political acts of faith because “there is virtually no evidence that [plans] do good” [5] (pp. 128, 151). In housing, one could examine the effects of the U.S. Department of Housing and Urban Development’s (HUD) Section 701 planning assistance on urban renewal as evidence of mixed outcomes [28,29,30].
After WW II, Congress passed the Housing Act of 1949 to advance slum clearance with urban renewal; however, a city could not receive slum clearance funds unless its urban renewal plan conformed to its general plan [31,32], Title I, Section 105. Soon after, federal officials found that small localities (25,000 persons or less) lacked housing and building codes that would guide federal investments [33] (p. 179). In response, Congress added Section 701 to the Housing Act of 1954 to increase the planning capacity of small cities by authorizing matching grants to states and cities for “planning assistance (surveys, land-use studies, urban renewal plans, technical services and other planning work” [34]). By the late 1960s, Section 701 not only supported urban renewal, comprehensive, and housing plans, but also a city’s planning efforts on behalf of the U.S. Departments of Commerce, Interior, National Oceanic and Atmospheric Administration, Transportation, and the Environmental Protection Agency, for example [35]. Similar to Wildavsky, Faludi viewed planning as future-oriented but limited its purpose to only influencing an actor’s decision because the plan (and its implementation) was “secondary in importance…. as [a plan] need not be followed at all” [6,36] (p. 129). Taking the middle ground, Alexander defined planning as a deliberate strategy of future action that has the power to implement the selected strategy that creates beneficial outcomes [7] (p. 137). In their resolution of these divergent views, Alexander and Faludi suggested that planners adopt the lens of conformance [36].
Conformance, which embraces uncertainty, requires that planners evaluate their actions using five criteria that link the planning process (e.g., operational decisions, implementation decisions) with planning outcomes (e.g., actual outputs, outcomes, and impacts) [36] (p. 135). To its credit, quality does employ conformance, but it is only to a limited degree because the assessment of plan content only illuminates the planning process. To be fair, not all mandates examined by quality engender a tangible outcome. For example, California’s housing policy (to be discussed) and its seismic safety policy are process-oriented endeavors [37,38]. Even still, if scholars do not link planning aims with outcomes, then scholars eliminate feedback that allows planning practitioners to revise planning goals, discussions, and implementation.
To their credit and in recent years, several studies have called for improvements to increase the impact of quality in planning scholarship. In 2009, Berke and Godschalk analyzed the components of sixteen quality studies and suggested improvements in inter-coder agreement, research design, and protocol development. Rather than suggest that researchers examine planning outcomes, the authors suggested that jurisdictions “require that planners conduct plan quality evaluation as part” of a plan’s preparation and review [1] (p. 238, italics in the original.). In 2014, several papers exhorted quality scholars to increase the validity and reliability of quality discourse by improving the components of a quality study (e.g., protocol, scoring, coding, sampling, testing, and inter-coder agreement; [2,39]. Notably, Lyles and Stevens called out that “the pool of studies linking plan quality to planning outcomes is quite limited…. [and] this area represent a major gap… regarding the empirical value of plans” [2] (p. 437); however, the authors did not suggest that scholars fill this gap with empiricism. This is a gap that scholars can and should close. As such, quality, as a theoretical model, remains uncultivated [27] (pp. 574–575).
2.2. California’s Housing Element Law
Since 1969, California requires that each city create a housing plan that details how the city will accommodate its housing demand [40]. In the mid-1970s, California’s Department of Housing and Community Development (CAHCD) initiated a fair-share scheme that has two purposes. First, fair-share stratifies housing demand by low-income and market-rate housing needs. Second, it directs where low-income housing “should be built within a region according to such criteria as placing housing where it will expand housing opportunity” [41] (p. 1). Due to California’s high home prices, low- and moderate-income households may earn 0–120% of the Area Median Income (AMI) established by HUD [42]. The state also categorizes the disabled, farm workers, female-headed households, the homeless, large families, and seniors as special needs households (SPN HH) that require individual planning attention. Lastly, California declares that “housing affordable to low- and moderate-income households requires the cooperation of all levels of government” [40] (§ 65580 (c)).
As a state mandate, the Housing Element Law operates in five general steps. First, every 5–8 years CAHCD establishes California’s overall housing demand and then regionally apportions that demand to the Councils of Governments (COGs). Second, the COGs create individual fair-share housing allocations for each city (reflecting production capacity and housing needs) in order to equitably distribute low-income and market-rate housing needs. Third, planners incorporate the allocations into their cities’ housing plans. Each housing plan will detail a city’s accommodation of low-income housing needs in terms of construction (by specifying that the city contains enough appropriately zoned land), rehabilitation (by specifying programs that remove deficient plumbing, electrical, and/or structural issues), and/or preservation (by specifying programs that extend current subsidies). Fourth, planners submit their housing plans to CAHCD, which determines whether the plans comply with state law. Lastly and during the next cycle (time 2), planners evaluate the city’s housing efforts during time 1. Depending on those results, the COG may modify a city’s fair-share housing allocation for time 2.
Regarding plan content, California housing plans contain goals, policies, programs, and objectives. Goals declare the “ultimate purpose of any effort stated in a manner that is general in nature,” whereas policies impart “specific statement[s] guiding action and imply clear commitment” [43] (p. 2). Programs categorize outcomes as the construction, rehabilitation, or preservation of housing. Objectives implement a city’s commitments, as the objectives are the “action, procedure… or technique that carries out policies” (Ibid). Objectives also employ various planning tools that may include density bonuses, overlay zones, co-housing, mixed-use, increased density, and accessory dwellings. Surprisingly, several housing plans promoted reverse mortgages as a planning tool for facilitating aging-in-place for seniors [44] (p. H 74–75), [45] (p. 23), [46] (p. 94), [47] (p. C-58). Lastly, housing plans must not only document a city’s quantity of the special needs households, but the plans must also identify the specific goals, policies, programs, and objectives that accommodate this group’s housing needs. The City of Wheatland provides an example of a city’s effort to accommodate low-income housing needs [43] (p. 4).
Wheatland’s housing plan has four goals, one goal of which is to “provide for the city’s regional share of new housing for all income groups” (ibid). This goal has seven policies, one of which is, “The City shall work with other public agencies and private organizations to build affordable housing” (ibid). This goal enacts construction, rehabilitation, and preservation programs and lists 13 objectives, one of which is, “The City shall redesignate and re-zone 4.1 acres of land for multi-family use at 18 units per acre in order to accommodate at least an additional 73 multi-family units needed to provide adequate sites for affordable housing” (ibid). California gives planners wide latitude regarding whose efforts are documented in a plan’s objectives. The City of Winters, for example, included the effort of the Yolo County Housing Authority in Winters’ objectives to preserve forty-four Section 8 vouchers [48] (pp. 17, 36). The City of Pasadena included housing owned by California’s Department of Transportation in its objectives to preserve five hundred low-income units [49] (pp. 5, 29).
While California’s approach is laudable, it has limits. California has no provision that ensures that sites identified for future low-income housing will remain low-income at permit issuance. During any planning period, a city may not attain compliance until the final effective year or may thwart its required low-income housing planning [50] (p. 504). There is no database of constructed, rehabilitated, or preserved low-income units resulting from the law. Finally, California imposes no penalties. Noncompliant cities may be subject to lawsuits from parties with legal standing [51,52]. Consequently, the California League of Cities advises city attorneys to be “proactive in ensuring that their housing [plan] can survive a legal challenge [by] preventing consultants and staff from making promises that the city” cannot fulfill [53].
To understand housing plan efficacy, Baer argued that housing plans “have been used symbolically both to arouse the polity and later lull it into continued political inaction” [54] (p. 172). Early 20th century housing plans were calls to reform slum conditions [55]. During the 1950s and 1960s, HUD’s Section 701 funds supported comprehensive and housing plans that employed technical analyses to quantify needs and demand [31,33]. In the late 1970s, HUD allowed planners to implement regional allocation systems after recognizing that uncoordinated municipal responses could not reduce housing inequity [56]. California aspires to this final iteration. However, neither California’s fair-share housing allocations nor compliance consistently produce low-income housing for one simple reason: local autonomy.
The law’s central problem is determining which agency (e.g., CAHCD, COGs, or cities) arbitrates density. Baer attributes this problem to governance [57]. With passage of AB 2853 in 1980, California shifted its housing laws from hierarchal command to governance—all agencies operate as equal actors [58] (pp. 59–61). Even though the housing allocation directs changes in density in order to promote equity, a city may resist modifying a neighborhood’s established character [59,60]. Baer acknowledged that compliance advances equitable planning, but also lamented that there is little evidence indicating that compliance produces “affordable units on actual building sites” [58] (p. 68). In closing, the presented study will attempt to link planning aims to planning outcomes by exploring the relationship between the quality of housing plans and low-income housing production—the plan’s intended outcome and also an equitable good.
3. Literature Review
This review focuses on housing mandates and their influence on low-income housing production. The foundation for many of these mandates is a fair-share scheme that allows low-income households to find suitable housing within a region. New Jersey and Massachusetts are two states with notable fair-share schemes [61,62,63]. What makes these states different from California is that their plans are not interventions. For example, Massachusetts requires that at least 10% of a city’s housing inventory is affordable to low-income households. However, Massachusetts does not mandate that cities maintain comprehensive or housing plans to facilitate low-income housing production. Therefore, how a city achieves and maintains its low-income housing inventory is largely left to each city and its planners. This review focuses on those mandates in which the plan is the intervention. A review of the literature indicates that few housing studies adopt a quality approach to examine housing mandates and few studies examine low-income housing units as the outcome of the planning process. This review first discusses housing studies that examined the planning process and then discusses housing studies that examined low-income housing as the planning outcome.
3.1. Housing Mandates and the Planning Process in Florida, Illinois, and Georgia
In 1985, Florida’s Growth Management Act (GMA) required that cities adopt comprehensive plans (with required housing plans) to accomplished three state goals: anticipate future housing, address blight, and identify future housing sites. Florida evaluates the plans for compliance but does not pursue fair-share. Consequently, the cities “establish[ed] their own definition of housing need” [64] (p. 70). In 1993, Connerly and Muller analyzed five county and five city housing plans to determine whether GMA would “stimulate local planning responsibility for affordable housing” [65] (p. 186). Using a seven-component protocol that consisted of planning and public administration best practices, the authors gave the plans low scores because the plans “lack[ed] the specificity and comprehensiveness that are required to adequately address” Florida’s low-income housing crisis [65] (p. 196). However, their protocol included items not specified by Florida’s law, reducing its validity. Ten years later, Anthony examined the influence of GMA on housing affordability in sixty-seven Florida counties [66]. After examining 16 years of data, Anthony found that households in counties with compliant housing plans could not afford homes priced at the county’s median sales price unless those households spent more than 25% of their household income. Anthony also found that increases in a county’s population was strongly associated with decreased housing affordability, more people chasing fewer units.
In 2014, Aurand gathered a random sample of two waves of housing plans from 39 Florida cities to assess each housing plan’s strength and then tested whether that strength influenced housing affordability [67]. Aurand operationalized strength by creating a protocol that listed 20 planning policies for facilitating low-income housing (as suggested by Florida’s housing agency) and then enumerated how many of those policies were found in a housing plan (maximum score = 20). After employing a second coder to increase his validity, Aurand found that the median number of affordable housing policies increased from 3 per plan to 5 per plan, with working with the public housing authority, expending Community Development Block Grant (CDBG) funds, and increasing density as the top three policies. Inferentially, Aurand found that the strength of housing plans from 1988–1993 was not influential, but the strength of housing plans from 1996–2004 was associated with decreases in cost-burdened homeowners and increases in low-priced rental units. Due to the strength’s lagged significance, Aurand suggested that Florida’s robust housing market and available state subsidies might have influenced housing affordability. However, Aurand may have over-specified his model, as he employed 14 predicting variables on 39 observations. In summary, Florida reinforces the planning process, does not define low-income housing needs, and lacks housing production data. Overall, these studies indicate that Florida’s initial plans marginally accommodated low-income housing needs, but a plan’s quantity of affordable policies increased over time. However, compliance in Florida may signal two conditions: a successful planning process and households in the midst of a housing crisis.
In 1961, Illinois allowed cities to adopt voluntary comprehensive plans [68]. Regarding housing equity, Illinois passed the Affordable Housing Planning and Appeal Act (AHPAA) in 2004, which requires cities to create affordable housing plans if more than 10% of a city’s housing inventory is not affordable to low- and moderate-income households [69]. Similar in approach to Connerly and Mueller [65], Hoch assessed housing plans in 2007 to examine the plans’ consistency with the AHPAA and commitment to low-income housing. After analyzing 36 plans that missed the AHPAA’s initial deadline, Hoch found that 83% were internally consistent with the AHPAA, 47% contained information relevant to local conditions, but only 14% documented a local commitment to low-income housing. A key issue was a city’s declaration of home rule. Many cities, mistakenly or not, claimed the AHPAA did not apply to them. In summary, Illinois enacts fair-share, compiles housing data, but renders comprehensive planning as voluntary. In fact, four laws differently define comprehensive planning: the Local Resources Management Planning Act of 2002, the Local Planning Technical Assistance Act of 2002, the Local Legacy Act of 2004, and the initial 1961 law in Chapter 65, ILCS 5/11-12-7. Regarding the analysis, Hoch illuminated the planning process but did not provide a protocol that guided his analysis (limiting replication). Citing a lack of resources, he did not employ a second coder (weakening the accuracy of the analysis). Regarding low-income housing production, Hoch evaluated the Illinois mandate in its early years; however, in the ensuing years there should be evidence of AHPAA’s influence on low-income housing production because Illinois enumerates each city’s housing inventory and whether the city has produced an affordable housing plan [70].
In 1989, Georgia mandated comprehensive plans for all cities and began reviewing the plans for compliance. However, a housing plan is required only if the city receives CDBG funds from HUD. Furthermore, a CDBG city may substitute its HUD-consolidated plan for the required housing plan. Regarding housing equity, Georgia does not issue fair-share targets but encourages cities to consider the following: cost-burdened households, impacts of housing affordability, and jobs/housing balance, for example. In 2017, Jun compared the strength of affordable housing policies in Atlanta region comprehensive plans to the strength of plans from the Detroit region and then tested the relationship between strength and housing affordability. To determine strength, Jun expanded Aurand’s protocol to 23 affordable housing policies, giving 1 point for voluntary policies (e.g., encourage, consider, should), and 2 points for mandatory policies (e.g., shall, will, require), for a maximum quality score of 46 points [3] (p. 255). After assessing 58 plans, Jun found that Georgia plans were stronger (=4.9) than Michigan plans (=1.82).
Regarding housing affordability, strength was positively associated with the growth of cost-burdened renters and homeowners in both locations. Like Anthony [66], Jun found that a successful planning process may also signal households experiencing a housing crisis. In summary, Georgia mandates comprehensive planning, but HUD may actually dictate housing equity for Georgia residents. Regarding Jun’s analysis, three issues are unclear. First, Jun assessed plans from the Detroit region to approximate a natural experiment in which a scholar examines the contrast between a treatment and comparison condition [71] (pp. 12, 17). Because Michigan does not require comprehensive plans or provides any guidance on housing equity [72], was the Detroit region a suitable comparison or simply a straw man? Second, Jun did not identify the sample cities nor clarify if the strength analysis examined housing plans or consolidated plans. This identification would have indicated if the city or HUD directed local housing policy. Lastly, Jun justly modified Aurand’s protocol to fit the research aims but, like Hoch, did not employ additional coders to provide inter-coder reliability. Without clarification, these three conditions reduce the impact of this study.
3.2. Housing Mandates and Housing Outcomes in California and Minnesota
Regarding the influence of California’s Housing Element Law, Lewis regressed the 1994 compliance of 354 municipalities on their 1994–2000 residential permit data and determined that population, household income, and job/worker ratio, not compliance, influenced housing production [73]. While notable, Lewis could not identify low-income housing because he relied on permit data. Recently, Ramsey-Musolf examined a purposive sample of Los Angeles and Sacramento region cities (1990–2007, n = 53) and determined that compliant cities were associated with a 2.3% increase in low-income housing production (as identified by the housing plans) relative to noncompliant municipalities [50]. In contrast, compliant municipalities were associated with a −0.22% decrease in annual housing production (i.e., permits) relative to noncompliant municipalities. While these findings suggest that California operates with conflicting goals, these associations are limited to the sample. Regarding the analysis in both studies, neither Lewis nor Ramsey-Musolf could establish a counterfactual because all cities must adhere to state policy and no pre-test data exists [71]. In summary, California advances a complex planning process to achieve housing equity. However, scholars are limited in their examination of California’s housing mandate due to the persistent lack of data.
In, 1967, Minnesota established the Metropolitan Council (Council) to coordinate the planning and development of the seven-county Minneapolis and St. Paul region [74]. By 1976, Minnesota passed the Land-Use Planning Act (LUPA) to mandate comprehensive planning for cities located in the region and to grant the Council compliance authority [75]. Regarding housing equity, the Council established an advisory committee that recommended that comprehensive plans “identify sufficient land to accommodate the communities’ share of the region’s need for low- and moderate-income housing” [76] (p. 2). In 2003, Goetz, Chapple, and Lukermann examined three waves of plans from 25 cities and found that the 1975–1982 plans facilitated low-income housing by employing nearly four policies per plan [77]. For example, 75% of plans relied on Planned Unit Development (PUD) designations, 58% relied on increasing density, 58% relied on reducing minimum unit sizes, and, fiscally, only 8% relied on tax increment funding. A PUD, when approved by a zoning board or city council, allows current and future development to deviate from the city’s zoning regulations [78]. For post-1995 plans, those plans employed nearly two policies per plan, with PUDs identified in 56% of the plans.
Regarding the persistence of high-density land, Goetz et al. argued that cities significantly reduced their exposure to potential low-income housing because only 22% of the original parcels persisted. Specifically, the cities rezoned 38% of high-density parcels to lower densities and 17% to non-residential uses. Regarding actual production, there was no data verifying whether low-income housing was constructed on the parcels. Goetz et al. blamed not only the council but also HUD for failing to hold cities accountable. HUD’s Section 701 funds supported council activities. Therefore, when Section 701 (and the A-95 circular) ceased, the council and its management of fair-share and comprehensive planning also ceased [79]. In summary, Minnesota mandated comprehensive planning, evaluated plans for compliance, pursued an equitable outcome via high-density land, and employed PUDs to facilitate low-income housing. However, less than 25% of land set aside for low-income housing persisted. While innovative because they diverge from Euclidean zoning, PUDs can also be employed as an exclusionary tool. In the 1960s, PUDs were hailed as flexible zoning tools for cities to use when regulating complex projects; however, PUDs were frequently transformed into negotiated contracts between developers and elected officials without the input of residents [78] (p. 11).
In summary, the planning process research illuminated how states emphasize creating plans and policies that aspire to increase low-income housing production. The housing outcomes research indicated that the planning process may or may not have any relationship with housing production. However, scholars and planners cannot champion planning reform without evidence of the impact of the planning process on outcomes. Furthermore, two interrelated issues hamper gathering evidence: the state mandates and data. First, none of the examined mandates specified that a housing unit was the ultimate measure of a mandate’s success. Because states evaluate the compliance of plans and not the construction of housing, they have little incentive to document housing production and consequently create data. Thus, several scholars examined permit data, housing affordability, and the strength of housing policies as proxies for low-income housing units. To reform state housing policy, what is needed is scholarship that evaluates the planning process and planning outcomes, a gap that the presented study attempts to close.
4. Methods and Data
To determine whether quality influences planning outcomes and advances equity, this study has two research questions. How do cities from the Los Angeles and Sacramento regions accommodate low-income housing needs? Does the quality of a city’s housing plan influence the city’s low-income housing production? The following discussion, as guided by Lyles and Stevens, explains this study’s context, research design, sampling, units of analysis, protocol, scoring, and analysis [2].
Contextually, the Housing Element Law embodies California’s planning doctrine. Since 1947, all California cities and counties must maintain a general plan [80]. Since 1969, all general plans must contain a housing plan. A city’s or county’s zoning code must maintain vertical consistency with its general plan, meaning daily zoning actions advance the general plan’s long-term goals [81]. Thus, if a city or county adopts a compliant housing plan, then the housing plan’s objectives should satisfy local housing demand, regional fair-share, and California’s goal of housing equity. However, this study focuses on cities and not counties because their respective planning processes are non-equivalent, as California counties manage vast tracts or scatter fragments of unincorporated land. In addition, Lobao and Kraybill found that county planning was associated with urban development—with outer-ring and rural counties having fewer funds available for housing and economic activities [82]. This study employed a cross-sectional research design to assess housing plans that were effective from 1998–2005. This period captures California’s path to its apex of housing plan compliance 90% in 2010 [83]. Figure A1 illustrates the compliance performance of California and the sample.
The purposive sample of 43 cities was guided by the Housing Element Law’s compliance procedures and each city’s character. The law requires all cities to accommodate current and future housing demand, and the most direct method for obtaining compliance and facilitating housing production is for a city to identify parcels of vacant land or parcels that will support increased density. In California, cities surrounded by unincorporated land may annex adjacent vacant parcels for future development, as those parcels may fall under the city’s “sphere of influence.” According to the California law, a sphere of influence “designates the physical boundaries and service area of a city or special district” [84] (p. 2). California cities may control the land-use and zoning of unincorporated land that is adjacent to city boundaries and subject to future annexation. In contrast, cities contiguous with other cities must increase their internal density with zone changes, density bonuses, or inclusionary housing, for example. The sample (n = 43) includes spatially contiguous and non-contiguous cities from the Los Angeles and Sacramento regions.
In the Los Angeles region, the regional COG (Southern California Association of Governments, SCAG) organizes its 187 member cities into 15 spatial subunits that share geographic and transportation concerns [86]. SCAG is the nation’s largest COG and oversees six counties with a population that exceeds 18 million persons in an area that exceeds 38,000 square miles. Figure 1 illustrates the Los Angeles region subset (n = 28), which includes the City of Los Angeles plus the 27 cities belonging to the San Gabriel Valley Council of Governments spatial subunit [87]. The San Gabriel Valley cities were selected because they are spatially contiguous, near the central city, are urban, suburban, and rural in character, and belong to a single COG subunit. On a monthly basis, this group of cities meets in order discuss housing, planning, and transportation issues, as those issues pertain to each city and the spatial group as influenced by SCAG or the state. In the Sacramento region, the regional COG (Sacramento Area Council of Governments, SACOG) has 23 member cities; however, the cities of Citrus Heights, Elk Grove, and Rancho Cordova were excluded due to their respective study period incorporations (e.g., 1996, 2000, and 2003) and South Lake Tahoe due to its 100-mile distance from the City of Sacramento [88]. Figure 2 illustrates the Sacramento region subset (n = 15), which includes the City of Sacramento plus the 14 remaining member cities. The Sacramento region cities were selected because they are spatially contiguous and dispersed, near and far from the central city, and suburban and rural in character.
As a non-random sample, the findings from this research will be limited to the sample; however, the sample does exemplify other aspects of California’s Housing Element Law. First, the sample observes regional governance in which CAHCD, the COGs, and the cities share responsibility for low-income housing. In rural regions without a COG, CAHCD creates the housing allocation. Second, the sample observes differences between central and suburban cities in urban regions. Suburbs in urban regions may resist multifamily zoning in order to reduce the potential relocation of urban low-income households [90].
Cities are the units of analysis and the cities’ housing plans (e.g., 1998–2005, 2006–2014) are the units of observation. The 1998–2005 housing plans provide the content for the quality scores. The 2006–2014 housing plans identify the low-income housing production data for 1998–2006 planning period. No other data source links a city’s housing plan and the city’s low-income housing production. To determine quality, scholars use a protocol to score a plan’s goals, facts, and policies. In this phenomenon, goals were not suitable because they are broad and general in nature. In addition, private consultants created many housing plans with similar goals and several housing plans contained templated goals that did not change between the previous period (1991–1997) and the study period (1998–2005). Facts are important in describing housing demand (e.g., population, income levels, poverty) but do not impart the discretionary housing and planning decisions made by a city’s elected officials and planners. Policies may indicate a city’s commitment but do not detail specific actions. In this study, each housing plan’s objectives were assessed because the objectives illuminate the city’s commitment and action to accommodate low-income housing needs within a specific planning period.
A protocol should reflect the “normative criteria that is steeped in the purpose of the plan [and] the specific planning domain” [2] (p. 434). This protocol reflects California’s law and contains 63 items that were organized into four themes: audience (10 items), housing program (4 items), planning tool (47 items), and evaluation (2 items). A city’s housing plan quality was determined by scoring each objective found in the city’s 1998–2005 housing plan using the protocol items (0 = item not present, 1 = present). Audience measures whether the objective identified one of the six special needs households (SPN HH; i.e., the disabled, farm workers, female-headed households, the homeless, large families, and seniors) as well as low-income households in contrast to first-time homebuyers, infrastructure, or all households (e.g., none of the above, EE HH). The Housing Element Law neither specifies first-time homebuyers as special needs households nor requires planning objectives for their housing needs. Therefore, this audience type was included in EE HH. In addition, Shlay argued that homeownership places low-income households into risk due to the household’s lack of financial information and capital [91]. Housing program measures whether the objective advanced a construction, rehabilitation, preservation, or tangential (e.g., supporting fair housing, engaging in partnerships, lobbying congress) outcome. Planning tool measures whether the objective identified any planning tool to facilitate low-income housing.
Evaluation measures whether the objective identified a measurable quantitative target. As per the law, housing plans must implement actions during the planning period and may indicate “that certain programs are ongoing” [40], § 65583 (c), italics added. The City of Lincoln, for example, will assist 10 “elderly homeowners in rehabilitating their homes to address health and safety repairs, accessibility needs, and energy efficiency” [92] (p. 18). In ongoing contrast, Lincoln will “continue to require environmental reviews on residential development proposals to assess potential impacts as a result of future development” [92] (p. 13). The Appendix contains the protocol operations for the above objectives.
The protocol was pretested on a sample of 1998–2005 housing plans. The pretest indicated that a single objective might identify multiple audience, housing program, and planning tool items. The non-mutually exclusive response issue was resolved by expanding the protocol, creating proportional scoring, and devising nested quality measures that measured multiple interpretations of the law (i.e., narrow, wide, and widest interpretations). As content analysis research, this study employed a latent approach (qualitative) in order to determine whether the protocol’s criteria have been satisfied and a manifest approach (quantitative) due to the scoring [93] (p. 17). To increase the study’s reliability and validity, a trained graduate student coded roughly 40% (or 17/43) of the housing plans using NVivo, a software program for analyzing qualitative data. This study’s coding agreement is as follows: overall percentage agreement at 99.8%, Cohen’s Kappa at 89.8%, and Krippendorff’s Alpha at 90.3%. These statistics can be interpreted as strong agreement [39,94,95,96]. Please note that the NVivo program employs two methods for coding documents: by text and by image. By text means that NVivo reads the document’s text. By image means that NVivo reads squares (or regions) drawn on the document. In this study, the housing plans were created prior to the usage of Adobe Acrobat, so NVivo treated the scanned documents as images. When calculating Cohen’s Kappa, NVivo treats images differently than text. Therefore, some protocol items received Kappa statistics below 80%. I did not discover this program anomaly until after completing coding the housing elements and speaking with an NVivo consultant. In addition, scholars with extensive housing plan knowledge reviewed the protocol and their feedback was incorporated into the protocol and proportional scoring. The protocol lists each item, the item’s various coding agreements, and can be found as a supplemental file on this publisher’s website.
Due to the non-mutually exclusive responses, two mitigations were enacted: proportional scoring and nested quality measures. Regarding the proportional scoring, in the City of Marysville, for example, 40.4% of the audience items identified a special needs household (SPN HH; 40.4% × 10 = 4.04). Regarding the SPN HH housing program items, 27.3% were construction, 10.9% were rehabilitation, 5.4% were preservation, and 0% were tangential (43.6% × 10 = 4.36). Regarding the planning tools items, 38.7% identified a SPN HH (38.7% × 10 = 3.87). Regarding the SPN HH evaluation items, 30.8% identified quantitative targets and 9.6% identified ongoing targets (40.4% × 10 = 4.04).
Regarding the nested quality measures, Table 1 describes how the protocol items fit into three measures that test narrow, wide, and widest interpretations of the Housing Element Law. The variable QNRW serves as the narrow interpretation and contains only the SPN HH identifications for audience, housing programs, planning tools, and quantitative items. The variable QWDE serves as the wide interpretation, employs QNRW as a base, adds the SPN HH tangential programming and ongoing items, and adds the planning tools items for first-time homebuyers. The variable QWDST serves as the widest interpretation, employs QWDE as a base, and adds the first-time homebuyers’ identifications for audience, housing programs, and evaluation items. All quality measures had a maximum of 40 points. Marysville’s respective narrow, wide, and widest quality scores were 15.4, 16.5, and 16.9 points. T-tests indicated that the sample’s QNRW, QWDE, and QWDST means were unequal (p-value > 0.001 for all tests).
The first research question (how do cities from the Los Angeles and Sacramento regions accommodate low-income housing needs?) was answered using a descriptive analysis of the objectives. The second research question (does the quality of a city’s housing plan influence the city’s low-income housing production?) was answered using negative binomial regression. Negative binomial was selected due to its ability to handle zeros, its goodness of fit measures (e.g., AIC, Log Likelihood), its flexibility in testing variables with a large range of measures, and its usage in other planning studies [97,98,99,100]. The response variable was each city’s low-income housing production for the years of 1998–2005 (LIH), which reflects 8 years of city effort. The variable LIH was identified by obtaining a city’s 2006–2014 housing plan and examining the plan’s evaluation of the 1998–2005 planning period. California does not maintain any database of housing units associated with housing plans [101]. LIH is continuous data; however, the sample (n = 43) contains seven cities in which LIH is zero. The experimental variables QNRW, QWDE, and QWDST are derived from the coding of the 1998–2005 housing plans.
The control variables reflect the sample’s spatial, fiscal, regional, and population conditions and came from the regional COGs (e.g., SACOG, SCAG), California state agencies (e.g., the State Controller’s Office, CASCO; CAHCD), and federal agencies (e.g., the U.S. Bureau of the Census, CENSUS; HUD). The variable Compliance measures whether a city’s housing plan annually complies with the Housing Element Law as determined by CAHCD. The variable Consultant measures whether a city’s 1998–2005 housing plan was created by private consultants as indicated by the plan (no = 0, yes = 1). Due to the complexity of the Housing Element Law, many cities hire private consultants to complete their housing plans. The variable Noncentral City measures whether a city is a central city in order to observe the different levels of low-income housing production (no = 0, yes = 1). To account for variation in income, the variable Household Income measures the city’s median household income, as low-income households should expend no more than 30% of their income on housing (Year 2000; CENSUS).
Because low-income housing is often associated with federal programs (e.g., Community Development Block Grants, Emergency Shelter Funds, Housing for People with Aids, Housing Choice Vouchers), the variable HUD Entitlement City measures whether a city is directly eligible for HUD funds (Year 2000 population greater than 50,000 persons: no = 0, yes = 0; CENSUS). The variable Region measures each city’s location (LAX = 0, SAC = 1). Lastly, the variable Sales Tax measures the city’s annual sales tax revenue as a proportion of total annual revenue (CASCO). Under California’s Bradley-Burns Act, the state returns a percentage of sales tax revenue to cities and counties for discretionary spending [102]. What is important about Sales Tax is that (a) its creation is influenced by municipal land-use policy to zone land for commercial uses; (b) the annual proportion of the returned tax to total municipal revenue may be as low as 5% or as high as 60%; and (c) the amount returned to municipalities may fluctuate from year to year. Table 2 summarizes the data and the Appendix lists the sample cities and their quality measures as well as data references.
To determine the best model, various models were tested with LIH (e.g., logged, not logged, as a share of allocated low-income housing needs, as a share of total residential permits). LIH (not logged) was selected because either the models did not statistically converge or no predicting variable was statistically significant. The variable Household Income was transformed by dividing each value by 1000 to ease interpretation and the Compliance and Sales Tax measures were averaged from 1998–2005. The results section includes the expected counts of selected variables. The expected counts were calculated by using the subject variable’s values (e.g., if dichotomous, then 0 or 1; if continuous, then min, max, and mean) and the means of the other predicting variables multiplied by the model’s coefficients. Due to a lack of significance, the following variables were excluded: Adjacent Cities (quantity of cities spatially contiguous to the examined city; SACOG/SCAG), City Revenue (annual revenues; CASCO), Distance (distance between the central and noncentral city halls; SACOG/SCAG), Population (Year 2000 population; CENSUS), and Subsidy (has a redevelopment agency; CASCO). For all regression tests, multicollinearity was not detected (e.g., Variance-Inflation statistics < 2) [103].
5. Results
5.1. How Did Cities from the Los Angeles and Sacramento Regions Accommodate Low-Income Housing Needs?
The analysis of 43 housing plans indicates that overall, the plans averaged 31.8 objectives per document (Min: 7, SD: 23.23), with Sacramento, Davis, and Los Angeles, respectively, containing the most objectives at 92, 109, and 114. While scholars and planners might expect many objectives from the large urban central cities, Davis is notable due to its growth boundary, residential permit quotas, and inclusionary zoning [104]. The subsequent analysis of each protocol theme will reference the special needs households (SPN HH) in relationship to everyone else (EE HH: all households, first-time homebuyers, infrastructure) and, when warranted, the individual audience types.
5.1.1. Audience
The audience analysis in Table 3 indicates that overall, the planners attended to low-income housing needs, as 59% (or 910/1533) of the objectives identified the SPN HHs versus 41% (or 643/1553) for the EE HHs. The dominance of the SPN HHs also suggests that the planners adhered to fair-share proportions because the sample’s overall audience proportions synchronized with the sample’s overall housing allocation (roughly SPN HHs at 60%, EE HHs at 40%). Disaggregating the identification of the SPN HH items indicates that the low-income households led at 38.1%, then the homeless at 7%, seniors at 6%, the disabled at 5%, and closing with large-families, farmworkers, and female-headed households at 1% or less.
5.1.2. Programs
The housing program analysis in Table 4 indicates that, overall, planners continued their emphasis on low-income housing, as the SPN HHs led in construction, rehabilitation, and preservation programming (ranging from 59% to 82% of items per program), whereas the EE HHs led in tangential programming (roughly 76%). The categories of preservation and tangential maintained the largest disparity between the SPN HHs and EE HHs (respective differences of 63% and 53%). Regarding preservation programs, the objectives identifying the SPN HHs consistently specified maintaining each city’s supply of housing vouchers and/or monitoring private low-income housing contracts, whereas the preservation objectives that identified EE HHs specified implementing code enforcement, historic preservation, and/or adaptive reuse and may actually increase home values, for example. The dual interpretations of preservation stems from the dual definitions of preservation in California’s law. For many cities, section 65,583 of the law provides a wide interpretation of preservation, as noted below:
“The housing element shall consist of an identification and analysis of existing and projected housing needs and a statement of goals, policies, quantified objectives, financial resources, and scheduled programs for the preservation, improvement, and development of housing.”
A key point of the above passage is that a household’s income is not tied to preservation. Therefore, the creation of a historic district, the issuing of CDBG funds for preserving historic homes, or the promotion of California’s Mills Act (tax reductions for owners of historic properties) suffices as preservation. Alternatively, California’s Housing Element Law specifically ties preservation to low-income households. For example, § 65583 (c) (6) of the law requires that the housing plan identify objectives that will:
“preserve for lower income households the assisted housing developments [that are may change from low-income housing uses during the next 10 years due to termination of subsidy contracts, mortgage prepayment, or expiration of restrictions on use. The program for preservation of the assisted housing developments shall utilize, to the extent necessary, all available federal, state, and local financing and subsidy programs…”
Quite simply, the law allows a city to implement non-overlapping definitions of preservation. Regarding tangential programs, the objectives identifying the EE HHs consistently specified second mortgages (for first-time homebuyers) and capital improvements, whereas the tangential objectives identifying the SPN HHs specified the planning process, including conducting a study on seniors, lobbying funding agencies, and expending redevelopment funds. Table A2 quantitatively lists the audience types by housing program.
5.1.3. Planning Tools
The planning tool analysis in Table 5 indicates that, overall, the planners applied 47 planning tools to facilitate housing production, reflecting not only each city’s conditions (urban, suburban, rural) but also variation in overall housing needs. The tools ranged from land-use (zoning, design review, historic preservation, TOD), to entitlements (permit streamlining, development standards, nonconforming development), to policy consideration (inclusionary housing, workforce housing, impact fees, rent control). Table 5 indicates that zoning was the most frequently identified tool at 15% (or 299/1978).
Regarding low-income housing needs, more tools addressed the SPN HHs (n = 1133) than the EE HHs (n = 845). On average, the housing plans applied roughly 11 planning tools to facilitate low-income housing (min: 2, max: 23, SD: 4.25). Table 6 ranks the top 20 low-income housing tools, with residential rehabilitation leading at roughly 16%, then zoning at 15%, transitional housing at 10%, sites/density at 7%, and density bonus and development standards at 6% each. The top 20 list also contains six planning tools identified by Aurand [67]. Patterns emerged between certain tools and the SPN HHs. The application of transitional housing (n = 115) primarily benefited the homeless (73% or 84%) and the disabled (15% or 17%). To accommodate senior housing needs (n = 128), the municipalities applied residential rehabilitation to facilitate aging in place (15% or 19%), zoning overlays (13% or 16%), and density bonuses (12% or 15%).
5.1.4. Evaluation
The evaluation analysis in Table 7 indicates that, overall, the planners specified a balance of quantitative and ongoing objectives to facilitate overall housing production (respectively 49% and 51%) and low-income housing (respectively 52% and 48%). Of the total quantitative objectives (n = 767), nearly 63% (or 482) identified a SPN HH and specified measureable actions such as zone changes for increased density; ordinance adoptions to facilitate accessory dwellings; feasibility studies on inclusionary housing, impact fees, or rent control; and/or targets for rehabilitated homes. Of the total ongoing objectives (n = 805), nearly 55% (or 444) identified the SPN HHs and pledged to continue to offer density bonuses, waived fees, and/or modified development standards. Of the ten audience categories, the disabled objectives were remarkably unbalanced with roughly 69% as quantitatively measurable and 31% as ongoing. This imbalance reflected planners responding to the passage of SB 520, which required the immediate modification of residential development standards in order to provide reasonable accommodation as well as completing zone changes to permit group homes [105]. Lastly, balance is good, but in this phenomena balance in evaluation means that roughly 51% (or 805/1572) of housing plan implementation cannot support a critical evaluation.
In summary, the planners heeded California’s fair-share goals by committing extensive planning on behalf of low-income households. Table 8 indicates that roughly 60% of allocated housing needs should accommodate low-income households. The quality measures listed in Table 2 indicates that on average, the three quality measures ranged from roughly 21 to 26 points. Since the maximum quality score is 40 points, these rough averages indicate that between 53% to 65% of planning implementation addressed low-income housing needs, which closely syncs with the overall housing allocation that roughly specifies 60% low-income housing needs and 40% market rate housing needs. Second, the planners designated construction as the primary program for accommodating low-income housing needs, combating NIMBYism. Third, the planners applied a variety of planning tools to facilitate low-income housing. Finally, the planners identified specific tasks for facilitating low-income housing. While these points are quite positive, some issues linger.
With the multiplicity of housing programs, planning tools, and ongoing objectives, one could argue that multiplicity provides planners with a wide berth for satisfying low-income housing needs. California allows small cities (e.g., Bradbury, Colfax, Irwindale, or South Pasadena) to accommodate housing needs in a manner that reflects their size, spatial location, housing market conditions, and/or planning capacity. The housing programs from small cities might be similar to those from medium-sized cities (e.g., Davis, Duarte, La Puente, Rocklin, or Roseville) and significantly different from the housing programs from the cities of Los Angeles and Sacramento. This is the strength of California’s Housing Element Law; the law does not impose a one-size-fits-all prescription.
Alternatively, one could argue that the multiplicity of housing programs, planning tools, and objectives represents a scattershot approach to planning. These housing plans might symbolize empty promises in order to achieve compliance because California does not impose a penalty, require implementation of the construction, rehabilitation, and preservation objectives, or evaluates housing production. Furthermore, this culpability extends to private consultants, who created roughly 70% (or 30/43) of the plans. As noted by one planner when interviewed by Goetz et al. “I couldn’t have told you that was in the plan. Sounds like one of those great consultant ideas” [77] (p. 220). In closing, the planners from these Los Angeles and California region cities facilitated low-income housing using a very wide interpretation of California’s Housing Element Law; however, would a focused approach have been more successful? Table 8 also indicates that the sample constructed roughly 40% of its overall low-income housing needs in contrast to constructing 162% of its overall market-rate housing needs.
5.2. Did Quality Influence Low-Income Housing Production?
As a solitary predictor, the negative binomial regression analysis (see the Appendix) indicates that the quality measures (i.e., QNRW, QWDE, or QWDST) maintained no statistical relationship with low-income housing production. Quality’s solitary failure was not surprising given a preliminary correlation analysis (see the Appendix). However, the negative binomial regression analysis in Table 9 indicates that the quality measures maintained a statistical relationship with low-income housing when a city’s other conditions are taken into consideration. Quite simply, the quality of the housing plan is not enough to create low-income housing, but in this sample, the city’s planning (Compliance), location (Noncentral City, Region), land-use (Sales Tax), and population (HUD Entitlement City) play important contributing roles. Because the sample contains the cities of Los Angeles and Sacramento, models were run without these cities and all variables remained statistically significant (excepting Noncentral City, which was eliminated). In addition, the ranges of the expected counts did not significantly decrease with the exclusion of the central cities. Models 1–3 test three interpretations of California’s law. However, model 3 (i.e., widest interpretation) is closest to how the cities create their housing plans. Therefore, the following discussion reflects the estimates and expected counts of model 3.
Regarding the quality measures, the model 3 estimates indicate that the widest interpretation of California’s Housing Element Law maintains the strongest relationship between quality measures and low-income housing production. For the variable QWDST, and when all variables are held constant, a city’s expected low-income housing production should be at least 429 units if that city has a QWDST score near 26.11 points. In this sample, 29 cities maintained QWDST scores that were within one standard deviation of the mean; however, only 10 cities produced low-income unit in excess of 429 units. The average QWDST scores of those 10 cities was roughly 25.78 points (in keeping with the mean), but two cities stood out. The city of Sacramento produced 7358 low-income units but maintained a low QWDST score of 14.13 points. In contrast, the city of El Monte maintained a high QWDST score of 34.83 points and only produced 495 low-income units. These examples illustrate the variation in housing plan quality and low-income housing production. Quality may contribute to low-income housing, but it may not be the most influential factor.
For the variable Compliance, and when all other variables are held constant, a city’s expected low-income housing production should be at least 429 units if that city’s housing plan was for 70% (or 5.6 of 8 years) of the planning period. While this study did not observe the adoption year of each housing plan, it is not uncommon for a city to obtain compliance during the last year of its planning period {108]. Thus, the longer the plan is in compliance, the more likely that the plan may be positively associated with increases in low-income housing. Regarding Noncentral City, and when all other variables are held constant at their means, the sample’s suburban and rural cities will have significantly lower low-income housing production (358 units) than the central cities (4915 units).
Regarding HUD Entitlement City, and when all other variables are held constant, when a city’s year 2000 population was over 50,000 persons, then that city should expect a low-income housing production of at least 3301 units. Noting that the cities of Los Angeles and Sacramento have significantly higher production (i.e., 11,674 and 7358, respectively), a model excluding those large cities indicates that a HUD Entitlement City should expect roughly 3046 low-income units. In essence, entitlement status may not only signal population but also greater access to federal programs that increase low-income housing. In their reporting of low-income units (and California’s acceptance of the housing plan), the cities do not quibble about whether HUD programs, federal and state tax credits, local redevelopment funds, or private organizations such a Habitat for Humanity facilitated the low-income units. Quite simply, a low-income unit was constructed within the city.
Regarding Sales Tax, cities not relying on this revenue (e.g., minimum at 1%) will have higher low-income production (e.g., 1581 units) than cities relying on this revenue (e.g., maximum at 66%, 81 low-income units) because sales tax requires commercial land-use, not residential land-use. The sample’s cities with Sales Tax proportions of 50% and higher include Colfax, Duarte, Industry, Marysville, South El Monte, and Yuba City. This six-city subgroup maintained low populations (subgroup average of roughly 15,600 persons) and a lower than average QWDST scores (roughly 20 points). Furthermore, four of these cities produced zero low-income units. As noted by Steinacker, a city’s pursuit of economic development and low-income housing may conflict with cities preference for increased revenues over increased service needs [108].
Regarding Region, the Sacramento region cities’ low-income housing production should be 1247 low-income units higher than that of the Los Angeles region cities. Three factors contributed to this location increase. First, the cities of Lincoln, Rocklin, and Roseville increased their regulatory footprints by annexing sphere of influence farmland into subdivisions and by requiring that those areas set aside low-income housing. Second, the City of Davis annually restricts market-rate housing production with quotas but exempts low-income housing production. Consequently, Davis produced 1309 low-income housing units in the study period, which was roughly 5.5% of its year 2000 housing inventory of 23,611 units. The same respective proportions for the city of Sacramento was 4.5% (or 7538/163,914) in contrast to 0.8% (or 11,674/1,335,668) for the city of Los Angeles. Third, SACOG proposed state legislation in 2003 to create a voluntary regional inclusionary housing program. The Regional Compact for Production of Affordable Housing (Assembly Bill AB 1426, session 2003–2004 [109]) would have required that 10% of new housing units to be set aside as low-income housing units (i.e., construction or rehabilitation) and provided up to 13 million dollars in subsidies. By September 2004, 17 cities had joined this proposed program before the legislation received the governor’s veto [110].
In summary, the inferential analysis has significant findings, but they are limited to the sample. First, and when independent, quality has no association with low-income housing production, but when quality is combined other city conditions, it maintains a positive association with low-income housing. Second, there were regional differences in low-income housing production, as the Sacramento region cities had higher production than the Los Angeles region cities. A key factor was that Sacramento region cities had access to vacant land for expansion, whereas the Los Angeles region cites are confined. Third, the suburban and rural cities had a lower production of low-income units than the central cities. This difference could be expected given the central cities’ population and planning capacity (e.g., number objectives in their plans, including the efforts of other agencies). Fourth, a city’s pursuit of increased sale tax revenue may decrease the viability of low-income housing production. Lastly, the central cities may have influenced the inferential analysis; however, the removal of the central cities indicated that there was no major change in either a variable’s significance or the quantities in the expected counts.
6. Discussion
The Impact and Meaning of Quality
The purpose of this study was to explore whether the quality of a plan influences the plan’s intended outcome and whether a plan’s quality advances equity. In this examination of California’s Housing Element Law, there are two research questions. First, how do cities from the Los Angeles and Sacramento regions accommodate low-income housing needs? The analysis of housing plans from a nonrandom sample of cities indicates that the plans’ content synchronized with the sample’s fair-share housing allocation, with roughly 60% of content addressing low-income housing needs. Regarding housing programs (e.g., construction, rehabilitation, and preservation), these cities placed low-income households at the forefront, with the construction of new low-income units taking the lead. The construction preference indicates that these cities heeded California’s mandate to increase the housing options for low-income households. The construction preference is also notable, as planning literature is redolent with communities opposing any increase in low-income housing [111]. The planning tool data indicates that these cities preferred to facilitate low-income residential rehabilitation. One caution is that rehabilitation may trigger a tax reassessment unless a homeowner is certified as disabled [112]. The planning tool data also indicates that planners deliberated about selecting the appropriate tool for their community’s unique context. Alternatively, the multiple planning tools also signal that there was no silver bullet for facilitating low-income housing. Lastly, the balanced proportion of quantitative and ongoing objectives meant that nearly 50% of the sample’s implementation could not support critical evaluation. This omission short-circuits feedback necessary for local and state housing policy reform.
The second research question was does the quality of a city’s housing plan influence the city’s low-income housing production? The analysis indicates that, independently, a housing plan’s quality maintains no association with low-income housing production for these cities. However, when quality is coupled with other city conditions, such as the plan’s compliance with California’s housing laws, the city’s HUD status, or location (e.g., region or suburban/rural), these conditions are associated with increases in low-income housing. By contrast, a city’s economic decision to rely on sales tax revenue is associated with reduced low-income housing production. Collectively, these associations indicate that a housing plan’s quality is one of many conditions that might influence a city’s inventory of low-income housing.
While this study is one of only a few studies that establishes a statistical association between quality and planning outcomes, there are two issues that should be addressed: the sample and the statistical test. Regarding the non-random sample, this study assessed housing plans from 43 cities in California’s Los Angeles and Sacramento regions. Because of the study’s intention to observe any differences in low-income housing production between dominant central cities and their suburbs, the sample included not only the state’s largest cities, Los Angeles and Sacramento, but also small cities such as Bradbury, Colfax, Wheatland, and San Marino. It was noted that the central cities of Los Angeles and Sacramento were outliers not only in housing objectives but also in low-income housing production in comparison to the other sample cities. For example, the city of Los Angeles produced nearly as many low-income units as all the suburbs combined (e.g., 11,674 units vs. 12,637 units, respectively). In the other quality housing studies discussed in the literature review, the scholars paid very little attention to the size of cities. For example, the sample and population sizes in Jun’s assessment of plans from 58 cities in the Atlanta and Detroit regions and Brody’s assessment of plans from 60 cities in the states of Florida and Washington are unknown [3,16]. By contrast, Connerly and Mueller intentionally analyzed housing plans from large and small Florida cities and counties [65]. Had any of those studies conducted inferential tests with housing production data, would the authors have included the large central cities? Would the authors have pursued a random sample, a stratified random sample, or a non-random sample? Each of those decisions would yield results, but they would require measures of caution in the interpretation of the analysis.
Regarding the statistical test, a few issues should be noted. First, the inclusion of the central cities had the potential to skew the inferential analysis; however, models examined without the central cities indicated that the estimates did not dramatically change. Second, a more robust inferential analysis would have had a larger sample size. While the quality method is easy to understand and implement, quality studies seem to rest at sample sizes of 60 or 30 plans, or even smaller. These small sizes may limit the application of more sensitive statistical tests. Therefore, does a descriptive analysis of a plan’s content suffice as noteworthy scholarship? Without linking the plan’s aims to the plan’s outcomes, the study may contribute to scholarship and hinder the planner’s ability to reform policy.
Regarding the purpose and the aims of this study, quality was found to influence planning outcomes and advance equity. This study found that planners attempted to achieve California’s vision for housing equity, as 60% of housing plan content addressed low-income housing needs. This simple statistic demonstrates that fair-share planning principles can drive planning equity and direction. Therefore, what should quality mean to planners? Before we sound the trumpets, this study, like the other quality scholarship, assessed the plans post adoption and therefore missed an opportunity to revise local housing policy. Second, this is only one study that links planning aims and planning outcomes. While this study succeeded in detecting associations, the success rests on a non-random sample. More studies are needed to confirm the influence of quality. A statistical relationship between plan content and low-income housing was detected in this sample, but what about the quality discourse’s other focus areas, such as disaster planning, environmental mediation, transportation, climate change, and/or sustainability? While quality has illuminated plan content in these other areas, can any of that plan content systematically influence the planning outcomes? Scholars should raise the bar and investigate.
As scholars, our purpose is to describe, investigate, and test phenomena to increase our collective knowledge as well as improve planning implementation and education. In this study, quality illuminated plan content and aided in the explanation of low-income housing production. However, in quality’s current iteration (i.e., post hoc assessments), the method is too removed from actual implementation. Too many quality scholars do not evaluate outcomes. In its initial years, quality provided valuable insights on plan content and, by extension, planning behavior. Twenty years later, quality scholars must deepen quality’s epistemology.
How should scholars and planners view quality? While popular, quality is neither theory nor meta-theory. Meta-theory is “the philosophy behind the theory, the fundamental set of ideas about how phenomena of interest in a particular field should be thought about and researched” [113] (p. 2). Bates positioned meta-theory as a connective tissue that links models to theory, with meta-theory as less robust than Kuhn’s paradigms [114] (p. 64). At present, quality is an uncultivated model that only describes planning outputs, the plans. To deepen quality, scholars must not only descriptively assess plans but also test the influence of quality on planning outcomes. It is safe to say that quality is not embedded in planning practice. Planners may aspire to create plans that satisfy the requirements of local codes and state mandates, but none of the reviewed research indicates that planners strive for quality plans using the scholar definition of quality. If scholars want quality to matter to planners, then scholars must demonstrate that quality has influence. Given the recent storms in Florida, Texas, and Puerto Rico, it behooves scholars to link quality, a plan’s performance, and a locale’s outcomes.
In a symposium, Dyckman argued that the principal use of theory is to explain or justify institutionalized planning and thus exhorted, “the planner must have a theory of action and decision that [she] can use to defend [the] intervention” [115] (p. 229). This quality study established a connection between planning processes and planning outcomes and found other conditions that were as influential. This paper calls for more empirical quality studies. Scholars considering a quality study should test quality against an outcome related to a plan. Scholars who have completed a quality study can and should retrospectively test quality against an outcome related to the plan’s intended aims.
If future research can determine that quality does influence outcomes, then quality should be included in planning education and serve as a method for assessing draft plans to engage both planners and decision makers [6]. Under this new paradigm, when a planner creates a comprehensive, affordable housing, climate action, or transportation plan, the planner should be able to (a) assess a plan’s goals, facts, and implementation policies and then (b) determine how well that content addresses the plan’s intended outcome. If there is low quality, then the planner should revise the plan before the plan’s adoption and subsequent implementation. Assessing draft plans may improve outcome delivery and provide a stronger link between planning scholarship and practice. By shifting quality to empiricism, scholars include planners by acknowledging that planners, plans, and outcomes inspire our scholarship [116] (pp. 246–247).
Supplementary Materials
The following are available online at https://www.mdpi.com/2413-8851/2/1/1, Supplementary 1: Protocol for testing the influence of housing plan quality on low-income housing production, Supplementary 2: Appendix Data References. The data examined in this study is available online at http://scholarworks.umass.edu/data/4/.
Acknowledgments
I would like to thank Kristen Eschenfelder and Carolyn Heinrich for conceptual guidance; Katrin Anacker, Andrew Aurand, Victoria Basolo, Lorraine Cordeiro, Ed Goetz, Kirk McClure, Lindiwe Sibeko, and J. Brenton Stewart for critical (but helpful) comments on early drafts; Matt Ogborn and Carin McCormack for editorial assistance; Jackie Stein and Sue Bullen for NVivo assistance; David Graham Nichols for a visiting appointment at the University of Melbourne; Desiree Demski-Hamlin for coding assistance, Jessica Pearlman for statistical assistance, and the four anonymous reviewers for their invaluable comments. This research was funding in part by a Faculty Excellence Grant given by the UMass Amherst Department of Landscape Architecture and Regional Planning. Lastly, any errors in this research are my own.
Conflicts of Interest
The author declares no conflict of interest.
Appendix A

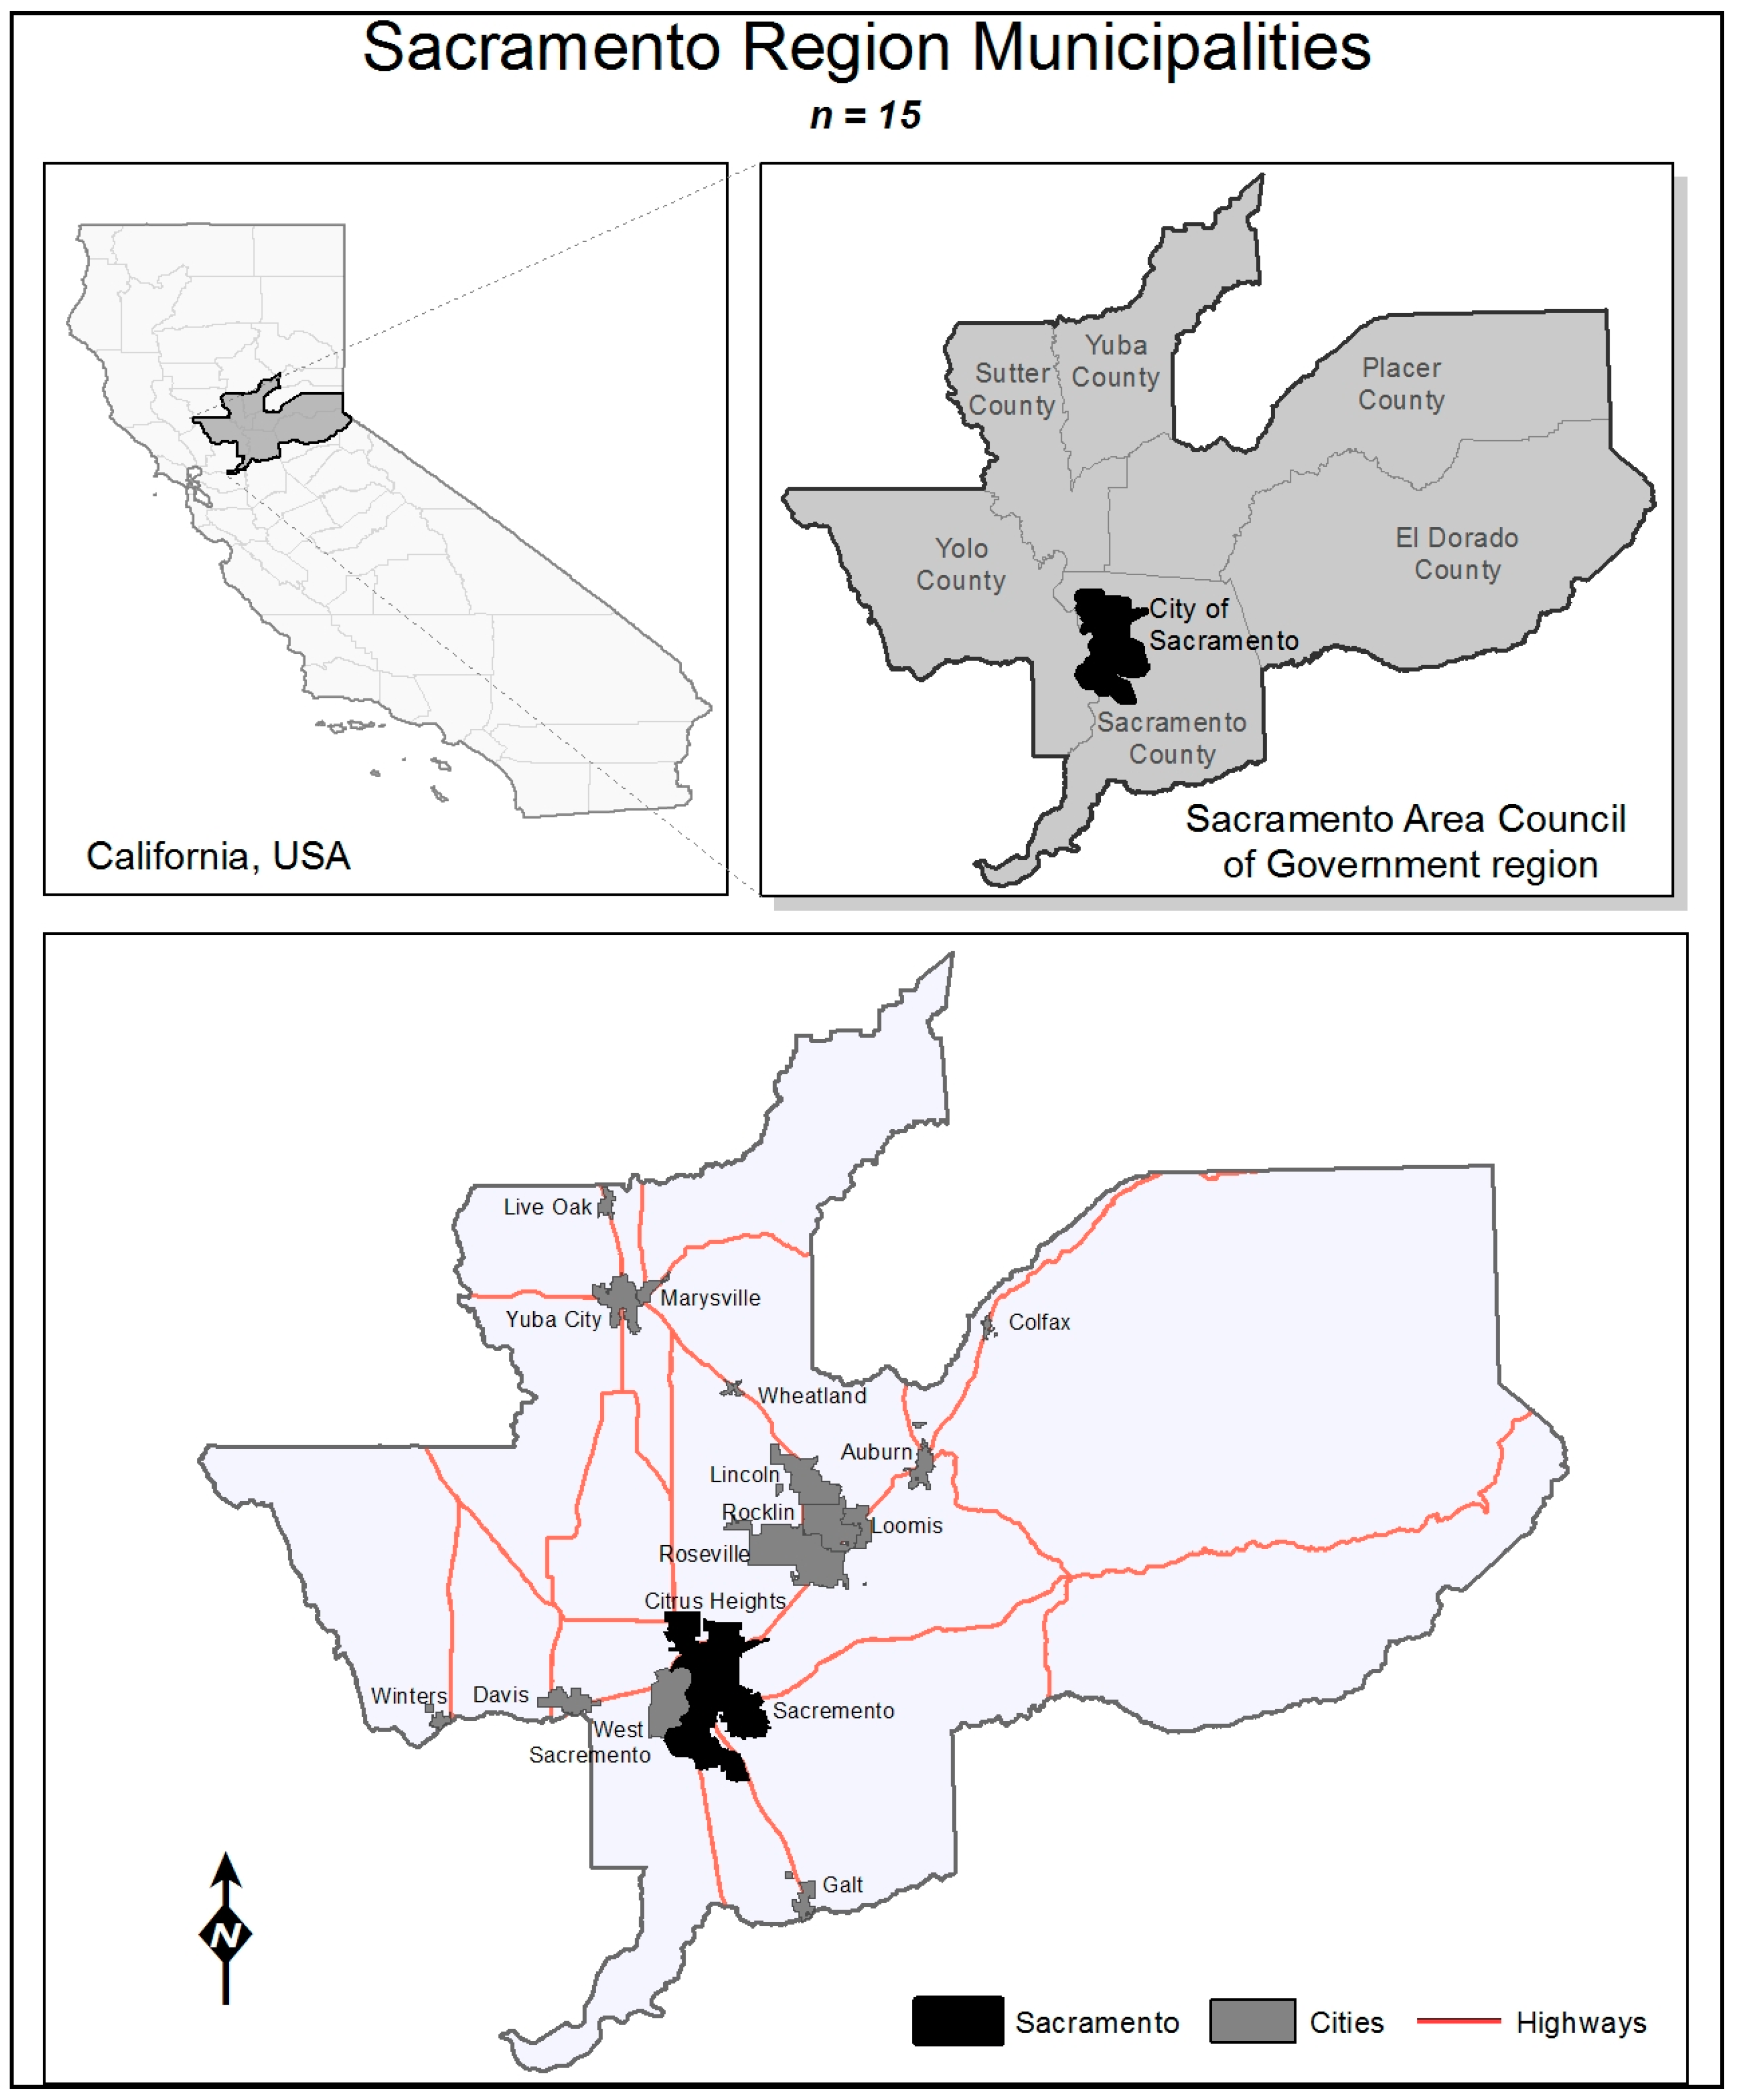
Table A1.
Components of the plan quality measures. This table demonstrates how two objectives were assessed by the items in the protocol.
Table A1.
Components of the plan quality measures. This table demonstrates how two objectives were assessed by the items in the protocol.
| Objective | Audience | Program | Planning Tool | Evaluation |
|---|---|---|---|---|
| Assist [10] elderly homeowners in rehabilitating their homes to address health and safety repairs, accessibility needs, and energy efficiency improvements. | Seniors | Rehabilitation | Residential Rehabilitation; Universal Building Code, Energy Standards, or Title 24 Building Code | Measurable |
| Continue to require environmental reviews on residential development proposals to assess potential impacts as a result of future development. | All Households | Construction | California Environmental Quality Act; Zoning | Ongoing |
Table A2.
Audience types by housing programs. Excepting first-time homebuyers, construction was the most identified housing program for the audience types.
Table A2.
Audience types by housing programs. Excepting first-time homebuyers, construction was the most identified housing program for the audience types.
| Rank | Audience | Construction | Rehabilitation | Preservation | Tangential | Total |
|---|---|---|---|---|---|---|
| 1 | Low-income Households | 311 | 158 | 173 | 20 | 662 |
| 2 | All Households | 307 | 135 | 53 | 90 | 585 |
| 3 | Homeless | 49 | 6 | 43 | 19 | 117 |
| 4 | Seniors | 62 | 21 | 17 | 6 | 106 |
| 5 | The Disabled | 56 | 21 | 12 | 7 | 96 |
| 6 | First-time Home Buyer | 9 | 8 | 3 | 73 | 93 |
| 7 | Infrastructure | 12 | 6 | 0 | 5 | 23 |
| 8 | Large Families | 16 | 3 | 1 | 0 | 20 |
| 9 | Farm Workers | 12 | 1 | 0 | 0 | 13 |
| 10 | Female-headed Households | 4 | 4 | 1 | 0 | 9 |
| Grand Total | 838 | 363 | 303 | 220 | 1724 |
Table A3.
Planning tools ranked by total identifications.
| Rank | Planning Tool | Total Identifications | Percentage | SPN HH | EE HH |
|---|---|---|---|---|---|
| 1 | Zoning | 299 | 15.1% | 167 | 132 |
| 2 | Residential Rehabilitation | 234 | 11.8% | 178 | 56 |
| 3 | Sites, Density * | 144 | 7.3% | 75 | 69 |
| 4 | Transitional Housing | 115 | 5.8% | 115 | 0 |
| 5 | Development Standards | 98 | 5.0% | 69 | 29 |
| 6 | Density Bonus | 77 | 3.9% | 72 | 5 |
| 7 | Permit Streamlining * | 69 | 3.5% | 27 | 42 |
| 8 | Code Enforcement | 62 | 3.1% | 2 | 60 |
| 9 | Infill or Vacant Land | 61 | 3.1% | 21 | 40 |
| 10 | Fair Housing | 57 | 2.9% | 2 | 55 |
| 11 | Universal Building Code, Energy Standards, Title 24 Building Code | 56 | 2.8% | 7 | 49 |
| 12 | Municipal Purchase or Write Down | 55 | 2.8% | 51 | 4 |
| 13 | Waived Fees * | 52 | 2.6% | 42 | 10 |
| 14 | Subsidy | 46 | 2.3% | 41 | 5 |
| 15 | Mobile or Manufactured Homes * | 45 | 2.3% | 24 | 21 |
| 16 | Mixed-use | 45 | 2.3% | 16 | 29 |
| 17 | Accessory Dwellings * | 41 | 2.1% | 20 | 21 |
| 18 | Inclusionary Housing * | 39 | 2.0% | 34 | 5 |
| 19 | Neighborhood Rehabilitation | 39 | 2.0% | 8 | 31 |
| 20 | Housing Element Monitoring * | 34 | 1.7% | 9 | 25 |
| 21 | Self-sufficiency | 33 | 1.7% | 33 | 0 |
| 22 | Relocation or Displacement Policies | 30 | 1.5% | 18 | 12 |
| 23 | Historic Preservation | 25 | 1.3% | 5 | 20 |
| 24 | Design Review | 24 | 1.2% | 8 | 16 |
| 25 | Capital Project | 23 | 1.2% | 3 | 20 |
| 26 | Specific Plan | 22 | 1.1% | 9 | 13 |
| 27 | Co-housing or Limited Equity Owners | 18 | 0.9% | 14 | 4 |
| 28 | Annexation, Tentative Map | 16 | 0.8% | 5 | 11 |
| 29 | Planned Unit Development | 13 | 0.7% | 7 | 6 |
| 30 | Fees | 13 | 0.7% | 5 | 8 |
| 31 | Condo Conversion * | 12 | 0.6% | 9 | 3 |
| 32 | Covenants | 11 | 0.6% | 11 | 0 |
| 33 | Citizen Participation | 11 | 0.6% | 2 | 9 |
| 34 | Transit-oriented Development | 10 | 0.5% | 1 | 9 |
| 35 | American Disabilities Act | 9 | 0.5% | 7 | 2 |
| 36 | Memorandum of Understanding, Housing Agreements | 7 | 0.4% | 3 | 4 |
| 37 | Nonconforming | 7 | 0.4% | 1 | 6 |
| 38 | Student Housing | 5 | 0.3% | 0 | 5 |
| 39 | Household Subsidy | 4 | 0.2% | 4 | 0 |
| 40 | Rent Control | 4 | 0.2% | 3 | 1 |
| 41 | Workforce Housing | 4 | 0.2% | 0 | 4 |
| 42 | Childcare Facilities | 2 | 0.1% | 2 | 0 |
| 43 | Reverse Mortgage | 2 | 0.1% | 2 | 0 |
| 44 | California Environmental Qualities Act | 2 | 0.1% | 0 | 2 |
| 45 | Single-room Occupancy | 1 | 0.1% | 1 | 0 |
| 46 | Growth Management | 1 | 0.1% | 0 | 1 |
| 47 | Tax Fines | 1 | 0.1% | 0 | 1 |
| 1978 | 100.0% | 1133 | 845 |
Note. * = Planning Tool identified by Aurand for facilitating low-income housing [67]. SPN HH = Special Needs Households, EE HH = Everyone Else Households.
Table A4.
Sample (Alphabetized). This table identifies the three quality scores and low-income housing production for each city.
Table A4.
Sample (Alphabetized). This table identifies the three quality scores and low-income housing production for each city.
| Row | City Name | QNRW | QWDE | QWDST | LIH |
|---|---|---|---|---|---|
| 1 | Alhambra | 23.508 | 27.702 | 30.371 | 239 |
| 2 | Arcadia | 23.608 | 29.148 | 31.690 | 6 |
| 3 | Auburn | 21.405 | 23.905 | 23.905 | 94 |
| 4 | Azusa | 21.511 | 26.174 | 30.206 | 119 |
| 5 | Baldwin Park | 24.189 | 26.258 | 28.308 | 202 |
| 6 | Bradbury | 6.250 | 10.000 | 10.000 | 9 |
| 7 | Claremont | 18.410 | 22.076 | 22.713 | 49 |
| 8 | Colfax | 18.601 | 20.964 | 21.712 | 7 |
| 9 | Davis | 21.388 | 24.203 | 24.459 | 1309 |
| 10 | Diamond Bar | 24.440 | 28.249 | 29.440 | 3 |
| 11 | Duarte | 31.761 | 33.428 | 33.428 | 97 |
| 12 | El Monte | 28.484 | 33.187 | 34.832 | 495 |
| 13 | Galt | 18.961 | 22.972 | 22.972 | 77 |
| 14 | Glendora | 18.975 | 21.702 | 24.370 | 0 |
| 15 | Industry | 14.603 | 19.048 | 19.048 | 0 |
| 16 | Irwindale | 24.482 | 24.482 | 24.482 | 20 |
| 17 | La Puente | 17.954 | 22.843 | 22.843 | 2 |
| 18 | La Verne | 26.765 | 33.430 | 35.033 | 110 |
| 19 | Lincoln | 19.663 | 21.249 | 21.798 | 2712 |
| 20 | Live Oak | 14.247 | 17.073 | 17.561 | 0 |
| 21 | Loomis | 18.506 | 21.172 | 21.172 | 13 |
| 22 | Los Angeles | 22.502 | 25.471 | 26.594 | 11,674 |
| 23 | Marysville | 15.357 | 16.510 | 16.885 | 0 |
| 24 | Monrovia | 18.441 | 21.738 | 25.107 | 69 |
| 25 | Monterey Park | 18.592 | 22.723 | 23.791 | 118 |
| 26 | Pasadena | 19.643 | 24.378 | 26.873 | 1119 |
| 27 | Pomona | 16.347 | 22.535 | 23.880 | 575 |
| 28 | Rocklin | 24.873 | 30.473 | 31.273 | 2961 |
| 29 | Rosemead | 27.726 | 32.395 | 35.173 | 72 |
| 30 | Roseville | 18.946 | 22.400 | 23.804 | 1101 |
| 31 | Sacramento | 11.313 | 13.933 | 14.132 | 7358 |
| 32 | San Dimas | 26.293 | 29.370 | 30.077 | 15 |
| 33 | San Gabriel | 22.804 | 28.476 | 30.254 | 64 |
| 34 | San Marino | 11.111 | 14.444 | 14.444 | 10 |
| 35 | South El Monte | 22.292 | 28.125 | 33.125 | 0 |
| 36 | South Pasadena | 29.505 | 34.721 | 37.968 | 3 |
| 37 | Temple City | 27.889 | 36.071 | 36.071 | 12 |
| 38 | Walnut | 21.957 | 29.155 | 33.338 | 116 |
| 39 | West Covina | 19.482 | 27.846 | 30.131 | 506 |
| 40 | West Sacramento | 19.487 | 24.636 | 25.163 | 275 |
| 41 | Wheatland | 25.245 | 27.073 | 27.073 | 0 |
| 42 | Winters | 19.986 | 25.017 | 25.017 | 58 |
| 43 | Yuba City | 18.718 | 21.909 | 22.339 | 0 |
| Minimum | 6.25 | 10.00 | 10.00 | 0 | |
| Maximum | 31.76 | 36.07 | 37.97 | 11,760 | |
| Mean | 20.84 | 24.85 | 26.11 | 736.50 |
Note. LIH = Low Income Housing Production from 1998–2005, QNRW = Narrow Interpretation of the Housing Element Law, QWDE = Wide Interpretation, QWDST = Widest Interpretation. Source: American Factfinder.
Table A5.
The negative binomial tests.
| Model 1 | Model 2 | Model 3 | |
|---|---|---|---|
| B (SE) Estimate | B (SE) Estimate | B (SE) Estimate | |
| (Intercept) | 7.815 *** | 8.352 *** | 8.518 *** |
| (1.426) | (1.516) | (1.435) | |
| QNRW | −0.060 | ||
| (0.066) | |||
| QWDE | −0.073 | ||
| (0.059) | |||
| QWDST | −0.077 | ||
| (0.535) | |||
| Observations | 43 | 43 | 43 |
| Log Likelihood | −532.692 | −532.127 | −531.861 |
| AIC | 538.69 | 538.13 | 537.86 |
| Response Variable | LIH | LIH | LIH |
Note. LIH = Low-Income Housing Production, SE = Standard Error, QNRW = Narrow Interpretation of the Housing Element Law, QWDE = Wide Interpretation, QWDST = Widest Interpretation. * p < 0.05, ** p < 0.01, *** p < 0.001.
Table A6.
Correlation between low-income housing production and the quality measures.
| Parameter | LIH | QNRW | QWDE | QWDST | |
|---|---|---|---|---|---|
| 1 | Low-income Housing Production | ----- | |||
| 2 | QNRW | −0.09 | ----- | ||
| 3 | QWDE | −0.12 | 0.95 * | ----- | |
| 4 | QWDST | −0.13 | 0.91 * | 0.98 * | ----- |
Notes: * p < 0.05. QNRW = Narrow Quality. QWDE = Wide Quality. QWDST = Widest Quality.
Figure A1.
Annual compliance of California and the sample cities. The period of study is from 1998 to 2005. source: [117].
Figure A1.
Annual compliance of California and the sample cities. The period of study is from 1998 to 2005. source: [117].
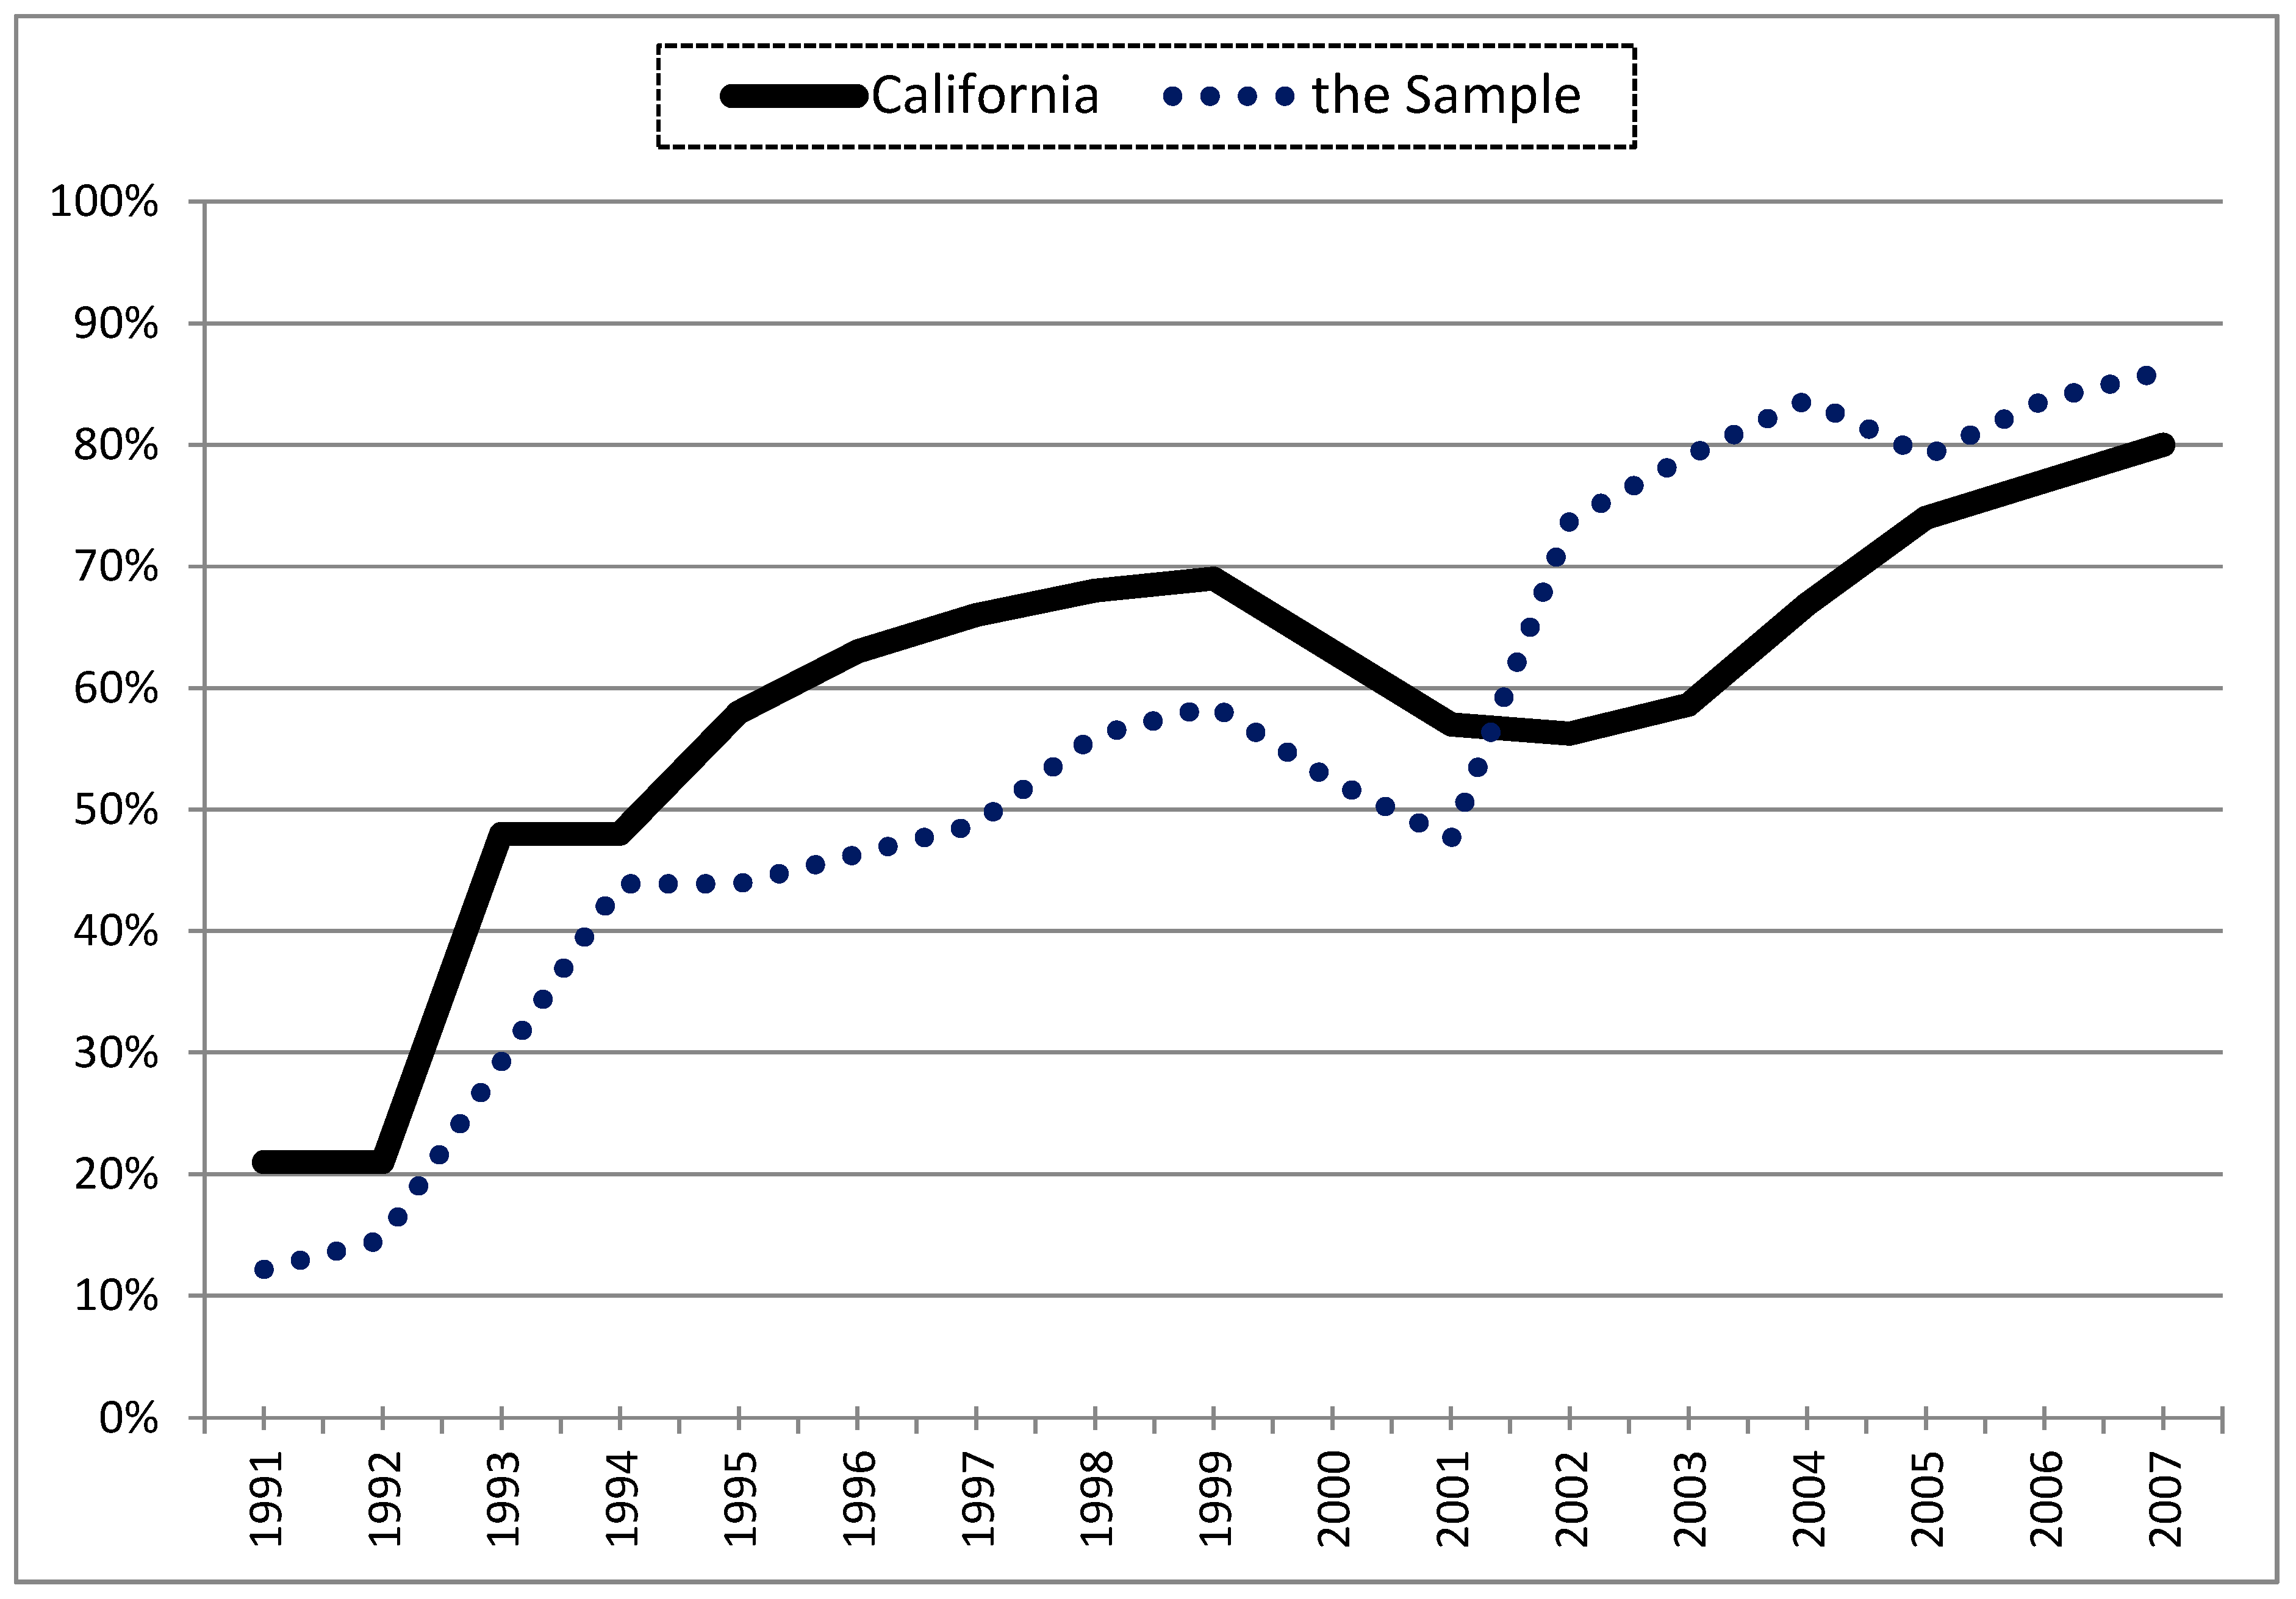
References and Notes
- Berke, P.R.; Godschalk, D.R. Searching for the good plan a meta-analysis of plan quality studies. J. Plan. Lit. 2009, 23, 227–240. [Google Scholar] [CrossRef]
- Lyles, W.; Stevens, M. Plan quality evaluation 1994–2012: Growth and contributions, limitations, and new directions. J. Plan. Educ. Res. 2014, 34, 433–450. [Google Scholar] [CrossRef]
- Jun, H.-J. The link between local comprehensive plans and housing affordability: A comparative study of the Atlanta and Detroit metropolitan areas. J. Am. Plan. Assoc. 2017, 83, 249–261. [Google Scholar] [CrossRef]
- Baer, W.C. General plan evaluation criteria: An approach to making better plans. J. Am. Plan. Assoc. 1997, 63, 329–344. [Google Scholar] [CrossRef]
- Wildavsky, A. If planning is everything, maybe it’s nothing. Policy Sci. 1973, 4, 127–153. [Google Scholar] [CrossRef]
- Faludi, A. Critical rationalism and planning methodology. Urban Stud. 1983, 20, 265–278. [Google Scholar] [CrossRef]
- Alexander, E.R. If planning isn’t everything, maybe it’s something. Town Plan. Rev. 1981, 52, 131–142. [Google Scholar] [CrossRef]
- Deyle, R.E.; Smith, R.A. Local government compliance with state planning mandates—The effects of state implementation in Florida. J. Am. Plan. Assoc. 1998, 64, 457–469. [Google Scholar] [CrossRef]
- Nguyen, M.T.; Basolo, V.; Tiwari, A. Opposition to affordable housing in the USA: Debate framing and the responses of local actors. Hous. Theory Soc. 2013, 30, 107–130. [Google Scholar] [CrossRef]
- Fainstein, S. New directions in planning theory. Urban Aff. Rev. 2000, 35, 451–478. [Google Scholar] [CrossRef]
- Berke, P.R.; French, S.P. The influence of state planning mandates on local plan quality. J. Plan. Educ. Res. 1994, 13, 237–250. [Google Scholar] [CrossRef]
- Berke, P.R.; Roenigk, D.J.; Kaiser, E.J.; Burby, R.J. Enhancing plan quality: Evaluating the role of state planning mandates for natural hazard mitigation. J. Environ. Plan. Manag. 1996, 39, 79–96. [Google Scholar] [CrossRef]
- Dalton, L.; Burby, R.J. Mandates, plans, and planners—Building local commitment to development management. J. Am. Plan. Assoc. 1994, 60, 444–461. [Google Scholar] [CrossRef]
- May, P.J.; Burby, R.J. Coercive versus cooperative policies: Comparing intergovernmental mandate performance. J. Policy Anal. Manag. 1996, 15, 171–201. [Google Scholar] [CrossRef]
- Hoch, C. How plan mandates work—Affordable housing in Illinois. J. Am. Plan. Assoc. 2007, 73, 86–99. [Google Scholar] [CrossRef]
- Brody, S.D. Are we learning to make better plans? A longitudinal analysis of plan quality associated with natural hazards. J. Plan. Educ. Res. 2003, 23, 191–201. [Google Scholar] [CrossRef]
- Friedmann, J. Retracking America: A Theory of Transactive Planning; Anchor Press: Garden City, NY, USA, 1973. [Google Scholar]
- Genskow, K.D.; Wood, D.M. Measurement, learning, and adaptation in planning and implementing voluntary nonpoint source watershed programs. J. Plan. Lit. 2009, 24, 137–154. [Google Scholar] [CrossRef]
- Berke, P.R.; Conroy, M.M. Are we planning for sustainable development? An evaluation of 30 comprehensive plans. J. Am. Plan. Assoc. 2000, 66, 21–33. [Google Scholar] [CrossRef]
- Edwards, M.M.; Haines, A. Evaluating smart growth—Implications for small communities. J. Plan. Educ. Res. 2007, 27, 49–64. [Google Scholar] [CrossRef]
- Jones, D.K.; Evenson, K.R.; Rodriguez, D.A.; Aytur, S.A. Addressing pedestrian safety: A content analysis of pedestrian master plans in north Carolina. Traffic Inj. Prev. 2010, 11, 57–65. [Google Scholar] [CrossRef] [PubMed]
- Kaiser, E.J.; Godschalk, D.R.; Chapin, F.S. Urban Land Use Planning; University of Illinois Press: Champaign, IL, USA, 1995. [Google Scholar]
- Burby, R.J.; Dalton, L.C. Plans can matter—The role of land-use plans and state planning Madnates in limiting the development of hazardous areas. Public Adm. Rev. 1994, 54, 229–238. [Google Scholar] [CrossRef]
- Burby, R.J.; Berke, P.R.; Dalton, L.C.; DeGrove, J.M.; French, S.P.; Kaiser, E.J.; Mary, P.J.; Roenigk, D.J. Is state-mandated planning effective? Land Use Law Zoning Dig. 1993, 45, 3–9. [Google Scholar] [CrossRef]
- Hsieh, H.F.; Shannon, S.E. Three approaches to qualitative content analysis. Qual. Health Res. 2005, 15, 1277–1288. [Google Scholar] [CrossRef] [PubMed]
- Forester, J. Critical theory and planning practice. J. Am. Plan. Assoc. 1980, 46, 275–286. [Google Scholar] [CrossRef]
- Talen, E. Success, failure, and conformance: An alternative approach to planning evaluation. Environ. Plan. B 1997, 24, 573–587. [Google Scholar] [CrossRef]
- Flanagan, R.M. The housing act of 1954: The sea change in national urban policy. Urban Aff. Rev. 1997, 33, 265–286. [Google Scholar] [CrossRef]
- Teaford, J.C. Urban renewal and its aftermath. Hous. Policy Debate 2000, 11, 443–465. [Google Scholar]
- Von Hoffman, A. A study in contradictions: The origins and legacy of the housing act of 1949. Hous. Policy Debate 2000, 11, 299–326. [Google Scholar]
- Ramsey-Musolf, D. State mandates, housing elements, and low-income housing production. J. Plan. Lit. 2017, 32, 117–140. [Google Scholar] [CrossRef]
- Housing Act of 1949. In Public Laws No. 171, Chapter 228, 81st Congress ed.; U.S. Government Publishing Office: Washington, DC, USA, 1949.
- Feiss, C. The foundations of federal planning assistance: A personal account of the 701 program. J. Am. Plan. Assoc. 1985, 51, 175–184. [Google Scholar] [CrossRef]
- Housing Act of 1954. In Public Laws No. 560, Chapter 649, 83rd Congress ed.; U.S. Government Publishing Office: Washington, DC, USA, 1954.
- 701 Comprehensive Planning Assistance: Statutes, Regulations, Interagency Agreements, Departmental A-95 Implementing Instructions; U.S. Government Publishing Office: Washington, DC, USA, 1977.
- Alexander, E.R.; Faludi, A. Planning and plan implementation—Notes on evaluation criteria. Environ. Plan. B 1989, 16, 127–140. [Google Scholar] [CrossRef]
- Nelson, A.C.; French, S.P. Plan quality and mitigating damage from natural disasters—A case study of the Northridge earthquake with planning policy considerations. J. Am. Plan. Assoc. 2002, 68, 194–207. [Google Scholar] [CrossRef]
- Calavita, N.; Grimes, K. Inclusionary housing in California—The experience of two decades. J. Am. Plan. Assoc. 1998, 64, 150–169. [Google Scholar] [CrossRef]
- Stevens, M.R.; Lyles, W.; Berke, P.R. Measuring and reporting Intercoder reliability in plan quality evaluation research. J. Plan. Educ. Res. 2014, 34, 77–93. [Google Scholar] [CrossRef]
- Housing Element Law. Section 65580-65589.8, California Government Code. 1967.
- Listokin, D. Fair Share Housing Allocation; Center for Urban Policy Research, Rutgers University: New Brunswick, NJ, USA, 1976; p. 253. [Google Scholar]
- Bates, L. State Income Limits Memorandum; California Department of Housing and Community Development: Sacramento, CA, USA, 2015.
- Mintier & Associates; Raney Planning & Management. City of Wheatland Housing Element Update, Policy Report; Raney Planning & Management Inc.: Wheatland, CA, USA, 2005. [Google Scholar]
- GRC Associates. City of Rosemead General Plan, Housing Element; GRC Associates: Rosemead, CA, USA, 2000; p. 98. [Google Scholar]
- Cotton Bridges & Associates. City of Monrovia 1989–1994 Housing Element; Cotton Bridges & Associates: Monrovia, CA, USA, 1993; p. 78. [Google Scholar]
- City of Burlingame. 2009—2014 Housing Element; City of Burlingame: Burlingame, CA, USA, 2010.
- City of La Palma. Expanded Housing Element; City of La Palma: La Palma, CA, USA, 2010.
- Parsons Harland Bartholomew & Associates Inc. City of Winters Housing Element; Parsons Harland Bartholomew & Associates Inc.: Winters, CA, USA, 2004. [Google Scholar]
- Cotton Bridges & Associates. City of Pasadena 2000–2005 Housing Element; Cotton Bridges & Associate: Pasadena, CA, USA, 2002. [Google Scholar]
- Ramsey-Musolf, D. Evaluating California’s housing element law, housing equity, and housing production (1990–2007). Hous. Policy Debate 2016, 26, 488–516. [Google Scholar] [CrossRef]
- Dodge, S.; Shoemaker, D.; Stone, J. San Francisco Bay Area Housing Crisis Report Card; The Non-Profit Housing Association of Northern California, Greenbelt Alliance: San Francisco, CA, USA, 2002; p. 25. [Google Scholar]
- Stark, S.S.; Ghizzoni, M.C.; Allen, D.A. Housing Element Law: Mandates and Risks of Defiance; Office of County Counsel, County of Santa Barbara: Santa Barbara, CA, USA, 2007.
- Kautz, B. Housing Elements: Beware of What You Promise; League of California Cities Annual Conference, City Attorneys Department, League of California Cities: Sacramento, CA, USA, 2013.
- Baer, W.C. The evolution of local and regional housing studies. J. Am. Plan. Assoc. 1986, 52, 172–184. [Google Scholar] [CrossRef]
- Riis, J.A. How the Other Half Lives: Studies among the Tenements of New York; Martino Fine Books: Eastford, CT, USA, 1901. [Google Scholar]
- Meck, S.; Retzlaff, R.C.; Schwab, J. Regional Approaches to Affordable Housing; American Planning Association: Chicago, IL, USA, 2003. [Google Scholar]
- Baer, W.C. California’s housing element—A backdoor approach to metropolitan governance and regional planning. Town Plan. Rev. 1988, 59, 263–276. [Google Scholar] [CrossRef]
- Baer, W.C. California’s fair-share housing 1967–2004: The planning approach. J. Plan. Hist. 2008, 7, 48–71. [Google Scholar] [CrossRef]
- Trout, B. Abag Housing Projections Split Palo Alto City Council, Would 2860 New Units Help Earth or Ruin Palo Alto? Palo Alto Weekly: Palo Alto, CA, USA, 2007. [Google Scholar]
- Tanenbaum, M. ‘Unrealistic’ Housing Numbers Worry City; Required New Housing Nearly Triples, to 3716 Units by 2014; Palo Alto Online, San Jose Mercury News: Palo Alto, CA, USA, 2007. [Google Scholar]
- Bratt, R.G. Overcoming Restrictive Zoning for Affordable Housing in Five States: Observations for Massachusetts; Citizens’ Housing and Planning Association: Boston, IL, USA, 2012; p. 192. [Google Scholar]
- Graddy, E.A.; Bostic, R.W. The role of private agents in affordable housing policy. J. Publ. Adm. Res. Theory 2010, 20, I81–I99. [Google Scholar] [CrossRef]
- Payne, J.M. The paradox of progress: Three decades of the mount laurel doctrine. J. Plan. Hist. 2006, 5, 126. [Google Scholar] [CrossRef]
- Connerly, C.E.; Smith, M.E. Developing a fair share housing policy for Florida. J. Land Use Environ. Law 1996, 12, 63–102. [Google Scholar]
- Connerly, C.E.; Muller, N.A. Evaluating housing elements in growth management comprehensive plans. In Growth Management: The Planning Challenge of the 1990s; Stein, J., Ed.; Sage Publications: Newbury Park, CA, USA, 1993; pp. 185–199. [Google Scholar]
- Anthony, J. The effects of Florida’s growth management act on housing affordability. J. Am. Plan. Assoc. 2003, 69, 282–295. [Google Scholar] [CrossRef]
- Aurand, A. Florida’s planning requirements and affordability for low-income households. Hous. Stud. 2014, 29, 677–700. [Google Scholar] [CrossRef]
- Illinois Compiled Statutes. Chapter 65, ILCS 5, Article 11. Division 12-7 (from Ch. 24, par. 11-12-7, in 1961 page 2757); USA, 1961.
- Affordable housing planning and appeal act. Illinois Compiled Statutes (Chapter 310, Division 67), 2004.
- Illinois Housing Development Authority. Affordable Housing Planning and Appeal Act: 2013 Non-Exempt Local Government Handbook; Office of Housing Coordination Services: Chicago, IL, USA, 2013.
- Shadish, W.R.; Cook, T.D.; Campbell, D.T. Experimental and Quasi-Experimental Designs for Generalized Causal Inference; Houghton Mifflin Company: Boston, MA, USA, 2002; p. 623. [Google Scholar]
- Michigan Planning Enabling Act. In Michigan Compiled Laws; Michigan State University: East Lansing, MI, USA, 2008.
- Lewis, P.G. Can state review of local planning increase housing production? Hous. Policy Debate 2005, 16, 173–200. [Google Scholar] [CrossRef]
- Metropolitan Council. Chapter 896, House File No. 1508, Minnesota Session Laws: United States, 1967.
- Land-Use and Planning Act. Chapter 127, Minnesota Session Laws: United States, 1976.
- Metropolitan Council. Determining Affordable Housing Need in the Twin Cities 2011–2020; Metropolitan Council: Minneapolis, MN, USA, 2006. [Google Scholar]
- Goetz, E.G.; Chapple, K.; Lukermann, B. Enabling exclusion: The retreat from regional fair share housing in the implementation of the Minnesota land use planning act. J. Plan. Educ. Res. 2003, 22, 213–225. [Google Scholar] [CrossRef]
- Babcock, R.F. The Zoning Game; Municipal Practices and Policies; University of Wisconsin Press: Madison, WI, USA, 1966; p. 202. [Google Scholar]
- Goetz, E.G. Fair share or status quo? The twin cities livable Communities act. J. Plan. Educ. Res. 2000, 20, 37–51. [Google Scholar] [CrossRef]
- Conservation and planning act. Chapter 807, Statutes of California, 1947.
- General Plan Guidelines; Governor’s Office of Planning and Research: Sacramento, CA, USA, 2017.
- Lobao, L.; Kraybill, D.S. The emerging roles of county governments in metropolitan and nonmetropolitan areas: Findings from a national survey. Econ. Dev. Q. 2005, 19, 245–259. [Google Scholar] [CrossRef]
- California Department of Housing and Community Development. Housing Element Status Reports. Available online: http://www.hcd.ca.gov/community-development/housing-element/index.shtml (accessed on 15 October 2015).
- Walsh, S.; Roberts, T.; Pellman, S. California Planning Guide: An Introduction to Planning in California; Governor’s Office of Planning and Research: Sacramento, CA, USA, 2005.
- Municipal boundaries. Southern California Association of Governments; GIS & Data Services, Ed.; Los Angeles, CA, USA, 2009.
- Southern California Association of Governments. Available online: http://www.scag.ca.gov/about/Pages/Home.aspx (accessed on 10 October 2017).
- San Gabriel Valley Council of Governments. Available online: https://www.sgvcog.org/about (accessed on 16 August 2017).
- Sacramento Area Council of Governments. Available online: http://www.sacog.org/about-sacog (accessed on 7 June 2017).
- Administrative Boundaries. Sacramento Area Council of Governments; Regional GIS Clearing House: Sacramento, CA, USA, 2009. [Google Scholar]
- Thomas, J.M.; Ritzdorf, M. Urban Planning and the African American Community: In the Shadows; Sage: Thousand Oaks, CA, USA, 1997; p. 331. [Google Scholar]
- Shlay, A.B. Low-income homeownership: American dream or delusion? Urban Stud. 2006, 43, 511–531. [Google Scholar] [CrossRef]
- Parsons Harland Bartholomew & Associates Inc.; Cotton Bridges & Associates. City of Lincoln Housing Element; Lincoln, CA, USA, 2003.
- Neuendorf, K.A. The Content Analysis Guidebook; Sage Publications: Thousand Oaks, CA, USA, 2002. [Google Scholar]
- McHugh, M.L. Interrater reliability: The kappa statistic. Biochem. Med. 2012, 22, 276–282. [Google Scholar] [CrossRef]
- Freelon, D. Recal oir: Ordinal, interval, and ratio Intercoder reliability as a web service. Int. J. Int. Sci. 2013, 8, 10–16. [Google Scholar]
- Wood, J.M. Understanding and Computing Cohen’s Kappa: A Tutorial. Available online: http://wpe.info/vault/wood07/wood07ab.html (accessed on 19 May 2016).
- Wang, X.; Lindsey, G.; Hankey, S.; Hoff, K. Estimating mixed-mode urban trail traffic using negative binomial regression models. J. Urban Plan. Dev. 2014. [Google Scholar] [CrossRef]
- Loh, C.G.; Osland, A.C. Local land use planning responses to hydraulic fracturing. J. Am. Plan. Assoc. 2016, 82, 222–235. [Google Scholar] [CrossRef]
- Lens, M.C. The limits of housing investment as a neighborhood revitalization tool: Crime in New York City. J. Am. Plan. Assoc. 2013, 79, 211–221. [Google Scholar] [CrossRef]
- Dumbaugh, E.; Li, W. Designing for the safety of pedestrians, cyclists, and motorists in urban environments. J. Am. Plan. Assoc. 2010, 77, 69–88. [Google Scholar] [CrossRef]
- Housing Element Working Group. Final Report; California Assembly and Senate Committee Housing Committees, California Department of Housing and Community Development, Eds.; State of California: Sacramento, CA, USA, 2004.
- Bradley-Burns Uniform Local Sales and Use Tax. Chapter 1311, California Revenue and Taxation Code, 1955.
- O’Brien, R. A caution regarding rules of thumb for variance inflation factors. Qual. Quant. 2007, 41, 673–690. [Google Scholar] [CrossRef]
- Schwartz, S.I.; Johnston, R.A. Inclusionary housing programs. J. Am. Plan. Assoc. 1983, 49, 3–21. [Google Scholar] [CrossRef]
- Chesbro, W. Senate Bill 520: An Act to Amend Sections 65008 and 65583 of the Government Code, Relating to Housing; California Office of Legislative Counsel: Sacramento, CA, USA, 2001.
- RHNA Tables 2000–2007; Sacramento Area Council of Governments: Sacramento, CA, USA, 2001; pp. 19–20.
- Chang, P. The State of the Region 2007; Southern California Association of Governments: Los Angeles, CA, USA, 2007; p. 166.
- Steinacker, A. Infill development and affordable housing—patterns from 1996 to 2000. Urban Aff. Rev. 2003, 38, 492–509. [Google Scholar] [CrossRef]
- Leslie, T.; Machado, M.; Ortiz, D. Assembly Bill 1426: Affordable Housing: Greater Sacramento Region; California Office of Legislative Counsel: Sacramento, CA, USA, 2003.
- Sacramento Area Council of Governments. The Metropolitan Transportation Plan/Sustainable Communities Strategy and the SACOG Region’s Housing Market; Sacramento Area Council of Governments: Sacramento, CA, USA, 2013; p. 130.
- Scally, C.P. The nuances of nimby: Context and perceptions of affordable rental housing development. Urban Aff. Rev. 2013, 49, 718–747. [Google Scholar] [CrossRef]
- Chapter 146. Section 74.3, California Revenue and Taxation Code, 1994.
- Bates, M. An introduction to metatheories, theories, and models. In Theories of Information Behavior; Fisher, K.E., Erdelez, S., McKechnie, L., Eds.; Information Today, Inc.: Medford, NJ, USA, 2005. [Google Scholar]
- Galloway, T.; Mahrayni, R. Planning theory in retrospect: The process of paradigm change. J. Am. Inst. Plan. 1977, 43, 62–71. [Google Scholar] [CrossRef]
- Dyckman, J.W. The practical uses of planning theory. J. Am. Inst. Plan. 1969, 35, 298–300. [Google Scholar] [CrossRef]
- Brooks, M. Four critical junctures in the history of the urban planning profession: An exercise in hindsight. J. Am. Plan. Assoc. 1988, 54, 241–248. [Google Scholar] [CrossRef]
- State of California. Department of Housing and Community Development. Housing Element Status Reports; State of California: Sacramento, CA, USA, 1990–2007.
Figure 1.
The Los Angeles Region Subset. These cities are located in Los Angeles County and include the City of Los Angeles plus 27 cities in the San Gabriel Valley. Source: [85].
Figure 1.
The Los Angeles Region Subset. These cities are located in Los Angeles County and include the City of Los Angeles plus 27 cities in the San Gabriel Valley. Source: [85].
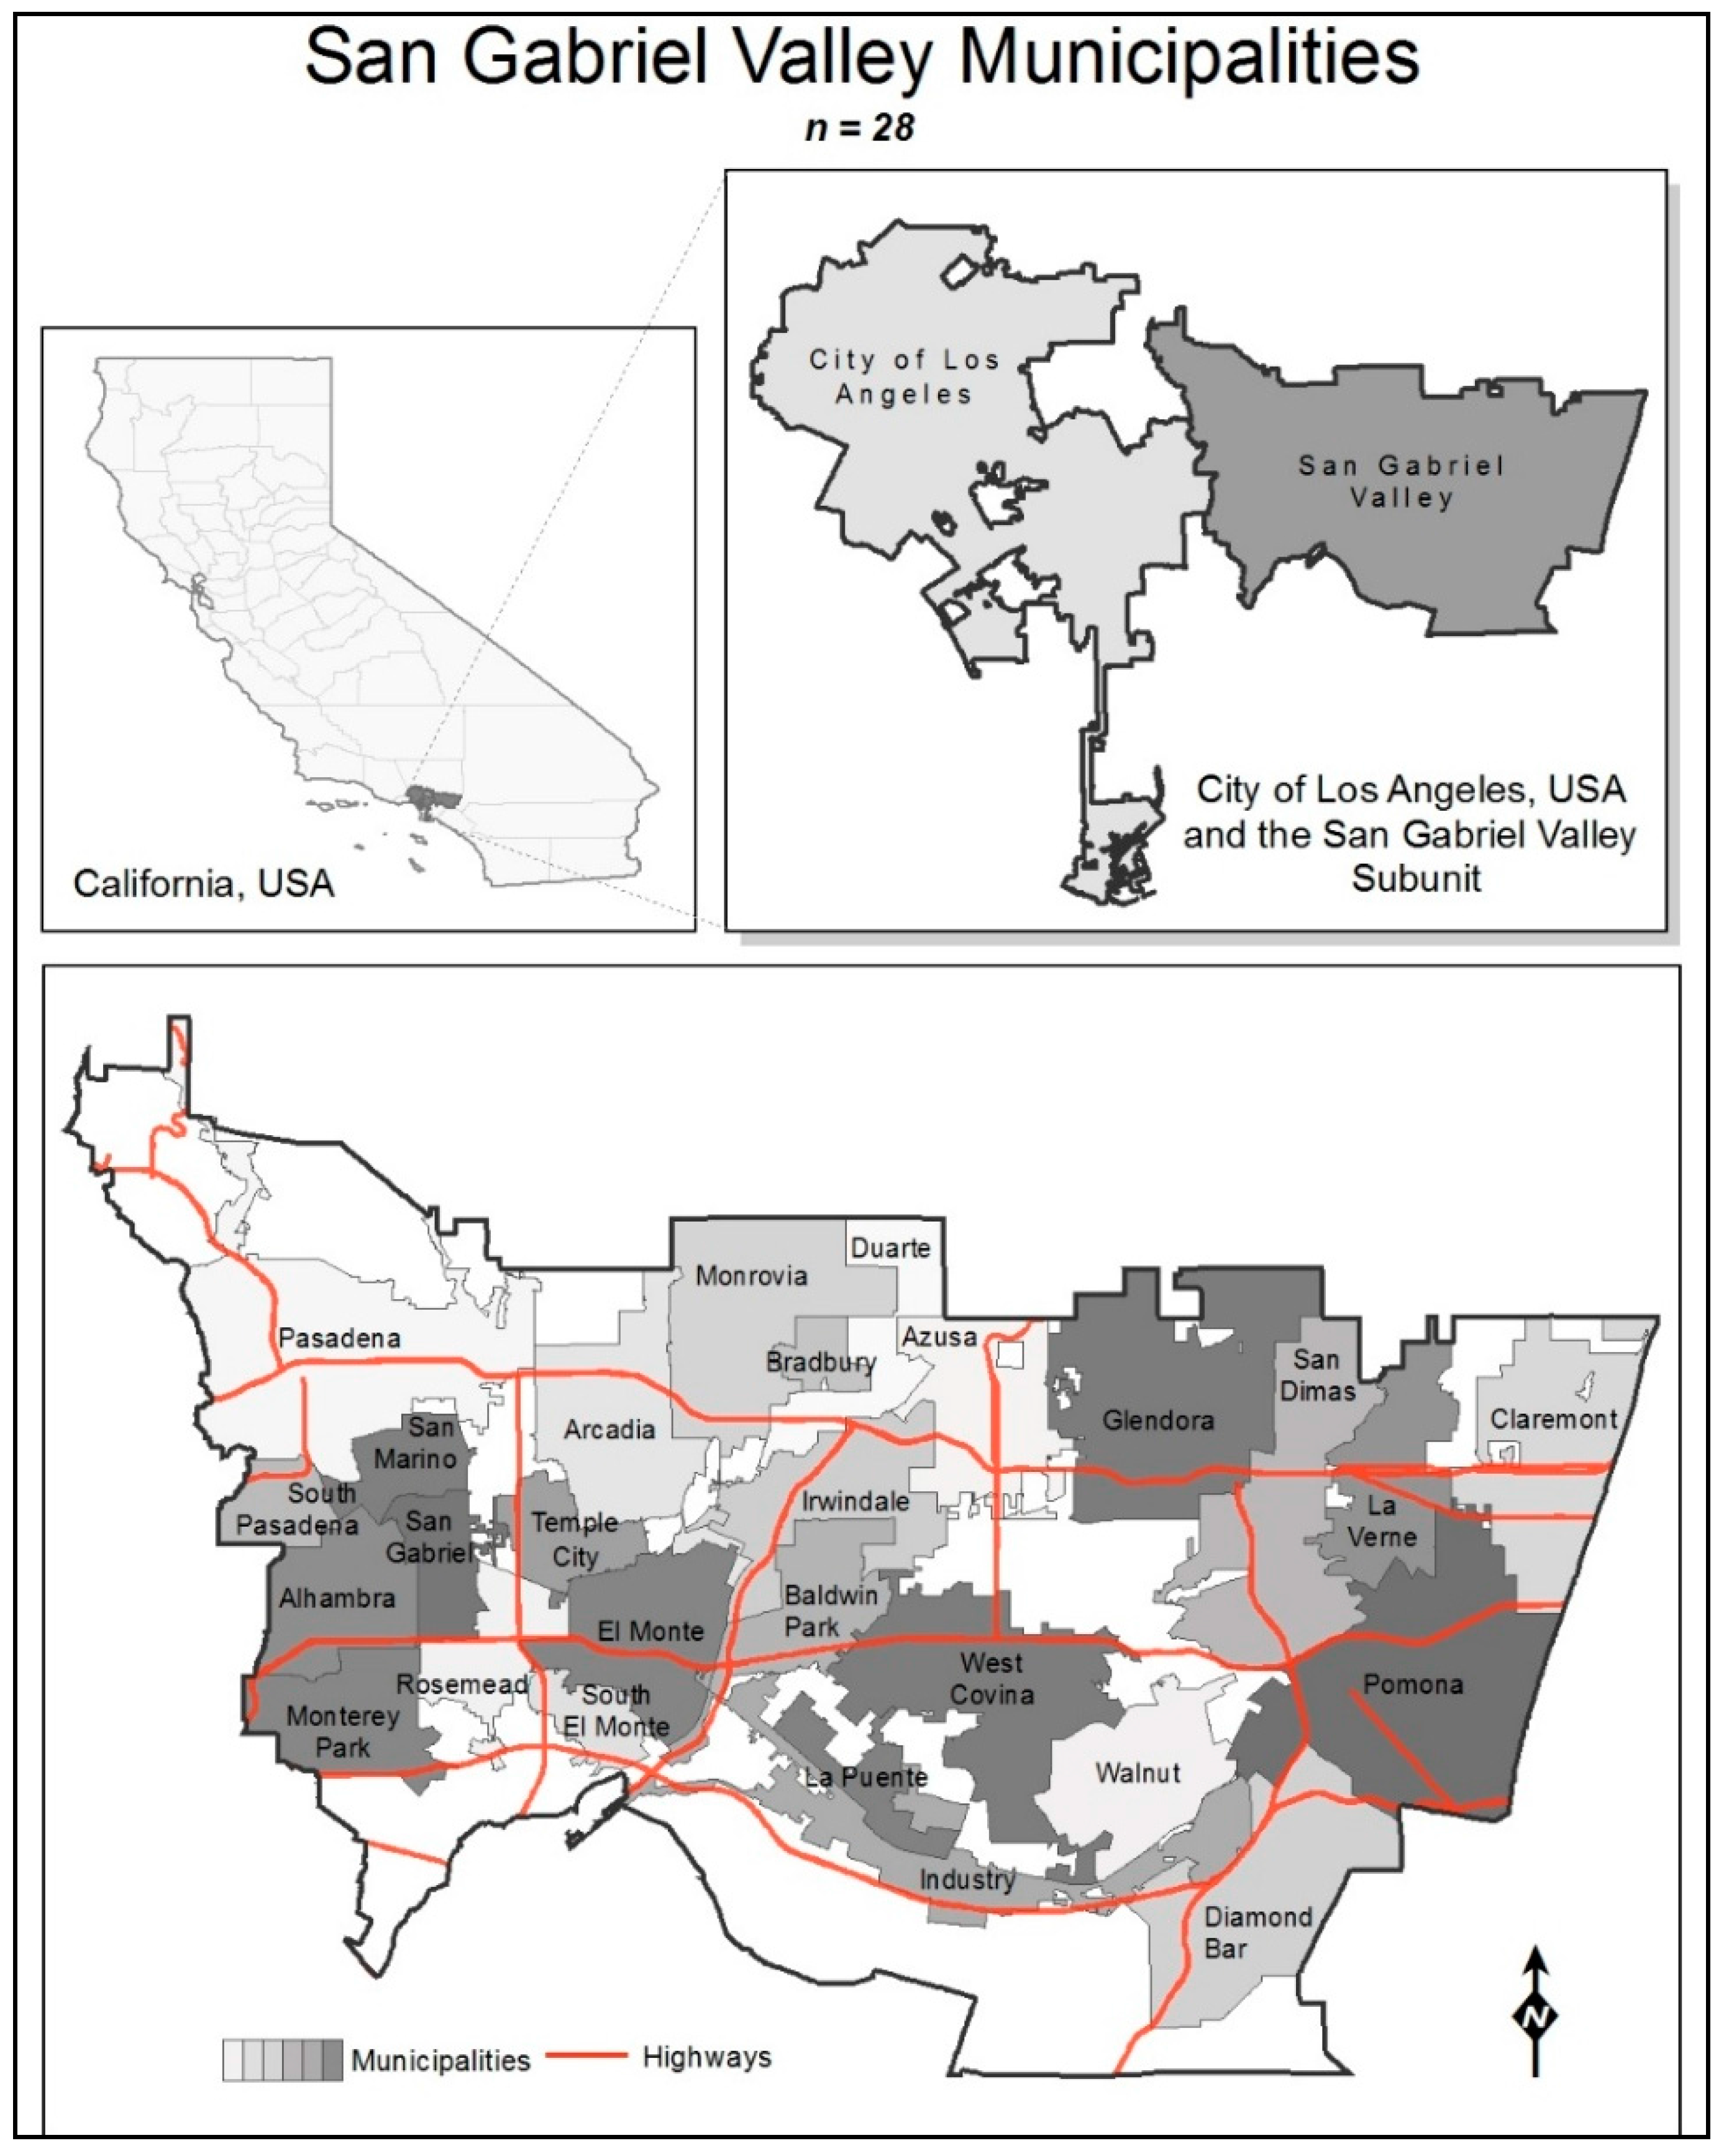
Figure 2.
The Sacramento Region Subset. These cities are located in six counties and include the City of Sacramento plus 14 cities. Source: [89].
Figure 2.
The Sacramento Region Subset. These cities are located in six counties and include the City of Sacramento plus 14 cities. Source: [89].
Table 1.
Components of the Plan Quality Measures. Due to the non-mutually exclusive data, the theme items were configured to test three interpretations of California’s Housing Element Law.
Table 1.
Components of the Plan Quality Measures. Due to the non-mutually exclusive data, the theme items were configured to test three interpretations of California’s Housing Element Law.
| Theme | Operation | QNRW (Narrow) | QWDE (Wide) | QWDST (Widest) |
|---|---|---|---|---|
| Audience | Special Needs Households (SPN HH) | X | X | X |
| First Time Homebuyers (FTHB) | X | |||
| Housing Programs | Construction and SPN HH | X | X | X |
| Rehabilitation and SPN HH | X | X | X | |
| Preservation and SPN HH | X | X | X | |
| Tangential and SPN HH | X | X | ||
| Tangential and FTHB | X | |||
| Planning Tools | Planning Tools and SPN HH | X | X | X |
| Planning Tools and FTHB | X | X | ||
| Evaluation | Quantifiable and SPN HH | X | X | X |
| Ongoing and SPN HH | X | X | ||
| Quantifiable and FTHB | X | |||
| Ongoing and FTHB | X |
Note: QNRW is the narrow interpretation, focusing only on the special needs households. QWDE is the wide interpretation, adding Tangential programs, First-Time Homebuyers, and some Ongoing values. QWDST is the widest interpretation, adding all of the Special Needs Household and First-time Homebuyers values. Note. SPN HH = Special Needs Households, FTHB = First-Time Homebuyers.
Table 2.
Summary statistics of the regression variables, n = 43.
| Variable | Min | Max | Mean | SD |
|---|---|---|---|---|
| Compliance | 0 | 1 | 0.657 | 0.269 |
| Consultant | 0 | 1 | 0.70 | 0.465 |
| Noncentral City | 0 | 1 | 0.95 | 0.213 |
| Low-income Housing Production | 0 | 11,674 | 736.50 | 2118.53 |
| Household Income | 25,750 | 117,300 | 49,600 | 17,886.93 |
| HUD Entitlement City | 0 | 1 | 0.33 | 0.474 |
| QNRW | 6.25 | 31.76 | 20.84 | 5.123 |
| QWDE | 10 | 36.07 | 24.85 | 5.695 |
| QWDST | 10 | 37.97 | 26.11 | 6.324 |
| Region | 0 | 1 | 0.35 | 0.482 |
| Sales Taxes | 0.01 | 0.66 | 0.33 | 0.154 |
Note: SD = Standard Deviation.
Table 3.
Audience types by overall identifications.
| Audience | Group | Total Identifications | Percentage |
|---|---|---|---|
| Low-income Households | SPN HH | 588 | 37.9% |
| Homeless | SPN HH | 102 | 6.6% |
| Seniors | SPN HH | 100 | 6.4% |
| Disabled | SPN HH | 83 | 5.3% |
| Large Families | SPN HH | 18 | 1.2% |
| Farm Workers | SPN HH | 12 | 0.8% |
| Female-headed Households | SPN HH | 7 | 0.5% |
| Subtotal | 910 | 58.60% | |
| All Households | EE-HH | 543 | 35.0% |
| First-time Homebuyers | EE-HH | 80 | 5.2% |
| Infrastructure | EE-HH | 20 | 1.3% |
| Subtotal | 643 | 41% | |
| Grand Total | 1553 | 100.0% |
Note: SPN HH = Special Needs Households, EE HH = Everyone Else Households.
Table 4.
Housing programs by identifications. The appendix lists the individual audience type by housing program.
Table 4.
Housing programs by identifications. The appendix lists the individual audience type by housing program.
| Programs | SPN HH | EE HH | Total |
|---|---|---|---|
| Construction | 510 | 328 | 838 |
| Rehabilitation | 214 | 149 | 363 |
| Preservation | 247 | 56 | 303 |
| Tangential | 52 | 168 | 220 |
| Grand Total | 1023 | 701 | 1724 |
Note. SPN HH = Special Needs Households, EE HH = Everyone Else Households.
Table 5.
The top fifteen planning tools ranked by total identifications. See the appendix for the complete list of 47 planning tools.
Table 5.
The top fifteen planning tools ranked by total identifications. See the appendix for the complete list of 47 planning tools.
| Rank | Planning Tool | Total Identifications | Percentage |
|---|---|---|---|
| 1 | Zoning | 299 | 15.12% |
| 2 | Residential Rehabilitation | 234 | 11.83% |
| 3 | Sites, Density | 144 | 7.28% |
| 4 | Transitional Housing | 115 | 5.81% |
| 5 | Development Standards | 98 | 4.95% |
| 6 | Density Bonus | 77 | 3.89% |
| 7 | Permit Streamlining | 69 | 3.49% |
| 8 | Code Enforcement | 62 | 3.13% |
| 9 | Infill or Vacant Land | 61 | 3.08% |
| 10 | Fair Housing | 57 | 2.88% |
| 11 | Universal Building Code, Energy Standards, Title 24 Building Code | 56 | 2.83% |
| 12 | Municipal Purchase or Write Down | 55 | 2.78% |
| 13 | Waived Fees | 52 | 2.63% |
| 14 | Subsidy | 46 | 2.33% |
| 15 | Mobile or Manufactured Homes | 45 | 2.28% |
Table 6.
The top twenty planning tools that accommodate low-income housing needs ranked by total SPN HH identifications.
Table 6.
The top twenty planning tools that accommodate low-income housing needs ranked by total SPN HH identifications.
| Rank | Planning Tool | Total SPN HH Identifications | Percentage |
|---|---|---|---|
| 1 | Residential Rehabilitation | 178 | 15.71% |
| 2 | Zoning | 167 | 14.74% |
| 3 | Transitional Housing | 115 | 10.15% |
| 4 | Sites, Density | 75 | 6.62% |
| 5 | Density Bonus | 72 | 6.35% |
| 6 | Development Standards | 69 | 6.09% |
| 7 | Municipal Purchase or Write Down | 51 | 4.50% |
| 8 | Waived Fees * | 42 | 3.71% |
| 9 | Subsidy | 41 | 3.62% |
| 10 | Inclusionary Housing * | 34 | 3.00% |
| 11 | Self-Sufficiency | 33 | 2.91% |
| 12 | Permit Streamlining * | 27 | 2.38% |
| 13 | Mobile or Manufactured Homes * | 24 | 2.12% |
| 14 | Infill or Vacant Land | 21 | 1.85% |
| 15 | Accessory Dwellings * | 20 | 1.77% |
| 16 | Relocation or Displacement Policies | 18 | 1.59% |
| 17 | Mixed-Use | 16 | 1.41% |
| 18 | Co-Housing or Limited Equity Owners | 14 | 1.24% |
| 19 | Covenants | 11 | 0.97% |
| 20 | Housing Element Monitoring * | 9 | 0.79% |
Table 7.
Audience Types by Evaluation Identifications. In general, the audience types maintained a balance of quantitative and ongoing objectives, except for the Disabled, which skewed quantitative.
Table 7.
Audience Types by Evaluation Identifications. In general, the audience types maintained a balance of quantitative and ongoing objectives, except for the Disabled, which skewed quantitative.
| Audience | Group | Quantitative | Ongoing | Total |
|---|---|---|---|---|
| Low-income Households | SPN HH | 305 | 295 | 600 |
| Homeless | SPN HH | 52 | 50 | 102 |
| Seniors | SPN HH | 50 | 52 | 102 |
| Disabled | SPN HH | 57 | 26 | 83 |
| Large Families | SPN HH | 9 | 11 | 20 |
| Farm Workers | SPN HH | 6 | 6 | 12 |
| Female-headed Households | SPN HH | 3 | 4 | 7 |
| Subtotal | 482 | 444 | 926 | |
| All Households | EE-HH | 231 | 315 | 546 |
| First-time Homebuyers | EE-HH | 45 | 35 | 80 |
| Infrastructure | EE-HH | 9 | 11 | 20 |
| Subtotal | 305 | 361 | 643 | |
| Grand Total | 767 | 805 | 1572 |
Table 8.
Housing Allocation by Units Constructed (n = 43, 1998–2005). Regarding housing production, the sample produced roughly 40% of its low-income allocation, in contrast to roughly 163% of its market-rate allocation.
Table 8.
Housing Allocation by Units Constructed (n = 43, 1998–2005). Regarding housing production, the sample produced roughly 40% of its low-income allocation, in contrast to roughly 163% of its market-rate allocation.
| Income Category | Units Allocated | % Allocated | Units Constructed | % Constructed |
|---|---|---|---|---|
| Low-income Housing | 77,613 | 59.97% | 31,168 | 40.16% |
| Market-rate Housing | 51,791 | 40.03% | 83,984 | 162.16% |
| Grand Total | 129,404 | 100.00% | 115,152 | 88.99% |
Table 9.
The Negative Binomial Tests. In Models 1–3, the quality measures (QNRW, QWDE, and QWDST) maintained statistically significant relationships with Low-income Housing Production. In addition, the control variables of Compliance, Noncentral City, HUD Entitlement City, Sales Tax, and Region also maintained consistent statistically significant relationships.
| Variable | Model 1 | Model 2 | Model 3 | Model 3 Expected Counts of LIH | ||||
|---|---|---|---|---|---|---|---|---|
| B (SE) Estimate | B (SE) Estimate | B (SE) Estimate | Var. = 0 | Var. = 1 | Min | Max | Mean | |
| (Intercept) | 0.203 | 0.59 | 0.276 | |||||
| (2.364) | (2.322) | (2.294) | ||||||
| Compliance | 2.379 * | 2.312 * | 2.212 * | 90 | 972 | 429 | ||
| (1.07) | (1.044) | (1.031) | ||||||
| Consultant | 0.023 | 0.333 | 0.168 | |||||
| (−0.06) | (0.582) | (0.576) | ||||||
| Noncentral City | −2.556 * | −3.181 * | −3.374 ** | 4915 | 358 | |||
| (1.287) | (1.279) | (1.269) | ||||||
| Household Income | 0.031 | 0.019 | 0.022 | |||||
| (0.018) | (0.017) | (0.017) | ||||||
| HUD Entitlement City | 3.024 *** | 2.666 *** | 2.527 *** | 160 | 3301 | |||
| (0.568) | (0.575) | (0.57) | ||||||
| Sales Tax | −4.560 * | −5.093 ** | −5.172 ** | 1581 | 81 | 437 | ||
| (1.795) | (1.76) | (1.748) | ||||||
| Region | 1.888 ** | 1.864 ** | 2.118 *** | 222.27 | 1468.49 | |||
| (0.598) | (0.060) | (0.617) | ||||||
| QNRW | 0.192 *** | |||||||
| (0.057) | ||||||||
| QWDE | 0.196 *** | |||||||
| (0.05) | ||||||||
| QWDST | 0.205 *** | 19.35 | 4203.01 | 429.21 | ||||
| (0.047) | ||||||||
| Observations | 43 | 43 | 43 | |||||
| Log Likelihood | −496.234 | −494.378 | −493.300 | |||||
| AIC | 516.23 | 514.38 | 513.30 | |||||
| Response Variable | LIH | LIH | LIH | |||||
Notes. LIH = Low-Income Housing Production. SE = Standard Error. * p < 0.05, ** p < 0.01, *** p < 0.001. VAR = Variable.
© 2017 by the author. Licensee MDPI, Basel, Switzerland. This article is an open access article distributed under the terms and conditions of the Creative Commons Attribution (CC BY) license (http://creativecommons.org/licenses/by/4.0/).
Share and Cite
MDPI and ACS Style
Ramsey-Musolf, D. According to the Plan: Testing the Influence of Housing Plan Quality on Low-Income Housing Production. Urban Sci. 2018, 2, 1. https://doi.org/10.3390/urbansci2010001
AMA Style
Ramsey-Musolf D. According to the Plan: Testing the Influence of Housing Plan Quality on Low-Income Housing Production. Urban Science. 2018; 2(1):1. https://doi.org/10.3390/urbansci2010001
Chicago/Turabian StyleRamsey-Musolf, Darrel. 2018. "According to the Plan: Testing the Influence of Housing Plan Quality on Low-Income Housing Production" Urban Science 2, no. 1: 1. https://doi.org/10.3390/urbansci2010001