
Influence of Urban Multi-Criteria Deprivation and Spatial Accessibility to Healthcare on Self-Reported Health

Interfaculty Department of Geoinformatics—Z_GIS, University of Salzburg, 5020 Salzburg, Austria
Urban Sci. 2017, 1(2), 11; https://doi.org/10.3390/urbansci1020011
Submission received: 10 December 2016
/
Revised: 21 February 2017
/
Accepted: 28 March 2017
/
Published: 30 March 2017
Abstract
:Self-reported health is considered a health outcome related to neighborhood characteristics. This study analyzes the influence of urban multi-criteria deprivation and spatial accessibility to healthcare on individual self-reported health from a case study carried out in the city of Quito, Ecuador. A multi-criteria deprivation index and two alternative scenarios of this index were generated. A gravity-based measure of spatial accessibility to healthcare was also calculated. The neighborhood effects of deprivation measures and spatial accessibility to healthcare on individual self-reported health were evaluated by applying multilevel models. Significant neighborhood effects were found in two of the three applied multilevel models. This study contributes evidence of neighborhood effects on health outcomes, and can support urban planners and policy-makers in the reduction of urban health-related inequalities.
1. Introduction
Deprivation and limited access to healthcare are disadvantages related to health outcomes, and are indicators that can be reported in spatial units at different scales [1,2,3,4,5,6,7,8,9,10]. Deprivation is defined as a set of social and material disadvantages [11], and is commonly calculated by combining socioeconomic information related to small census areas [8]. The indices of deprivation are developed primarily to identify healthcare inequalities and to support health planning and decision-making, due to the important influence of these indices on health outcomes [5,9,12]. Multi-criteria evaluation (MCE) encompasses a set of techniques of decision analyses to support spatial planning, and is commonly applied using geographic information systems (GIS) [13,14]. These techniques have been applied to deprivation indices. For example, the analytical hierarchy process has been applied to construct a deprivation index [12] and the ordered weighted averaging method, to create different scenarios of deprivation [12,15]. In this research, deprivation is a multidimensional measure of integrated weighted indicators related to household conditions, education, employment, and health.
Accessibility to healthcare is also a multidimensional measure that can be represented by the dimensions of availability, geographical accessibility, acceptability, or affordability [16]. In this research, the measure used to represent healthcare accessibility is spatial accessibility, which is the combination of geographical accessibility and availability [17]. Geographical accessibility refers to the distances between populations and healthcare services [18]; availability of healthcare services refers to the number of services that a patient can choose from [16]. Several methods have been applied to calculate spatial accessibility to healthcare based on potential population demand, healthcare supply, and travel impedance [17,19,20,21]. Thus, these methods also consider the concept of spatial accessibility as the combination of (geographical) accessibility and availability of healthcare services. Despite some differences, the methods to calculate spatial accessibility to healthcare are based on gravity models of accessibility.
Self-reported health can be considered as one of the main health outcomes [22], and is a subjective health assessment that reflects an individual’s integrated perception of health [23]. Self-reported health is also a reflection of an enduring self-concept of health [24], and this reflection remains stable over time. However, this self-assessment is also context-related. Thus, exploring connections between the dimensions of deprivation, spatial accessibility to healthcare, and a health outcome, such as self-reported health, becomes an important issue in better understanding urban health processes—with both theoretical and practical implications.
In this article, two area-based measures are presented: a multi-criteria deprivation index, and a gravity-based measure of spatial accessibility to healthcare. Additionally, one individual-based measure of self-reported health is also presented, and two GIS-based scenarios of the deprivation index are also calculated. The neighborhood effects of the measures of deprivation and spatial accessibility to healthcare on individual self-reported health are analyzed, and implications related to urban health inequalities are discussed.
2. Materials and Methods
2.1. Study Area, Data Sources and the Measure of Self-Reported Health
This study was carried out in the city of Quito, Ecuador. Located in the Andes, Quito is the capital city of Ecuador and is home to more than 1.5 million inhabitants. The indices of multi-criteria deprivation and healthcare accessibility adapted to the city of Quito were used in the present study [25]. These indices draw on data from the 2010 population and housing census and the locations of primary healthcare services. These two indices were expressed on the smallest available scale level, i.e., census blocks.
The measure of self-reported health was extracted from a survey carried out in Quito in the months of July, August, and October of 2014 [26]. This survey utilized a two-stage sampling strategy. In the first stage, the study area was divided into 269 hexagons, of which 18 were randomly selected. Hexagons are useful polygons for building sampling tessellation that reduces sampling bias and ambiguities in analyses using Euclidean distances [27]. The number of hexagons was determined based on the interviewers’ capacity in terms of time and financial resources. In the second stage, pseudo-random interviews were carried out by applying a door-to-door interview petition, considering population density of the sampling hexagons and people’s willingness to be interviewed. The response rate of the survey was 61%, and 231 responses were used for this stud. Since this study is focused on access to primary healthcare services, the survey used 231 interviewees reported to attend to this kind of healthcare service. Considering the population of Quito, the error margin of the sample used was ±6, with a confidence level of 95%. The measure of self-reported health was generated using a dichotomous variable obtained from the survey data, where the value of 1 was assigned to people that reported having good or excellent health, and the value of 0 was assigned to people that reported having poor health. The answers of self-reported health are distributed in the entire city, according to the sampling strategy explained above.
2.2. The Multi-Criteria Deprivation Index and Its GIS-Based Scenarios
The multi-criteria deprivation index for the city of Quito was used in this study [25]. The index was calculated in each census block in the study area. The indicators used in this index were chosen considering both a human rights-based approach [3,28], and their potential to represent material and social disadvantages that can be related to health issues. The multicollinearities of the deprivation index’s indicators were lower than five [3].
The indicators of the index were weighted by applying the analytical hierarchical process (AHP) [29], which is a multi-criteria evaluation technique based on experts’ judgments. The AHP method has been widely demonstrated and discussed in several studies [12,30,31,32,33,34]. The multi-criteria deprivation index for the city of Quito draws on the judgments of 13 experts of the fields of geography, health, and urban studies. The consistency of the experts’ judgments has been verified by a consistency ratio lower than 0.10 [25,32]. The detailed methodology used to construct the deprivation index is explained in the study published by Cabrera-Barona, Blaschke and Gaona [25]. The ten indicators used to construct the deprivation index and their corresponding AHP-based weights are shown in Table 1.
The multi-criteria deprivation index () is the weighted additive aggregation of the normalized indicators shown in Table 1.
The scores are normalized, where values closer to 1 represent higher deprivation.
Expressing a deprivation index in different scenarios is useful for identifying critical areas of deprivation, for strengthening deprivation indices that incorporate qualitative information, and for validating the original deprivation index [15]. Two alternative scenarios of the multi-criteria deprivation index were created using the Boolean operators of intersection and union. These Boolean operators were applied by performing the GIS-based ordered weighted averaging (OWA) models. The creation of these models to create deprivation index scenarios has been explained in detail in previous studies [12,15]. The intersection operator is equivalent to the logic operator AND, and the union operator is equivalent to the logic operator OR. The AND operator assigns a weight of 1 to the indicator of the multi-criteria deprivation index within each census block that produces the lowest score of all the indicators, and 0 to the other nine indicators. On the other hand, the OR operator assigns a weight of 1 to the indicator of the multi-criteria deprivation index within each census block that produces the highest score of all the indicators [15]. From a GIS perspective, the multi-criteria deprivation index would be considered as the weighted linear combination of the ten indicators. The intersection alternative scenario is useful for highlighting extremely deprived neighborhoods, while the union alternative scenario maximizes the level of deprivation measurement in each census block.
2.3. The Spatial Accessibility to Healthcare
The measure of spatial accessibility to healthcare proposed by Cabrera-Barona, Blaschke, and Gaona [25] was applied in this study. This measure was developed to identify inequalities of healthcare accessibility in accessing primary healthcare services at different scales, and has been related to the multi-criteria deprivation index for the city of Quito to evaluate healthcare satisfaction. The distance decay function used in this measure was 1/d, with d representing the Euclidean distance from the population’s center to the primary healthcare service. Euclidean distances are used since the available road network dataset for Quito was not appropriate for network analyses. However, the use of Euclidean distances is appropriate when studying many pairs of origins (e.g., census blocks’ centroids) and destinations (e.g., primary healthcare services) in large areas (e.g., the city of Quito) [35]. Additionally, this kind of distance has been demonstrated to be a reasonable proxy of travel time and real distances to healthcare services [35,36]. In the measure of spatial accessibility to healthcare, populations are spatially represented by the centroids of the census blocks. In the study area, 81% of the census blocks’ centroids were located less than 1 km from the nearest primary healthcare service. More precisely, the average distance from the census blocks’ centroids to the nearest primary healthcare service was found to be 668 m. Thus, the measure uses three service-area rings of 300 m, 600 m and 1200 m created around each primary healthcare service. Huff models [37] representing the probabilities of people’s selection of a healthcare service out of other available services are also incorporated into the measure of spatial accessibility to healthcare. Therefore, the formula of this measure is expressed as follows:
where is the supply (number of healthcare staff) of the healthcare service at location j and represents the populations located in each threshold of the service-area rings. represents the probability of choosing the healthcare service at location j and is calculated with the formula:
where denotes any healthcare service within the maximum distance of 1200 m from population location i.
2.4. Neighborhood Effects of Deprivation and Spatial Accessibility to Healthcare on Individual Self-Reported Health
The individuals reporting their health status can be considered as spatially “nested” in the census blocks—areas with characteristics of deprivation and spatial accessibility to healthcare. The interactions of these area-level characteristics influence the self-reported health of individuals. To evaluate this influence, multilevel models were calculated considering three kinds of neighborhoods: (i) a neighborhood with characteristics of multi-criteria deprivation and spatial accessibility to healthcare; (ii) a neighborhood with characteristics of the intersection alternative scenario of deprivation and spatial accessibility to healthcare; (iii) a neighborhood with characteristics of the union alternative scenario of deprivation and spatial accessibility to healthcare. Because the measure of self-reported health was a dichotomous variable, multilevel models for binary responses were applied. A multilevel model for a binary dependent variable can be expressed as follows:
where the term represents the self-reported health, is the overall mean across all the areas, represents the effects of census block j, and is an individual-level error term. The term can be considered as the representation of the areal or neighborhood effects of the interaction of deprivation and spatial accessibility to healthcare. These effects are also called random effects [38], and these effects can be expressed through the variance partition coefficient (VPC). Using the VPC, the amount of individual-level variances of self-reported health attributable to the area-level measures of deprivation and spatial accessibility to healthcare can be identified. Finally, the statistical likelihood ratio (LR) was used to test the significance of the neighborhood effects.
3. Results
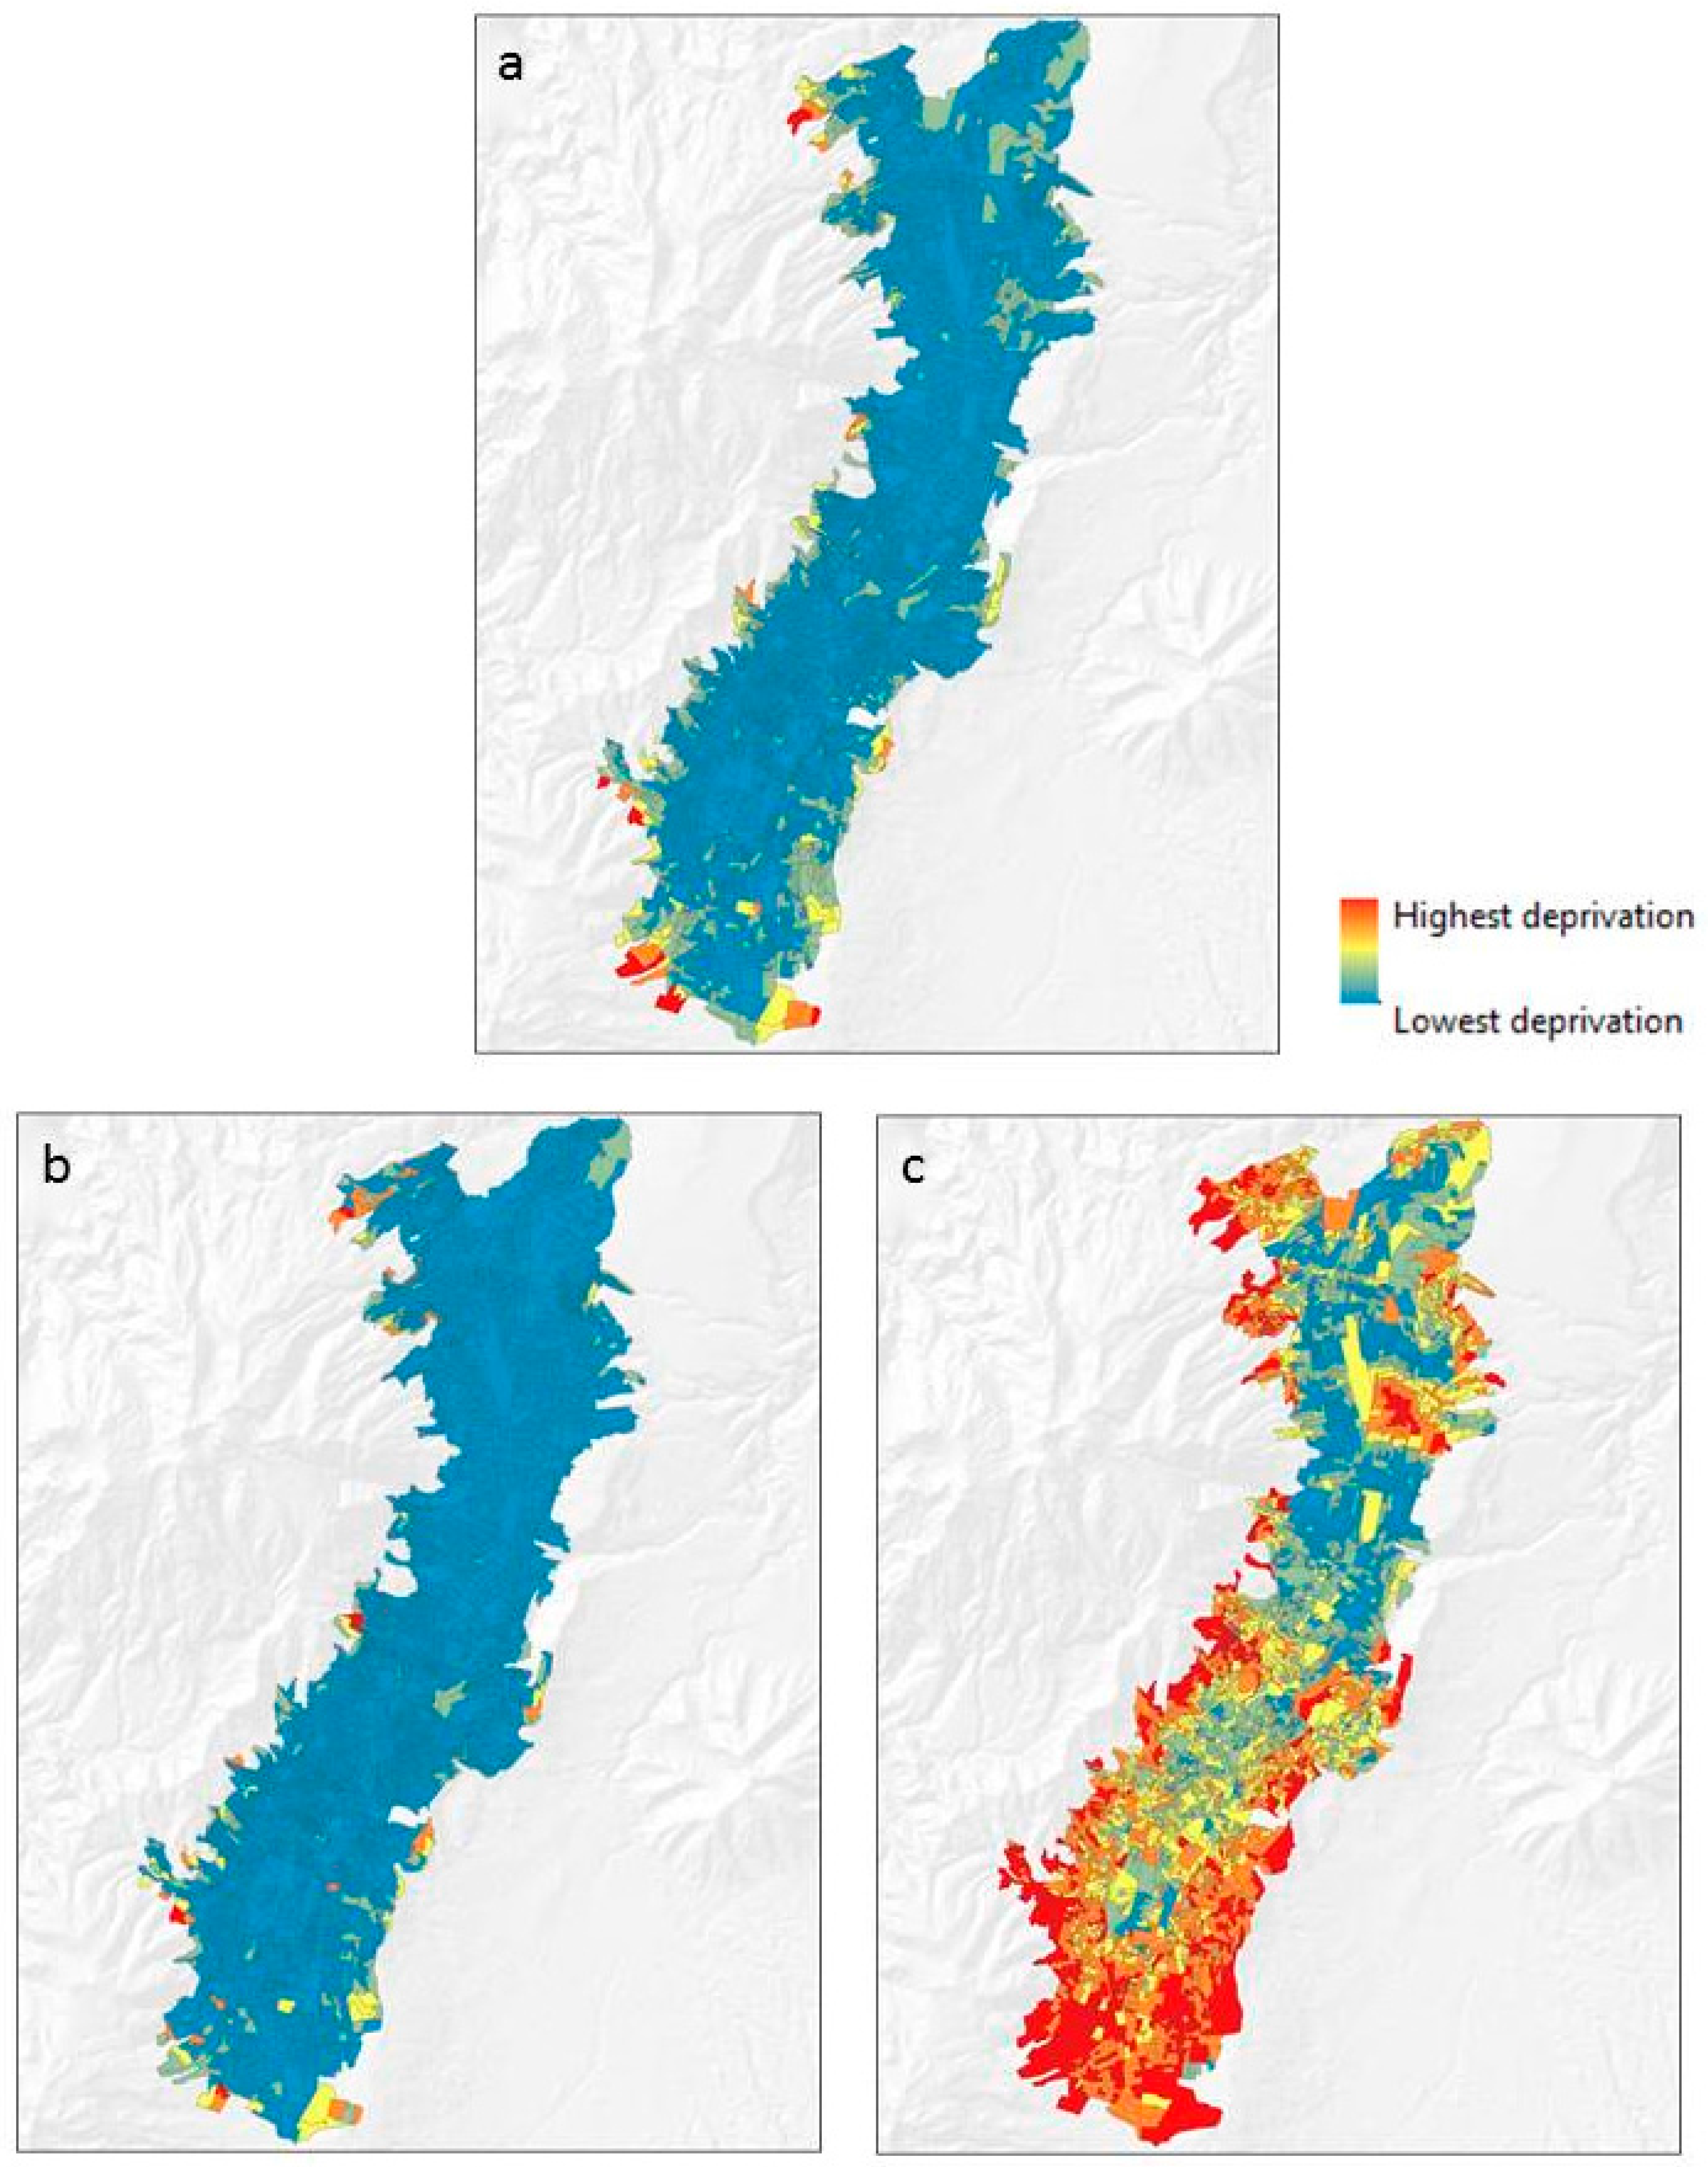
Figure 1 depicts the multi-criteria deprivation index and the two alternative scenarios of deprivation. The multi-criteria deprivation index shows low levels of deprivation in the city of Quito. 98% of the city has low to medium values of deprivation (<0.5). The 2% with the highest deprivation are concentrated in the census blocks located in the extreme south of the city and in the extreme northwest. These areas are not actual slums but are peripheral areas with limited access to several services, and some of them have illegal constructions. Most of the low-income residential areas and industrial zones are located in the south of the city. However, the deprivation values remain low in these areas, mainly because most of the city’s households have proper access to basic services. Services such as educational centers, healthcare services, and parks are also geographically accessible from the different neighborhoods of the city.
In the intersection alternative scenario of deprivation, 99% of the city has deprivation values lower than 0.5, while in the case of the union alternative scenario of deprivation, 43% of the city has deprivation values lower than 0.5.
The average values of the multi-criteria deprivation index, the intersection alternative scenario, and the union alternative scenario were 0.13 ± 0.09 std. dev., 0.020 ± 0.09 std. dev., and 0.53 ± 0.19 std. dev., respectively.
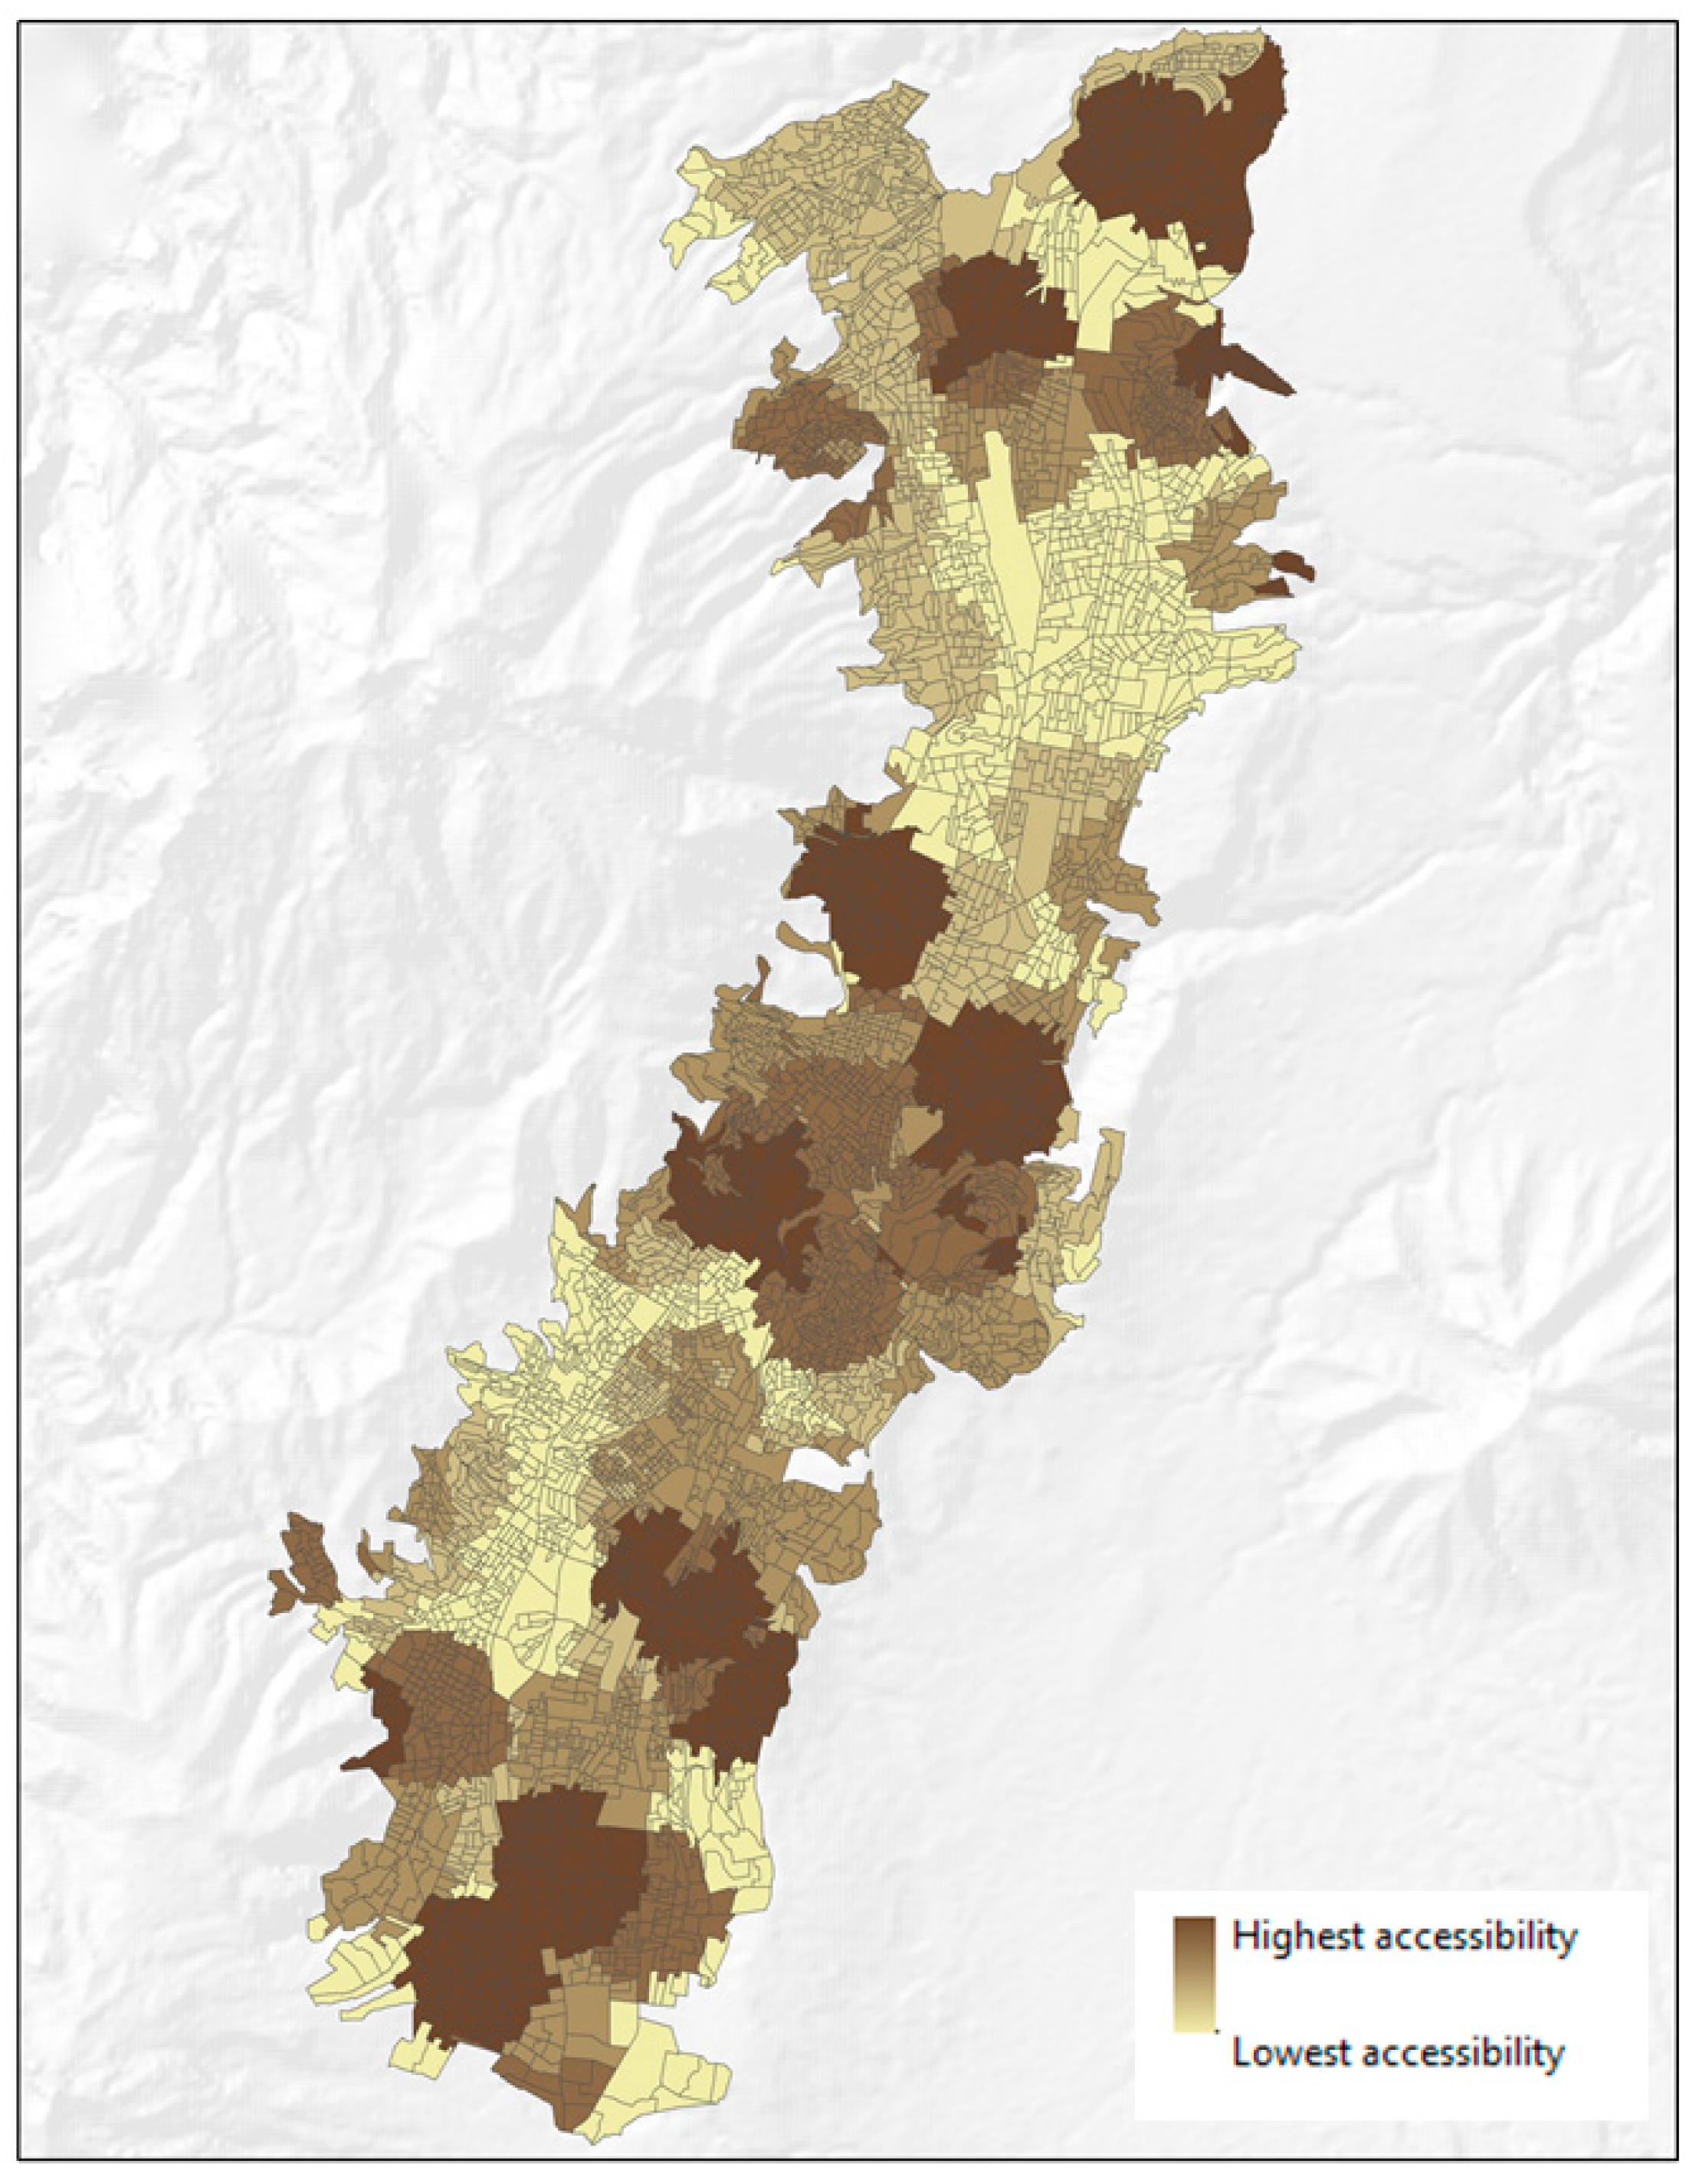
The areas of the city with the highest spatial accessibility to healthcare are mainly located in the center of the city, in the south, and in the extreme northeast (Figure 2). However, when reading the results of gravity-based measures of spatial accessibility, the interpreter should be cautious: the medium scores of these kinds of measures can range around 0.001 [20,39]. In this study, after normalizing the measure of spatial accessibility to healthcare, the mean is 0.04 ± 0.05 std. dev. Thus, it can be said that the study area has a good spatial accessibility to healthcare. This means that areas with accessibility values higher than 0.05 are areas with notable accessibility to healthcare (darker areas in Figure 2).
Table 2 shows the results of the multilevel models. Neighborhood Type I refers to the census blocks that have the characteristics of multi-criteria deprivation and spatial accessibility to healthcare. Neighborhood Type II refers to those with characteristics of the intersection alternative scenario of deprivation and spatial accessibility to healthcare. Type III encompasses the census blocks with characteristics of the union alternative scenario of deprivation and spatial accessibility to healthcare. The results here are striking: the multilevel models of the Type I and Type III neighborhoods indicate important areal influences (significant LR) of deprivation and spatial accessibility to healthcare on individual self-reported health, and were also the models with the best performance (lower AIC values). The models also show that 22% of the variance in self-reported health can be attributed to differences between neighborhoods (census blocks) where spatial accessibility to healthcare is combined with multi-criteria deprivation, or with the union alternative scenario of deprivation.
4. Discussion
Urban deprivation indices are widely used to evaluate the impacts of social and material disadvantages on health, and spatial accessibility to healthcare has been linked to the utilization of healthcare services. However, limited attention has been paid to studying the combined influences of urban deprivation and spatial accessibility to healthcare on individual health. The concept of neighborhood may vary depending on research interests; however, census blocks have been successfully used as proxies of neighborhoods to evaluate neighborhood influences on individual health outcomes [40]. The measure of healthcare accessibility presented in this study needs to be understood as a measure of potential access to healthcare. Neighborhood-level potential access to healthcare has an impact on health [2]. On the other hand, neighborhood-level deprivation has been proven to influence self-reported individual health [41].
This study shows that 22% of the variance in self-reported health can be attributed to differences between neighborhoods where spatial accessibility to healthcare is combined with multi-criteria deprivation, or with the union alternative scenario of deprivation. In other words, people’s perceptions of their health are very likely to be influenced by the socioeconomic conditions of the neighborhood where they live, and the location of the neighborhood in relation to the nearest primary healthcare service.
This result is consistent with the epidemiological evidence of the influence of the place of residence on individuals’ health [40]. Even individuals with similar socioeconomic characteristics are likely to exhibit different health outcomes depending on the socioeconomic characteristics of the neighborhoods they live in [42]. A reliable conceptualization of place effects on health considers the importance of calculating area-based indices based on basic human needs [43], just like the multi-criteria deprivation index for the city of Quito.
In the union scenario, the deprivation levels tend to be maximized, which is why the OR operator is also called “risk-seeking”. The OR operator assigns an order weight of 1 to the deprivation index indicator within each census block that has the highest value, and an order weight of 0 to the other deprivation index indicators. The results of the multilevel model that incorporated the union scenario of deprivation have a very important implication: they showed the possibility of only considering the indicator with the highest value out of all the indicators composing a deprivation index to analyze neighborhood influences on a health outcome, such as self-reported health. For instance, in most of the census blocks of the study area, the indicator with the highest value was the percentage of the population that has no public social insurance. This indicator could be used as a simple contextual variable. In the study area, the importance of having social insurance for healthcare accessibility and healthcare satisfaction has been reported at the individual-level [26]. It is likely that the area-level indicator of having social insurance, as a simple measure of health inequality, may be linked to area-level measures of spatial accessibility to healthcare.
The intersection scenario of deprivation can identify severely deprived neighborhoods [15], which can be useful to support policy-making and urban planning. However, it is important to identify which indicator is the most indicative of local deprivation in areas of the city shown to be the most deprived in all spatial representations of deprivation, including the original multi-criteria deprivation index. The most deprived areas in the city are those located in the extreme northwest and extreme south. In these areas, the indicator with the highest value is the percentage of households without access to the sewerage system (between 93 and 100 percent of households).
The incorporation of possible individual-level predictors of self-reported health is beyond the scope of this study. However, it is important to consider that the variation of self-reported health can also be related to the variation of other characteristics of individuals living in the census blocks. Planning measures to improve public health need to focus on places, as well as on individuals [42]. For instance, poor individuals living in deprived neighborhoods have marked place-related negative health, while these effects may not be relevant if the poor individuals are living in wealthy neighborhoods [41]. Demographic features and economic conditions of individuals are characteristics that can be used as control variables in studies using the multilevel models applied in this paper.
Another interesting point could be to study whether the values of individual self-reported health are influenced by neighborhood values of this measure. Additionally, other neighborhood-level variables could be used (e.g., a neighborhood’s social cohesion, or a neighborhood’s exposure to pollution) to assess the influence of these variables on self-reported health. In fact, collective social functioning, such as social cohesion, cultural practices and ideological backgrounds, are contextual (neighborhood-based) effects that may influence individual health [43].
Euclidean distances are highly correlated to real distances [36]. This kind of distance measure, and the probabilities of choosing healthcare services, were found to be straightforward indicators for constructing a meaningful measure of spatial accessibility to healthcare, and can be feasibly replicated in future research. Different distance thresholds may be used depending on the study area in future research. Furthermore, the spatial accessibility measure used in this study is adaptable, and researchers can test the measure by using other types of distances, such as real distances or perceived distances.
Alternative neighborhood delineations can be used to express the area-level measures of deprivation and healthcare accessibility. Different neighborhood delineations are equivalent to the different spatial structure of places or neighborhoods where people live, and to different scales of analysis. Identifying scale-free relationships between area-level measures of deprivation and healthcare accessibility and spatial structure metrics is a challenge in the study of urban dynamics [44]. The contextual effects found in this study may be subjected to these scale-free relationships, and further evaluation of the spatial implications of these contextual effects can support more efficient health and urban planning in the study area.
It is also important to mention that even when temporal mismatches exist in the used data sources, no extreme changes of census variables are expected between the year of the census (2010) and the year of the survey (2014). Therefore, the calculated multi-criteria deprivation index is suitable for the year 2014. Additionally, as mentioned in the introduction, self-reported health is a variable that tends to remain stable over time. There is a promising possibility for future research to apply the methodology of this study with an upcoming census, and to use the same survey data as in this study. This research has provided valuable information to support heath inequality analyses. First, the neighborhood effects suggest that planning and decision-making to improve health outcomes should not only be based on the healthcare service perspective, but also on the social and economic environments of the urban population. Second, the intra-urban variations of self-reported health between areas with different levels of deprivation and spatial accessibility to healthcare can offer urban planners valuable insights to connect local perceptions to strategies of planning healthier urban neighborhoods. Third, the results also suggest that considering simple indicators that contribute most to composite deprivation may be as useful as using a composite index of deprivation.
Additionally, the applied methodology can offer urban and health planners numerous sets of tools for understanding how the spatial representations of spatial accessibility to healthcare and deprivation either shelter or expose individuals to different health states. The spatial approach to understanding access to healthcare also offered insights into the relationships of healthcare services supply, population, and geographical distances. Furthermore, the results of mapping access to healthcare and deprivation become fundamental when linking values of these area-level measures to the individuals’ self-reported health.
5. Conclusions
The findings of this study contribute evidence of neighborhood effects of deprivation and spatial accessibility to healthcare on self-reported health. In terms of deprivation, the original multi-criteria deprivation index and the union scenario of deprivation contribute to these neighborhood effects. The evidence of these effects is clear: 22% of the variation of self-reported health can be attributed to differences between census blocks where values of the multi-criteria deprivation index—or union scenario deprivation—and spatial accessibility to healthcare interact. The results of this research show that linking self-reported health, multi-criteria deprivation, and spatial accessibility to healthcare could further inform investigations in the study of neighborhood effects on urban health, and could support decision-makers in urban planning. The results of the deprivation index and its scenarios can guide decision-makers to identify urgent zones to be addressed in order to reduce social and material disadvantages. Self-reported health is an important quality of life indicator. Policies to improve social and material conditions in neighborhoods will positively impact health outcomes in the study area, such as self-reported health. It is also necessary that health planners and physicians consider the importance of contextual (neighborhood-level) effects on population health. Contextual characteristics such as deprivation and spatial accessibility to healthcare may be relevant factors influencing people’s health in addition to primary healthcare. This study shows the potential implications of integral and multidisciplinary perspectives in urban planning. Processes of urban planning and decision-making need to link diverse elements such as health, perceptions, social issues and access to services to ensure a more pluralistic view of cities’ functionalities.
Acknowledgments
The presented work was funded by the Ecuadorian Secretary of Higher Education, Science, Technology and Innovation and the Ecuadorian Institute of Promotion of Human Talent (Scholarship contract No. 375-2012). It has also partially been funded by the Austrian Science Fund (FWF) through the Doctoral College GIScience (DK W 1237N23) at the University of Salzburg. Special thanks to Gabriel Gaona for his valuable help in implementing the automatization to calculate the spatial accessibility to healthcare. I also like to thank Mark Padgham for his valuable advice regarding statistical issues, and Helena Merschdorf for English-language corrections.
Conflicts of Interest
The founding sponsors had no role in the design of the study; in the collection, analyses, or interpretation of data; in the writing of the manuscript, and in the decision to publish the results.
References
- Allik, M.; Brown, D.; Dundas, R.; Leyland, A.H. Developing a new small-area measure of deprivation using 2001 and 2011 census data from Scotland. Health Place 2016, 39, 122–130. [Google Scholar] [CrossRef] [PubMed]
- Bissonnette, L.; Wilson, K.; Bell, S.; Shah, T.I. Neighbourhoods and potential access to health care: The role of spatial and aspatial factors. Health Place 2012, 18, 841–853. [Google Scholar] [CrossRef] [PubMed]
- Cabrera-Barona, P.; Wei, C.; Hagenlocher, M. Multiscale evaluation of an urban deprivation index: Implications for quality of life and healthcare accessibility planning. Appl. Geogr. 2016, 70, 1–10. [Google Scholar] [CrossRef]
- Carstairs, V. Deprivation indices: Their interpretation and use in relation to health. J. Epidemiol. Community Health 1995, 49, 3–8. [Google Scholar] [CrossRef]
- Havard, S.; Deguen, S.; Bodin, J.; Louis, K.; Laurent, O.; Bard, D. A small-area index of socioeconomic deprivation to capture health inequalities in France. Soc. Sci. Med. 2008, 67, 2007–2016. [Google Scholar] [CrossRef] [PubMed]
- Haynes, R.; Bentham, G.; Lovett, A.; Gale, S. Effects of distances to hospital and GP surgery on hospital inpatient episodes, controlling for needs and provision. Soc. Sci. Med. 1999, 49, 425–433. [Google Scholar] [CrossRef]
- Okwaraji, Y.B.; Cousens, S.; Berhane, Y.; Mulholland, K.; Edmond, K. Effect of geographical access to health facilities on child mortality in rural Ethiopia: A community based cross sectional study. PLoS ONE 2012, 7, e33564. [Google Scholar] [CrossRef] [PubMed]
- Pampalon, R.; Hamel, D.; Gamache, P.; Raymond, G. A deprivation index for health planning in Canada. Chronic Dis. Can. 2009, 29, 178–191. [Google Scholar] [PubMed]
- Tobias, M.I.; Cheung, J. Monitoring health inequalities: Life expectancy and small area deprivation in New Zealand. Popul. Health Metr. 2003, 1. [Google Scholar] [CrossRef]
- Wan, N.; Zhan, F.B.; Zou, B.; Wilson, J.G. Spatial Access to Health Care Services and Disparities in Colorectal Cancer Stage at Diagnosis in Texas. Prof. Geogr. 2013, 65, 527–541. [Google Scholar] [CrossRef]
- Townsend, P. Deprivation. J. Soc. Policy 1987, 16, 125–146. [Google Scholar] [CrossRef]
- Cabrera-Barona, P.; Murphy, T.; Kienberger, S.; Blaschke, T. A multi-criteria spatial deprivation index to support health inequality analyses. Int. J. Health Geogr. 2015, 14. [Google Scholar] [CrossRef] [PubMed]
- Jiang, H.; Eastman, J.R. Application of fuzzy measures in multi-criteria evaluation in GIS. Int. J. Geogr. Inf. Sci. 2000, 14, 173–184. [Google Scholar] [CrossRef]
- Malczewski, J. Ordered weighted averaging with fuzzy quantifiers: GIS-based multicriteria evaluation for land-use suitability analysis. Int. J. Appl. Earth Obs. Geoinf. 2006, 8, 270–277. [Google Scholar] [CrossRef]
- Bell, N.; Schuurman, N.; Hayes, M.V. Using GIS-based methods of multicriteria analysis to construct socio-economic deprivation indices. Int. J. Health Geogr. 2007, 6. [Google Scholar] [CrossRef] [PubMed]
- Penchansky, R.; Thomas, J.W. The Concept of Access: Definition and Relationship to Consumer Satisfaction. Med. Care 1981, 19, 127–140. [Google Scholar] [CrossRef] [PubMed]
- Guagliardo, M.F. Spatial accessibility of primary care: Concepts, methods and challenges. Int. J. Health Geogr. 2004, 3. [Google Scholar] [CrossRef] [PubMed]
- Delamater, P.L. Spatial accessibility in suboptimally configured health care systems: A modified two-step floating catchment area (M2SFCA) metric. Health Place 2013, 24, 30–43. [Google Scholar] [CrossRef] [PubMed]
- Schuurman, N.; Bérubé, M.; Crooks, V.A. Measuring potential spatial access to primary health care physicians using a modified gravity model. Can. Geogr. 2010, 54, 29–45. [Google Scholar] [CrossRef]
- Luo, J. Integrating the Huff model and floating catchment area methods to analyze spatial access to healthcare services. Trans. GIS 2014, 18, 436–448. [Google Scholar] [CrossRef]
- Yang, D.H.; Goerge, R.; Mullner, R. Comparing GIS-based methods of measuring spatial accessibility to health services. J. Med. Syst. 2006, 30, 23–32. [Google Scholar] [CrossRef] [PubMed]
- Andersen, R.M. Revisiting the Behavioral Model and Access to Medical Care: Does It Matter? J. Health Soc. Behav. 1995, 36, 1–10. [Google Scholar] [CrossRef] [PubMed]
- Miilunpalo, S.; Vuori, I.; Oja, P.; Pasanen, M.; Urponen, H. Self-rated health status as a health measure: The predictive value of self-reported health status on the use of physician services and on mortality in the working-age population. J. Clin. Epidemiol. 1997, 50, 517–528. [Google Scholar] [CrossRef]
- Bailis, D.S.; Segall, A.; Chipperfield, J.G. Two views of self-rated general health status. Soc. Sci. Med. 2003, 56, 203–217. [Google Scholar] [CrossRef]
- Cabrera-Barona, P.; Blaschke, T.; Gaona, G. Deprivation, healthcare accessibility and satisfaction: Geographical context and scale implications. Appl. Spat. Anal. Policy 2017. [Google Scholar] [CrossRef]
- Cabrera-Barona, P.; Blaschke, T.; Kienberger, S. Explaining Accessibility and Satisfaction Related to Healthcare: A Mixed-Methods Approach. Soc. Indic. Res. 2016. [Google Scholar] [CrossRef]
- Birch, C.P.D.; Oom, S.P.; Beecham, J.A. Rectangular and hexagonal grids used for observation, experiment and simulation in ecology. Ecol. Model. 2007, 206, 347–359. [Google Scholar] [CrossRef]
- Mideros, A. Ecuador: Defining and measuring multidimensional poverty. CEPAL Rev. 2006, 108, 49–67. [Google Scholar]
- Saaty, T.L. A Scaling Method for Priorities in Hierarchical Structures. J. Math. Psychol. 1977, 15, 234–281. [Google Scholar] [CrossRef]
- Bodin, L.; Gass, S.I.; Smith, R.H. On teaching the analytic hierarchy process. Comput. Oper. Res. 2003, 30, 1487–1497. [Google Scholar] [CrossRef]
- Boroushaki, S.; Malczewski, J. Implementing an extension of the analytical hierarchy process using ordered weighted averaging operators with fuzzy quantifiers in ArcGIS. Comput. Geosci. 2008, 34, 399–410. [Google Scholar] [CrossRef]
- Saaty, R. The analytic hierarchy process—What it is and how it is used. Math. Model. 1987, 9, 161–176. [Google Scholar] [CrossRef]
- Collins, P.A.; Hayes, M.V.; Oliver, L.N. Neighbourhood quality and self-rated health: A survey of eight suburban neighbourhoods in the Vancouver Census Metropolitan Area. Health Place 2009, 15, 156–164. [Google Scholar] [CrossRef] [PubMed]
- Besse Rimba, A.; Setiawati, M.D.; Sambah, A.B.; Miura, F. Physical Flood Vulnerability Mapping Applying Geospatial Techniques in Okazaki City, Aichi Prefecture, Japan. Urban Sci. 2017, 1, 7. [Google Scholar] [CrossRef]
- Phibbs, C.S.; Luft, H.S. Correlation of travel time on roads versus straight line distance. Med. Care Res. Rev. 1995, 52, 532–542. [Google Scholar] [CrossRef] [PubMed]
- Jones, S.G.; Ashby, A.J.; Momin, S.R.; Naidoo, A. Spatial implications associated with using euclidean distance measurements and geographic centroid imputation in health care research. Health Serv. Res. 2010, 45, 316–327. [Google Scholar] [CrossRef] [PubMed]
- Huff, D.L. A Probabilistic Analysis of Shopping Center Trade Areast. Land Econ. 1963, 39, 81–90. [Google Scholar] [CrossRef]
- Nezlek, J.B. A multilevel framework for understanding relationships among traits, states, situations and behaviours. Eur. J. Personal. 2007, 21, 789–810. [Google Scholar] [CrossRef]
- Luo, W.; Qi, Y. An enhanced two-step floating catchment area (E2SFCA) method for measuring spatial accessibility to primary care physicians. Health Place 2009, 15, 1100–1107. [Google Scholar] [CrossRef] [PubMed]
- Ross, N.A.; Tremblay, S.; Graham, K. Neighbourhood influences on health in Montréal, Canada. Soc. Sci. Med. 2004, 59, 1485–1494. [Google Scholar] [CrossRef] [PubMed]
- Stafford, M.; Marmot, M. Neighbourhood deprivation and health: Does it affect us all equally? Int. J. Epidemiol. 2003, 32, 357–366. [Google Scholar] [CrossRef] [PubMed]
- Macintyre, S.; Maciver, S.; Sooman, A. Area, Class and Health: Should we be Focusing on Places or People? J. Soc. Policy 1993, 22, 213–234. [Google Scholar] [CrossRef]
- Macintyre, S.; Ellaway, A.; Cummins, S. Place effects on health: How can we conceptualise, operationalise and measure them? Soc. Sci. Med. 2002, 55, 125–139. [Google Scholar] [CrossRef]
- Wei, C.; Padgham, M.; Cabrera-Barona, P.; Blaschke, T. Scale-Free Relationships between Social and Landscape Factors in Urban Systems. Sustainability 2017, 9, 84. [Google Scholar] [CrossRef]
Figure 1.
Deprivation in the study area: (a) the multi-criteria deprivation index; (b) the intersection alternative scenario of deprivation; (c) the union alternative scenario of deprivation.
Figure 1.
Deprivation in the study area: (a) the multi-criteria deprivation index; (b) the intersection alternative scenario of deprivation; (c) the union alternative scenario of deprivation.

Figure 2.
Gravity-based measure of healthcare spatial accessibility.


Table 1.
Indicators of the multi-criteria deprivation index for the city of Quito and their AHP-based weights.
Table 1.
Indicators of the multi-criteria deprivation index for the city of Quito and their AHP-based weights.
| Indicator (Ij) | Weight (wi) |
|---|---|
| % of population that have been physically disabled for more than one year | 0.048 |
| % of the population that does not have any level of formal education | 0.067 |
| % of the population that has no public social insurance | 0.090 |
| % of the population that works without payment | 0.111 |
| % of households with four or more persons per dormitory | 0.039 |
| % of households without access to the public drinking water system | 0.228 |
| % of households without access to the sewerage system | 0.102 |
| % of households without access to the public electricity grid | 0.108 |
| % of households with no garbage collection service | 0.076 |
| Distance (meters) to the nearest primary healthcare service | 0.131 |
Table 2.
Results of the multilevel models.
| Area-Based Features | Neighborhood | VPC | LR | AIC |
|---|---|---|---|---|
| Deprivation and spatial accessibility to healthcare | Type I | 0.22 | 4.13 ** | 218.90 |
| Intersection scenario of deprivation and spatial accessibility to healthcare | Type II | 0.00 | 0.00 | 223.10 |
| Union scenario of deprivation and spatial accessibility to healthcare | Type III | 0.22 | 3.00 *** | 220.10 |
** Significance < 0.05. *** Significance < 0.10.
© 2017 by the author. Licensee MDPI, Basel, Switzerland. This article is an open access article distributed under the terms and conditions of the Creative Commons Attribution (CC BY) license (http://creativecommons.org/licenses/by/4.0/).
Share and Cite
MDPI and ACS Style
Cabrera-Barona, P. Influence of Urban Multi-Criteria Deprivation and Spatial Accessibility to Healthcare on Self-Reported Health. Urban Sci. 2017, 1, 11. https://doi.org/10.3390/urbansci1020011
AMA Style
Cabrera-Barona P. Influence of Urban Multi-Criteria Deprivation and Spatial Accessibility to Healthcare on Self-Reported Health. Urban Science. 2017; 1(2):11. https://doi.org/10.3390/urbansci1020011
Chicago/Turabian StyleCabrera-Barona, Pablo. 2017. "Influence of Urban Multi-Criteria Deprivation and Spatial Accessibility to Healthcare on Self-Reported Health" Urban Science 1, no. 2: 11. https://doi.org/10.3390/urbansci1020011