Review

Investigation of Structure and Dynamics in Disordered Materials Using Containerless Techniques with In-Situ Quantum Beam and Thermophysical Property Measurements

1
Synchrotron X-ray Group, Light/Quantum Beam Field, Research Center for Advanced Measurement and Characterization, National Institute for Materials Science (NIMS), 1-1-1 Kouto, Sayo, Hyogo 679-5148, Japan
2
Topological Analysis Group, Information Integrated Materials Design Field, Center for Materials Research by Information Integration, National Institute for Materials Science (NIMS), 1-2-1 Sengen, Tsukuba, Ibaragi 305-0047, Japan
3
Research & Utilization Division, Japan Synchrotron Radiation Research Institute, 1-1-1 Kouto, Sayo, Hyogo 679-5198, Japan
4
PRESTO, Japan Science and Technology Agency, 7 Gobancho, Chiyoda-ku, Tokyo 102-0076, Japan
5
Institute of Space and Astronautical Science (ISAS), Japan Aerospace Exploration Agency (JAXA), Tsukuba, Ibaraki 305-8505, Japan
6
Materials Development, Inc., Arlington Heights, IL 60004, USA
7
Advanced Photon Source, Argonne National Laboratory, Argonne, IL 60439, USA
*
Author to whom correspondence should be addressed.
Quantum Beam Sci. 2018, 2(1), 5; https://doi.org/10.3390/qubs2010005
Submission received: 22 December 2017 / Revised: 13 February 2018 / Accepted: 21 February 2018 / Published: 26 February 2018
(This article belongs to the Special Issue Selected Reviews in Quantum Beam Science)

Abstract

:
The use of levitation (containerless) techniques can enable new scientific discoveries because deeply undercooled and metastable liquids can be achieved over a wide temperature range. This review article summarizes the state-of-art instrumentation for structure measurements at synchrotron radiation/neutron sources and for thermophysical property measurements not only on the ground but also in microgravity utilizing the International Space Station (ISS). Furthermore, we introduce recent scientific topics on high-temperature oxide liquids and oxide glasses synthesized from levitated undercooled liquids by the use of quantum beam measurements analyzed using advanced computation.

Graphical Abstract

1. Introduction

Investigation of the liquid state at high temperatures is very challenging especially above about 1500˚C, because chemical reactions with containers are very difficult to avoid. Moreover, the contribution of diffraction from a crystalline container makes it difficult to obtain reliable data from liquids. Levitation and containerless methods can overcome these problems and, in many cases, enable deep undercooling and enhanced glass formation owing to the elimination of extrinsic heterogeneous nucleation. Recently, the use of levitation to study liquids and the formation of glasses from supercooled liquids has been of particular interest in understanding the structure of these materials and the process of glass formation. Quantum beam measurements, in particular synchrotron X-ray and neutron diffraction techniques are a powerful tool to study the atomic arrangement in glasses and liquids. Moreover, measurements of the thermophysical properties (density, viscosity and surface tension) of high temperature levitated liquids become feasible due to the development of levitation techniques. The viscosity of high-temperature liquids is especially important for understanding the nature of liquids, in particular for strong (high-glass-forming ability) and fragile (low-glass-forming ability) liquids as described by Angell [1] on the basis of Arrhenius’ plot of viscosity (Angell plot). In addition, density is a very important property that is needed to perform computer simulations, because it determines the size of the simulation box that is required. In this article, we review recent developments in the instrumentation of levitation techniques developed at quantum beam facilities and recent studies on thermophysical property measurements. Moreover, state-of-the-art scientific activities are reviewed and we consider future directions for the use of levitation techniques at the International Space Station (ISS) and quantum beam sources. This review paper describes the application of quantum beam techniques in the broader context of advancing the understanding of the processing and properties of disordered materials such as glasses. Measurements of thermophysical properties and the use of advanced computer simulations are cited to illustrate how the quantum beam measurements provide essential data that enable a deeper understanding of complex materials.

2. Levitation Techniques

Some of the first levitation measurements were reported in 1923 by Muck [2], who used the electromagnetic levitation (EML) technique. In EML, the sample is levitated by an inhomogeneous electromagnetic field generated in a radio-frequency coil and induces eddy currents in the material; these interact with the applied magnetic field via a Lorentz force that counteracts gravity [3].
There are several levitation techniques that were subsequently developed. Aerodynamic levitation (conical nozzle levitation (CNL)), various kinds of magnetic levitation including EML, electrostatic levitation (ESL), acoustic levitation (AL) and aero-acoustic levitation (AAL) techniques, etc.—the details of these techniques are reviewed in [3]. In this article, we focus on CNL, AL and ESL, because we have been intensively working on these techniques for diffraction and thermophysical properties measurements.

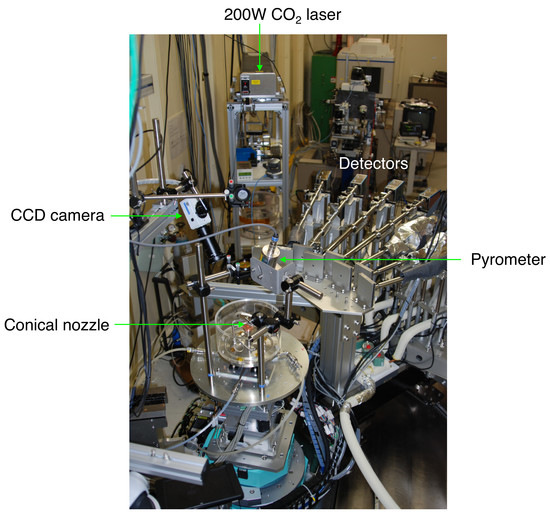
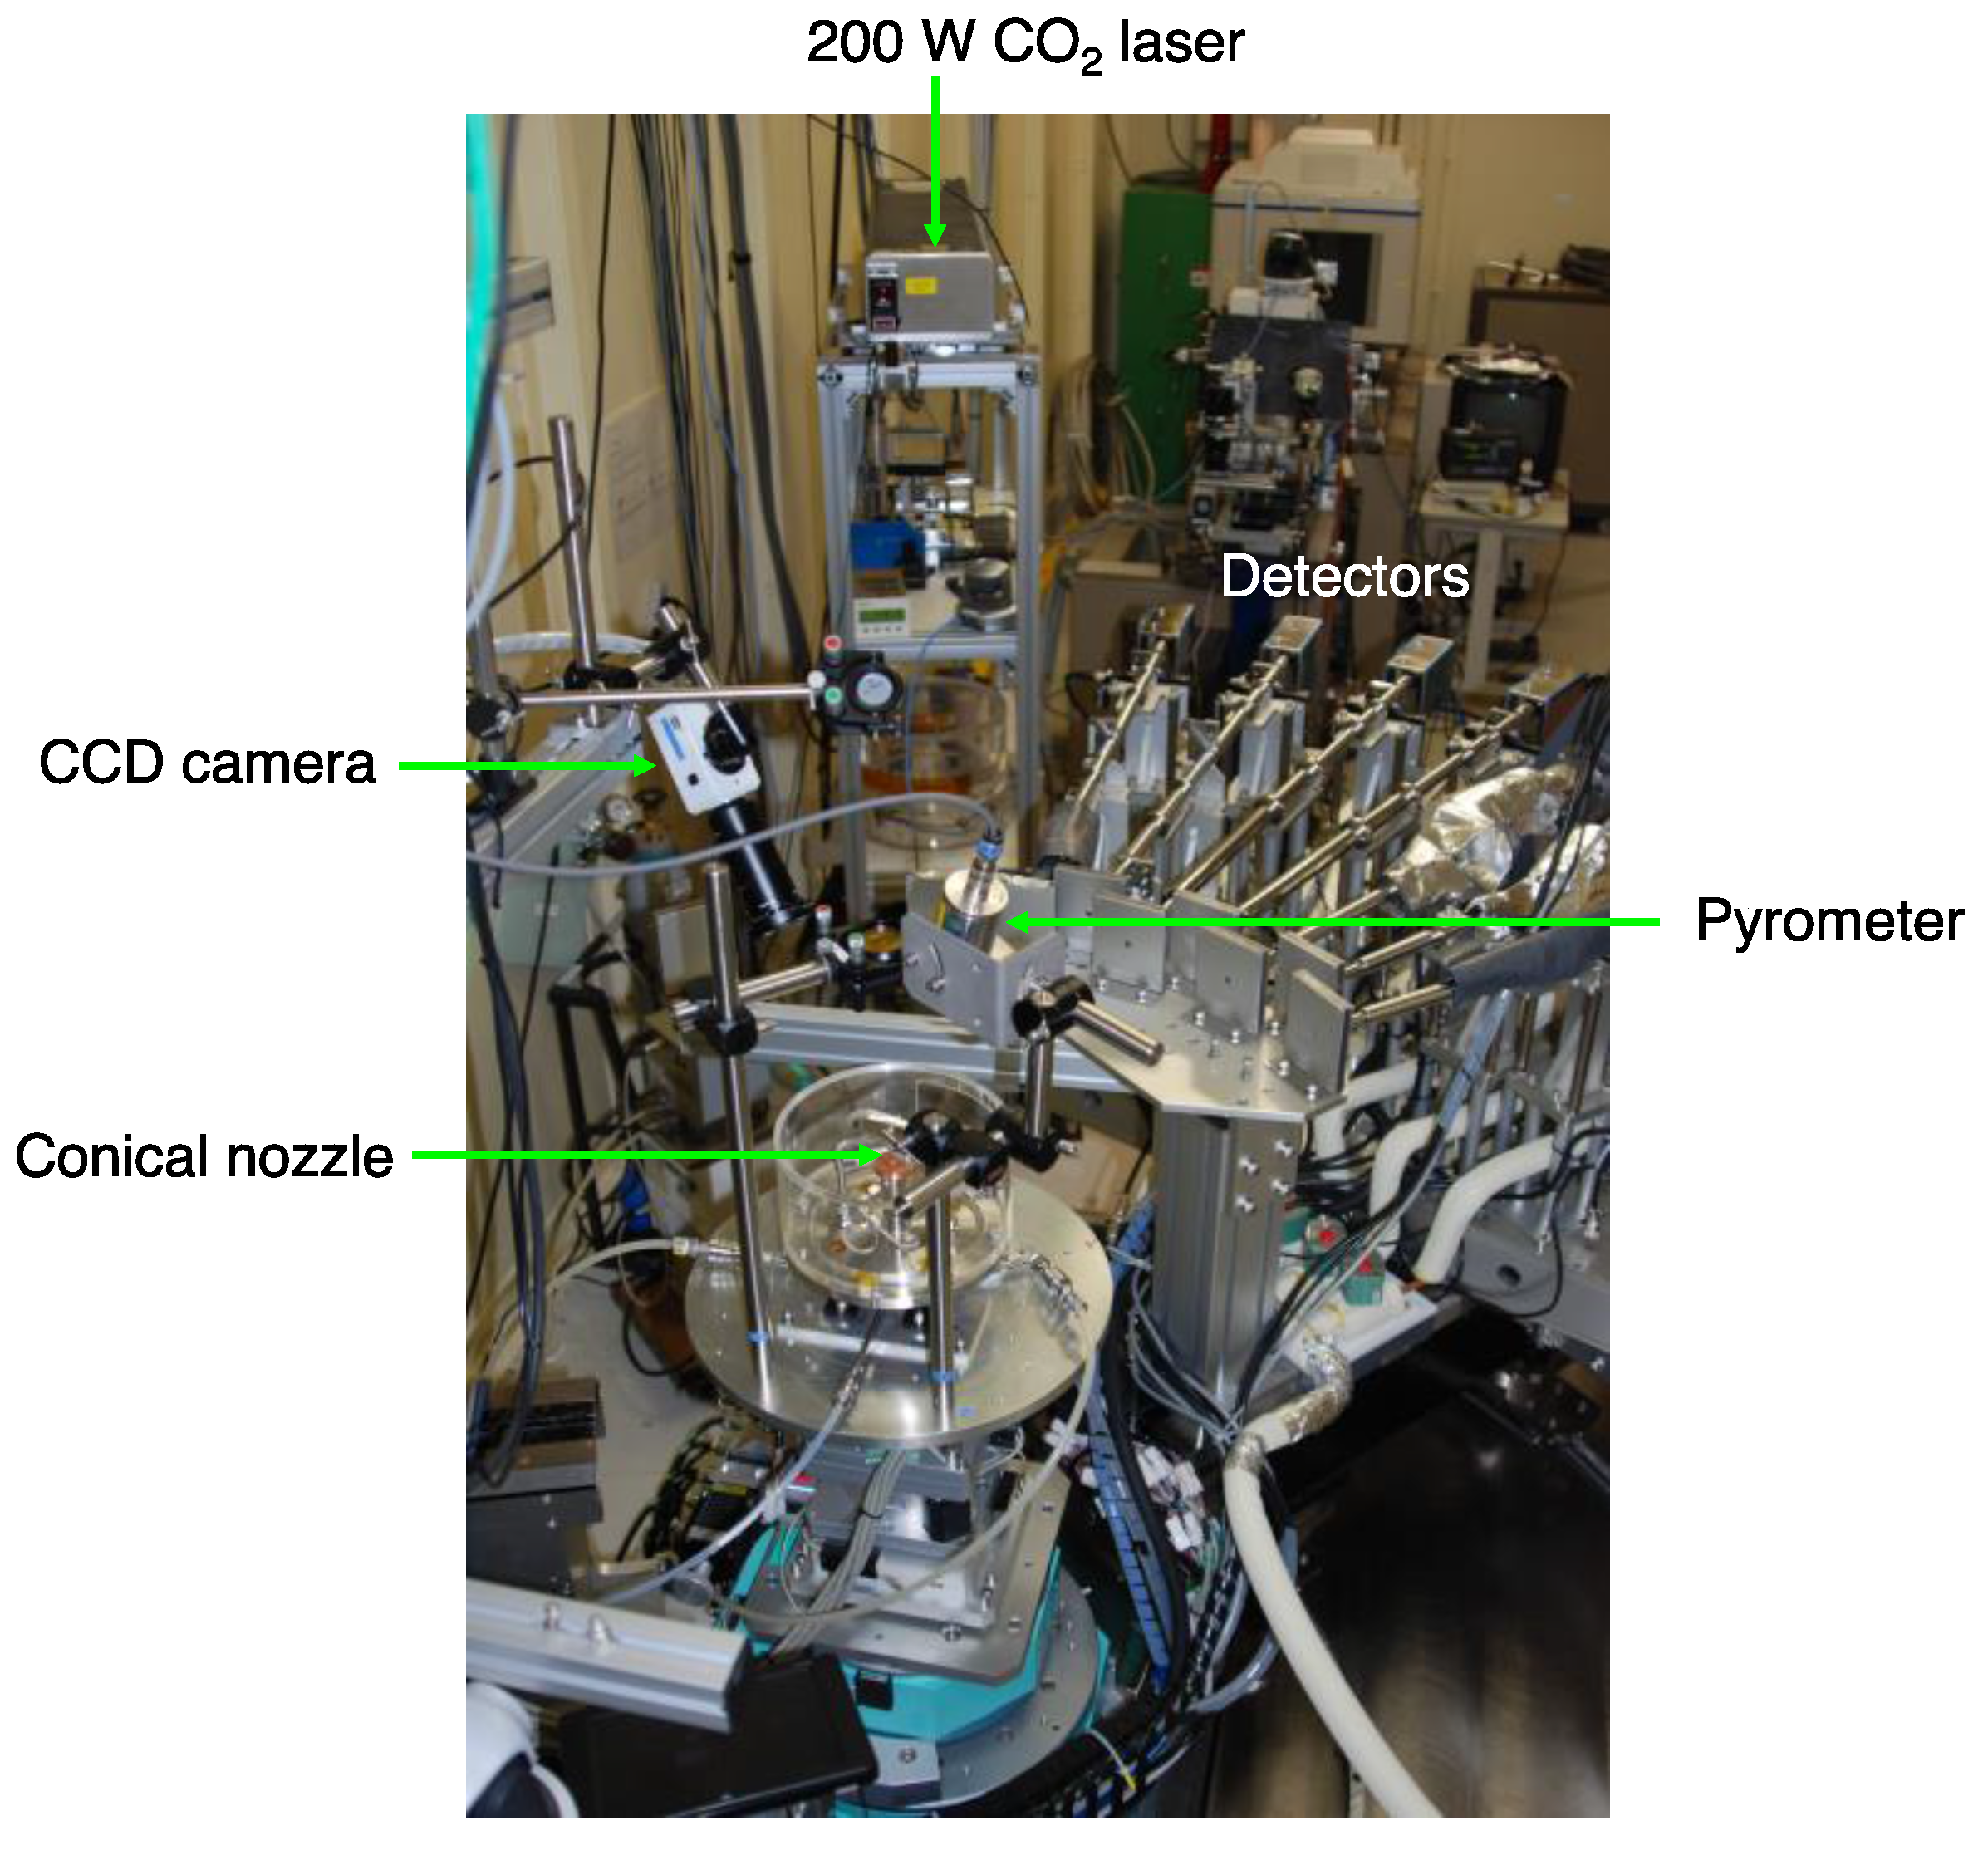
3. Conical Nozzle Levitation

In the CNL technique [3], a sample is levitated by a gas flow in a convergent-divergent nozzle, where the Bernoulli force lifts the sample back to the axis of the nozzle. Stably levitated samples can then be heated—typically by a continuous wave laser beam. The condition for levitation is derived from the law of momentum conservation applied to a control volume that contains the sample:
[ 1 2 ρ G μ 2 + p ]   d A = M g ,
where ρG, μ and p are the gas density, vertical gas flow velocity and gas pressure, respectively and Mg is the sample weight. The integral is evaluated over the surface A of the control volume.
The CNL system is the most popular levitation technique at quantum beam sources—the Advanced Photon Source of the Argonne National Laboratory (Argonne, IL, USA), the Spallation Neutron Source (SNS) of Oak Ridge National Laboratory (Oak Ridge, TN, USA) and SPring-8 (Kouto, Sayo, Japan). Figure 1 shows the CNL system with a 200 W CO2 laser installed at BL04B2 of SPring-8. The CNL system is very easy to set up because the laser is permanently installed in an experimental hutch. High-energy X-rays of 61 keV and 113 keV are available at BL04B2. The great advantages of the use of high-energy X-rays are:
(i)
Although X-ray diffraction data suffers from a Q-dependent decrease in coherent scattering cross section, high-energy X-rays provide high-Q data with small scattering angles, which suppress the energy- and 2θ-dependent correction terms.
(ii)
High-energy X-rays expand the capability of transmission geometry due to high penetration power. We can probe the bulk structure of a 2–3 millimeter diameter liquid droplet.
(iii)
High-flux X-rays are suitable for time-resolved diffraction experiments when combined with an area detector [4].

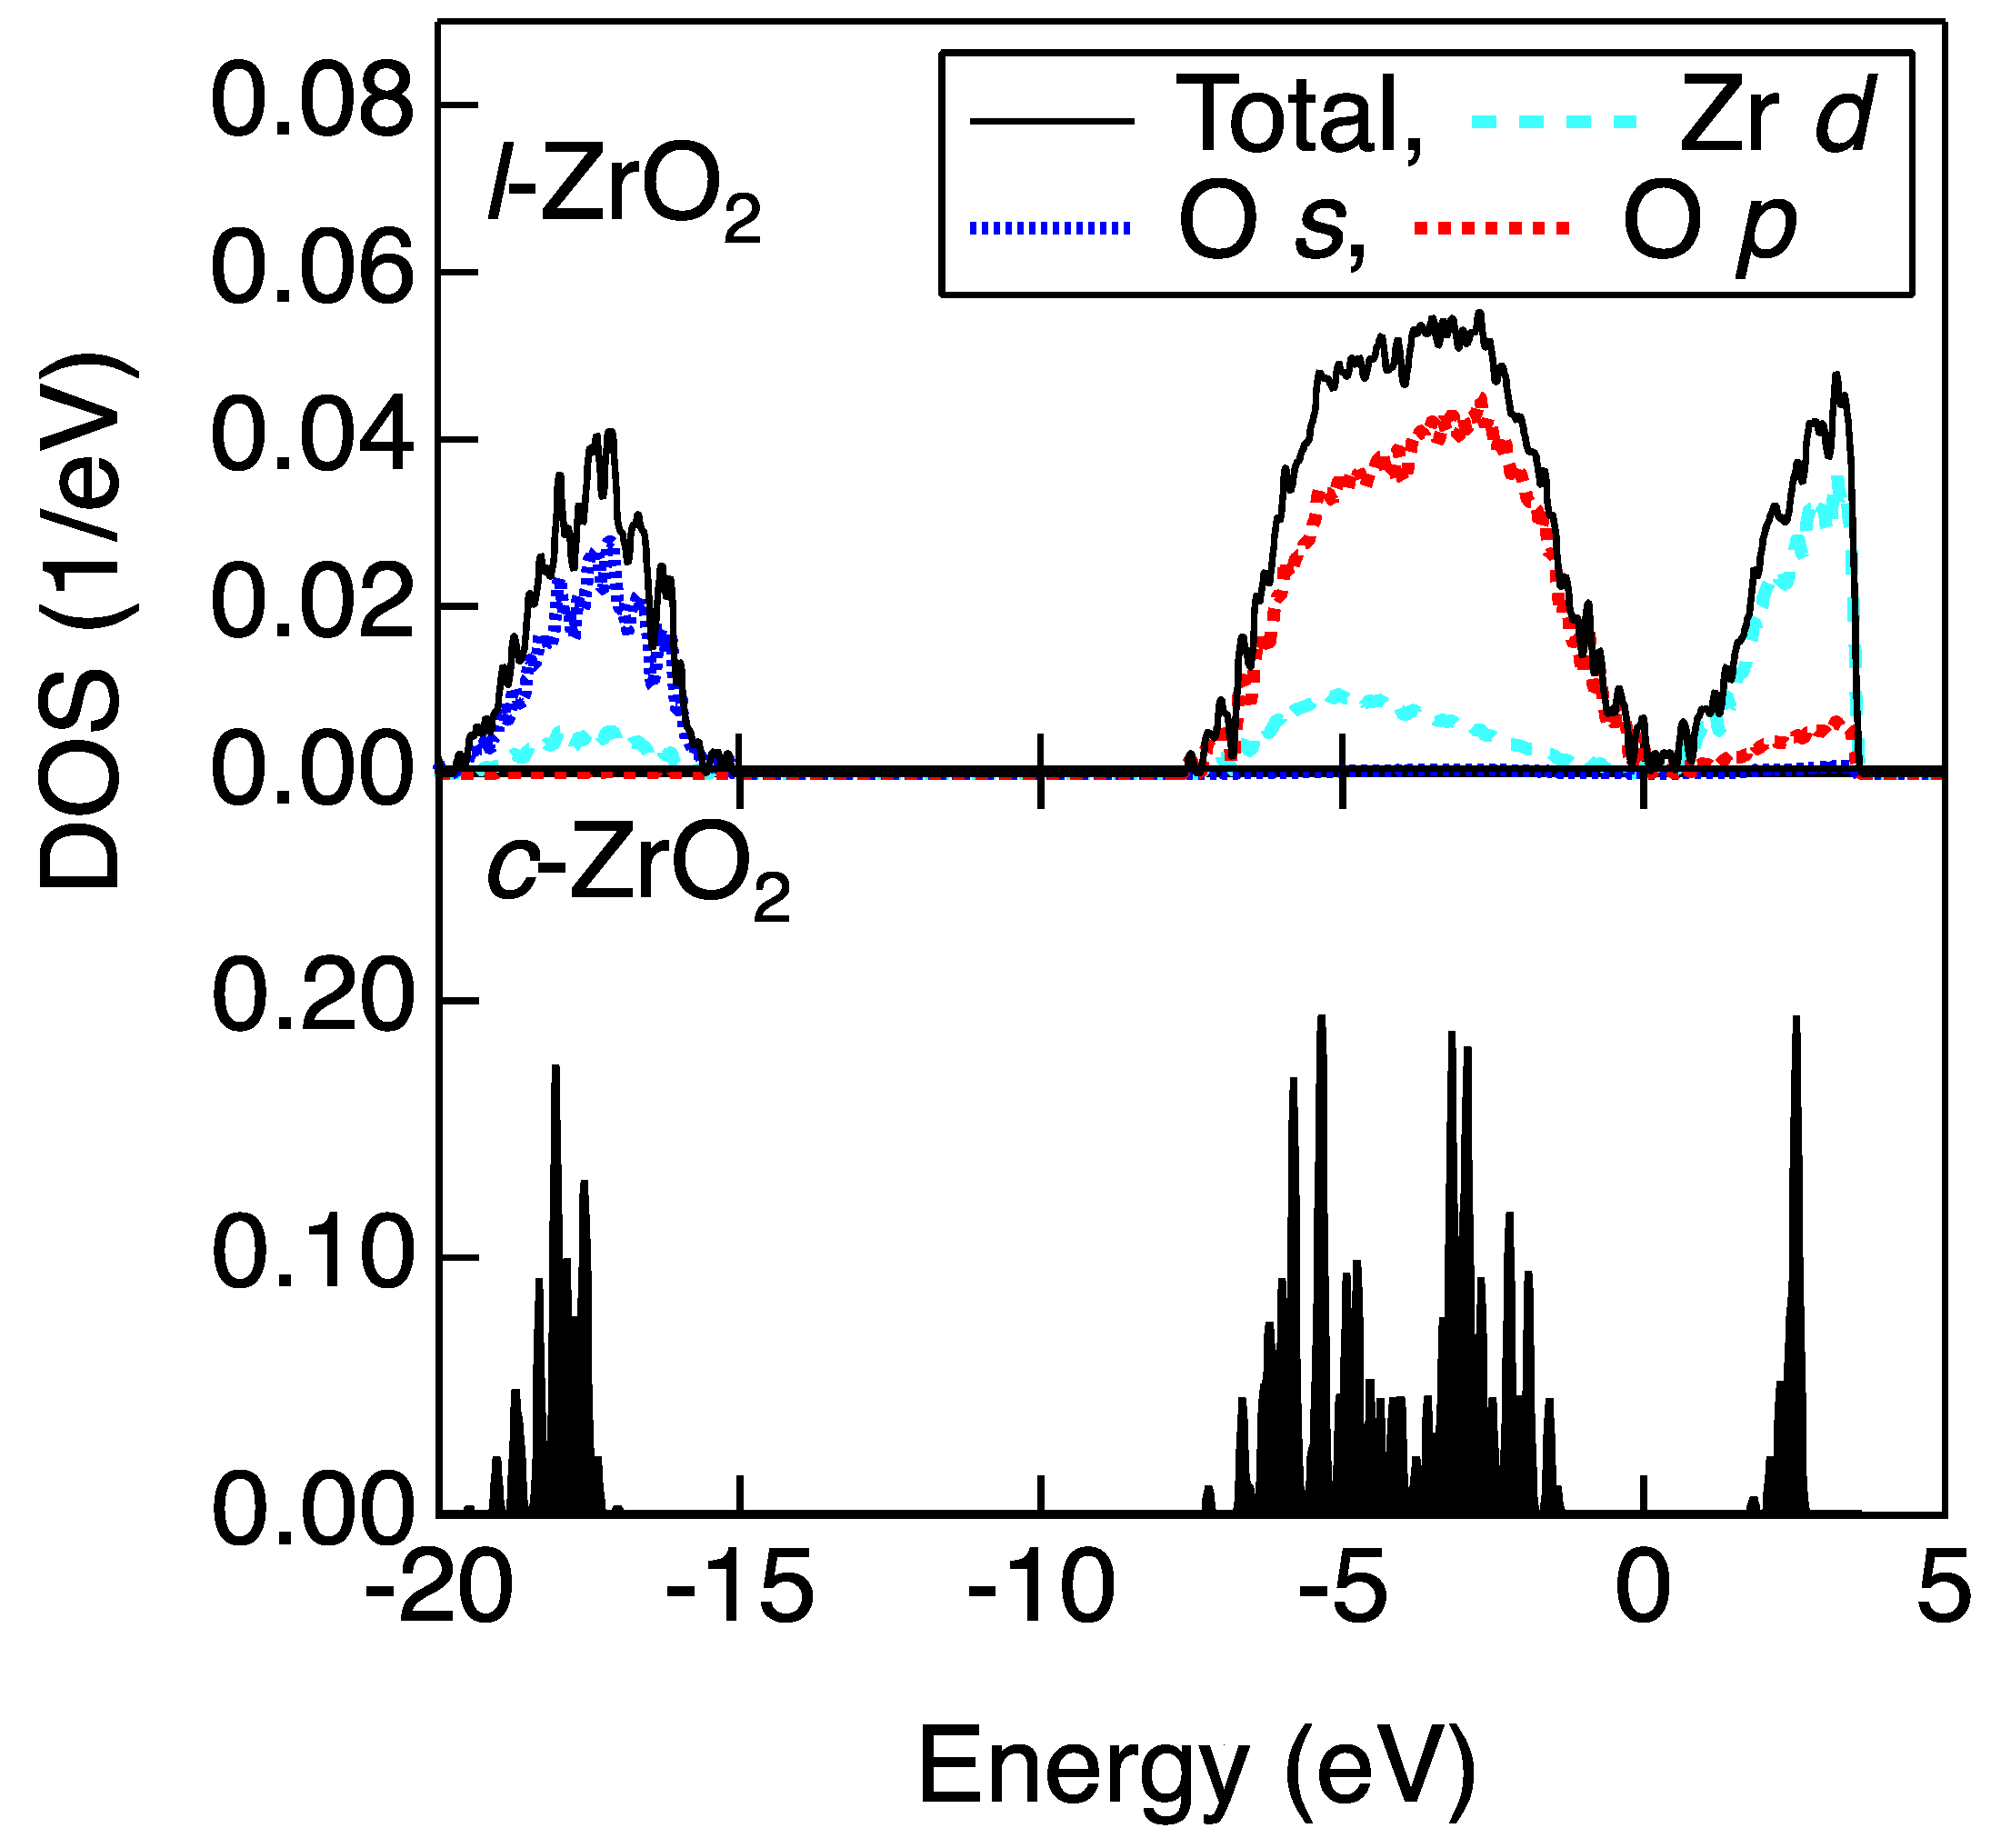
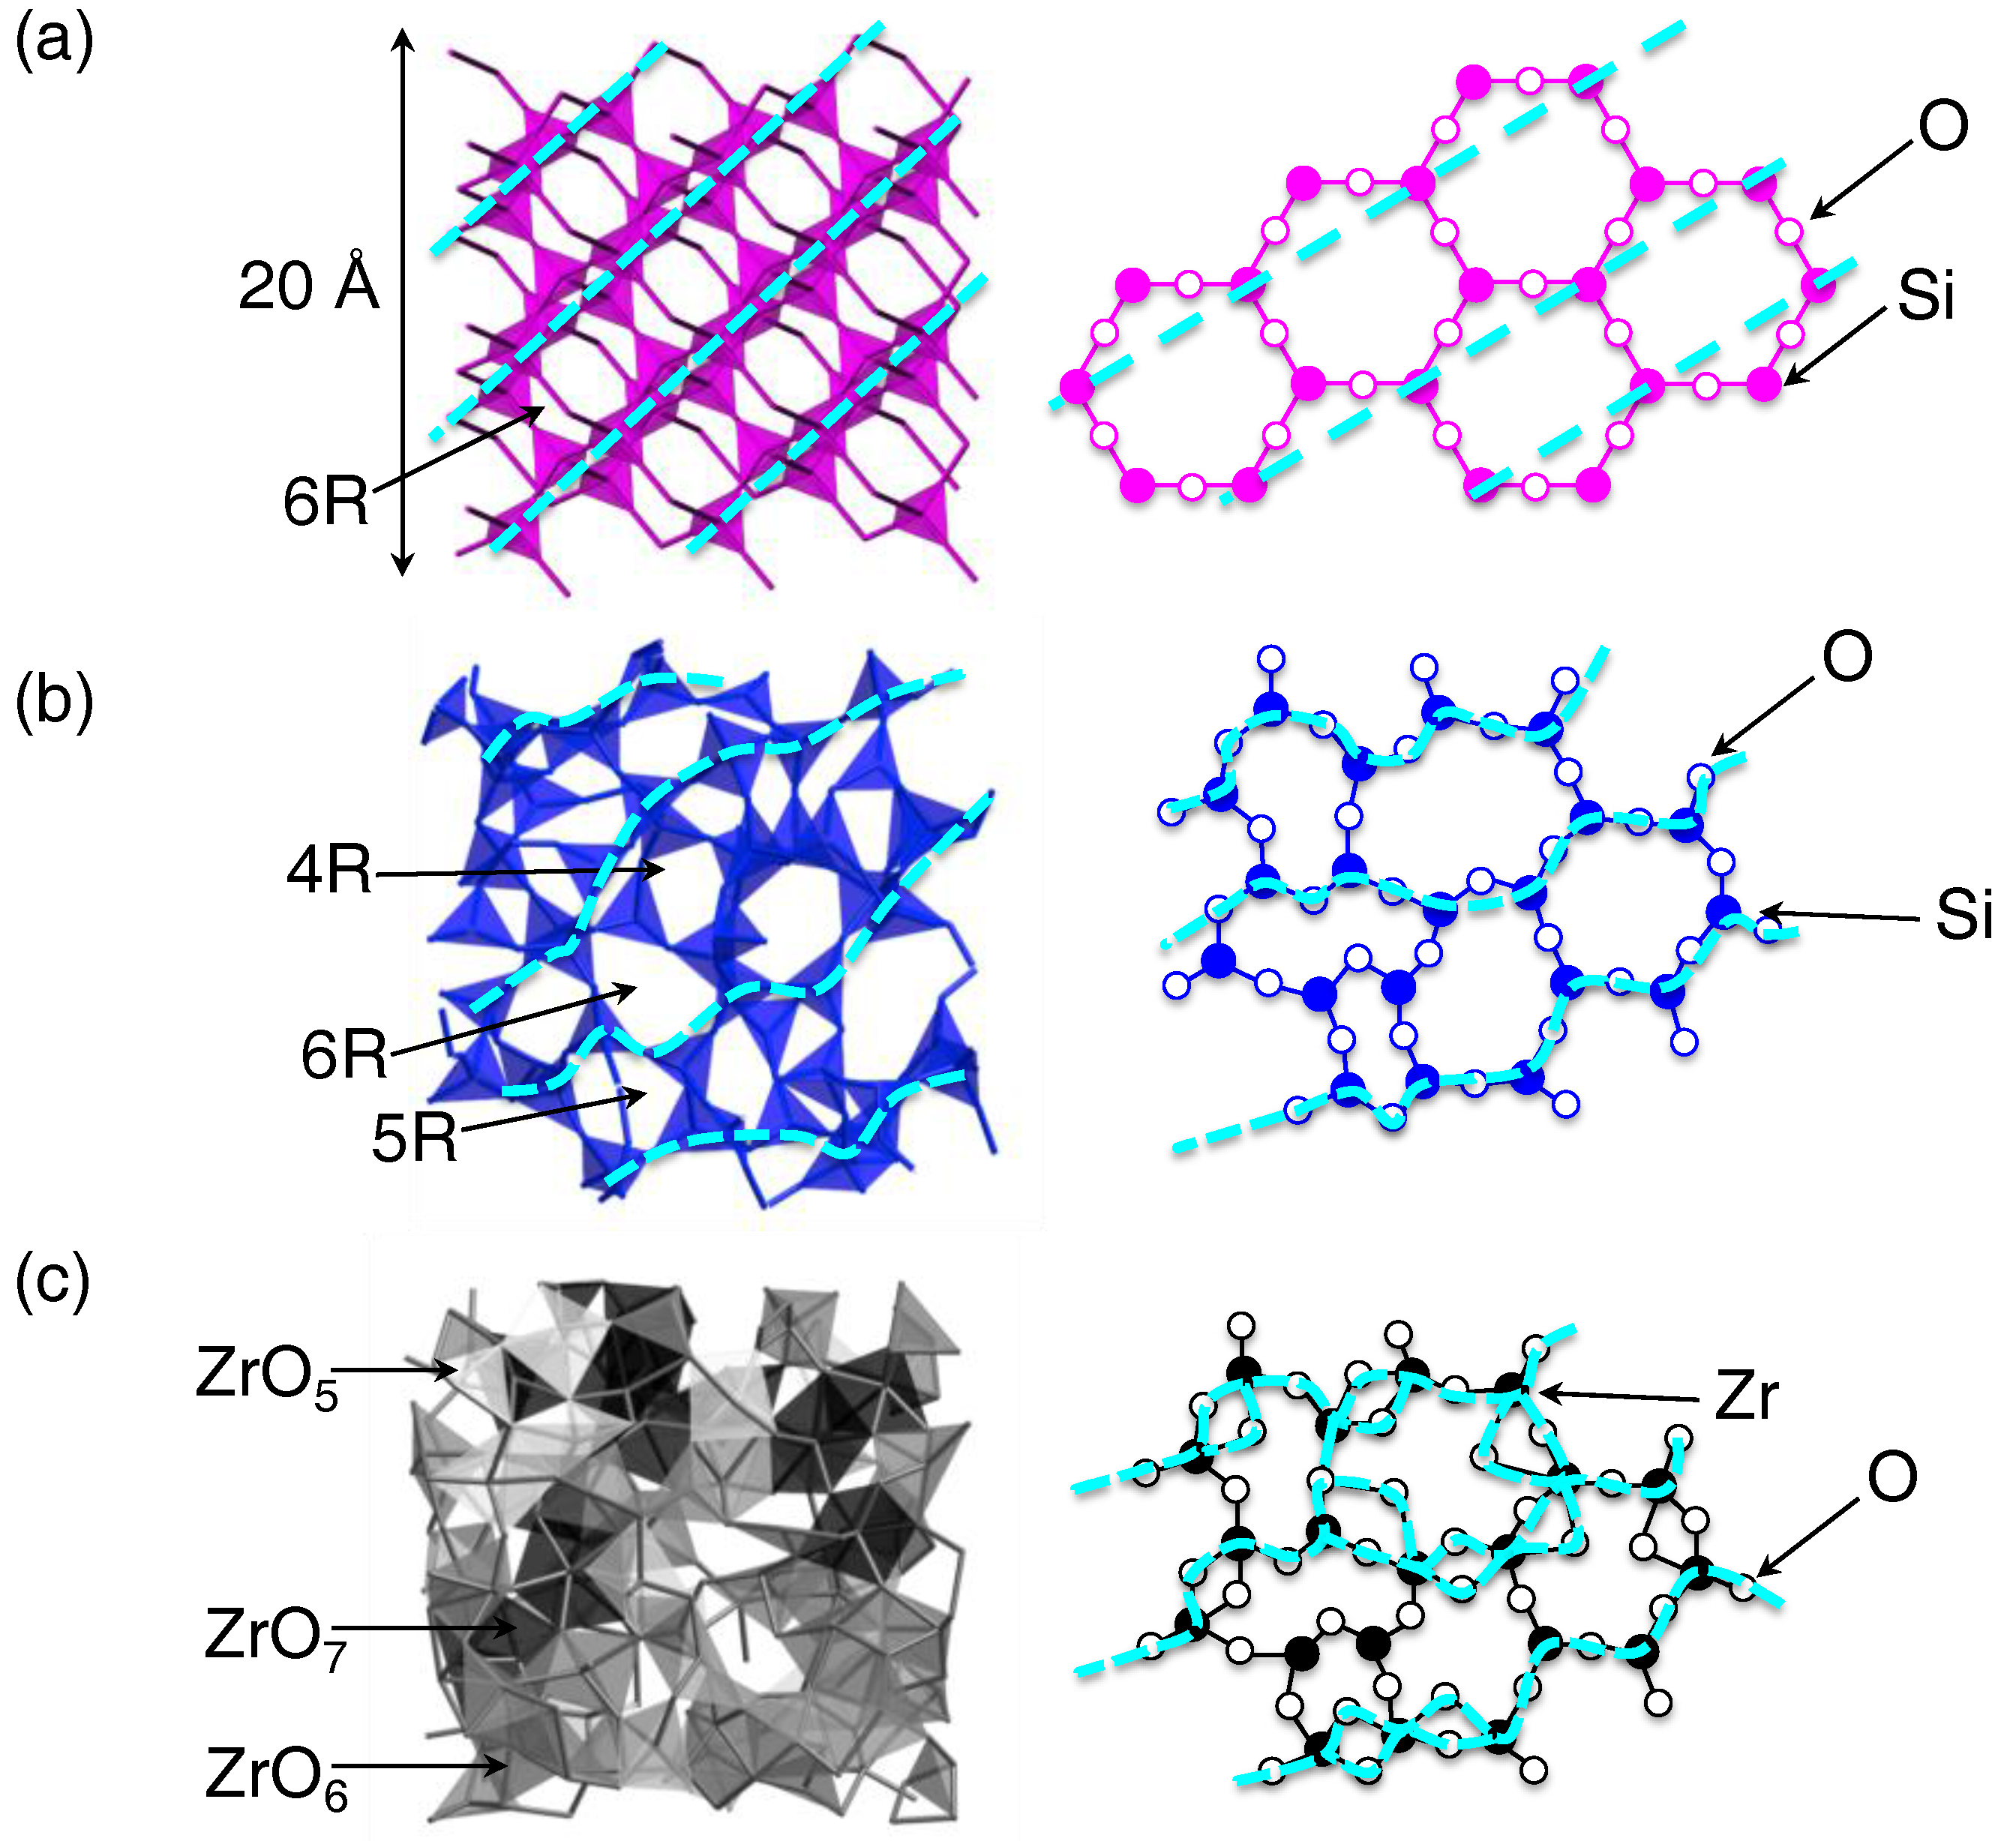
3.1. Atomistic and Electronic Structures of a Non-Glass Forming Liquid

The CNL systems have been widely applied to diffraction measurements of high-temperature oxide melts Al2O3 [5], Y2O3 [6], Ho2O3 [6], La2O3 [6], ZrO2 [6,7] and UO2 [8] using high-energy X-rays and neutrons at advanced quantum beam facilities.
As a benchmark scientific case, a study on atomistic and electronic structures of liquid (l)-ZrO2 are reviewed [7]. In this study, diffraction data was collected at SPring-8 using a CNL apparatus and density was measured using CNL technique at Japan Aerospace eXploration Agency (JAXA) (Tsukuba, Japan). Zirconium dioxide is widely used as a refractory material and a nucleating agent in the production of glass ceramics, implying that liquid l-ZrO2 is a non-glass-forming liquid. The X-ray total structure factors S(Q) for l-ZrO2 at 2600–2800 °C are shown in Figure 2a. We have succeeded in measuring high quality diffraction data of a very high-temperature oxide melt. The structural change between the liquid at 2800 °C and the undercooled liquid at 2600 °C is subtle, suggesting that the liquid structure is stable in undercooled conditions and further deep undercooling is necessary to access metastable phases.
A sharp peak observed at Q = 2 Å−1 can be assigned to the principal peak [9], which reflects the oxygen packing fraction, because the expected position for the first sharp diffraction peak (FSDP) is Q ~ 1 Å−1 (further discussed in Figure 3a). The X-ray total correlation functions T(r) for l-ZrO2 (Figure 2b) also show small differences in the real space, too, confirming that liquid structure is very stable in the temperature of 2600–2800 °C. The first peak observed at about 2.1 Å is assigned to Zr–O correlation and a tail to ~3 Å implies the formation of distorted ZrOn polyhedra in the liquid. The second peak, observed at 3.7 Å, can be assigned mainly to the Zr–Zr correlation and the O–O correlation peak is unclear due to its small weighting factor for X-rays. The Zr–O correlation length of 2.1 Å is longer than those of Si–O (~1.63 Å [10] at 1600–2100 °C) and Al-O (~1.78 Å [5] at 2127 °C) owing to substantial differences between the ionic radii of silicon, aluminum and zirconium ions. The increased cation-oxygen correlation length in the liquid phase suggests that the oxygen coordination number around zirconium is higher than four because 2.1 Å is close to the sum of the ionic radii of oxygen (1.35 Å) and six-fold zirconium (0.72 Å). The structure of l-ZrO2 is therefore made up of large, interconnected polyhedral units and is very different from those of l-SiO2 and l-Al2O3.
The X-ray total structure factor S(Q) obtained from the density functional theory (DFT)-molecular dynamics (MD) simulation at 2800 °C is shown in Figure 2a as a solid magenta curve. Additional insight into the structure of l-ZrO2, in comparison with that of l-SiO2 and l-Al2O3, can be found by calculating the Bhatia-Thornton [11] number—number partial structure factor SNN(Q), which indicates for the topological order in a system
S N N ( Q ) = c A 2 S A A ( Q ) + 2 c A c B S A A ( Q ) S B B ( Q ) + c B 2 S B B ( Q ) ,
where Sij(Q) is a Faber-Ziman partial structure factor [12] and ci denotes the atomic fraction of chemical species i. Moreover, it is possible to compare data for three liquids without taking into account the difference in the sensitivity of elements to X-rays because weighting factors for X-rays are eliminated in SNN(Q). Figure 3a shows SNN(Q) for l-ZrO2 at 2800 °C compared with those for l-Al2O3 at 2127 °C [5] and l-SiO2 at 2100 °C [10]. Only l-SiO2 exhibits an FSDP at QrAX = 2.7 (rAX is the atomic cation (A)—anion (X) distance in AX polyhedra). The position QFSDP of the FSDP arises from an underlying periodicity of 2π/QFSDP that originates, for example, from the formation of pseudo-Bragg planes with a finite correlation length of 2π/ΔQFSDP in l-SiO2 [13]. On the other hand, neither l-Al2O3 nor l-ZrO2 shows an FSDP in SNN(Q), although a small contribution arising from Zr–O and O-O correlations can be observed at QrAX ~ 2.2 in the l-ZrO2 data. Since the Bhatia-Thornton SNN(Q) can eliminate the weighting factors for X-rays, the absence of an FSDP in SNN(Q) for l-ZrO2 is a signature for a non-glass-forming liquid. Another important feature in SNN(Q) is that both l-SiO2 and l-Al2O3 exhibit a second principal peak (PP) at QrAX = 5 while the PP is not distinct in l-ZrO2 data.
The coordination number of distributions of l-SiO2 [10], l-Al2O3 [5] and l-ZrO2 calculated from the structural models are shown in Figure 3b. SiO4 tetrahedra are predominant in l-SiO2, while l-Al2O3 comprises AlO3, AlO5 and AlO6 units as well as four-fold Al. For l-ZrO2, the most common configurations are ZrO5, ZrO6 and ZrO7. Although ZrO2 and Al2O3 have different metal:oxygen ratios, this comparison supports our view that the variety of oxygen coordination around cations in l-ZrO2 is another characteristic feature of non-glass-forming behavior, because it can disturb the evolution of intermediate-range ordering.
To obtain structural features beyond the first coordination distance, a polyhedral connection analysis was performed for l-SiO2, l-Al2O3 and l-ZrO2. Figure 3c shows a comparison of the fractions of corner-sharing, edge-sharing and face-sharing polyhedral units in the liquids. The corner sharing of oxygen is prevalent in l-SiO2, which is a unique feature of glass forming liquids (GFLs) according to Zachariasen [14]. However, both l-Al2O3 and l-ZrO2 exhibit a considerable amount of oxygen edge sharing, implying that the variety of polyhedral connections is another characteristic feature of single-component non-glass-forming oxide liquids.
Electronic structure analysis was carried out in terms of the electronic density of states (DOS) and effective charges for snapshots of the high-temperature phases of crystalline (c-) ZrO2 and l-ZrO2. The DOS (above −20 eV) of c- and l-ZrO2 and its projections (P-DOS) for l-ZrO2 are shown in Figure 4. The P-DOS plots reveal that this part of the electronic spectrum is mainly associated with oxygen (O-2p orbitals) and that the Zr semicore states corresponding to the atomic Zr-4s and Zr-4p orbitals are deeper (below −20 eV, not shown). The zirconium d-component dominates in the conduction band of l-ZrO2. The effect of a high temperature on the distorted ZrOn polyhedra in l-ZrO2 is evident as a broadening of the energy bands and the gap between the valence and conduction bands disappears (the calculated band gap is 3.26 eV for c-ZrO2). This feature is probably related to an indistinct PP in SNN(Q) for l-ZrO2. The difference between the electronegativities of Zr (1.3) and O (3.5) indicates that the chemical bonding between the two elements is mainly ionic and this is supported by the significant weight of the oxygen P-DOS for the highest valence band. The effective charges calculated by the Bader method are +2.62e and −1.31e for Zr and O in l-ZrO2, respectively and reflect the ionic bonding. The atomic charges in l-ZrO2 are very similar to those in the crystalline phase, which is in accordance with our previous studies on MgO–SiO2 [15] and CaO–Al2O3 [16] glasses. The associated atomic volumes imply that the increased oxygen volume in l-ZrO2 compensates for the decreased oxygen coordination and this results in comparable atomic charges for the two phases. Similar behavior has been found for MgO–SiO2 glass [15].
The origin of the FSDP associated with the formation of intermediate-range ordering in oxide glasses and liquids remains controversial because the inherent disorder complicates the ability of AX polyhedral connections to form an A-X network. SiO2 has exceptionally high glass forming ablity (GFA) and the origin of the FSDP in SiO2 has often been studied. The results are summarized in Reference [17]. The random network model of Zachariasen [14], which was modified for an oxide glass [17,18,19], demonstrates that the intermediate-range ordering arises from the periodicity of boundaries between successive small cages in the network formed by connected, regular SiO4 tetrahedra with shared oxygen atoms at the corners. It has also been suggested that the small cages are topologically disordered [20], resulting in a broad distribution of ring sizes from threefold to twelvefold rings centered at six-fold rings [15]. This is reflected in SNN(Q) for l-SiO2 (Figure 3a), where the FSDP is broader than the corresponding Bragg peak in the crystalline phase (cristobalite, c-SiO2), where only a six-fold ring contributes.
Figure 5a,b illustrate the three-dimensional atomic configurations and schematic illustrations of c-SiO2 and l-SiO2, respectively. The crystalline phase exhibits only six-fold rings of six SiO4 tetrahedra, resulting in long-range periodicity (dashed cyan lines in Figure 5a). However, some pseudo-Bragg planes (dashed cyan lines in the left panel of Figure 5b) can be recognized in l-SiO2. Although the introduction of different ring sizes can easily modify the crystalline topological order (Figure 5b), the interconnection of regular SiO4 tetrahedra with shared oxygen at corners only yields the broadened Bragg peak as the FSDP. As it can be seen in Figure 3a, an FSDP is absent in SNN(Q) for l-ZrO2. This is because the variety of short-range structural units with a large oxygen coordination, ZrO5, ZrO6, and ZrO7, and the large contribution of oxygen edge sharing prevent the formation of intermediate-range ordering. A similar feature can be expected in l-Y2O3 and l-La2O3 because their Faber-Ziman partial structure factors Sij(Q) do not contribute to the expected Q position of ~1 Å−1 for an FSDP. Short-range structural disordering in l-ZrO2 is further demonstrated in the three-dimensional atomic configuration and the schematic illustration of l-ZrO2 (Figure 5c). The periodicity of boundaries (dashed lines) is suppressed by the edge sharing of oxygen associated with the formation of ZrO5, ZrO6 and ZrO7. Although ZrO2 forms a network structure by interconnecting AX polyhedra in the liquid phase, it is shown that the various short-range structural units and their connectivity cause disorder at the intermediate range and prevent the evolution of an FSDP for the liquid. These results demonstrate that the absence of an FSDP in SNN(Q) can be an important indicator of single-component non-glass-forming oxide liquids but this does not necessarily apply similarly to other non-glass-forming liquids. The absence of an FSDP in SNN(Q) suggests that both l-Al2O3 and l-ZrO2 are extremely fragile liquids [1].

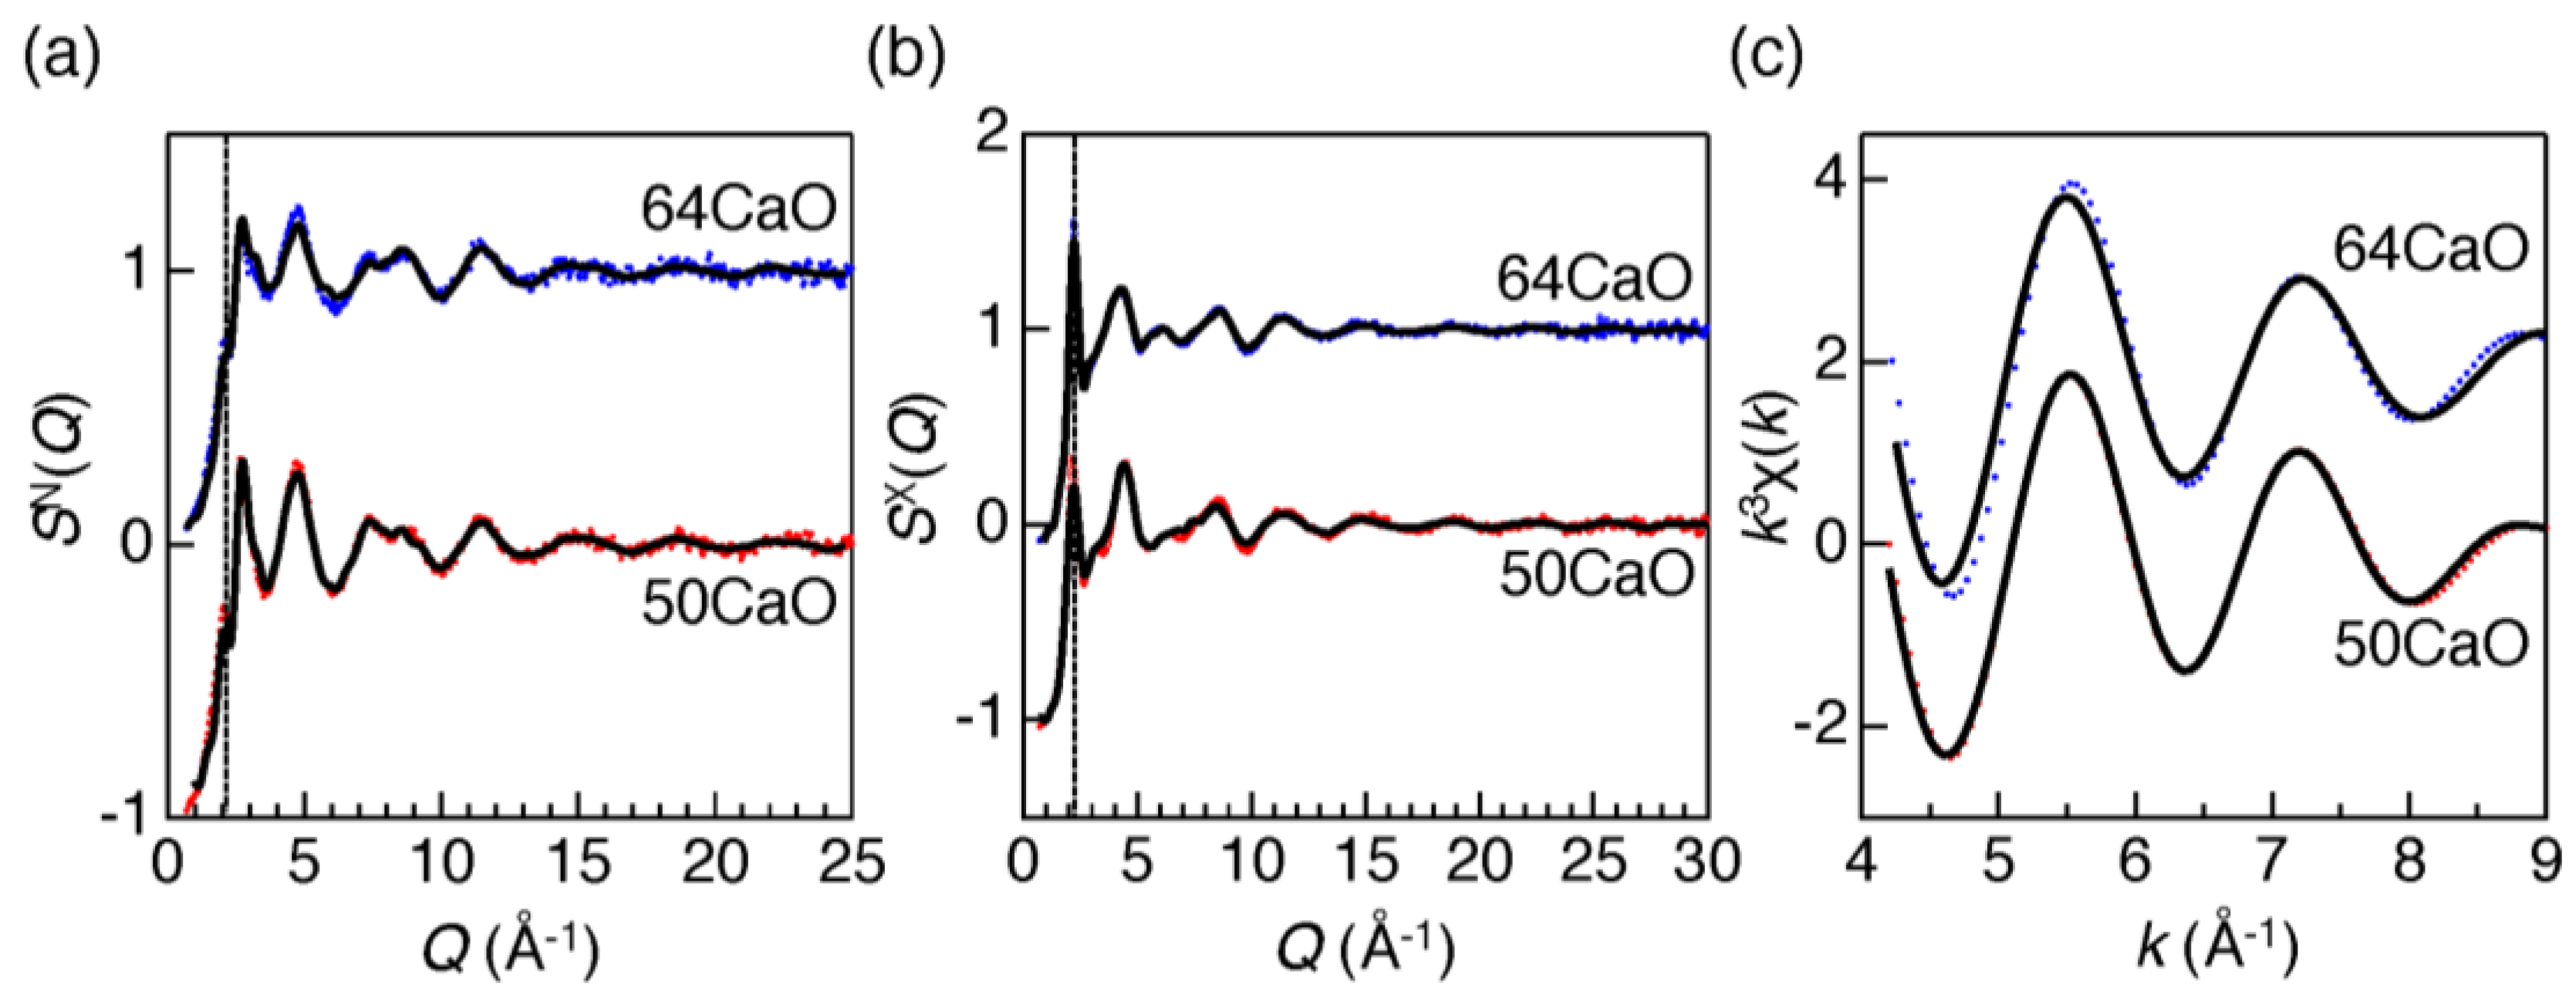
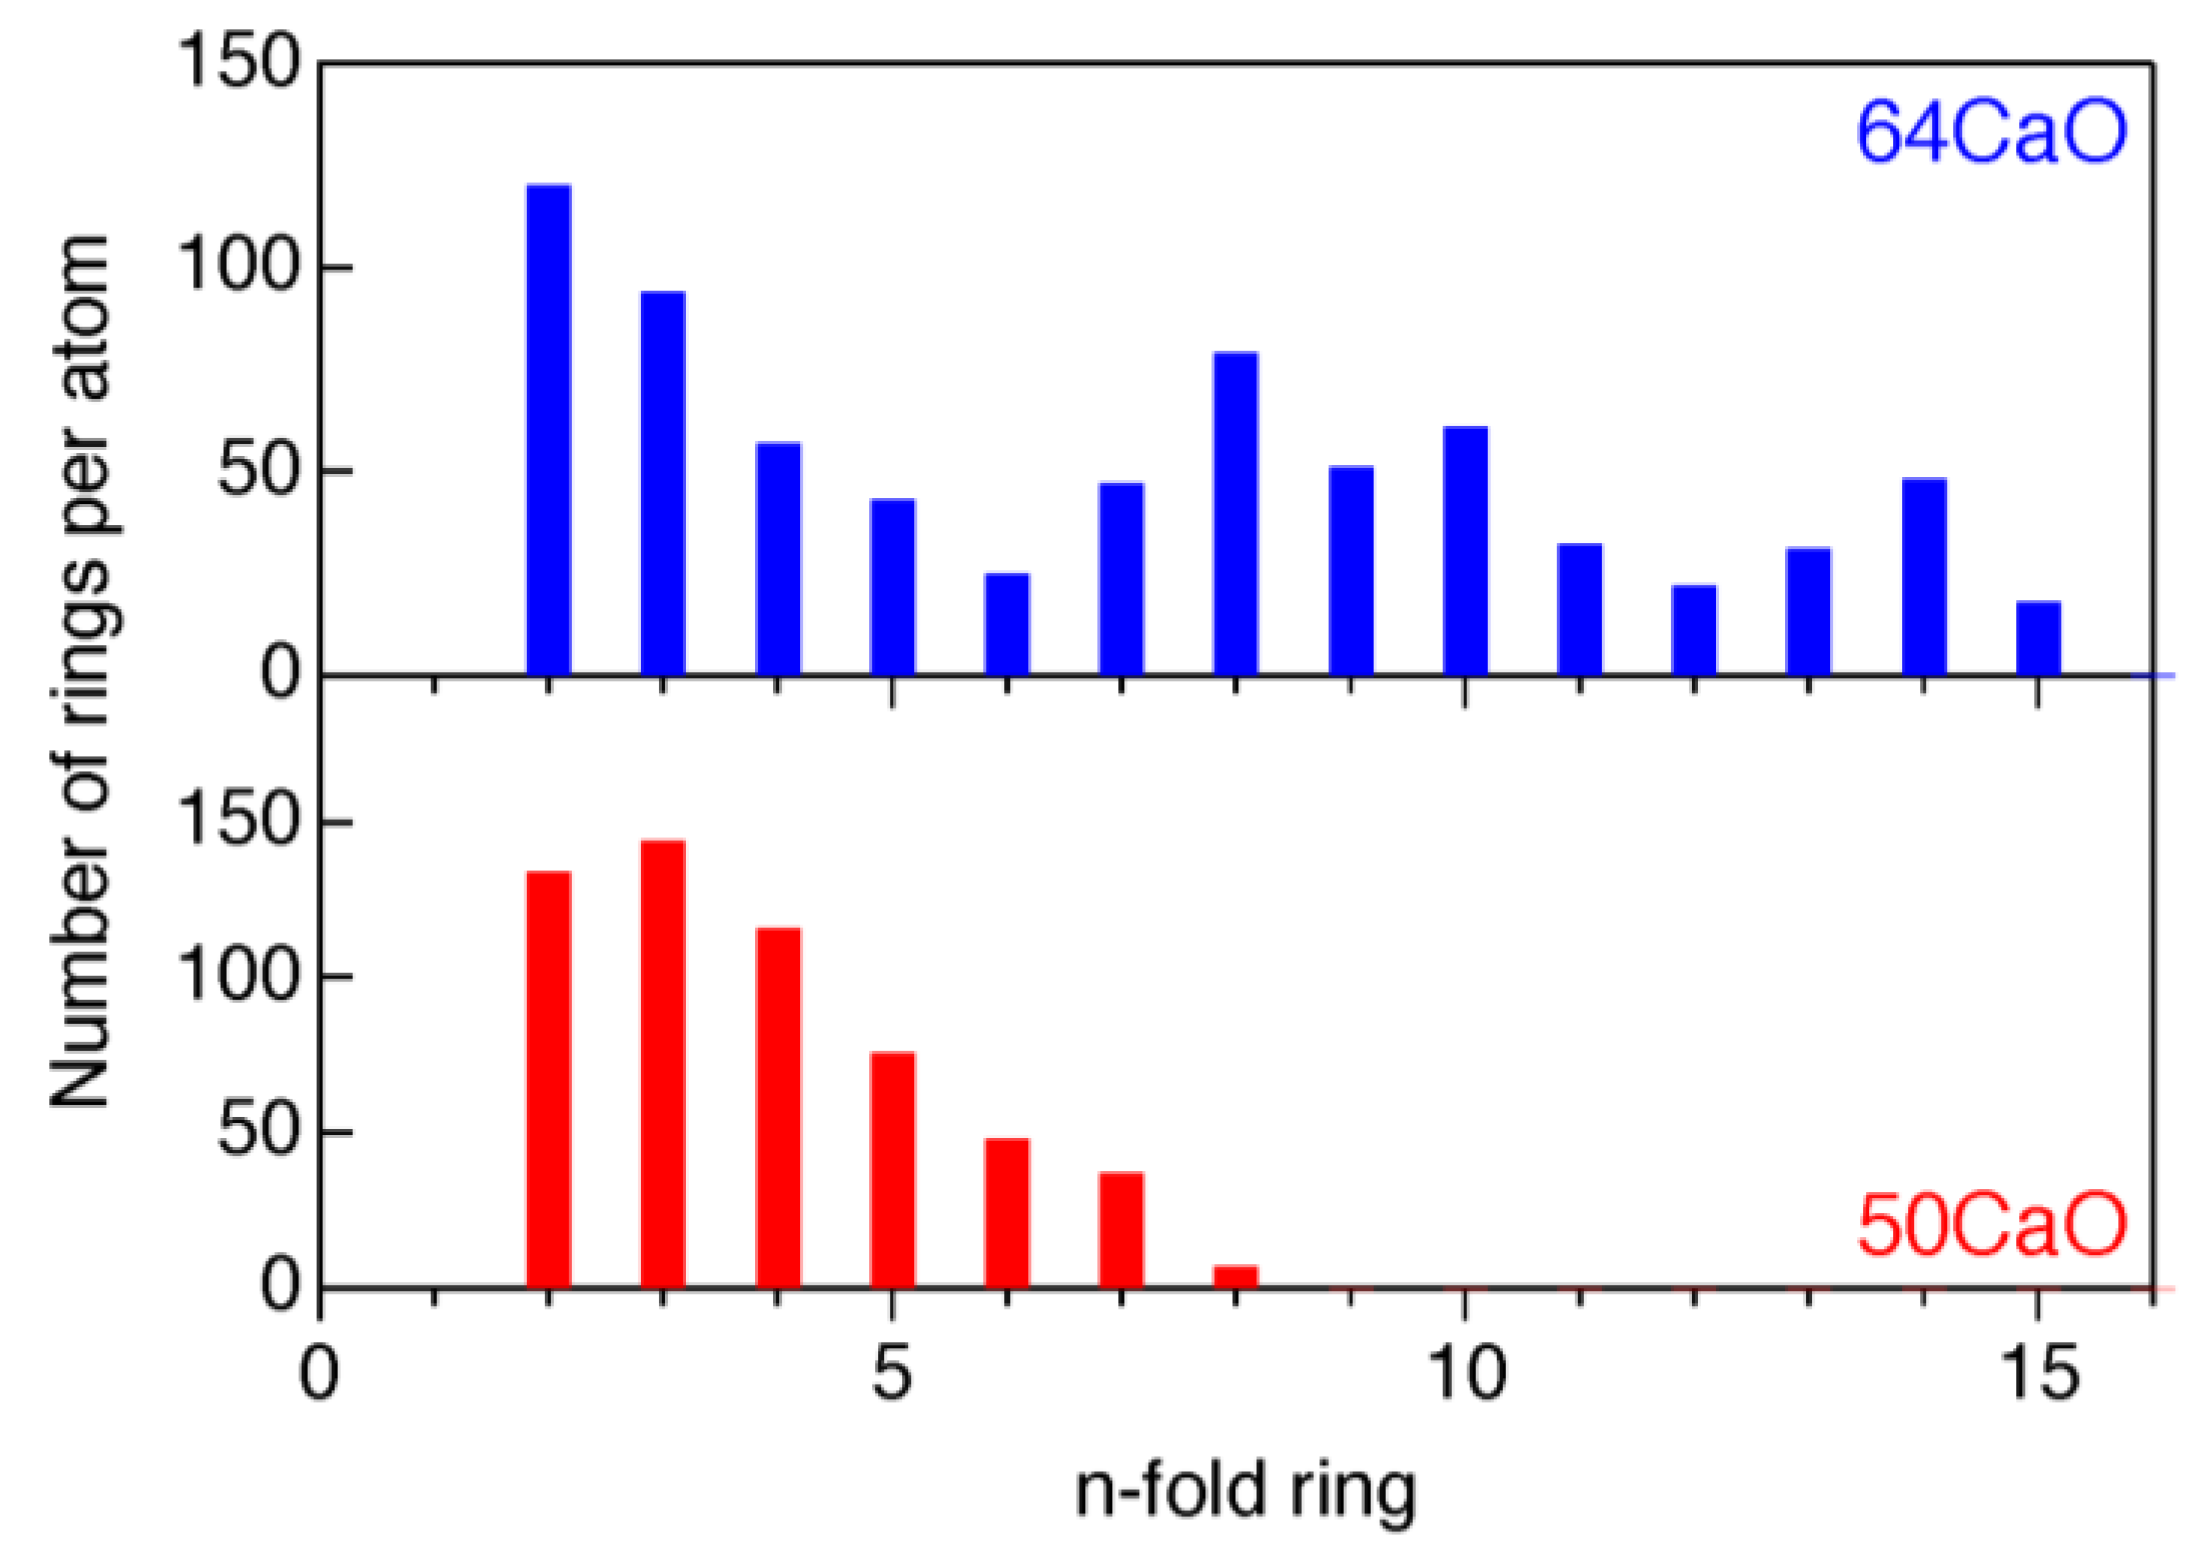
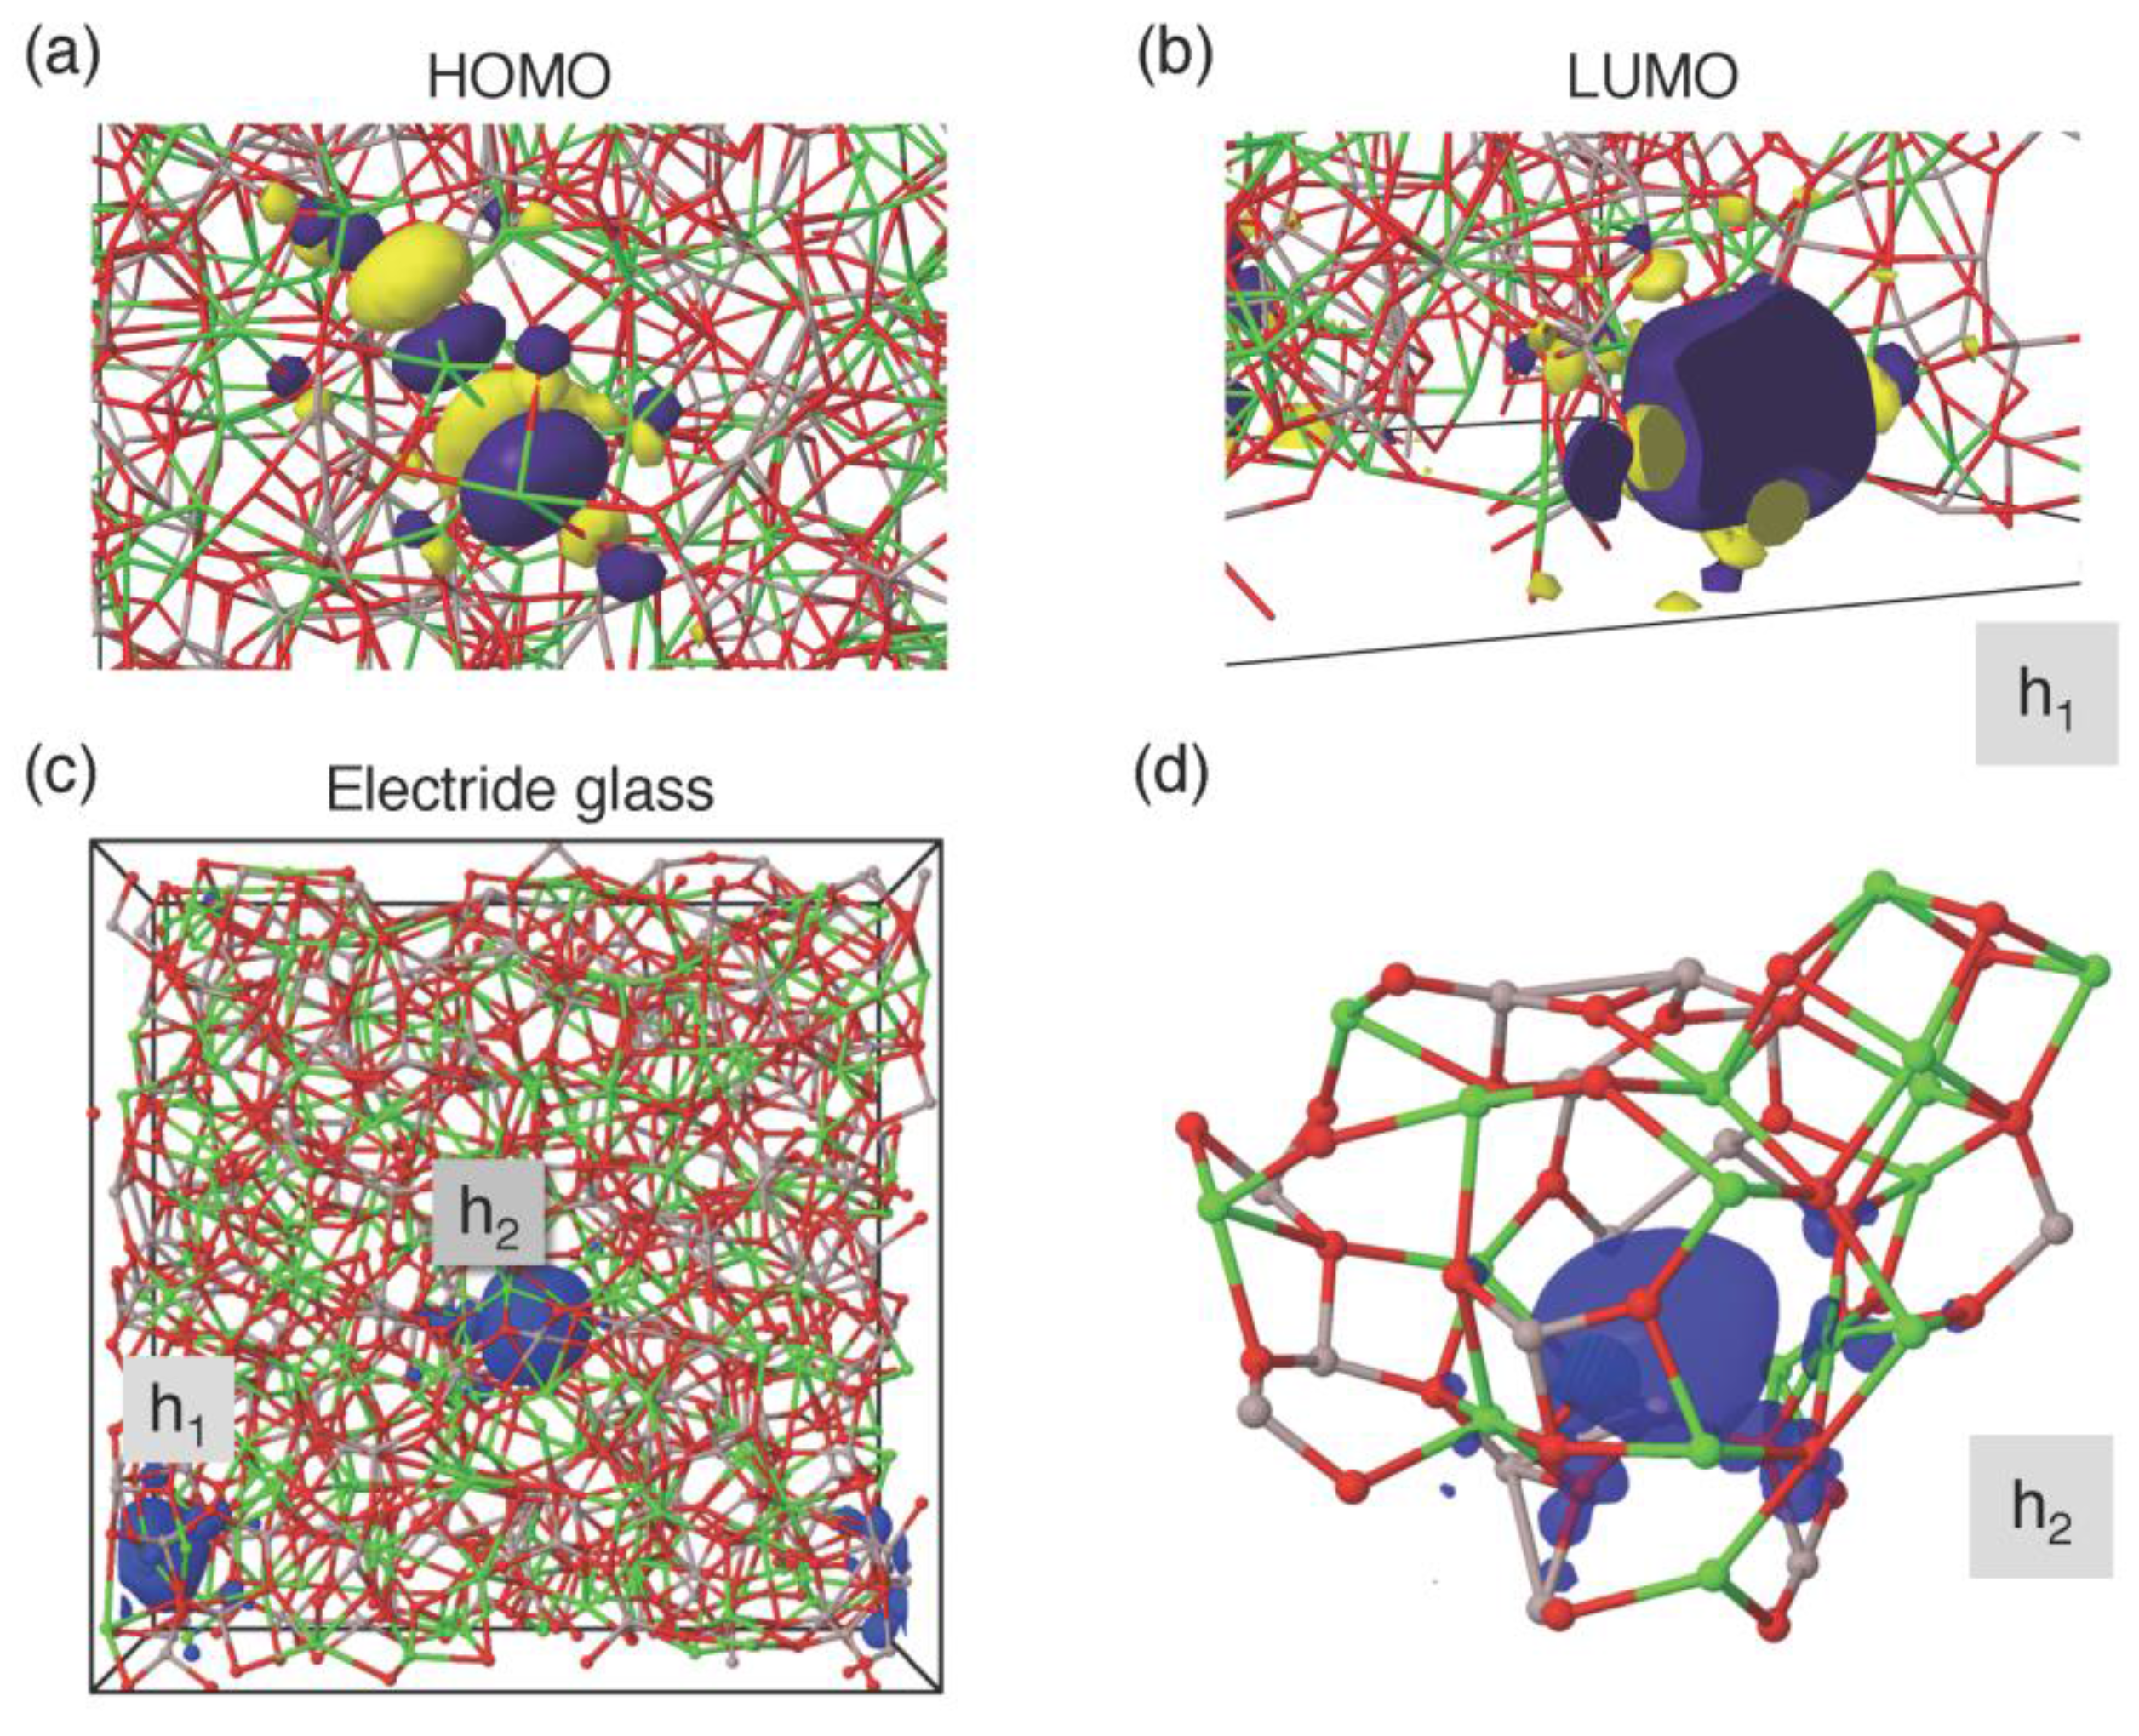
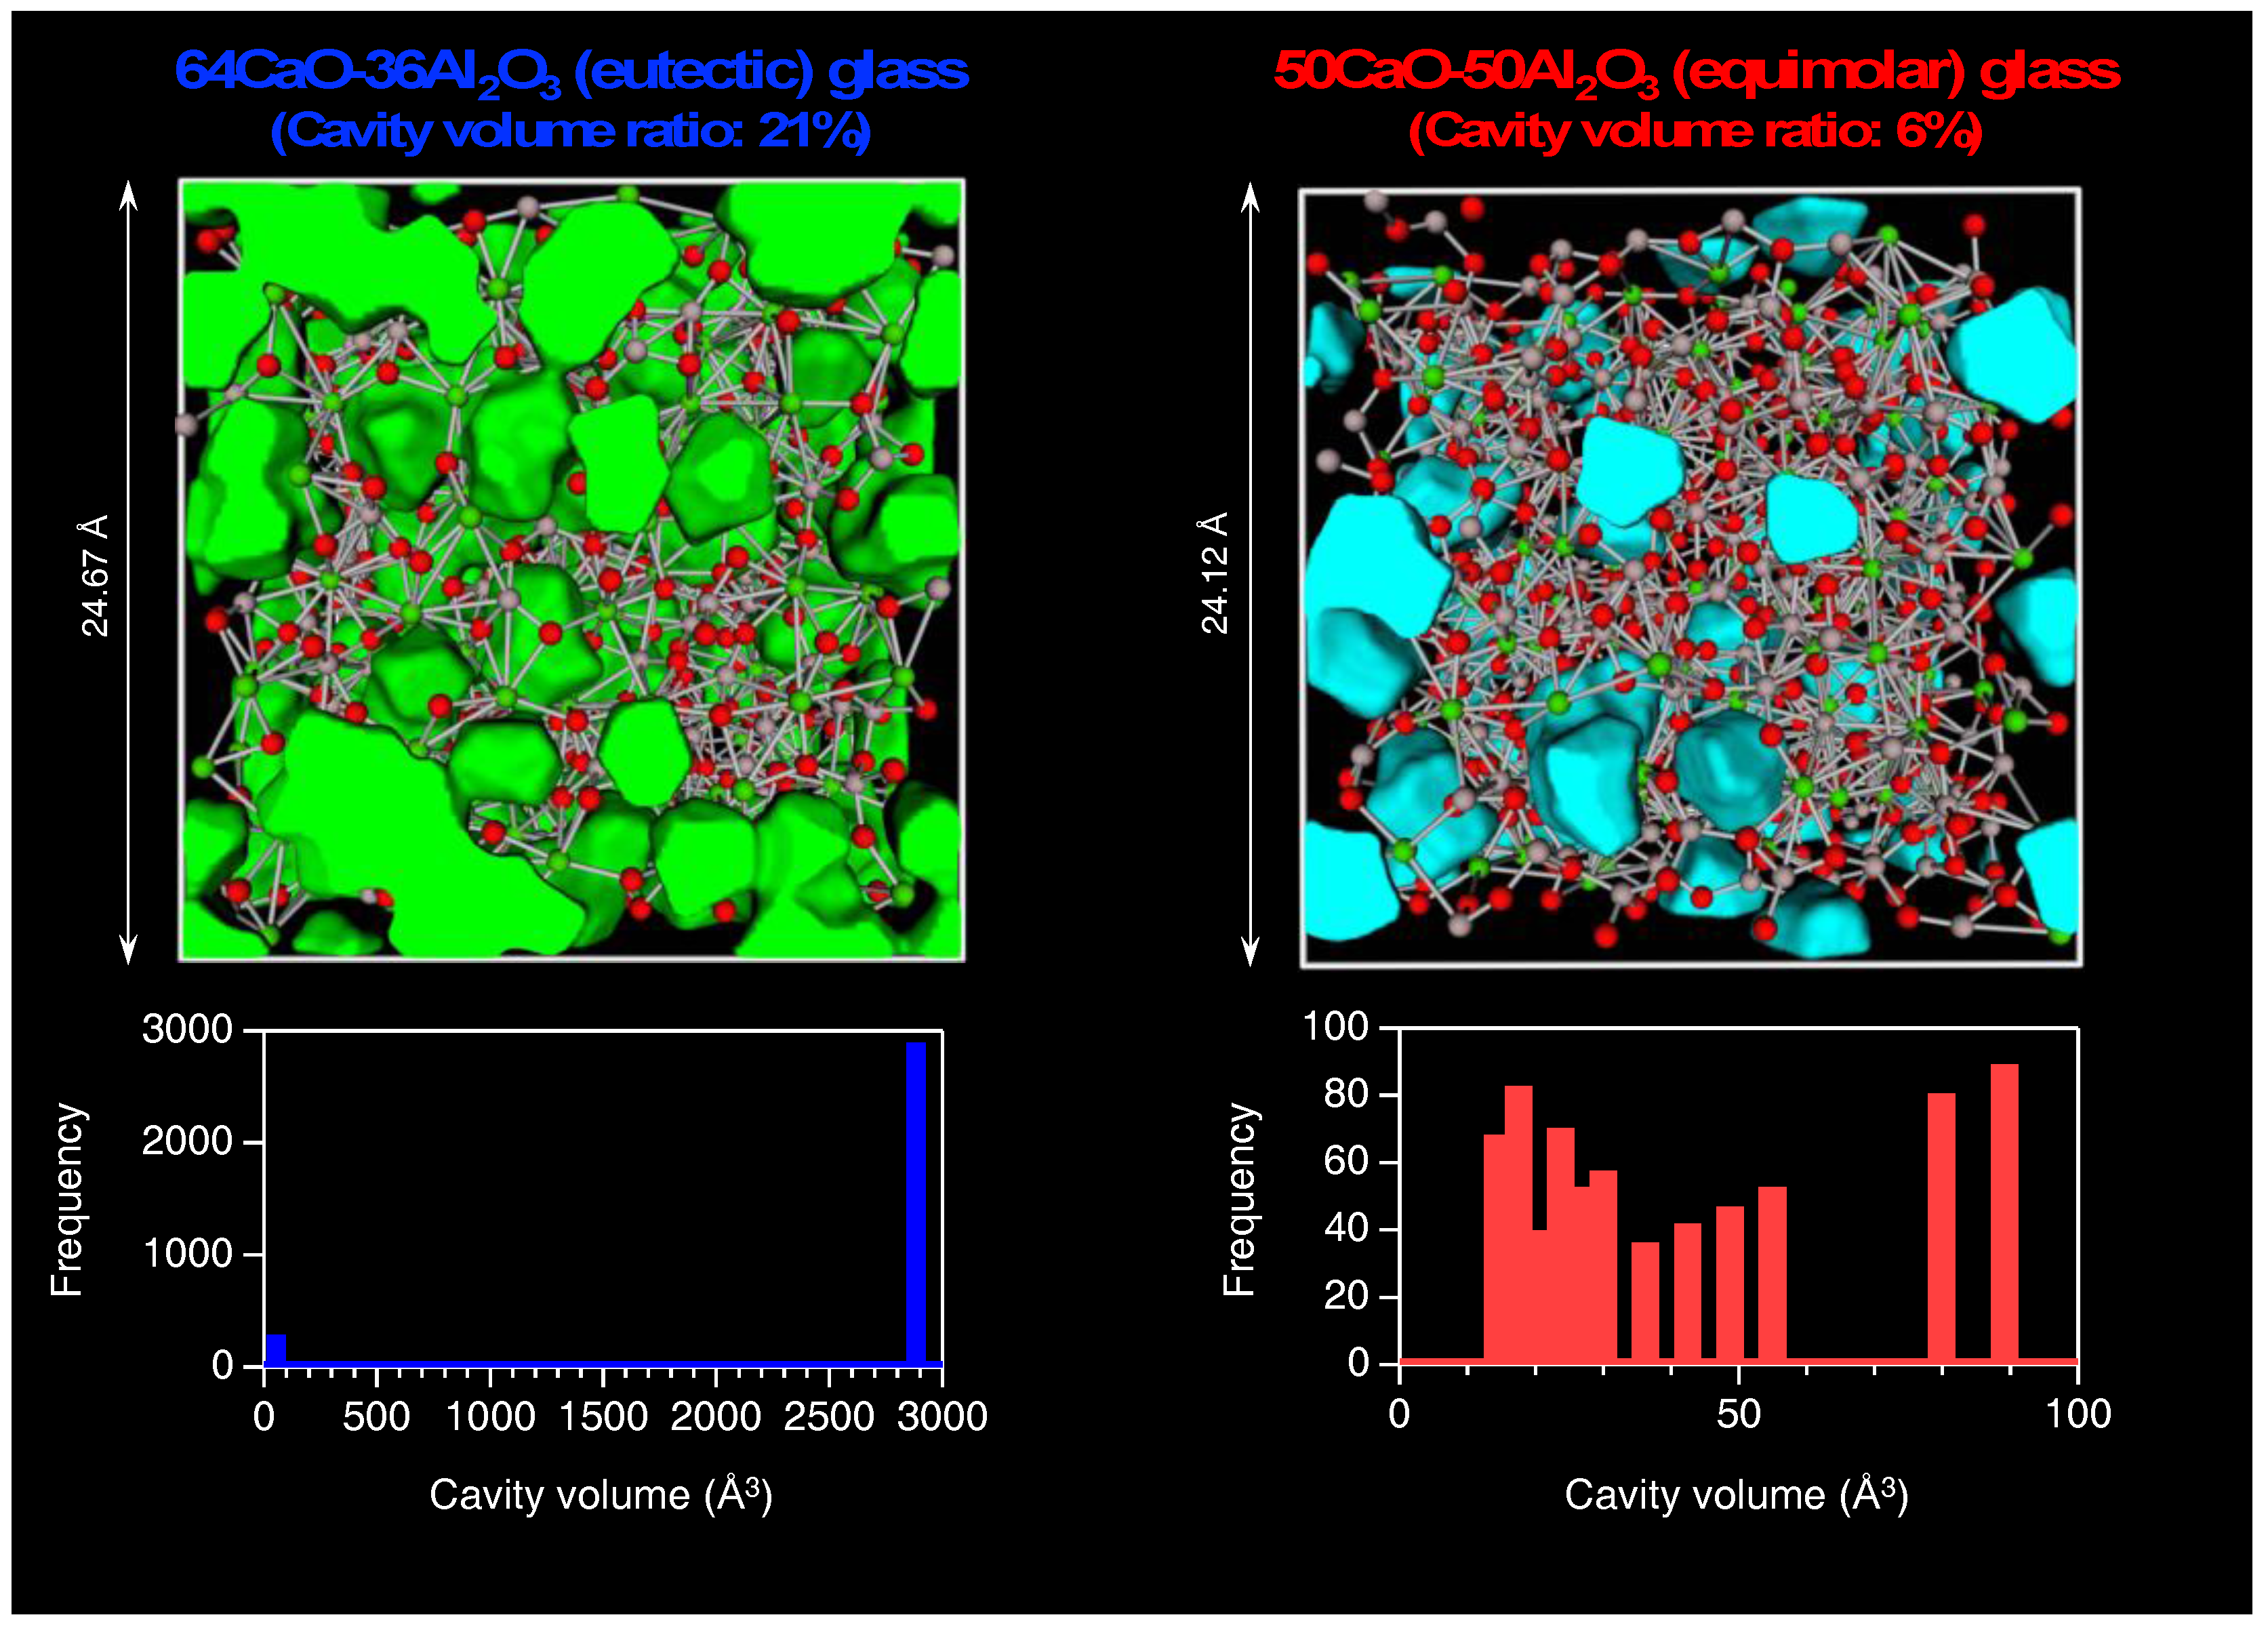
3.2. Atomistic and Electronic Structures of CaO–Al2O3 Glasses

Understanding the atomistic and electronic structures and bonding upon glass formation is an important topic in glass science. Glass formation in the CaO–Al2O3 system is an important phenomenon because this system does not contain a typical network former. The reverse Monte Carlo (RMC) modelling technique [21] was combined with DFT to investigate the relationship between the atomistic/electronic structures and the GFA in the 50CaO–50Al2O3 (50CaO) and the 64CaO–36Al2O3 (64CaO) glasses. These compositions were chosen because the GFA of the 64CaO (eutectic) glass is much higher than that of the 50CaO (equimolar) glass, although the composition difference is not large. The samples were synthesized using the CNL method, which can improve the glass forming ability of deep undercooled liquid. Figure 6 shows the neutron and X-ray total structure factors SN,X(Q) and the extended X-ray absorption fine structure (EXAFS) k3χ(k) data, of 50CaO glass and 64CaO glass, respectively, together with the results of a RMC-DFT simulation.
Differences between diffraction and EXAFS data are small between the two compositions, implying that the short-range structure is similar in the compositions. Both the neutron and theX-ray total structure factors show an FSDP at Q ~ 2.2 Å−1 (QrAX ~ 3.74 agrees well with that of l-Al2O3 in Figure 3a) but the X-ray data shows a sharper peak, because X-rays are more sensitive to cation-cation correlation than neutrons. This manifests as the ordering of the center of Al–O and Ca–O polyhedra. In addition, the height of the FSDP for the 64CaO glass is greater than that for the 50CaO glass in the X-ray data. The partial pair distribution functions gij(r) of the above CaO–Al2O3 glasses obtained by RMC-DFT simulation show very small differences between the 50CaO glass and 64CaO glass. The Al–O coordination number NAl–O calculated up to 2.5 Å is 4.3 for the 50CaO glass and 4.1 for the 64CaO glass and NCa–O calculated up to 2.8 Å is 5.0 for the 50CaO glass and 4.9 for the 64CaO glass.
Figure 7 shows the distribution of –Al(Ca)–O–Al(Ca)–O–Al(Ca)– rings in the CaO–Al2O3 glasses. The 64CaO glass (high GFA) has a wide ring-size distribution, while the 50CaO glass (low GFA) has a very narrow ring size distribution. This trend can be understood in terms of the concept of topological order-disorder according to Gupta and Cooper [20]. This characteristic ring-size distribution and particularly the formation of large rings, indicates the existence of a cage structure [22] at the eutectic composition of 64CaO glass, which exhibits high viscosity in an undercooled liquid, yielding high GFA. Moreover, it is suggested that the topological disorder in the 64CaO glass is a signature of a stronger liquid [1] than that of the 50CaO composition. This scenario can reasonably explain the high GFA of the 64CaO glass without the need for the presence of a traditional network former, as proposed in Zachariasen’s original theory [14].
Recently, the C12A7:e- electride glass has been synthesized from a strongly reduced high-temperature melt by Kim et al. [22]. It is assumed that the removal of excess O atoms from AlO5 and AlO6 units in the C12A7 melt results in the formation of more extended cage structures in the electride glass, which can host solvated electrons. To shed light on the formation of the electride glass, the highest occupied molecular orbital (HOMO) and lowest unoccupied molecular orbital (LUMO) single-particle states of electrons were computed for the 64CaO glass by DFT calculations as illustrated in Figure 8a,b. The characters of the HOMO and LUMO states are considerably different: While the former is located across atoms and bonds (Figure 8a), the latter is associated with a cavity (cage), forming a spin-paired state analogous to an F-center in a vacancy site of crystalline MgO (h1 in Figure 8b). The computed HOMO-LUMO gap is 1.71 eV.
Since it is well known that DFT calculations at this level underestimate band gaps by approximately a factor of two, this value is consistent with the typical insulating electronic behavior and transparent properties of the glass. Furthermore, our RMC-DFT model suggests that the first three cage-trapped LUMO states appear as impurity states below the onset of the conduction band. Following the idea of bipolaron states and conducting electride glass, we removed one oxygen atom from the h2 site in Figure 8b, thus releasing two additional electrons from the Al/Ca cations in the system while keeping the total charge neutral and then the structure was optimized for several spin configurations by DFT. In the spin-degenerate case, where there is no distinction concerning the spin of electrons, these electrons occupy a cavity vacated by the removed oxygen (marked as h2), yielding a HOMO state similar to that of the LUMO state of the parent system. On the other hand, the removal of the spin degeneracy (triplet spin configuration) leads to a 0.97 eV more energetically favorable electronic configuration, where the two additional electrons have the same spin and are located in well-separated cavities (Figure 8c, h1 and h2). This procedure was repeated for two, three and four removed oxygen atoms (four, six and eight additional electrons) and in all cases, the separated (solvated) electrons in individual cages were energetically more favorable than the F-center-like states (two electrons in one cavity). An example of the cage structure around a single electron (spin density) is presented in Figure 8d. These cases imply that by removing oxygen from the standard stoichiometry, one can achieve local spin states in the 64CaO glass. Moreover, the gradual removal of O increases the number of impurity states within the electronic band gap, which leads to changes in conductivity due to a narrower band gap. Although this is a simulation of an early stage in the formation of electride glass, it is demonstrated that the combination of RMC modelling and DFT calculation is a powerful tool for understanding the structure of glass at both the atomistic and electronic level. In particular, RMC modelling on reliable diffraction data is important to combine with DFT calculation to avoid unfavorable convergence in DFT optimization. In this way, models can be benchmarked and validated with accurate data.
Figure 9 shows the atomic configurations of CaO–Al2O3 with a cavity visualization using pyMolDyn code [23]. It is confirmed that the eutectic (64CaO) composition glass has a large stretched cavity while the volume fraction of cavities is reduced in the equimolar composition glass. This feature is in line with the behavior of ring statistics, in which 64CaO glass data is more topologically disordered than 50CaO one. It might be an important feature in oxide glasses in general. For example, PbO–SiO2 glass is an excellent glass former and shows relatively large cavity volume over a wide composition range [24].

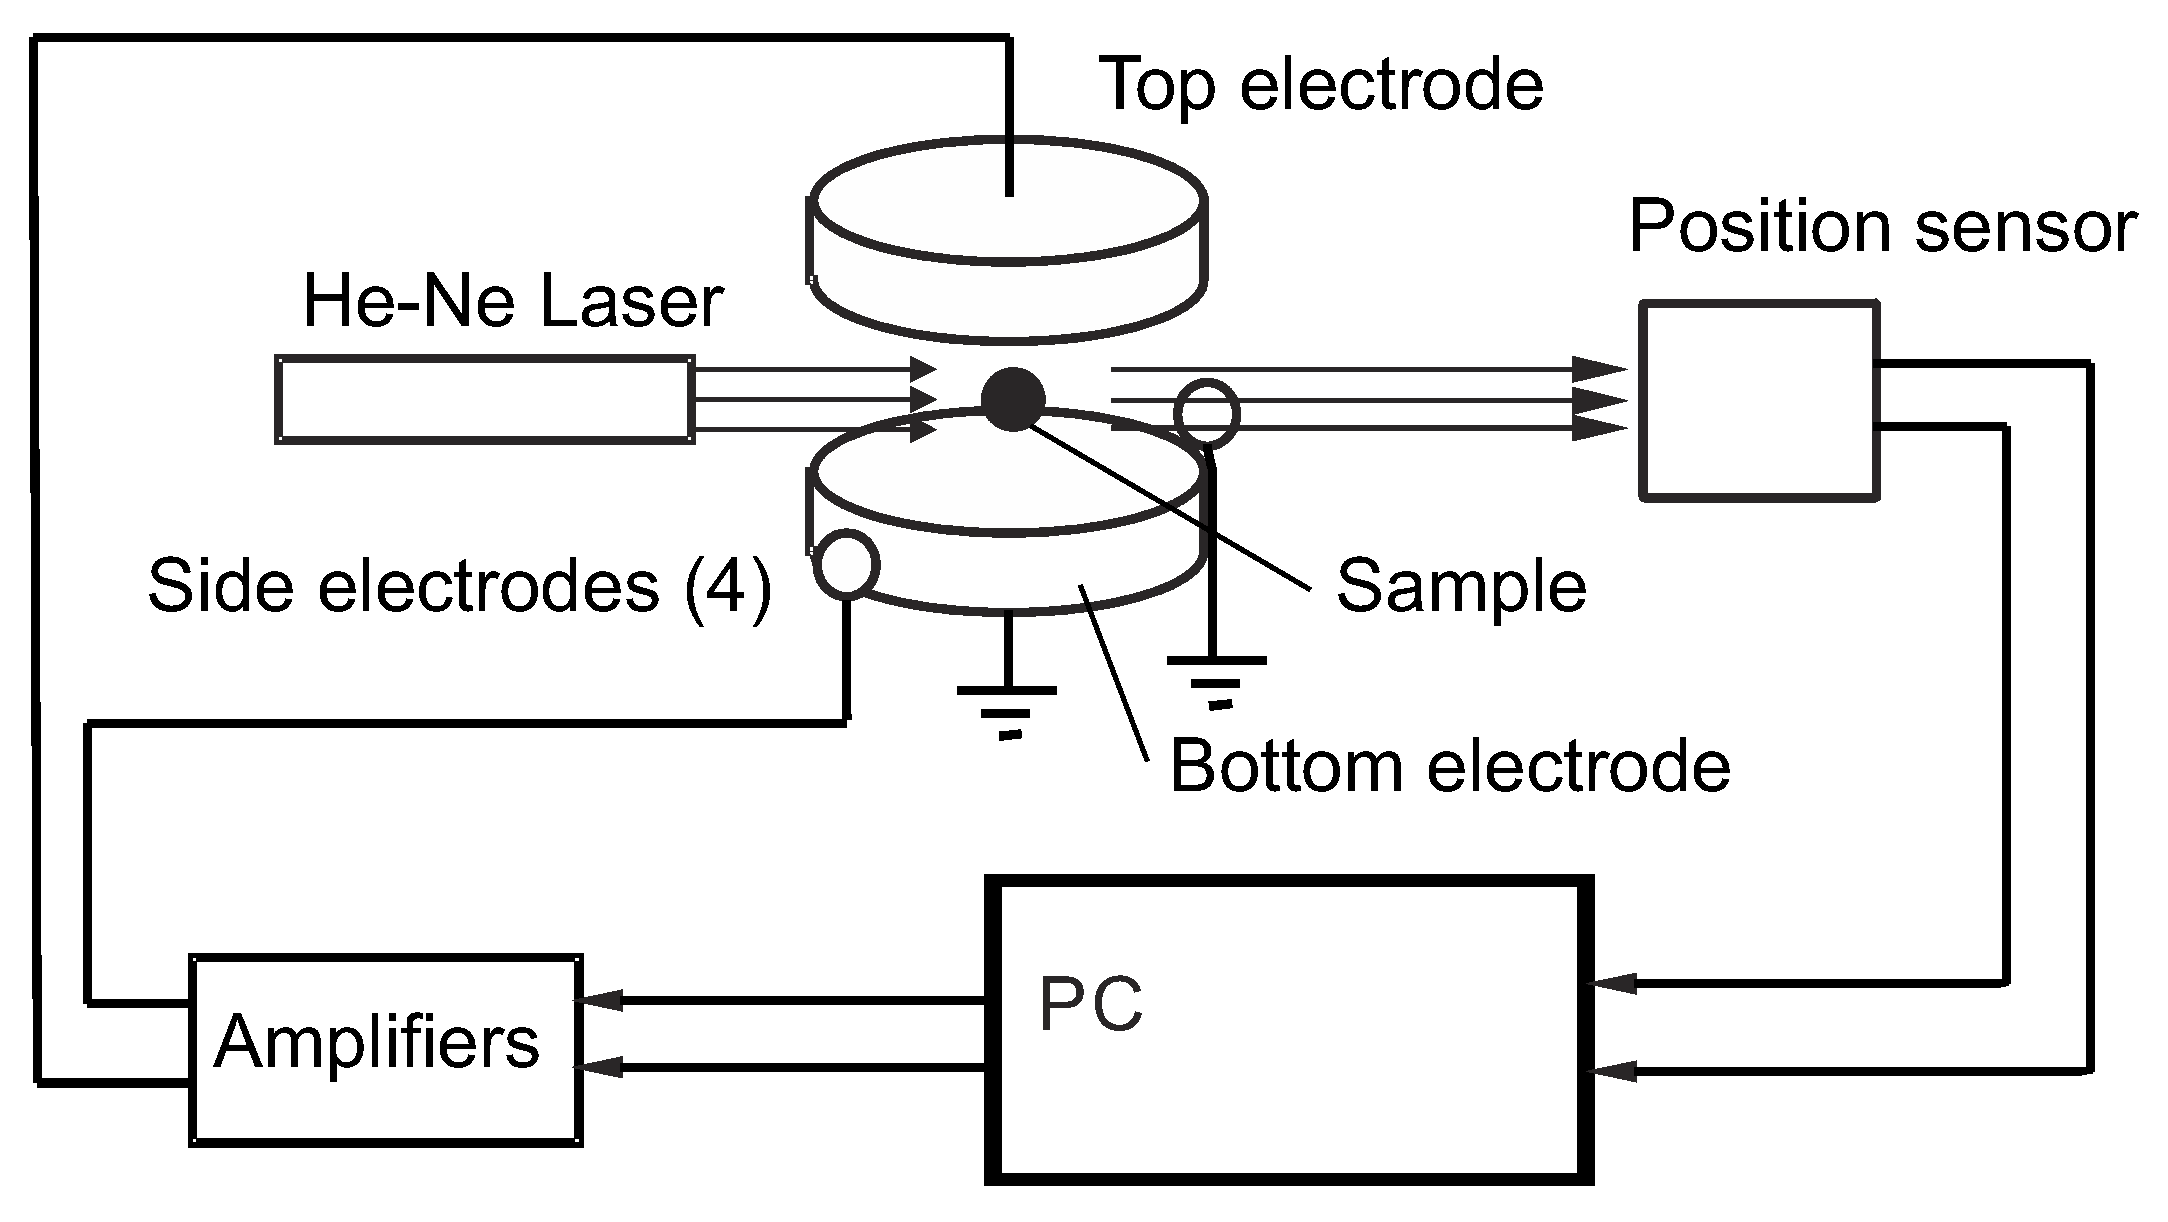
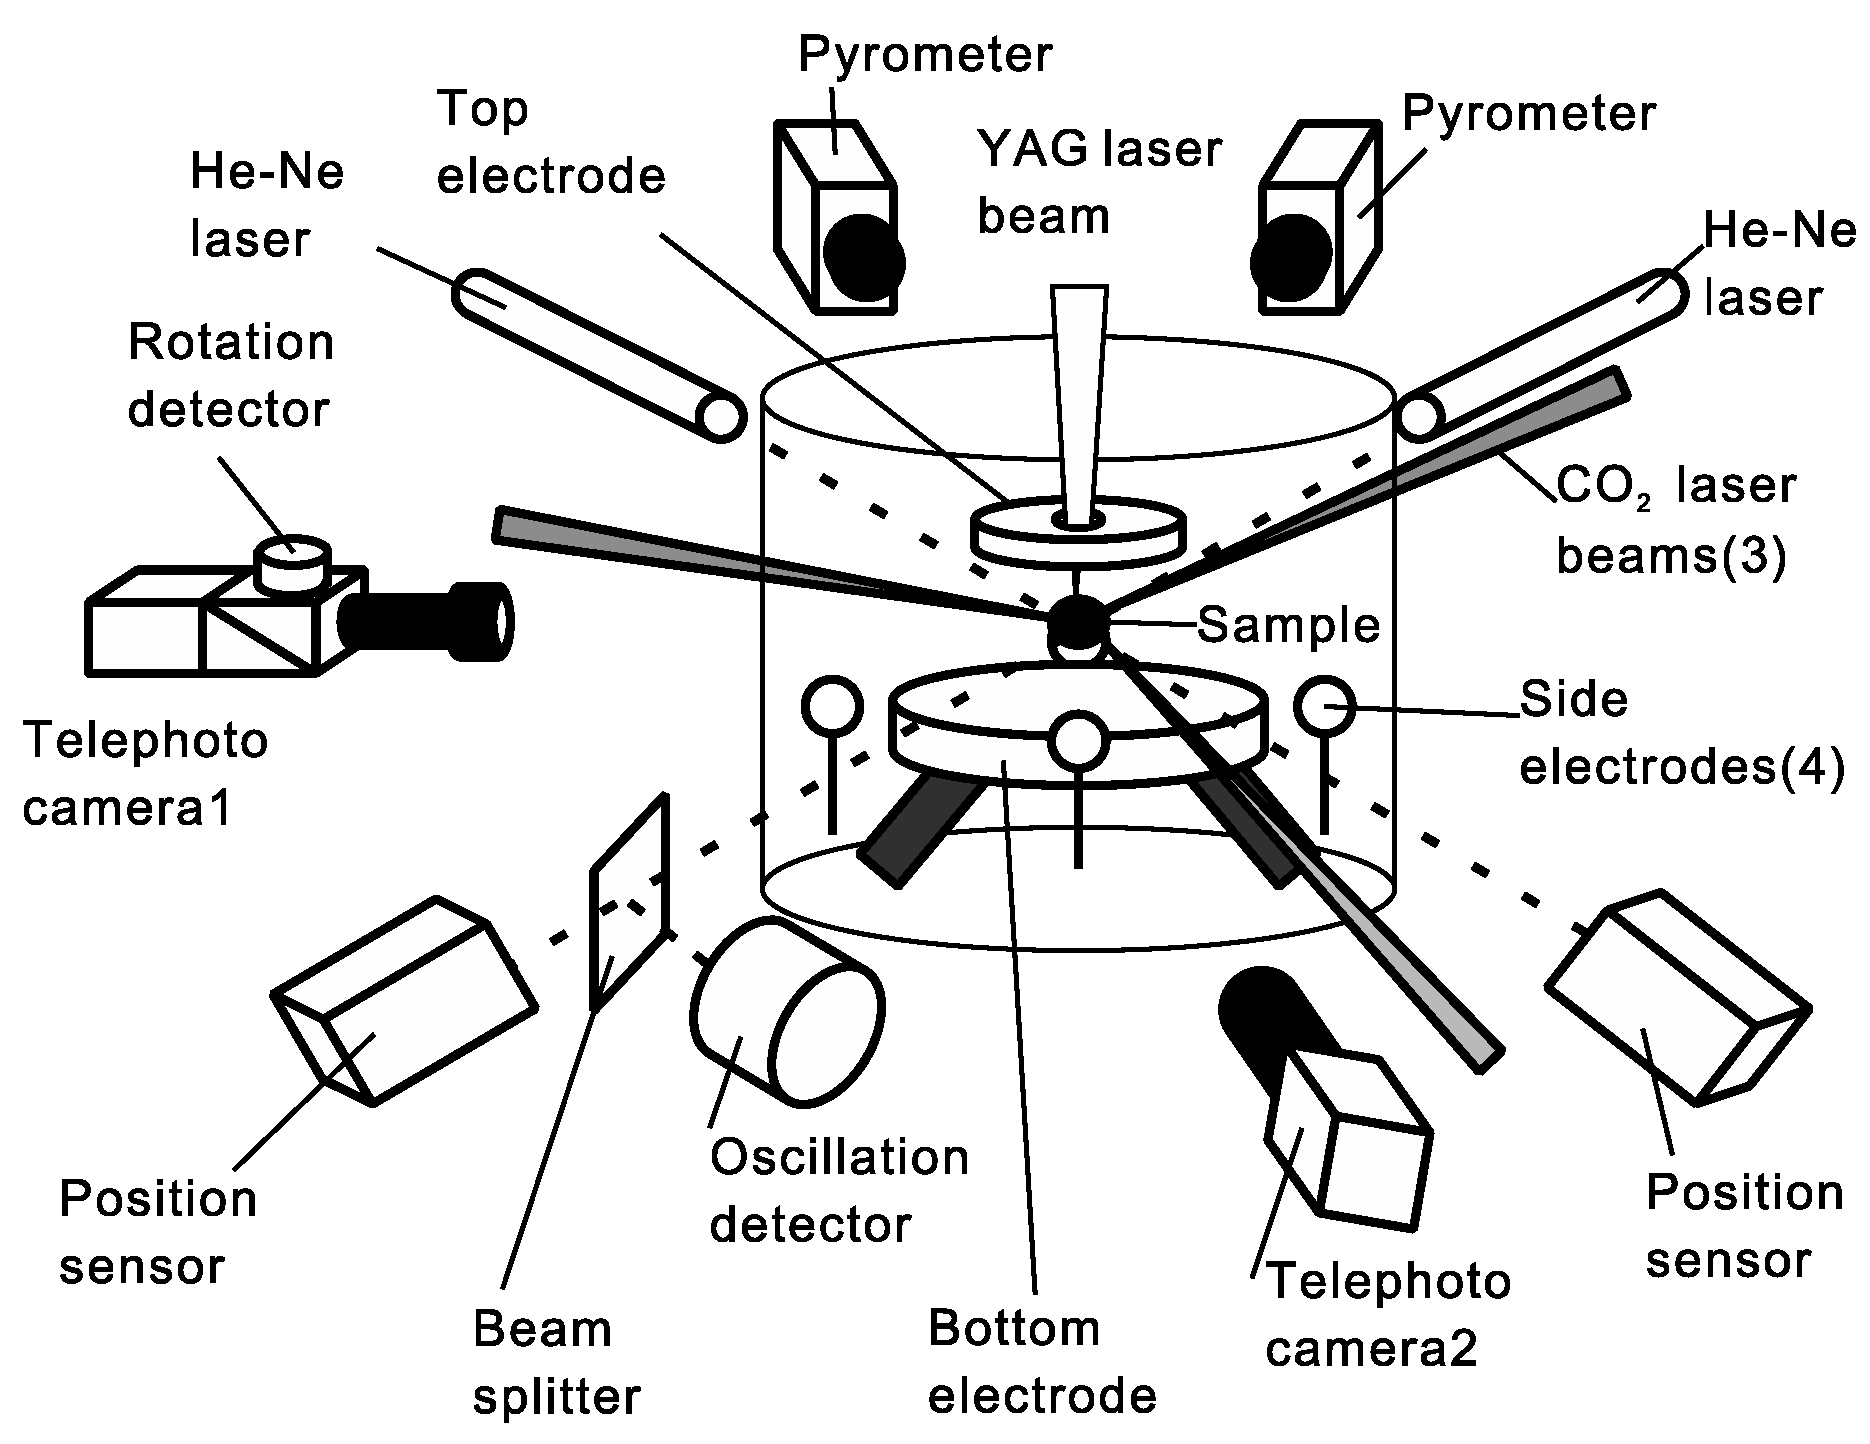
4. Electrostatic Levitation

The ESL method has been used for thermophysical property and structure measurements. This method uses Coulomb forces between a charged sample and electrodes and needs a high-speed feedback control system to stabilize the sample position. This method provides very wide optical access to the levitated sample. The density, surface tension and the viscosity of high temperature melts have been measured using this method. This section briefly explains the facility and thermophysical property measurement methods. Then, it introduces a facility on board the ISS.
The fundamental technique of the ESL has been developed by Rhim et al. [25]. Figure 10 depicts the conceptual diagram of the ESL method. A positively charged sample is levitated between a pair of parallel disk electrodes, which are utilized to control the vertical position of the sample. Four small electrodes dispatched around the bottom electrode are used for horizontal sample position control.
The collimated laser beam projects a shadow of the sample on a position sensor where horizontal and vertical positions are measured. Using two sets of laser-position sensor pairs, the sample position can be detected three dimensionally. Signals from the sensors are fed to a computer in which voltages applied to the electrodes are calculated based on a feedback control scheme.
The typical sample size is 2 mm in diameter and its mass ranges from 10 to 100 mg depending on its density. The top and bottom electrodes are typically 10 mm apart and 8 to 15 kV is applied to the top electrode to levitate a sample against gravity. To apply such a high voltage without electric discharge among electrodes, experiments should be conducted either under high vacuum or high (4–5 bar) pressure conditions. In the case of metal samples, the high vacuum condition is preferred. High pressure conditions are used for oxides and non-metallic materials.
Optical devices for heating and observation of the sample can be placed in the horizontal plane between the top and bottom electrodes. High power lasers are used for sample heating. Sample temperature can be monitored by optical pyrometers. Shape and size of the sample as well as its surface condition can be checked by charge-coupled device (CCD) cameras. Additional heating/observation is possible from the top when the top electrode has a through hole.
Figure 11 shows the optical arrangement of an electrostatic levitation furnace (ELF) at JAXA [26].

4.1. Thermophysical Property Measurement
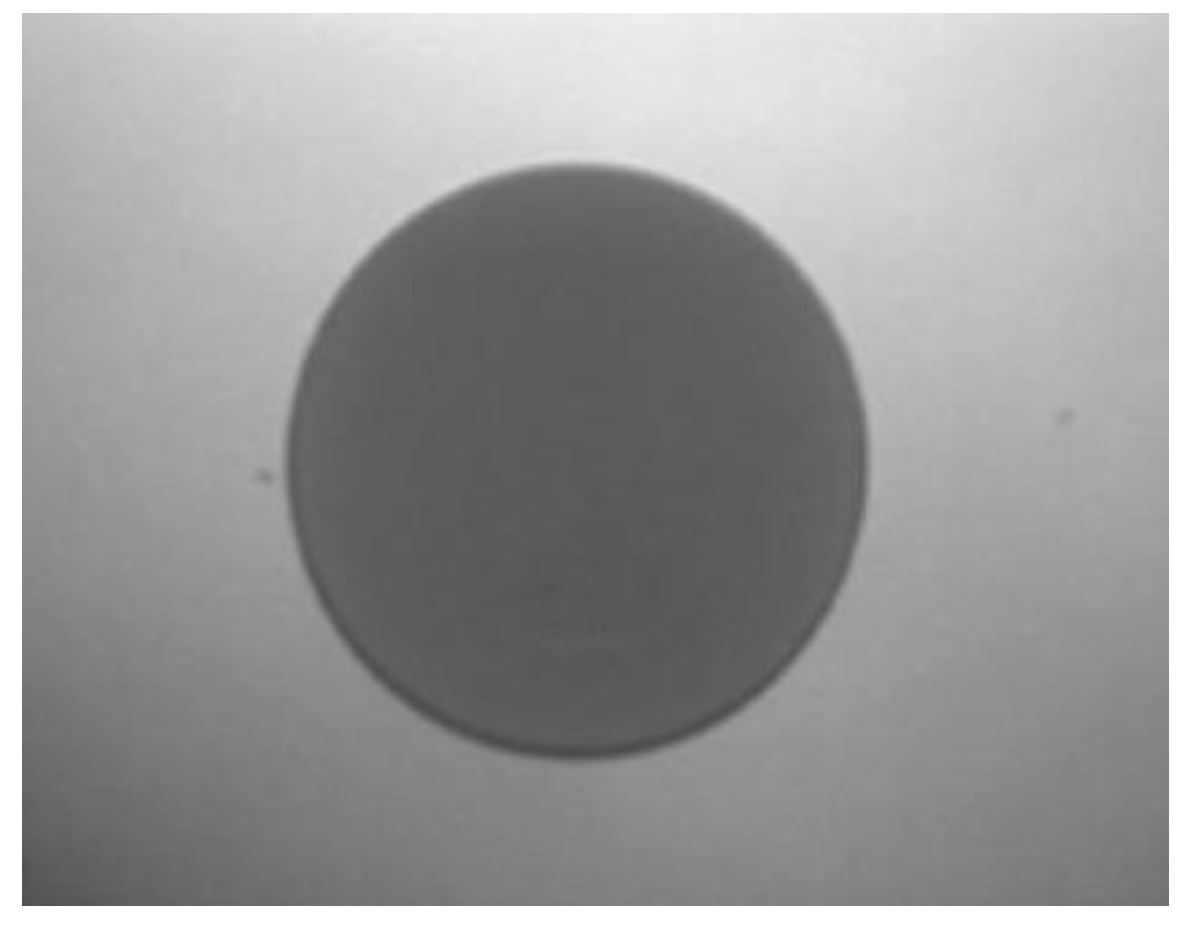
4.1.1. Density

The density is measured using image analysis [27]. Once a sample is molten, it takes on a nearly spherical shape due to surface tension (Figure 12). Both video images and the temperature of the sample are recorded. From the recorded video, still images are captured. These images are analyzed using a computer program to determine the sample radius and hence calculate its volume as a function of temperature. With the assumption that the sample is axisymmetric, sample volume can be calculated from only its radius. Since the mass is known, density could be obtained.

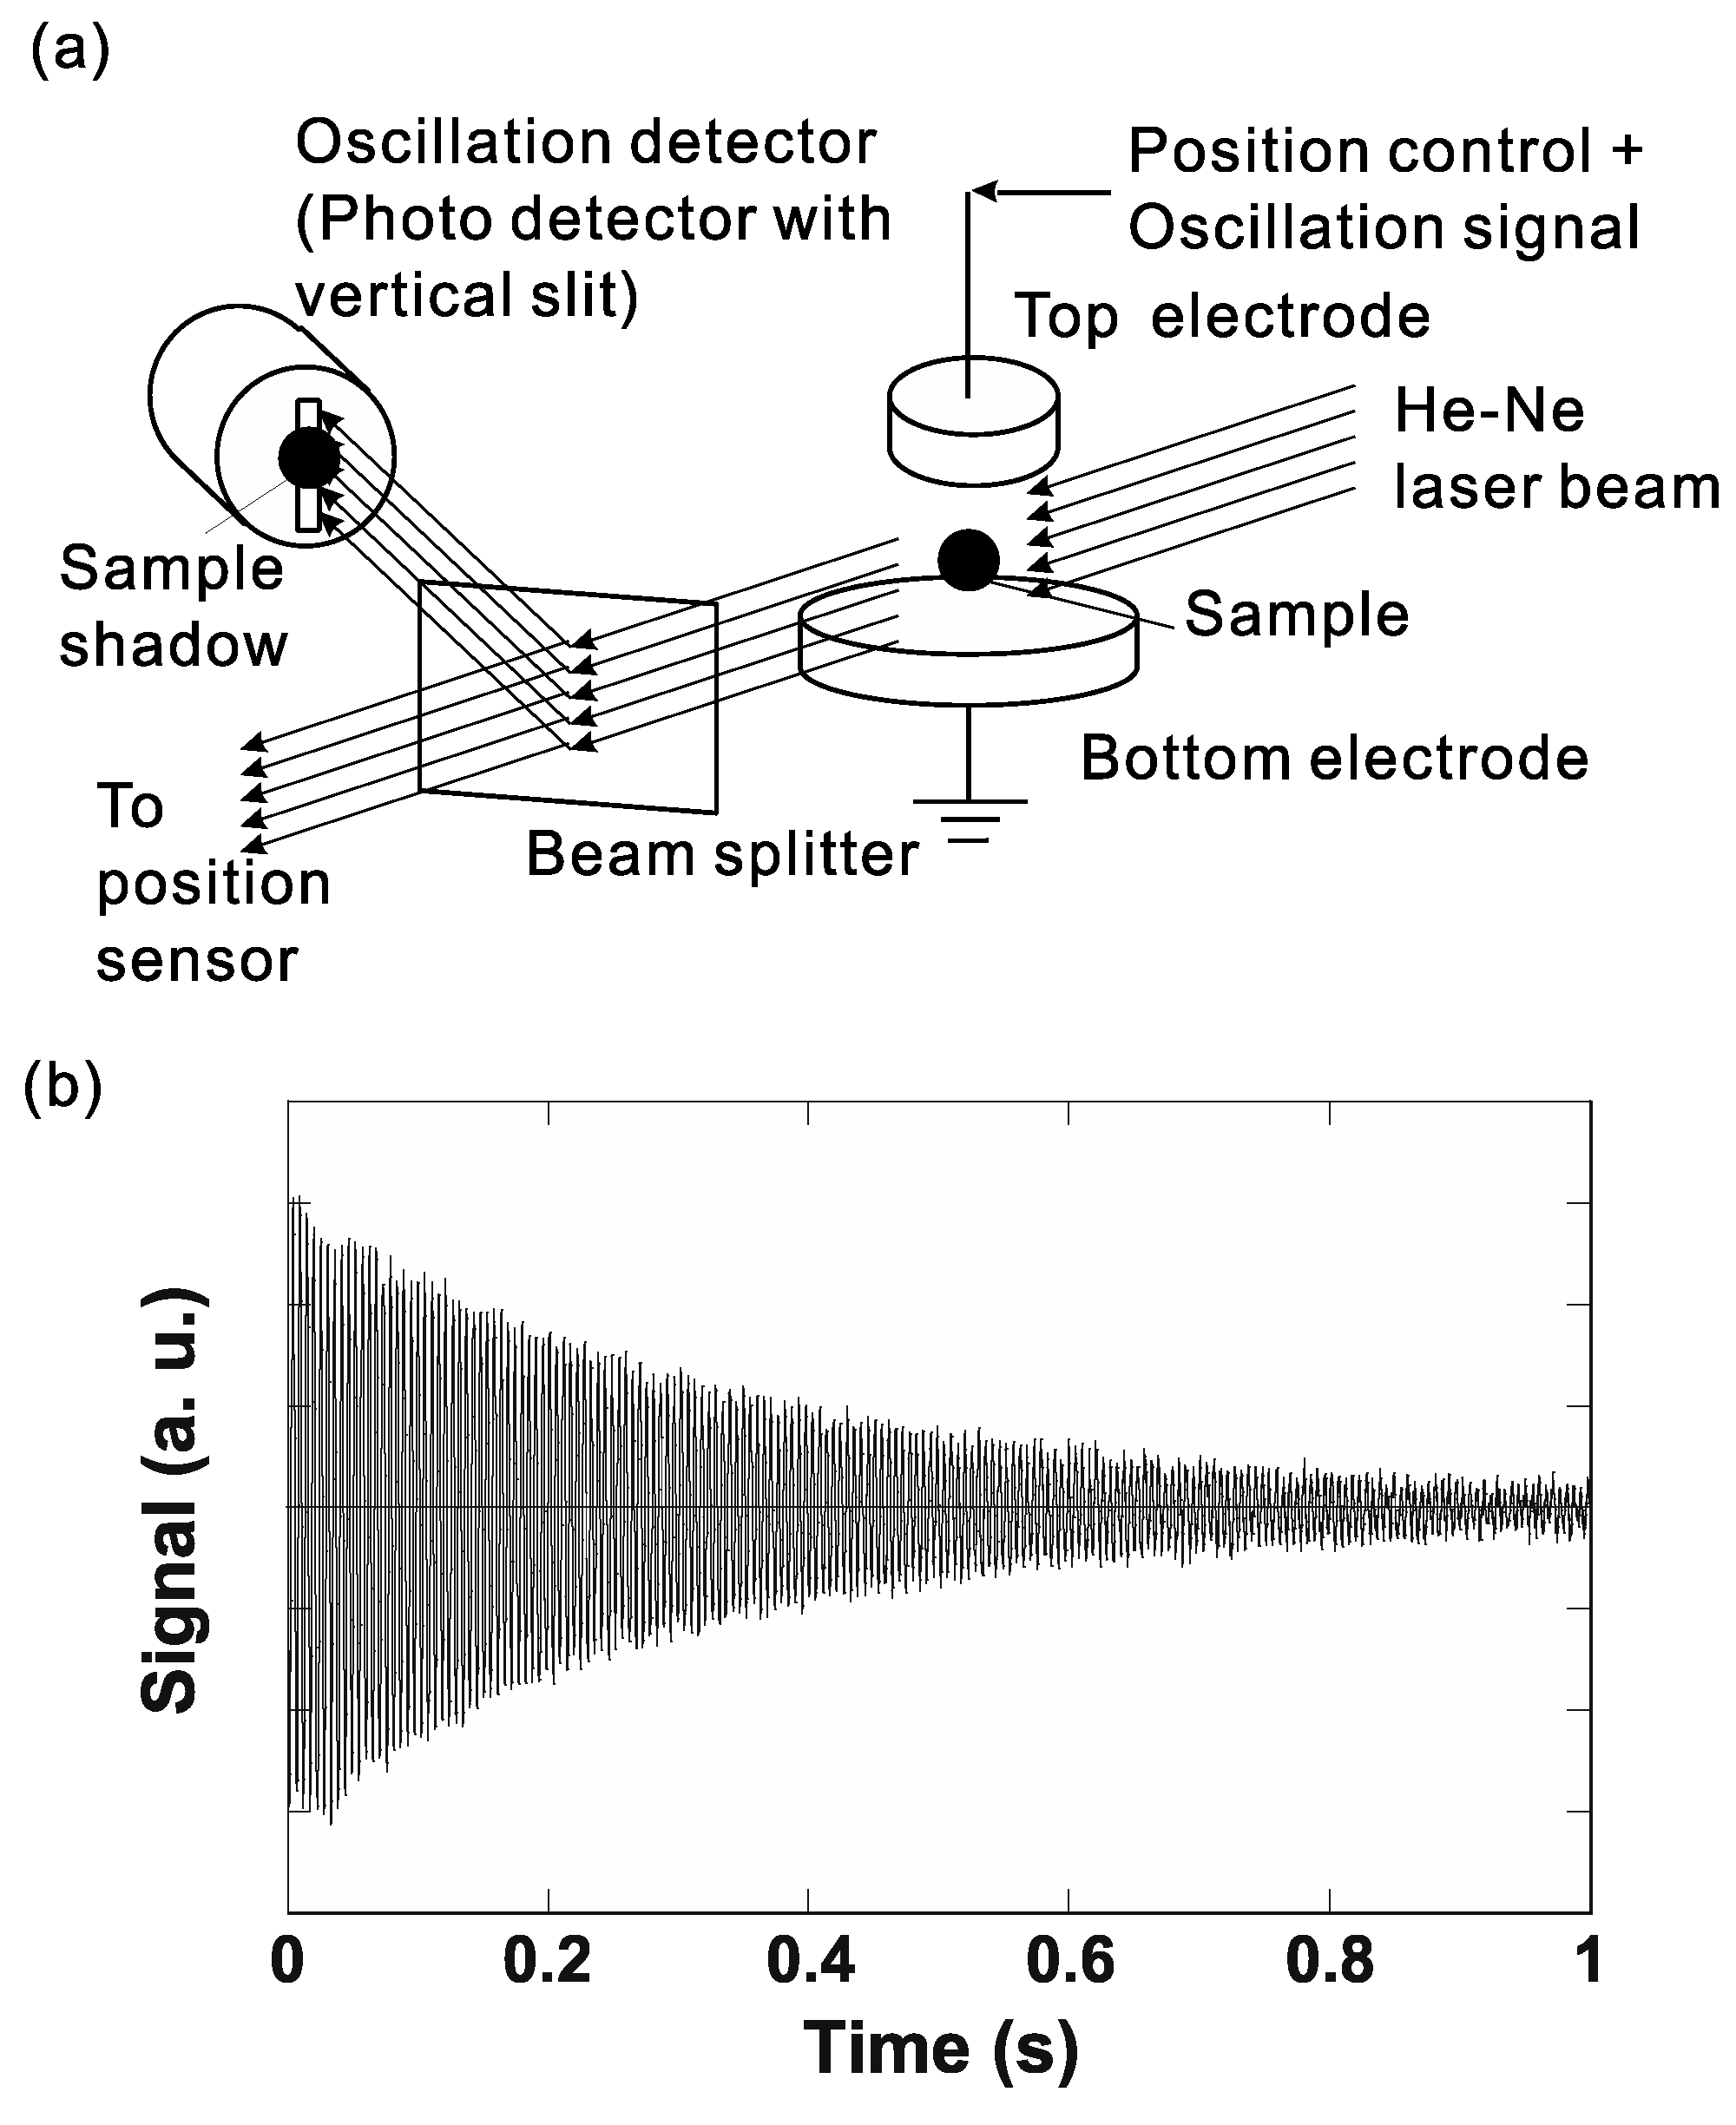
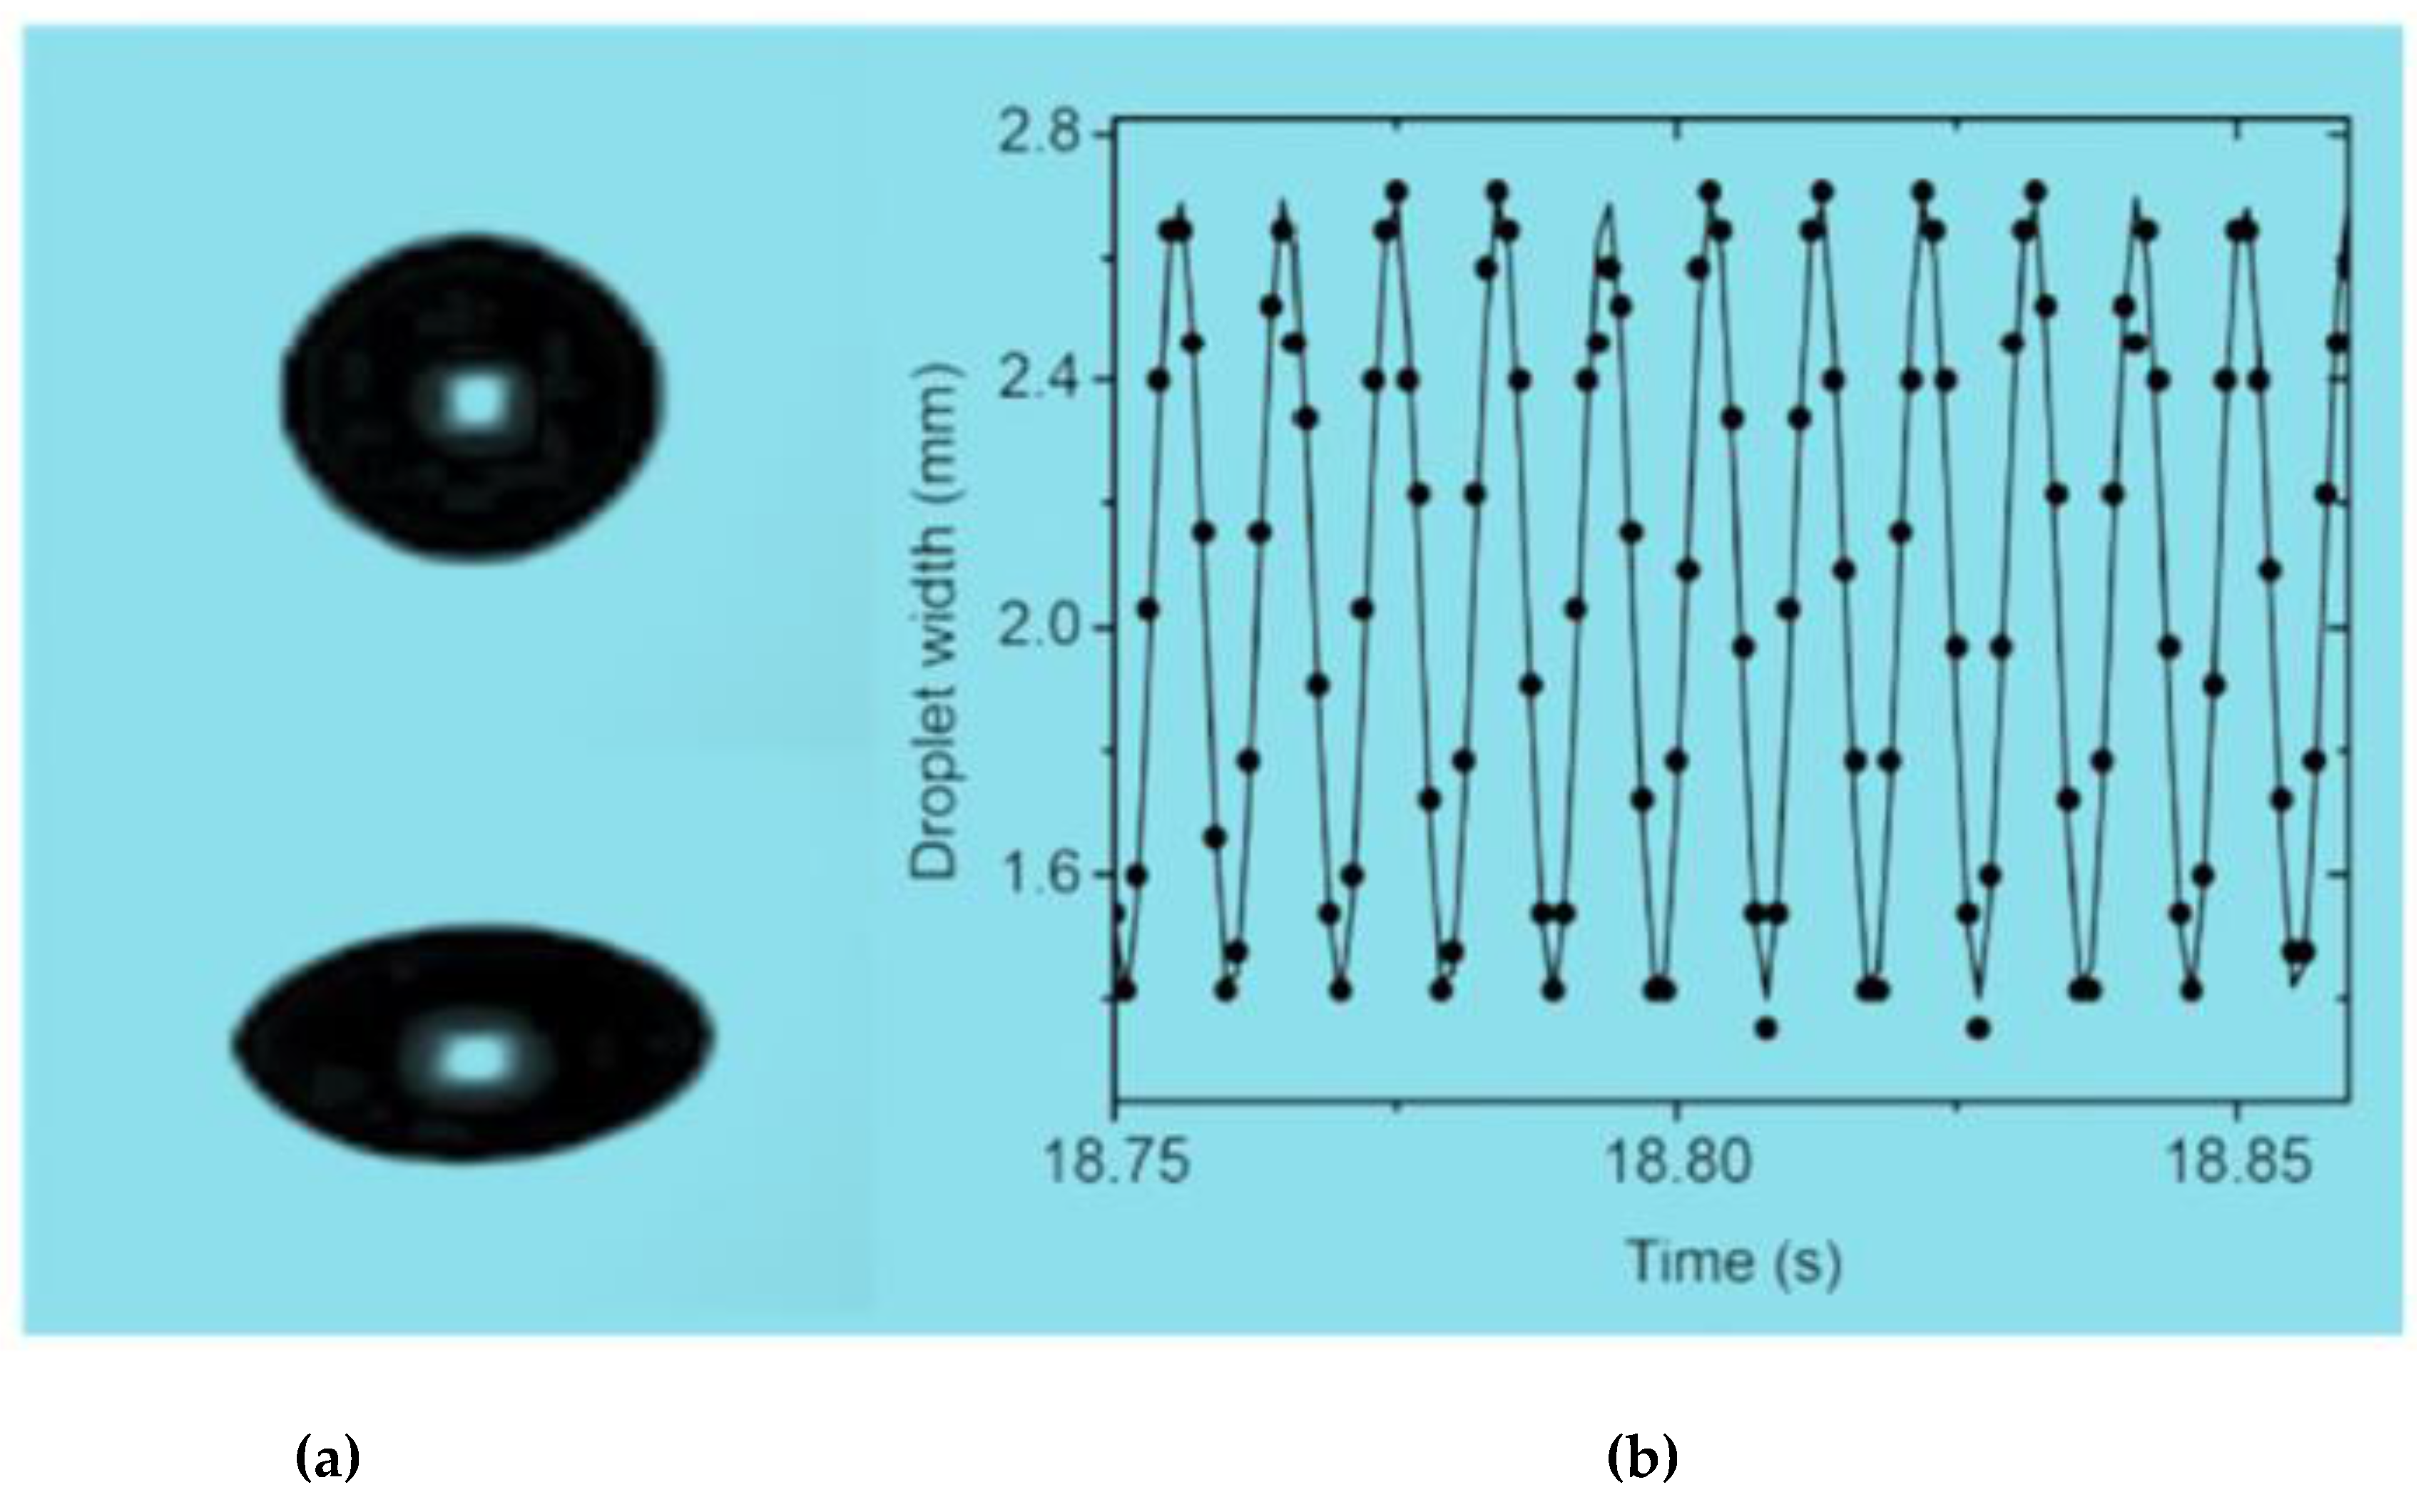
4.1.2. Surface Tension and Viscosity

The surface tension and viscosity are determined by the drop oscillation method [28], for which the frequency of the surface oscillation of the levitated sample and its decay are measured around its equilibrium shape. In this method, a sample is molten and brought to a selected temperature. Then, a P2(cos θ)-mode of drop oscillation is induced to the sample by superimposing a small sinusoidal voltage on the top electrode. Here, P2(cos θ) is a Legendre polynomial of second order. An oscillation detection system, illustrated in Figure 13a, measures the fluctuation of the vertical diameter of the molten sample with a 4096 Hz sampling frequency. The transient signal that follows the termination of the excitation field is shown in Figure 13b. This signal is recorded and later analyzed to obtain the characteristic oscillation frequency ωc and the decay time τ. This is done many times for a given temperature and repeated for several temperatures.
Using the ωc, the surface tension γ can be found from the following equation [29]
ω c 2 = 8 γ ρ r 0 3 ,
where r0 is the radius of the sample when a spherical shape is assumed and ρ is the liquid density. Similarly, from the τ, the viscosity η is found by [30]
η = ρ r 0 2 5 τ .

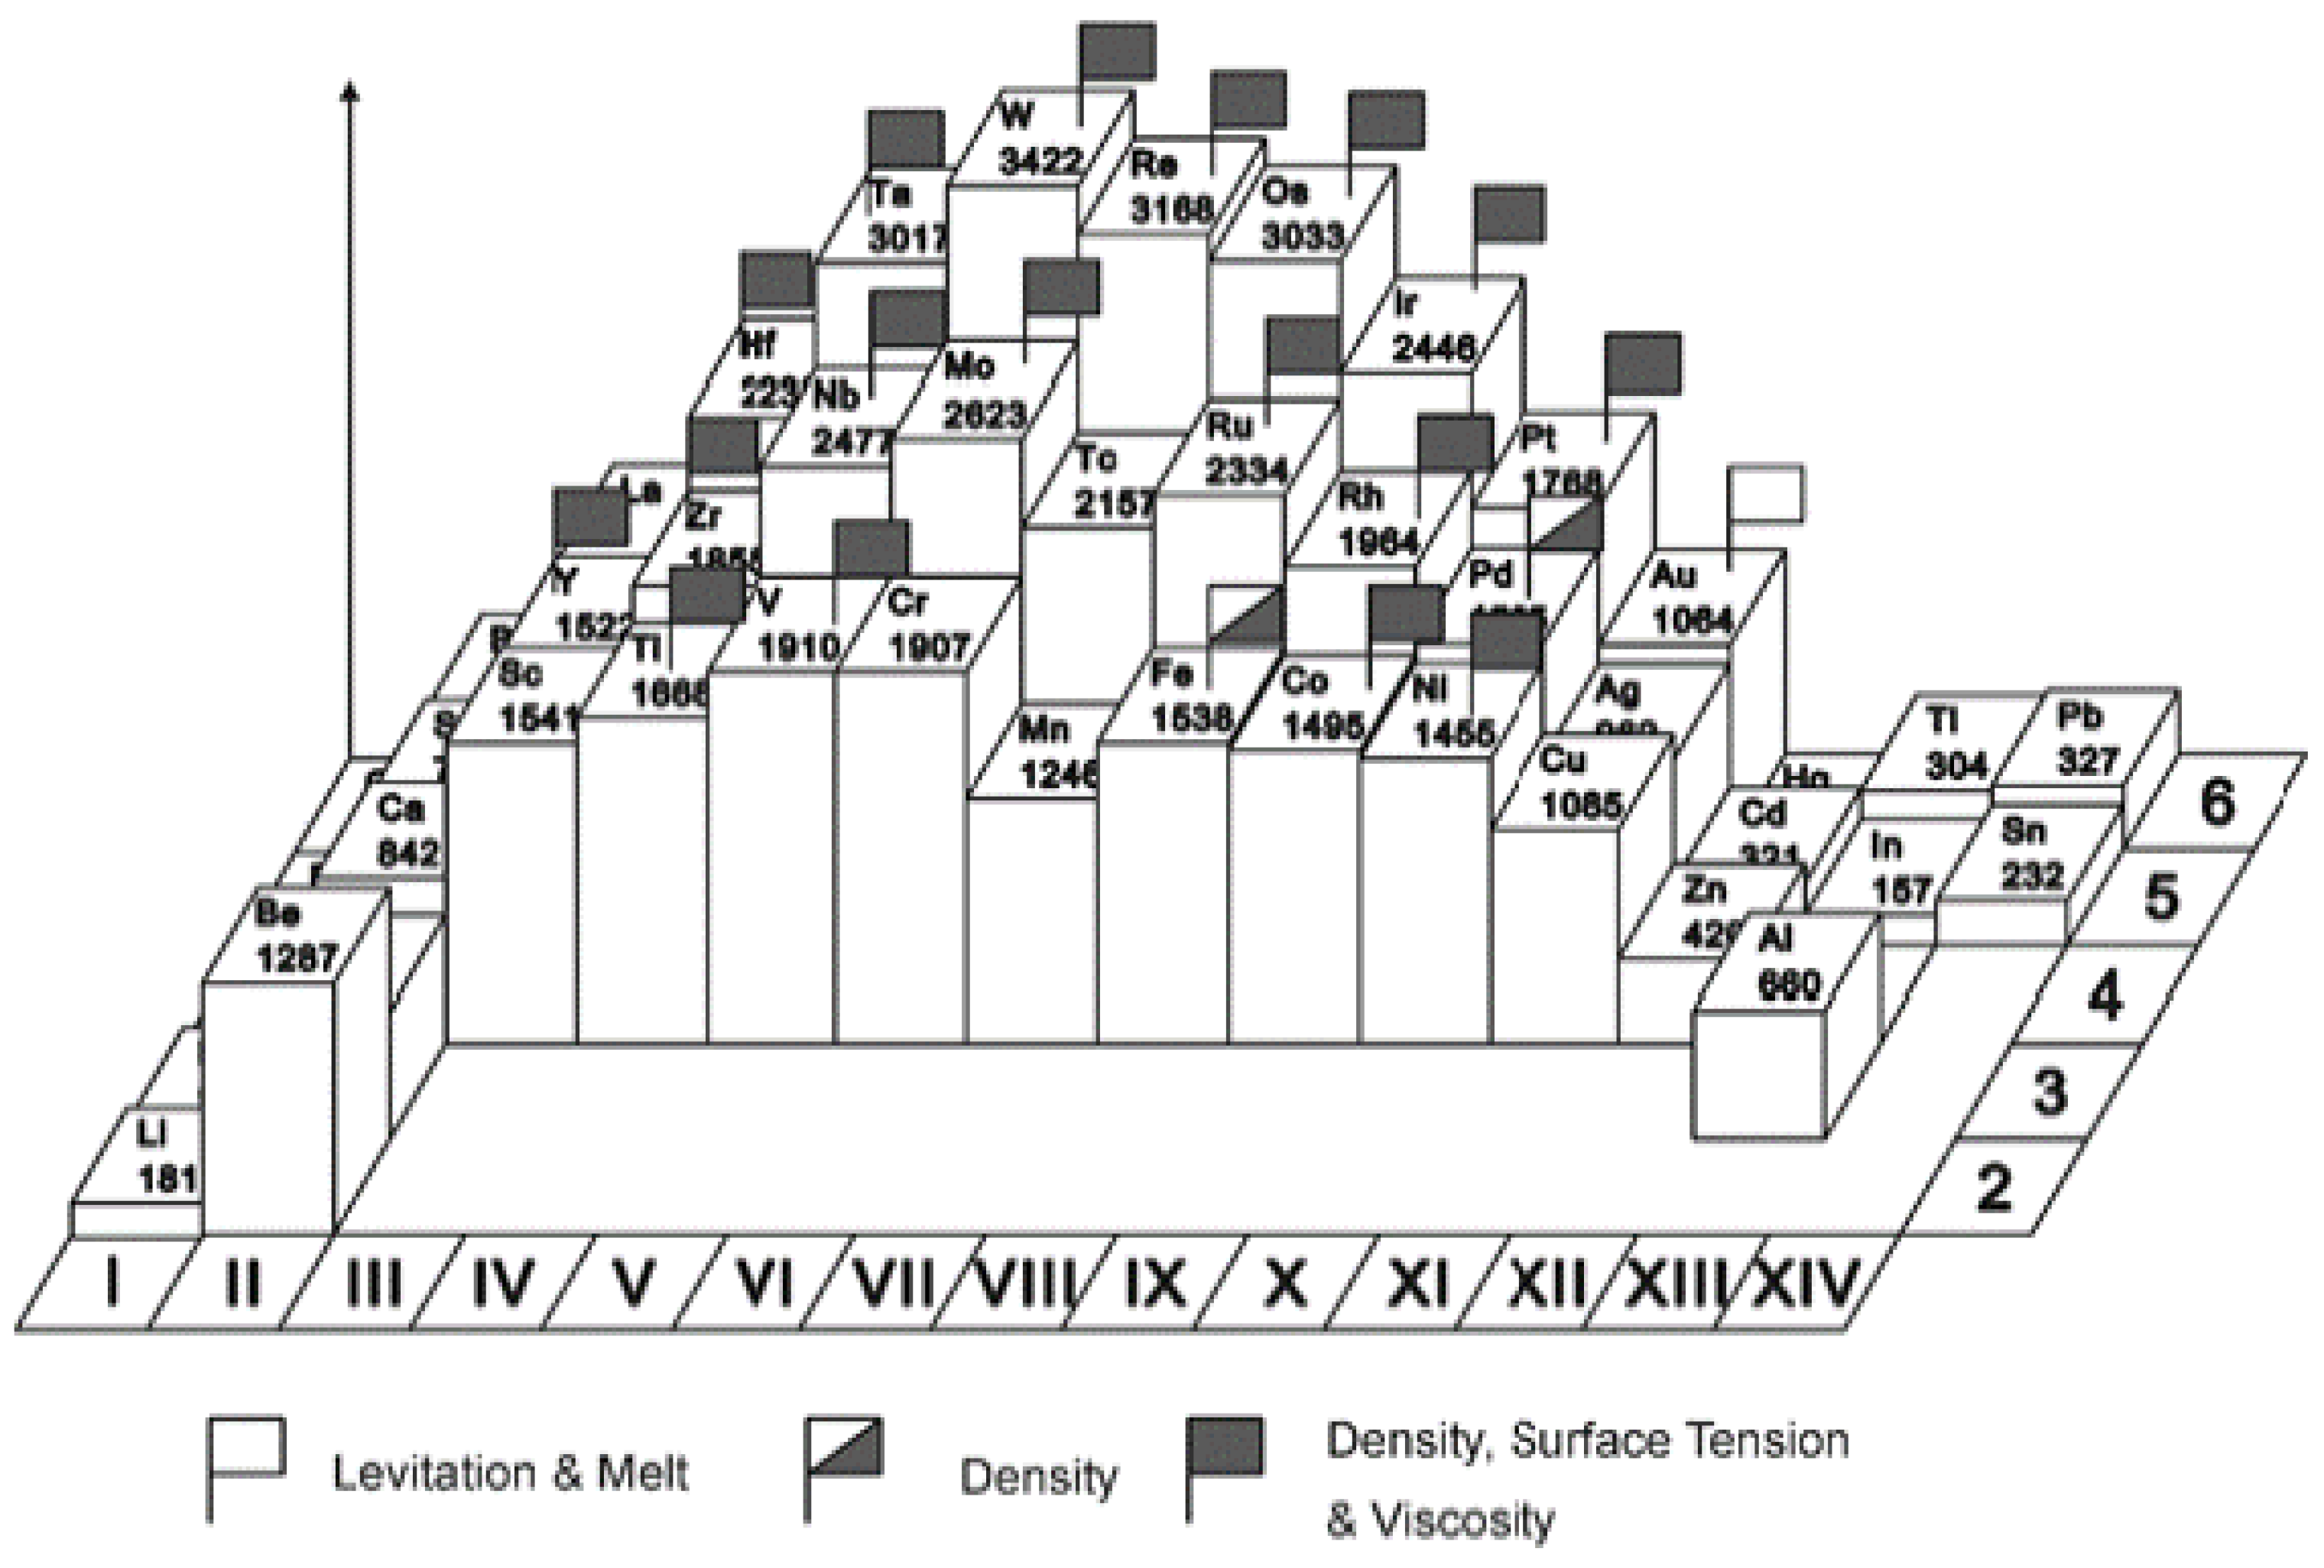
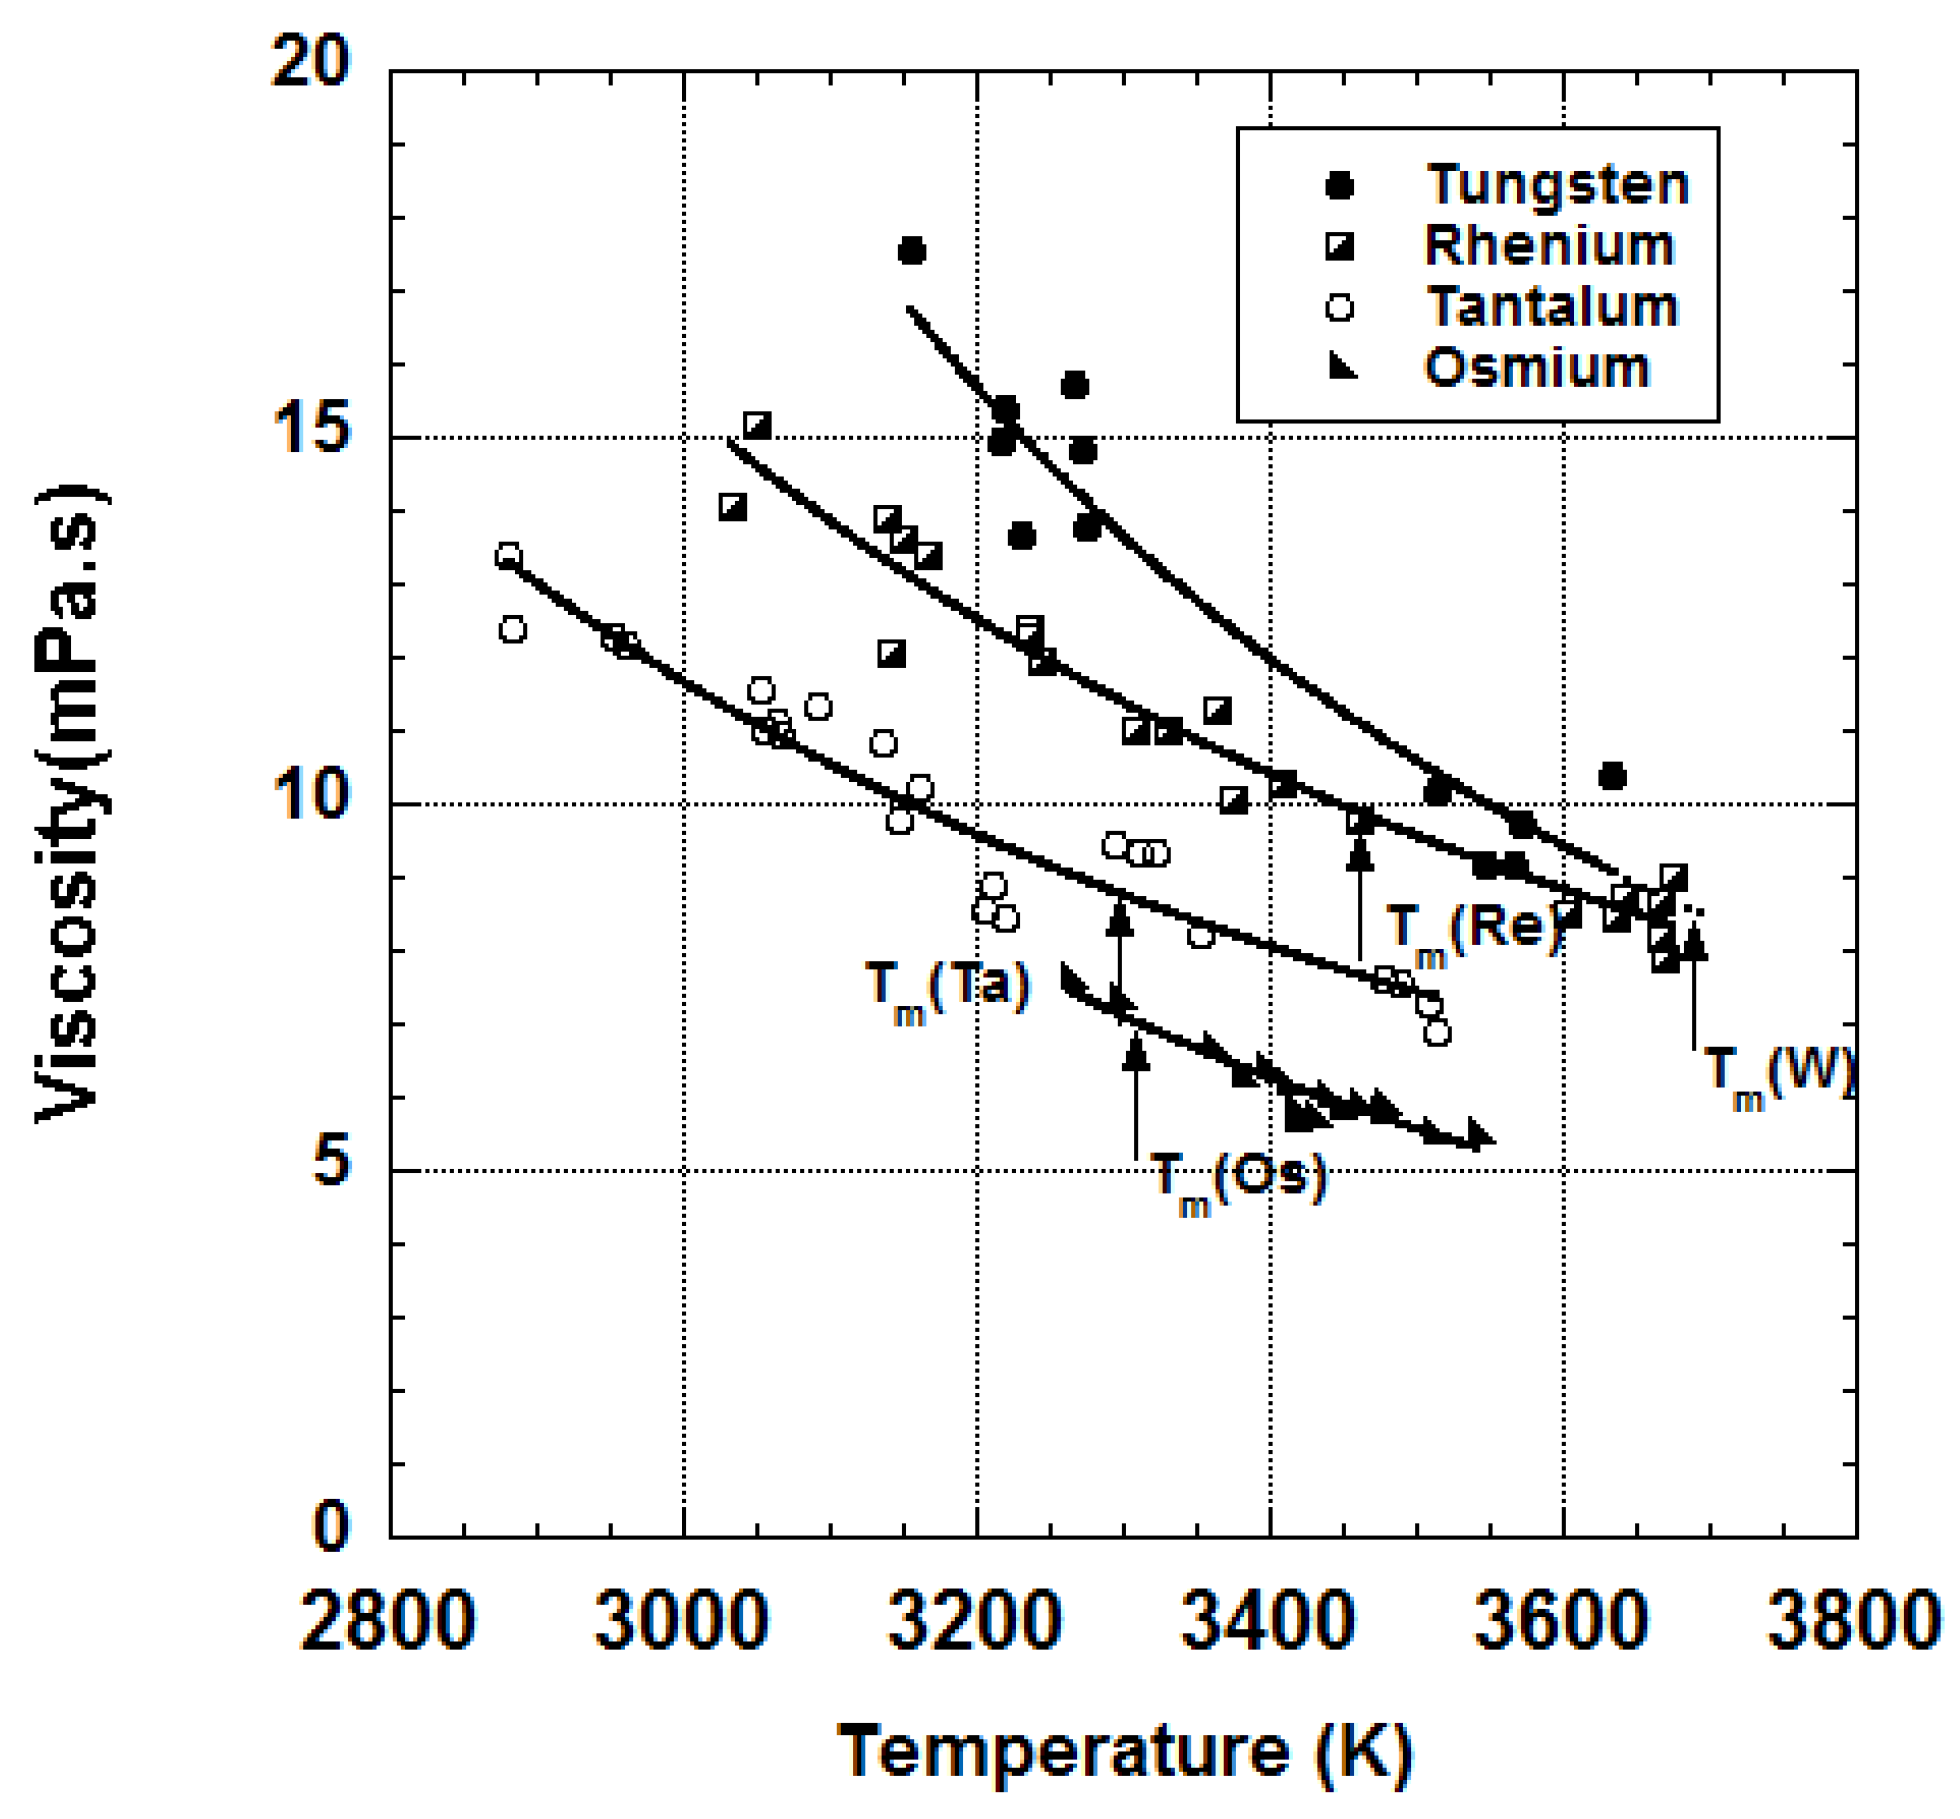
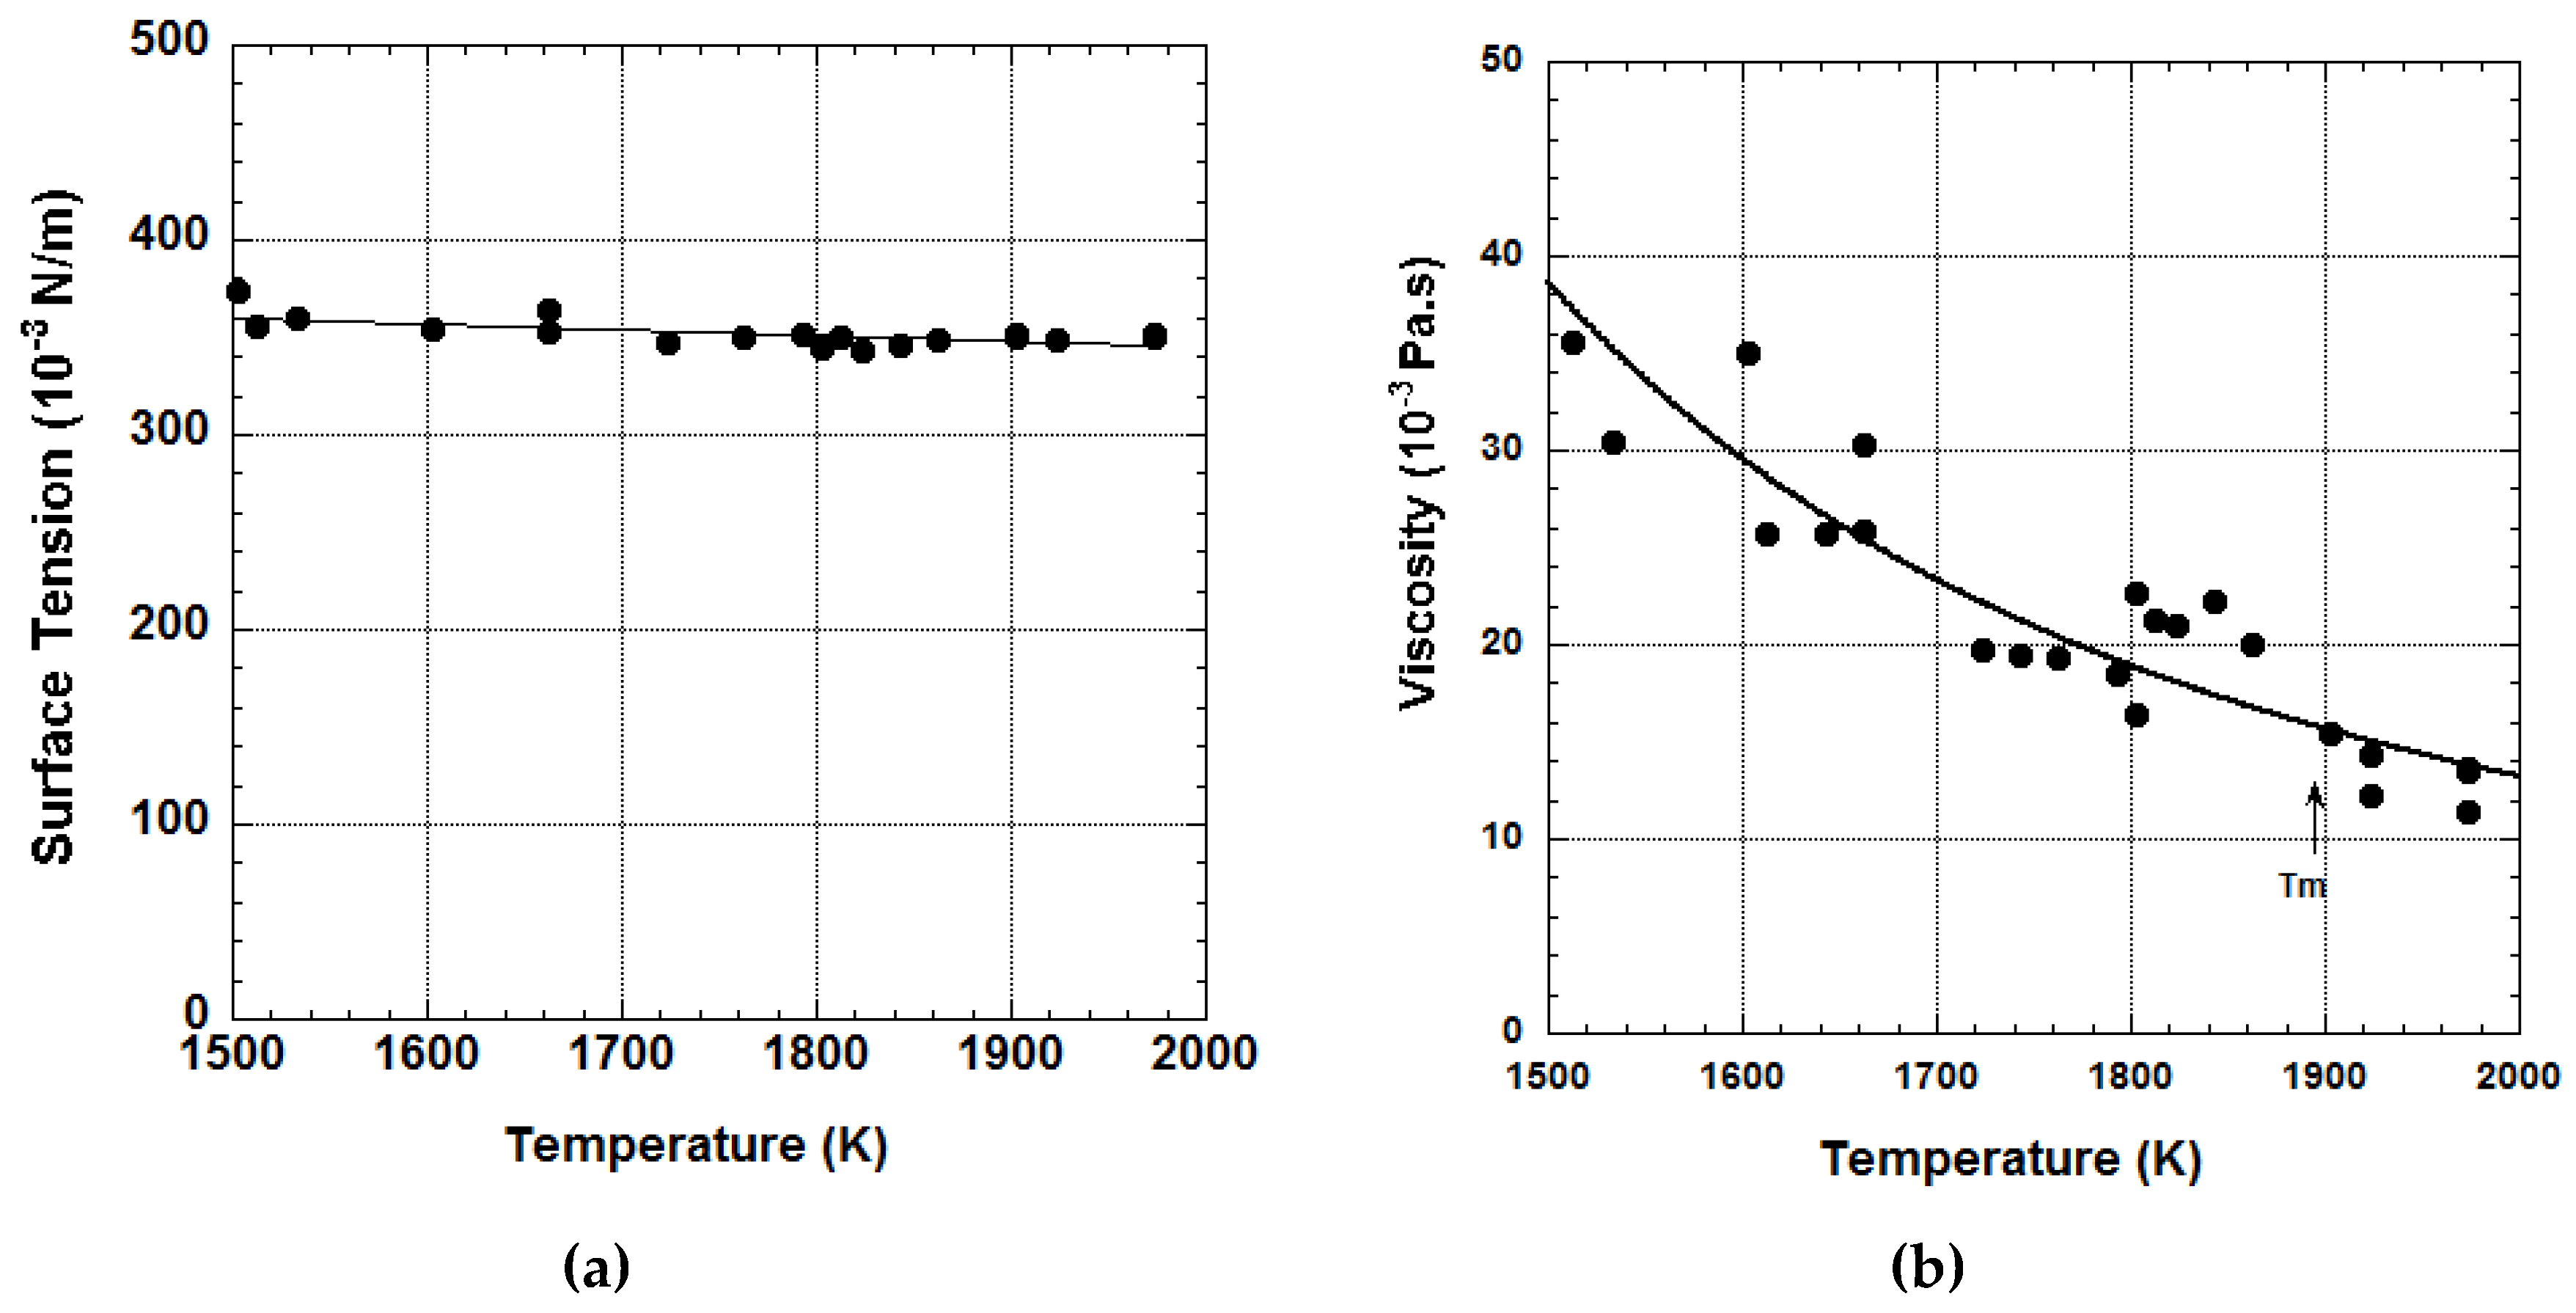
4.1.3. Measurement of Molten Refractory Materials

Figure 14 summarizes the status of our thermophysical property measurements of refractory metals under high vacuum. Density, surface tension and viscosity of refractory metals whose melting temperatures are above 1500 °C have been systematically measured. Figure 15 shows the viscosity of tantalum, tungsten, rhenium and osmium as a function of temperature [31]. The measurement covered a wide temperature range including the undercooled region. It is noticeable that no literature data could be found for the viscosity data of these elements.
In principle, ESL is possible under high pressure gaseous condition. A pressurized electrostatic levitator has been developed [32]. Density, surface tension and viscosity of a few oxide materials have been measured with this facility, as shown in Figure 16 that shows results of measurements on molten barium titanate [33]. In addition, the densities of several molten metal oxides have been measured successfully. However, operations of the facility to levitate and melt samples are very difficult [34,35,36]. Oxide samples are especially difficult to levitate in 1-G because the surface charge on the samples is relatively small compared with those of metals.

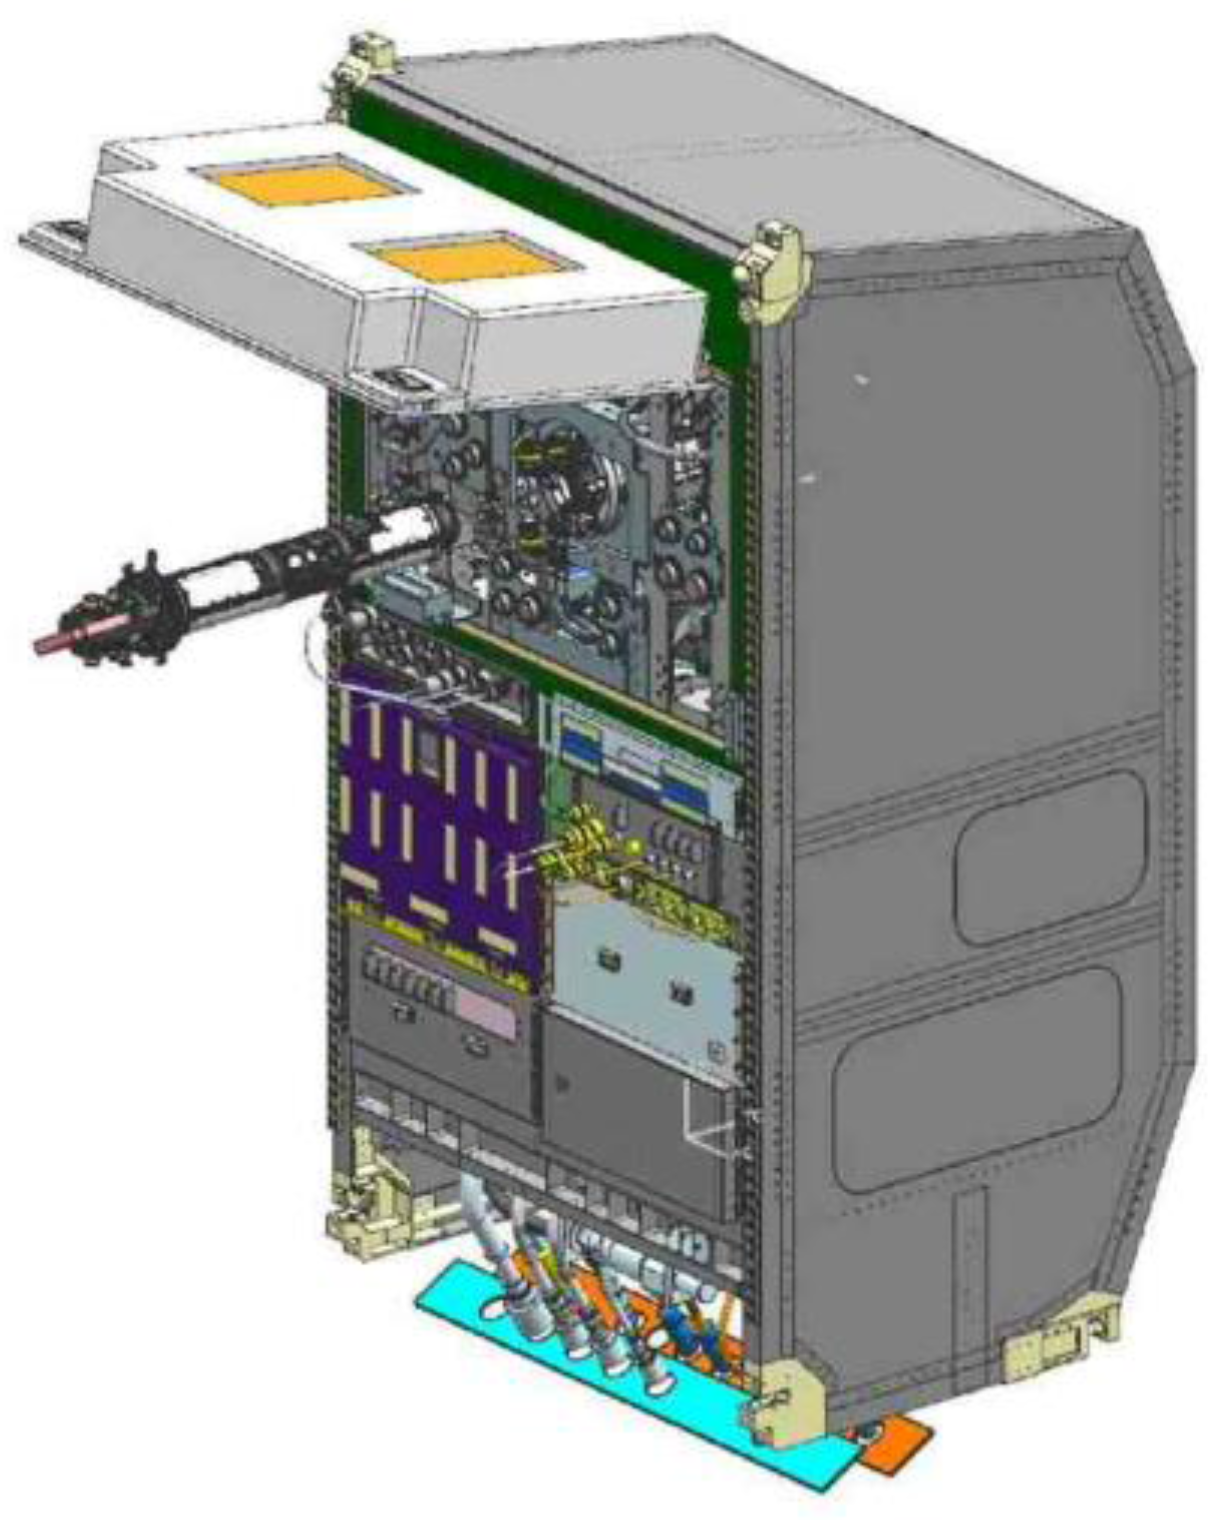
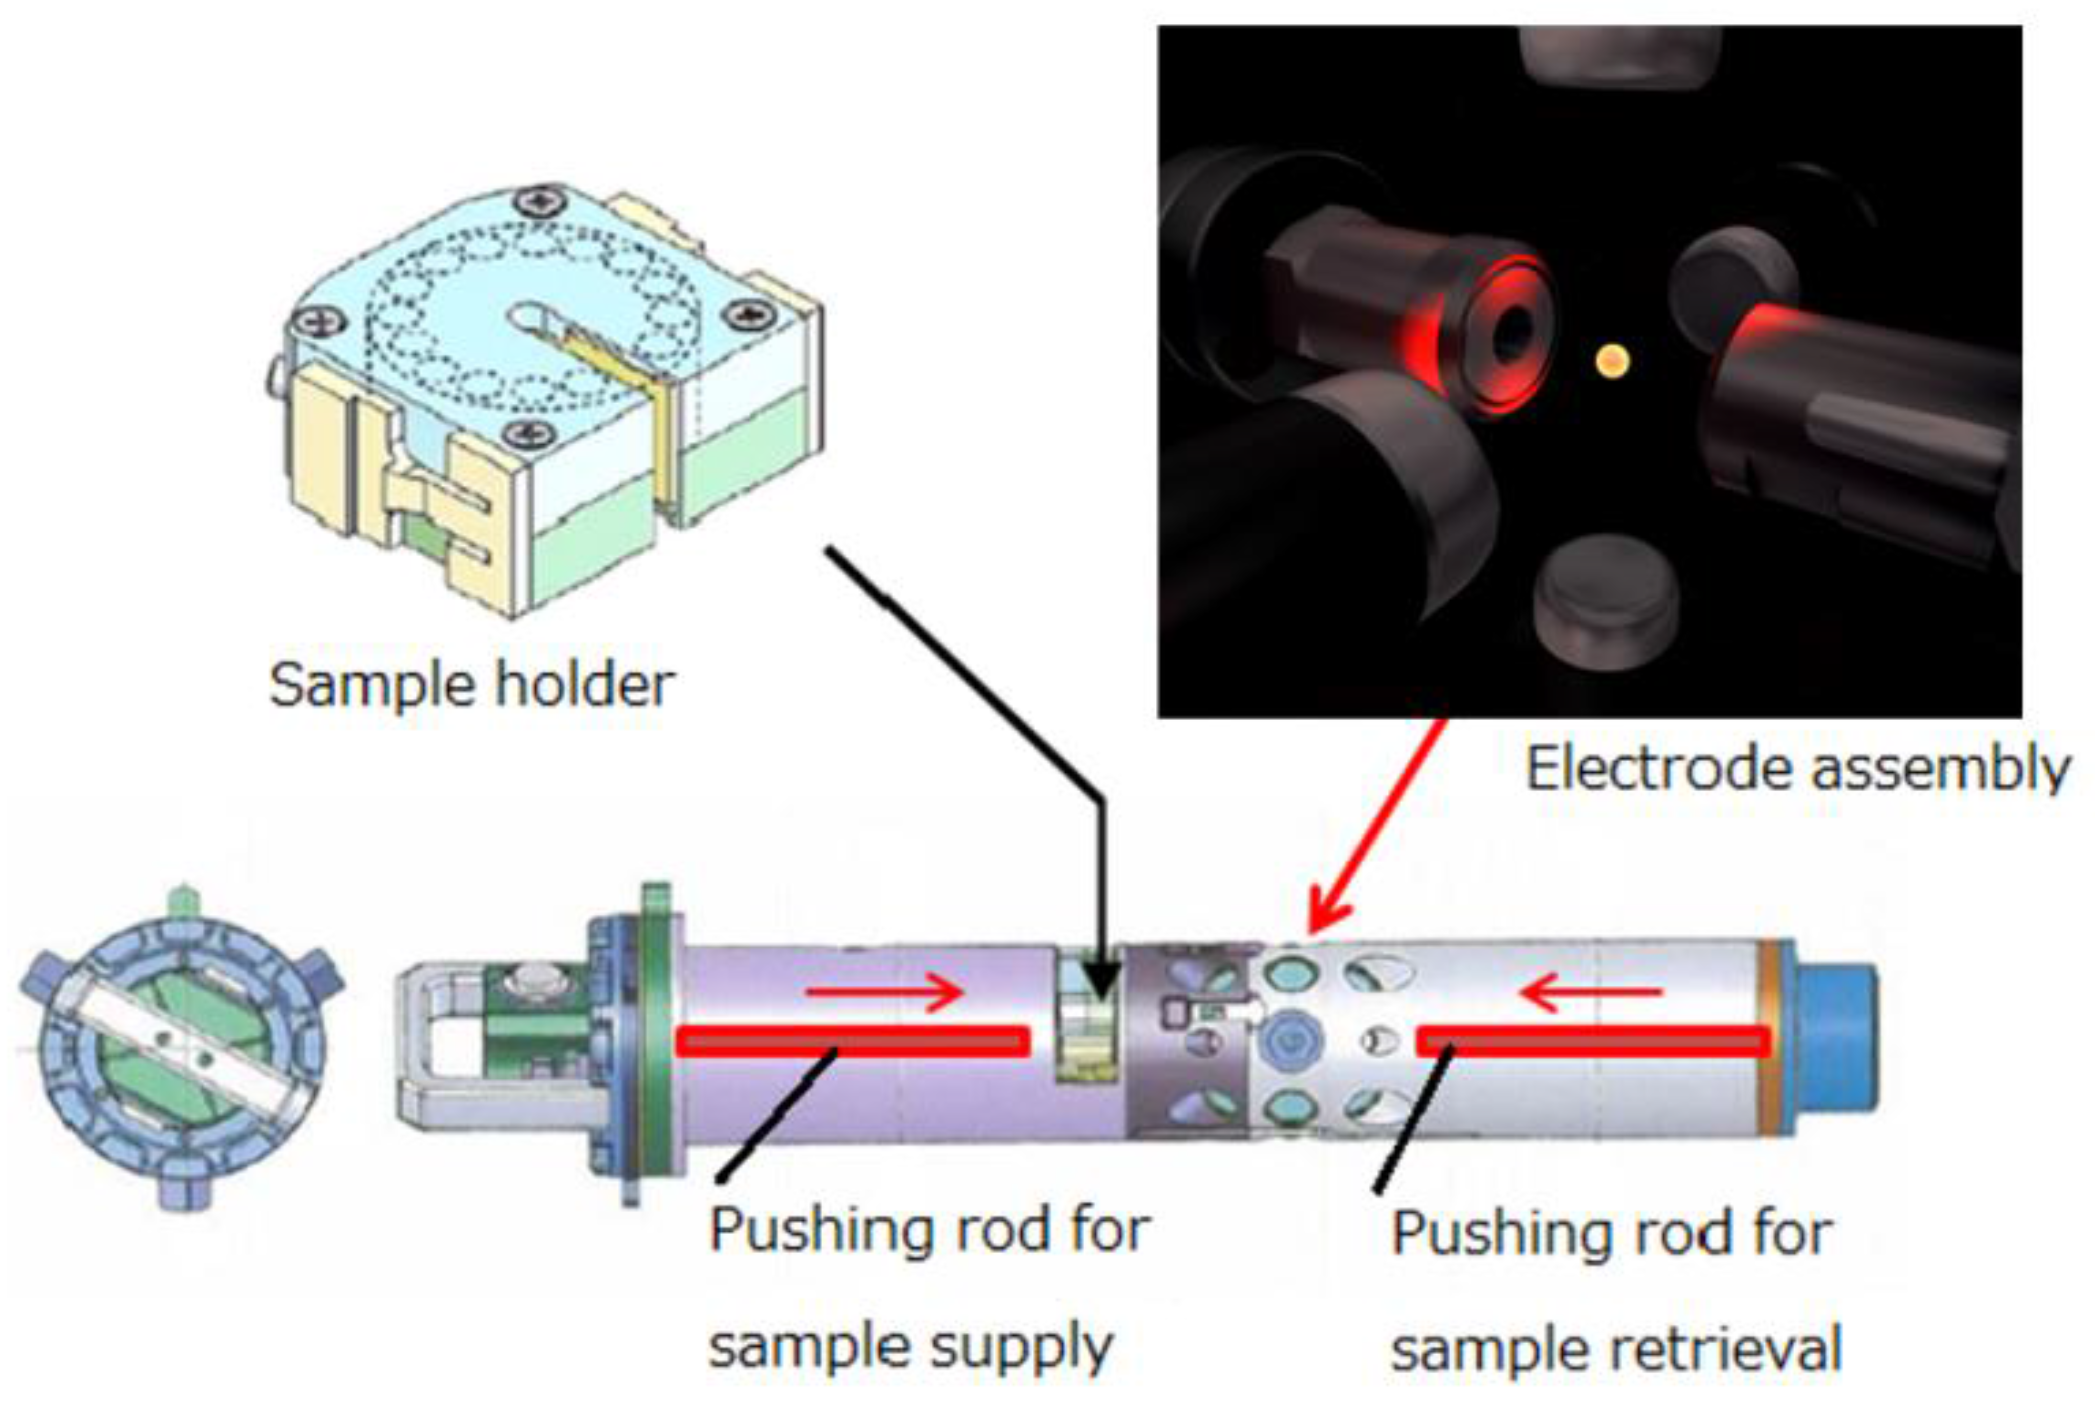
4.2. An Electrostatic Levitation Furnace in the International Space Station (ISS-ELF)

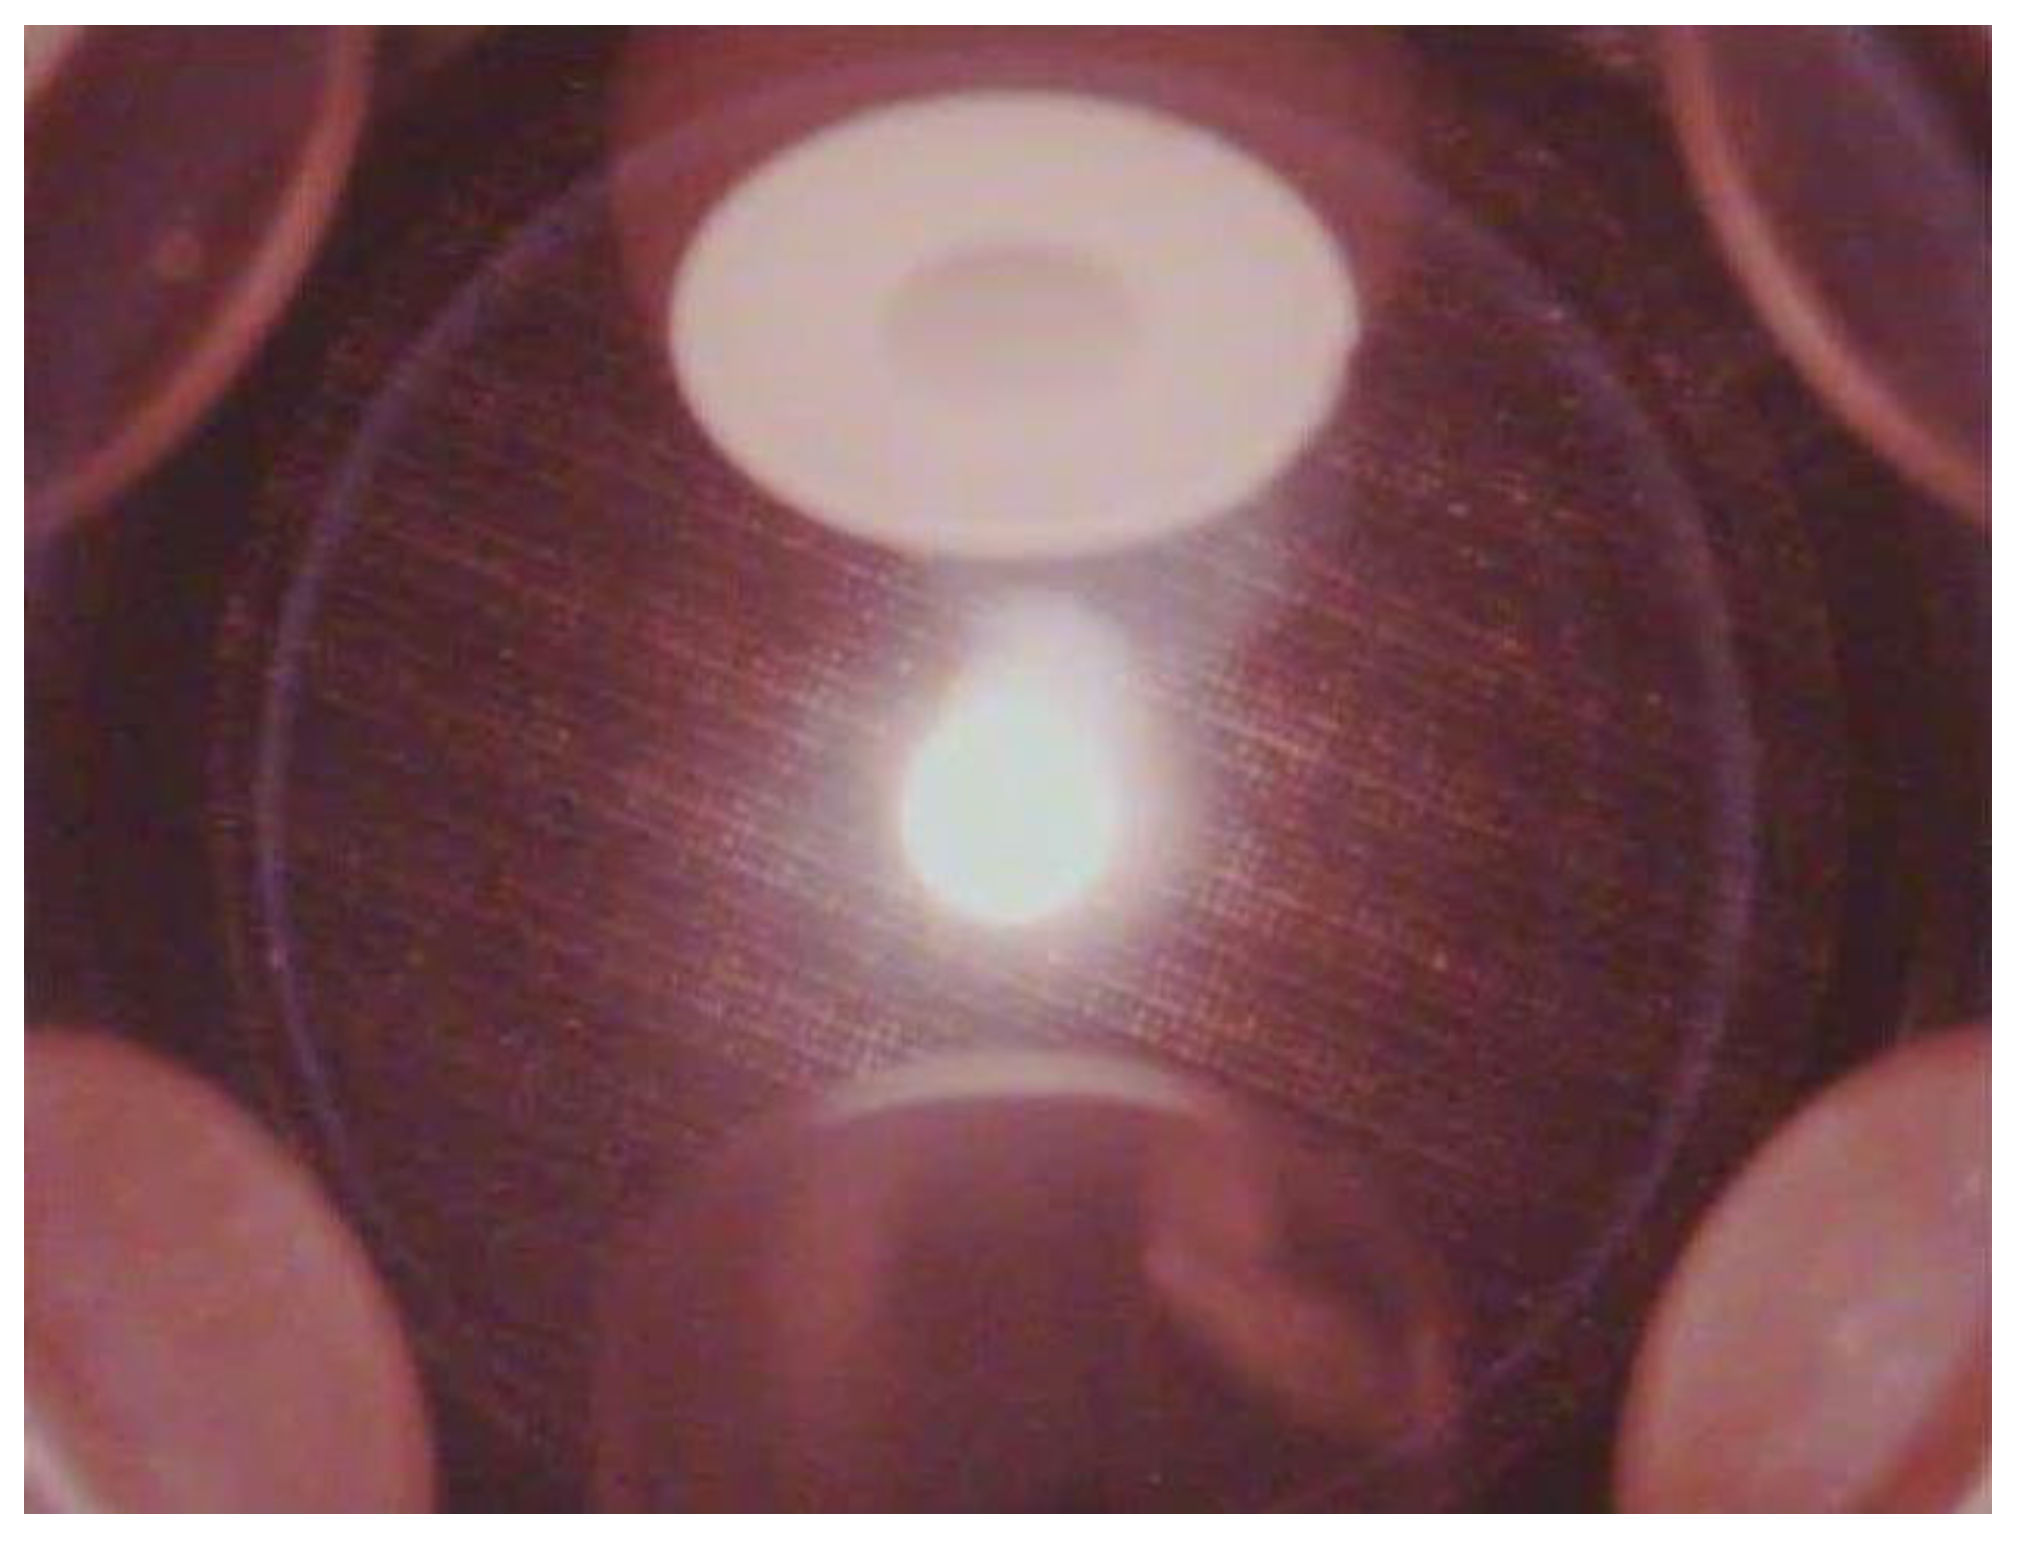
4.2.1. Necessity of Microgravity

The main advantages of microgravity experiments are for investigation of liquids where precise control of fluid motion enables the decoupling of diffusion and convection mass transport and it avoids sedimentation of phases with different densities in multi-phase systems. When these advantages are combined with containerless techniques, samples can be studied in pristine conditions, at extreme temperatures and in deeply supercooled states. The small forces and open access afforded by the ESL method provides a unique capability for investigation of materials that are of both fundamental and applied interest.
In addition to the important scientific capabilities, there are some practical engineering advantages to operation of a containerless instrument in microgravity. The small positioning forces required make it easier to achieve levitation of materials that may not be possible to investigate on the ground. In some cases, evaporation from the molten samples in high vacuum conditions can prevent measurements at high temperatures.
An important and practical solution to this problem is to perform levitations in microgravity. Since a high electric field between electrodes is not necessary, inert gases can be used to suppress evaporation. Also, the sample position can be controlled even with only a small amount of charge can be accumulated on the surface.

4.2.2. International Space Station Electrostatic Levitation Furnace (ISS-ELF)

The (ELF for the ISS (ISS-ELF) has been designed and developed to conduct containerless processing experiments that cannot be performed on the ground. The main objective– of this facility is to process (melt and solidify) and make in-situ measurements on molten oxide samples in a gaseous atmosphere. In the current system, nitrogen, dry air and argon are available. Due to the limited accommodation space and electrical power, a vacuum pump is not used on the present instrument.
ISS-ELF is composed of a main-body and cartridge (Figure 17). The main body is inserted in the Multi-purpose Small Payload Rack (MSPR) from which all resources (e.g., electrical power, cooling water, gas) are supplied. The main body consists of a chamber, optical components (shown in Figure 11) and controllers. A sample cartridge is inserted into the main body.
Figure 18 shows the details of the sample cartridge. The sample cartridge contains the electrode assembly where samples are levitated, a sample holder and mechanical system (push rod) to insert/retrieve samples between the sample holder and electrodes. A sample holder can contain up to 15 samples. The crew will exchange sample holders when all the samples in a holder are processed. Then, the sample holder will return to earth to enable the analysis of the processed samples.
The sample cartridge remains on the ISS, until maintenance, such as cleaning windows or electrodes, are required.
Samples are levitated between six electrodes. Optical windows are three-dimensionally placed. The levitated sample is heated by semiconductor lasers that operate at a wavelength of 970 nm from 4 directions. The levitator is designed to melt samples of about 2 mm in diameter at temperatures up to about 2500 °C depending on their optical properties. The system is equipped with instrument to measure the thermophysical properties, density, surface tension and viscosity, of molten samples. ISS-ELF can be remotely operated from the ground via ISS network. More detailed description on the ISS-ELF can be found in [37].
The ISS-ELF was launched in August 2015 and installed at the ISS in February 2016. Currently, test samples are levitated to evaluate the performance of the facility. Some Oxides whose melting temperatures are above 2000 °C have been successfully levitated and melted. Figure 19 shows a snapshot of a molten alumina sample levitated in ISS-ELF.

5. Acoustic Levitation

The selection and application of sample environment is a critical element of research on advanced materials, geological systems, pharmaceutical, cosmetic and biological compounds [3]. At high temperatures (typically above about 1500 °C), gross chemical reactions between containers and their contents limits the conditions that can be accessed. At all temperatures, including below ambient, extrinsic heterogeneous nucleation by container walls limits the ability to supercool liquids below their equilibrium melting point or to make highly supersaturated solutions. As discussed elsewhere in this article, containerless techniques are essential in order to investigate materials such as molten oxides, liquid metals and alloys and other molten phases at high temperatures [38,39,40,41,42]. Containerless methods open up new possibilities for work with lower temperature materials. This section outlines the methods for AL and briefly summarizes some examples of its application to investigate solutions and low melting point organic materials.
AL is a convenient tool for low surface tension, low density liquids (e.g., water, organic solvents and liquid/solid polymers) in the temperature range from about −40 to +40 °C. This temperature range includes the supercooled region for water and many inorganic and organic based solutions that are important in oceanic and biological processes, pharmaceutical and cosmetic materials processing and investigation of soft matter. By eliminating contact with container walls, extrinsic sources of nucleation can be avoided and it often becomes possible to cool liquids substantially below their equilibrium melting point or to achieve highly supersaturated solutions that would crystallize in containers. AL instruments are compact and can easily be integrated with a wide variety of non-contact analytical instrument [43].
One of the earliest reports of AL was by Bucks and Müller in the 1930s [44]. Subsequent interest in AL/positioning took place in the 1980s as part of the development of materials and fluid physics experiments in reduced gravity. An early microgravity experiment on molten calcia-gallia-silica glass formers was performed using a single axis acoustic levitator on the Space Shuttle [45]. Various investigations of fluid and drop physics were performed in microgravity using the NASA Drop Physics Module [46], also on the Space Shuttle.
Barmatz et al. [47] developed techniques that use resonant cavities to create regions that can trap small (1–3 mm) samples. Resonant AL enables operation with relatively low sound pressure levels but it is very sensitive to changes in sound wavelength that can result from thermal gradients in the gas around the sample. The technique has been used mainly in microgravity research where the required positioning forces are small. Interference acoustic levitators were developed by Whymark [48], Rey et al. [49] and Trinh et al. [50], in the USA, in Europe [51] and in Asia [52]. A simple interference acoustic levitator uses a single transducer and an opposed reflector to create standing waves [53]. The transducer-reflector arrangement provides stable levitation close to the reflector and it does not enable manipulation of the sample. Single-axis levitators that use two opposed transducers [53] can control sample position via the relative acoustic phases of the two sound sources. The transducers usually operate in the frequency range from 20 to 70 kHz, where the wavelengths are 5–17 mm in air at 20 °C. The transducers are typically separated by a distance of 10–15 wavelengths.
Containerless methods are widely used to investigate materials at high temperatures using a variety of non-contact methods including high energy X-rays and neutrons and, as discussed in this paper, measurements of thermophysical properties [28,53,54]. Drop oscillation can be used to measure the surface tension and viscosity of liquids [28,53,54]. In an interference acoustic levitator, modulation of the acoustic forces can induce oscillations in low viscosity liquids by cyclically compressing and relaxing a levitated drop. In a two-transducer interference levitator, modulation is achieved by systematically (usually sinusoidally) varying the power delivered to the transducers [55]. By adjusting the relative phase of the two transducers levitated objects can also be moved in either direction along the axis of the levitator.
The following sections present some examples of the application of AL to investigate liquids. Much of the work has focused on pharmaceutical materials [56,57,58], where development of amorphous forms is an important area in connection with exploiting emerging drugs.

5.1. Thermophysical Properties

The ability to observe the complete profile of the levitated droplet in an acoustic levitator provides a useful means to make property measurements. The data are analyzed using similar methods to those applied to the ESL method and these are described in Section 4.1. The results in Figure 20 show drop oscillation achieved by cyclically varying the acoustic force on a droplet. When the oscillation approaches the natural resonant frequency of the drop, a large increase in amplitude occurs. Images of the drop are analyzed to determine the resonant frequency and derive the surface tension of the liquid.

5.2. Solvent Evaporation

Evaporation of solvents such as water, ethanol and acetone is an important component of many industrial processes. For example, spray drying is used in food, pharmaceutical and cosmetics materials processing to prepare powders and other product forms. In the acoustic levitator solvents evaporate from the free surface of a levitated sample. Investigation of the structure of materials during the solvent evaporation process provides a useful way in which to study changes that occur during processing. This technique has been used to investigate formation of amorphous pharmaceuticals [56,57,58] and is being applied to studies of crystalline phase selections in systems that can crystallize in different structural conformations. In most cases, evaporation results in self-cooling of a levitated drop. The calculated adiabatic cooling, proportional to the latent heat of vaporization divided by the heat capacity of the solvent, is typically ~300 °C for most liquid solvents. The measured values of self-cooling are on the order 2–40 °C, much smaller than calculated [58]. This difference is attributed to heat absorption from the surroundings and condensation of water from the air into the cooling drop. The data and images shown in Figure 21 were obtained using a FLIR A325 thermal imaging camera (FLIR, Wilsonville, OR, USA sighted onto a levitated drop of solvent and a Styrofoam sphere as a reference. Soon after insertion the drop cools rapidly as the solvent evaporates. For rapidly evaporating solvents, the temperature of the drop starts to increase again after a few seconds as water condenses onto the drop.

5.3. X-ray Diffraction

Acoustic levitators have been integrated with synchrotron beamlines in Japan, the USA and Europe. Work in the USA has mainly focused on investigation of pharmaceutical materials [56,57,58], where the development of stable amorphous forms is an urgent requirement in order to utilize emerging drugs that are practically insoluble in their crystalline forms. In many cases, absorption of active pharmaceutical ingredients can be increased by as much as a factor of 100 by formulating a drug as an amorphous component of the dosage.
The data shown in Figure 22 (from [56]) show changes in the position of the principal peak in S(Q) as a function of time as solvent evaporates from a saturated solution of ibuprofen in ethanol. The sample was a levitated drop of a saturated solution of ibuprofen in ethanol. The results show that the main structural changes occur during the first 15 min as most of the solvent evaporates and a viscous amorphous gel forms. The levitation experiment was continued for a period of about 16 h on the same sample and measurements were made throughout the experiment. There were essentially no further changes in structure after the formation of the amorphous gel.
Experiments at synchrotron sources can enable high quality measurements of the structure factor, X-ray spectroscopy of ions or imaging in a period of less than one second. Diffraction using high-energy X-rays (~100 keV) provides a bulk probe of materials and enables measurements over a wide reciprocal space range needed to calculation of pair distribution functions.

5.4. Neutron Diffraction/Scattering

Cristiglio et al. [59] used AL in combination small angle neutron scattering (SANS) and synchrotron radiation circular dichroism (SRCD) to study the structural behavior of proteins in water-based solutions as the solvent evaporated. The aggregation of ~50 μL droplets of lysozyme in water was followed during the continuous increase of the sample concentration by evaporating the solvent. SANS was used to follow the development of order in the solution as the protein molecules agglomerated.
Neutron techniques are attractive for investigation of materials that are composed of light elements, such as proteins and organic liquids, that do not scatter X-rays strongly. High flux neutron sources such as Institut Laue–Langevin (ILL) (Grenoble, France), European Spallation Source (ESS) (Lund, Sweden), Japan Proton Accelerator Research Complex (J-PARC) (Tokai, Ibaraki, Japan) and SNS required in order to obtain sufficient count rates to study time dependent structure changes as a material undergoes phase changes or crystallizes.

5.5. Other Techniques

The use of gases to change the pH of a solution without contact was explored by wafting ammonia over an acidic solution. As the pH increased the solute was salted out leading to formation of a finely divided solid precipitate that floated in the liquid phase. Ammonia was generated by bubbling nitrogen through a concentrated ammonia solution contained in a bubbler. The slow-moving gas stream was directed towards the levitated drop. The pH of the solution was monitored by adding universal indicator to it and observing the color changes as the ammonia was absorbed (Figure 23).

6. Concluding Remarks

In this article, we have reviewed recent developments of the instrumentation of several levitation techniques for quantum beam facilities and thermophysical property measurements. Moreover, state-of-art scientific activities are reviewed.
Containerless techniques are becoming a standard sample environment for the study of materials in a wide variety of conditions. AL provides a useful addition to the range of levitation methods because it is uniquely suited to working with low density, low surface tension liquids at around ambient temperature. The ambient atmosphere around the sample provides opportunities for control of the sample via gas phase additions such as ammonia or solvent. Ongoing work includes developing advanced computer control of levitation functions that can enable automated operation and continuous sample introduction. Advances in sample enclosures will allow work with controlled humidity or solvent activity to study evaporation processes in new ways. Developments in phased array transducers offer the potential for creating complex arrays of levitated particles.
As discussed in Section 3.1, a combination of diffraction/density measurement and DFT-MD simulation is very important to understand the nature of viscosity. Therefore, a combination of quantum beam facilities and ELF at ISS will play an important role towards unravelling the origin of fragility in liquids.
Along with developments in containerless techniques there is a need for advances in non-contact diagnostics. Fast imaging, high precision imaging and thermal mapping have all advanced considerably in the last decade. Precise measurement of sample temperature requires radiometry and knowledge of the relevant optical properties of the sample.
Overall the state of the art is significant and interest from users, funding agencies and industrial research facilities is underpinning a sustained and broad utilization of containerless and non-contact techniques. Experiments in microgravity promise to enable more precise determination materials transport properties in liquids that will help to support predictive models for development of advanced materials.

Acknowledgments

We thank Chris Benmore (Argonne National Laboratory) Oliver Alderman and Anthony Tamalonis (Materials Development, Inc.) for helpful discussions. Work on acoustic levitation was partially supported by the National Institutes of Health under grant number 1R43GM117701-01A1. Work to develop and implement low gravity experiments on molten oxides on the International Space Station is being supported by NASA under grant number 80NSSC18K0059. Part of this work was supported by JST-PRESTO ‘Advanced Materials Informatics through Comprehensive Integration among Theoretical, Experimental, Computational and Data-Centric Sciences (JPMJPR15N4)’ and the ‘Materials Research by Information Integration’ Initiative (MI2I) project of the Support Program for Starting Up Innovation Hub from JST.

Author Contributions

S.K., K.O., T.I., H.T. and R.W. conceived and wrote the paper.

Conflicts of Interest

The authors declare no conflict of interest.

References

  1. Angell, C.A. Formation of glasses from liquids and biopolymers. Science 1995, 267, 1924–1935. [Google Scholar] [CrossRef] [PubMed]
  2. Muck, O. German Patent No. 42204, 30 October 1923.
  3. Hennet, L.; Holland Moritz, D.; Weber, R.; Meyer, A. High-Temperature Levitated Materials. In Neutron Scattering—Applications in Biology, Chemistry, and Materials Science; Fernandez-Alonso, F., Price, D.L., Eds.; Experimental Methods in the Physical Sciences; Cambridge University Press: Cambridge, UK, 2010; Volume 49, pp. 583–636. [Google Scholar]
  4. Weber, J.K.R.; Tamalonis, A.; Benmore, C.J.; Alderman, O.L.G.; Sendelbach, S.; Hebden, A.; Williamson, M.A. Aerodynamic levitator for in situ X-ray structure measurements on high temperature and molten nuclear fuel materials. Rev. Sci. Instrum. 2016, 87, 073902. [Google Scholar] [CrossRef] [PubMed]
  5. Skinner, L.B.; Barnes, A.C.; Salmon, P.S.; Hennet, L.; Fischer, H.E.; Benmore, C.J.; Kohara, S.; Weber, J.K.R.; Bytchkov, A.; Wilding, M.C.; et al. Joint diffraction and modeling approach to the structure of liquid alumina. Phys. Rev. B 2013, 87, 024201. [Google Scholar] [CrossRef] [Green Version]
  6. Skinner, L.B.; Benmore, C.J.; Weber, J.K.R.; Du, J.; Neuefeind, J.; Tumber, S.K.; Parise, J.B. Low cation coordination in oxide melts. Phys. Rev. Lett. 2014, 112, 157801. [Google Scholar] [CrossRef] [PubMed]
  7. Kohara, S.; Akola, J.; Patrikeev, L.; Ropo, M.; Ohara, K.; Itou, M.; Fujiwara, A.; Yahiro, J.; Okada, J.T.; Ishikawa, T.; et al. Atomic and electronic structures of an extremely fragile liquid. Nat. Commun. 2014, 5, 5892–5898. [Google Scholar] [CrossRef] [PubMed] [Green Version]
  8. Skinner, L.B.; Benmore, C.J.; Weber, J.K.R.; Williamson, M.A.; Tamalonis, A.; Hebden, A.; Wiencek, T.; Alderman, O.L.G.; Guthrie, M.; Leibowitz, L.; Parise, J.B. Molten uranium dioxide structure and dynamics. Science 2014, 346, 984–987. [Google Scholar] [CrossRef] [PubMed]
  9. Salmon, P.S.; Martin, R.A.; Mason, P.E.; Cuello, G.J. Topological versus chemical ordering in network glasses at intermediate and extended length scales. Nature 2005, 435, 75–78. [Google Scholar] [CrossRef] [PubMed]
  10. Takada, A.; Richet, P.; Catlow, C.R.A.; Price, G.D. Molecular dynamics simulations of vitreous silica structures. J. Non-Cryst. Solids 2004, 345–346, 224–229. [Google Scholar] [CrossRef]
  11. Bhatia, A.B.; Thornton, D.E. Structural aspects of the electrical resistivity of binary alloys. Phys. Rev. B 1971, 4, 3004–3012. [Google Scholar] [CrossRef]
  12. Faber, T.E.; Ziman, J.M. A theory of the electrical properties of liquid metals. Philos. Mag. 1965, 11, 153–173. [Google Scholar] [CrossRef]
  13. Mei, Q.; Benmore, C.J.; Weber, J.K.R. Structure of liquid SiO2: A measurement by high-energy X-ray diffraction. Phys. Rev. Lett. 2007, 4, 057802. [Google Scholar] [CrossRef] [PubMed]
  14. Zachariasen, W.H. The atomic arrangement in glass. J. Am. Chem. Soc. 1932, 54, 3841–3851. [Google Scholar] [CrossRef]
  15. Kohara, S.; Akola, J.; Morita, H.; Suzuya, K.; Weber, J.K.R.; Wilding, M.C.; Benmore, C.J. Relationship between topological order and glass forming ability in densely packed enstatite and forsterite composition glasses. Proc. Natl Acad. Sci. USA 2011, 108, 14780–14785. [Google Scholar] [CrossRef] [PubMed]
  16. Akola, J.; Kohara, S.; Ohara, K.; Fujiwara, A.; Watanabe, Y.; Masuno, A.; Usuki, T.; Kubo, T.; Nakahira, A.; Nitta, K.; et al. Network topology for the formation of solvated electrons in binary CaO–Al2O3 composition glasses. Proc. Natl. Acad. Sci. USA 2013, 110, 10129–10134. [Google Scholar] [CrossRef] [PubMed]
  17. Mei, Q.; Benmore, C.J.; Sen, S.; Sharma, R.; Yargar, J. Intermediate range order in vitreous silica from a partial structure factor analysis. Phys. Rev. B 2008, 78, 144204. [Google Scholar] [CrossRef]
  18. Wright, A.C. Longer range order in single component network glasses? Phys. Chem. Glasses 2008, 49, 103–117. [Google Scholar]
  19. Price, D.L.; Ellison, A.J.G.; Saboungi, M.-L.; Hu, R.-Z.; Egami, T.; Howells, W.S. Short-, intermediate- and extended-range order in rubidium germanate glasses. Phys. Rev. B 1997, 55, 11249. [Google Scholar] [CrossRef]
  20. Gupta, P.K.; Cooper, A.R. Topologically disordered networks of rigid polytopes. J. Non-Cryst. Solids 1990, 123, 14–21. [Google Scholar] [CrossRef]
  21. McGreevy, R.L.; Pusztai, L. Reverse Monte Carlo simulation: a new technique for the determination of disordered structures. Mol. Simul. 1988, 1, 359–367. [Google Scholar] [CrossRef]
  22. Kim, S.W.; Shimoyama, T.; Hosono, H. Solvated electrons in high-temperature melts and glasses of the room-temperature stable electride [Ca24Al28O64]4+·4e-. Science 2016, 333, 71–74. [Google Scholar] [CrossRef] [PubMed]
  23. Heimbach, I.; Rhiem, F.; Beule, F.; Knodt, D.; Heinen, J.; Jones, R.O. pyMolDyn: Identification, structure and properties of cavities/vacancies in condensed matter and molecules. J. Comput. Chem. 2017, 38, 389–394. [Google Scholar] [CrossRef] [PubMed]
  24. Kohara, S.; Ohno, H.; Takata, M.; Usuki, T.; Morita, H.; Suzuya, K.; Akola, J.; Pusztai, L. Lead silicate glasses: Binary network-former glasses with large amounts of free volume. Phys. Rev. B 2010, 82, 134209. [Google Scholar] [CrossRef]
  25. Rhim, W.-K.; Chang, S.K.; Barber, D.; Man, K.F.; Gutt, G.; Rulison, A.; Spjut, R.E. An electrostatic levitator for high-temperature containerless materials processing in 1-g. Rev. Sci. Instrum. 1993, 64, 2961–2970. [Google Scholar] [CrossRef]
  26. Ishikawa, T.; Okada, J.T.; Paradis, P.-F.; Watanabe, Y. Thermophysical property measurements of high temperature melts using an electrostatic levitation method. Jpn. J. Appl. Phys. 2011, 50, 11RD03. [Google Scholar] [CrossRef]
  27. Chung, S.-K.; Thiessen, D.B.; Rhim, W.-K. A noncontact measurement technique for the density and thermal expansion coefficient of solid and liquid metals. Rev. Sci. Instrum. 1996, 67, 3175–3181. [Google Scholar] [CrossRef]
  28. Rhim, W.-K.; Ohsaka, K.; Paradis, P.-F.; Spjut, R.E. Noncontact technique for measuring surface tension and viscosity of molten materials using high temperature electrostatic levitation. Rev. Sci. Instrum. 1999, 70, 2796–2801. [Google Scholar] [CrossRef]
  29. Lord Rayleigh, J.S.W. On the capillary phenomena of jets. Proc. R. Soc. Lond. 1879, 29, 71–97. [Google Scholar] [CrossRef]
  30. Lamb, H. Hydrodynamics, 6th ed.; Cambridge University Press: Cambridge, UK, 1932; pp. 473–639. [Google Scholar]
  31. Ishikawa, T.; Paradis, P.-F.; Okada, J.; Kumar, M.V.; Watanabe, Y. Viscosity of molten Mo, Ta, Os, Re and W measured by electrostatic levitation. J. Chem. Thermodyn. 2013, 65, 1–6. [Google Scholar] [CrossRef]
  32. Paradis, P.-F.; Ishikawa, T.; Yoda, S. Hybrid electrostatic-aerodynamic levitation furnace for the high temperature processing of oxide materials on the ground. Rev. Sci. Instrum. 2001, 72, 2811–2815. [Google Scholar] [CrossRef]
  33. Ishikawa, T.; Yu, J.; Paradis, P.-F. Non-contact surface tension and viscosity measurements of molten oxides with a pressurized hybrid electrostatic-aerodynamic levitator. Rev. Sci. Instrum. 2006, 77, 053901. [Google Scholar] [CrossRef]
  34. Paradis, P.-F.; Yu, J.; Ishikawa, T.; Aoyama, T.; Yoda, S.; Weber, J.K.R. Contactless density measurement of superheated and undercooled liquid Y3Al5O12. J. Cryst. Growth 2003, 249, 523–530. [Google Scholar] [CrossRef]
  35. Paradis, P.-F.; Yu, J.; Ishikawa, T.; Aoyama, T.; Yoda, S. Contactless density measurement of liquid and high temperature solid BiFeO3 and BaTiO3. Appl. Phys. A 2004, 79, 1965–1969. [Google Scholar] [CrossRef]
  36. Paradis, P.-F.; Yu, J.; Aoyama, T.; Ishikawa, T.; Yoda, S. Contactless density measurement of liquid Nd-doped 50%CaO-50%Al2O3. J. Am. Ceram. Soc. 2003, 86, 2234–2236. [Google Scholar] [CrossRef]
  37. Tamaru, H.; Ishikawa, T.; Okada, J.T.; Nakamura, Y.; Ohkuma, H.; Yukizono, S.; Sakai, Y.; Takada, T. Overview of the electrostatic levitation furnace (ELF) for the International Space Station (ISS). Int. J. Microgravity Sci. Appl. 2015, 32, 32104. [Google Scholar]
  38. Turnbull, D. Undercoolability and Exposure of Metastable Structures. In Undercooled Alloy Phases, Proceedings of the Hume-Rothery Memorial Symposium, New Orleans, LA, USA, 2–6 March 1986; Collings, E.W., Koch, C.C., TMS, Eds.; Metallurgical Society, Inc.: Warrendale, PA, USA, 1986; pp. 3–23. [Google Scholar]
  39. Krishnan, S.; Felten, J.J.; Rix, J.E.; Weber, J.K.R.; Nordine, P.C.; Beno, M.A.; Ansell, S.; Price, D.L. Levitation apparatus for structural studies of high temperature liquids using synchrotron radiation. Rev. Sci. Instrum. 1997, 68, 3512–3518. [Google Scholar] [CrossRef]
  40. Landron, C.; Launay, X.; Rifflet, J.C.; Echegut, P.; Auger, Y.; Ruffier, M.; Coutures, J.-P.; Lemonier, M.; Gailhanou, M.; Bessiere, M.; et al. Development of a levitation cell for synchrotron radiation experiments at very high temperature. Nucl. Instrum. Methods Phys. Res. B 1997, 124, 627–632. [Google Scholar] [CrossRef]
  41. Wall, J.J.; Weber, R.; Kim, J.; Liaw, P.K.; Choo, H. Aerodynamic levitation processing of a Zr-based bulk metallic glass. Mater. Sci. Eng. A 2007, 445–446, 219–222. [Google Scholar]
  42. Brandt, E.H. Levitation in Physics. Science 1989, 243, 349–355. [Google Scholar] [CrossRef] [PubMed]
  43. De Castro, M.D.L.; Capote, F.P. (Eds.) Analytical Applications of Ultrasound; Techniques and Instrumentation in Analytical Chemistry; Elsevier: Amsterdam, The Netherlands, 2007; Volume 26, pp. 268–275. [Google Scholar]
  44. Bucks, K.; Müller, H. Über einige Beobachtungen an schwingenden Piezoquarzen und ihrem Schallfeld. Z. Phys. 1933, 84, 75–86. [Google Scholar] [CrossRef]
  45. Ray, C.S.; Day, D.E. Description of the containerless melting of glass in low gravity. In Proceedings of the 15th National Technical Conference, Cincinnati, OH, USA, 4–6 October 1983; Society for the Advancement of Material and Process Engineering: Azusa, CA, USA, 1983; pp. 135–145. [Google Scholar]
  46. Tian, Y.; Holt, R.G.; Apfel, R.E. Investigations of liquid surface rheology of surfactant solutions by droplet shape oscillations: Theory. Phys. Fluids 1995, 7, 2938. [Google Scholar] [CrossRef]
  47. Barmatz, M.; Collas, P. Acoustic radiation potential on a sphere in plane, cylindrical and spherical standing wave fields. J. Acoust. Soc. Am. 1985, 77, 928–945. [Google Scholar] [CrossRef]
  48. Whymark, R.R. Acoustic field positioning for containerless processing. Ultrasonics 1975, 13, 251–261. [Google Scholar] [CrossRef]
  49. Rey, C.A.; Whymark, R.R.; Danley, T.J.; Merkley, D.R. Materials processing in the reduced gravity environment of space. MRS Symp. Proc. 1982, 9, 137–146. [Google Scholar] [CrossRef]
  50. Trinh, E.H. Compact acoustic levitation device for studies in fluid dynamics and material science in the laboratory and microgravity. Rev. Sci. Instrum. 1985, 56, 2059–2065. [Google Scholar] [CrossRef]
  51. Lierke, E.G.; Grossenbach, R.; Flogel, K.; Clancy, P. Acoustic Positioning for Space Processing of materials science samples in mirror furnaces. In Proceedings of the IEEE Ultrasonics Symposium, Atlanta, GA, USA, 31 October–2 November 1983; McAvoy, B.R., Ed.; IEEE: New York, NY, USA, 1983; Volume 2, pp. 1129–1139. [Google Scholar]
  52. Hatano, H.; Kanai, Y.; Ikegami, Y.; Fujii, T.; Saito, K. Ultrasonic levitation and positioning of samples. Jpn. J. Appl. Phys. 1982, 21 (Suppl. 3), 202–204. [Google Scholar] [CrossRef]
  53. Hyers, R.W. Computer-aided experiments in containerless processing of materials. In Solidification of Containerless Undercooled Melts; Herlach, D.M., Matson, D.M., Eds.; Wiley-VHC Verlag GmbH & Co. KGaA: Weinheim, Germany, 2011. [Google Scholar]
  54. Suryanarayana, P.V.R.; Bayazitoglu, Y. Surface tension and viscosity from damped free oscillations of viscous droplets. Int. J. Thermophys. 1991, 12, 137151. [Google Scholar] [CrossRef]
  55. Weber, J.K.R.; Rey, C.A.; Neuefeind, J.; Benmore, C.J. Acoustic levitator for structure measurements on low temperature liquid droplets. Rev. Sci. Instrum. 2009, 80, 083904. [Google Scholar] [CrossRef] [PubMed]
  56. Benmore, C.J.; Weber, J.K.R. Amorphization of molecular liquids of pharmaceutical drugs by acoustic levitation. Phys. Rev. X 2011, 1, 011004. [Google Scholar] [CrossRef]
  57. Benmore, C.J.; Weber, J.K.R.; Tailor, A.N.; Cherry, B.R.; Yarger, J.L.; Mou, Q.; Weber, W.; Neuefeind, J.; Byrn, S.R. Structural characterization and aging of glassy pharmaceuticals made using acoustic levitation. J. Pharm. Sci. 2013, 102, 1290–1300. [Google Scholar] [CrossRef] [PubMed]
  58. Weber, J.K.R.; Benmore, C.J.; Suthar, K.J.; Tamalonis, A.J.; Alderman, O.L.G.; Sendelbach, S.; Kondev, V.; Yarger, J.; Rey, C.A.; Byrn, S.R. Using containerless methods to develop amorphous pharmaceuticals. Biochim. Biophys. Acta 2017, 1861, 3686–3692. [Google Scholar] [CrossRef] [PubMed]
  59. Cristiglio, V.; Grillo, I.; Fomina, M.; Wien, F.; Shalaev, E.; Novikov, A.; Brassamin, S.; Réfrégiers, M.; Pérez, J.; Hennet, L. Combination of acoustic levitation with small angle scattering techniques and synchrotron radiation circular dichroism. Application to the study of protein solutions. Biochim. Biophys. Acta 2017, 1861, 3693–3699. [Google Scholar] [CrossRef] [PubMed]
Figure 1. The beamline Conical Nozzle Levitation (CNL) apparatus installed at the BL04B2 beamline at SPring-8. CCD: charge-coupled device.
Qubs 02 00005 g001
Figure 2. (a) Total structure factors S(Q) for l-ZrO2 at 2600–2800 °C together with S(Q) derived from a density functional theory (DFT)-molecular dynamics (MD) simulation at 2800 °C. Both the experimental and DFT-MD simulation data at 2800 °C are shifted upward by one unit for clarity. (b) Total correlation functions T(r) for l-ZrO2 at 2600–2800 °C [7].
Qubs 02 00005 g002
Figure 3. (a) Bhatia-Thornton number-number partial structure factor SNN(Q) for l-ZrO2 at 2800 °C derived from the DFT-MD simulation (bold black curve) [7] in comparison with those for l-Al2O3 at 2127 °C (solid red curve) [5] and l-SiO2 at 2100 °C (dotted blue curve) [10]. The momentum transfer Q was scaled by rAX (rAX is the first coordination distance between A and X in the real-space function) to eliminate the effect of the size of cations. (b) Coordination number distribution of oxygen around the cations in l-ZrO2 at 2800 °C [7], l-Al2O3 at 2127 °C [5] and l-SiO2 at 2100 °C [10]. (c) Polyhedral connections in l-ZrO2 at 2800 °C [7], l-Al2O3 at 2127 °C [5] and l-SiO2 at 2100 °C [10]. CS: corner sharing of oxygen; ES: edge sharing of oxygen; FS: face sharing of oxygen.
Qubs 02 00005 g003
Figure 4. Density of States (DOS) and its projections onto atomic orbitals for the higher valence bands and conduction band [7].
Qubs 02 00005 g004
Figure 5. Atomic configurations and schematic illustrations of (a) c-SiO2, (b) l-SiO2 and (c) l-ZrO2. The periodicity of the cage boundaries is highlighted by dashed lines and curves [7].
Qubs 02 00005 g005
Figure 6. Neutron (a) and X-ray (b) total structure factors S(Q) and (c) extended X-ray absorption fine structure (EXAFS) k3χ(k) data for 50CaO and 64CaO glasses synthesized by CNL technique. The EXAFS k3χ(k) data were obtained by back Fourier transformation (FT) of the first correlation peak in |FT|. Circles: experimental data; curve: RMC-DFT model [16].
Qubs 02 00005 g006
Figure 7. Distribution of –Al(Ca)–O–Al(Ca)–O–Al(Ca)– rings in 50CaO and 64CaO glasses for reverse Monte Carlo (RMC)-DFT models [16].
Qubs 02 00005 g007
Figure 8. Close-up visualizations of (a) highest occupied molecular orbital (HOMO) and (b) lowest unoccupied molecular orbital (LUMO) single-particle electron states in the 64CaO glass. The parameter h1 indicates the cavity (cage) occupied by the LUMO. Yellow and magenta represent the different signs of the wave-function nodes. (c) Simulation box and the electron spin density of the 64CaO glass with one oxygen removed at h2, i.e. with two additional electrons. (d) Cage structure around the spin density of one electron corresponding to the h2 cavity (close-up of (c)). Al: gray; Ca: green; O: red [16].
Qubs 02 00005 g008
Figure 9. Atomic configurations with cavities and cavity volume histograms for CaO–Al2O3 glasses.
Qubs 02 00005 g009
Figure 10. Conceptual drawing of electrostatic levitation method.
Qubs 02 00005 g010
Figure 11. Optical layout of an electrostatic levitation furnace (ELF) used at the Japan Aerospace Exploration Agency (JAXA). YAG: yttrium aluminum garnet
Qubs 02 00005 g011
Figure 12. Magnified image of a levitated molten metal sample whose diameter is around 1.6 mm. In order to obtain high contrast needed to determine the position of the sample edge, the sample is backlit using a UV lamp and the camera is equipped with filters to reject incandescent light from the hot sample.
Qubs 02 00005 g012
Figure 13. Sample oscillation detection for surface tension and viscosity measurements: (a) diameter sensing system and (b) decay of the signal of the oscillation following electrical excitation for a molten sample measured by the sensing system.
Qubs 02 00005 g013
Figure 14. Status of the thermophysical property measurements of metallic elements using an electrostatic levitation furnace in JAXA. In the periodic table, vertical extent of the elements corresponds to their melting temperature. Flags depict the status of measurements for each element.
Qubs 02 00005 g014
Figure 15. Measured viscosity of molten refractory metals versus temperature.
Qubs 02 00005 g015
Figure 16. Measured surface tension (a) and viscosity (b) of molten BaTiO3 versus temperature
Qubs 02 00005 g016
Figure 17. International Space Station electrostatic levitation furnace (ISS-ELF) main-body and sample cartridge.
Qubs 02 00005 g017
Figure 18. Details of the sample cartridge shown in Figure 17.
Qubs 02 00005 g018
Figure 19. Molten alumina sample levitated in the ISS-ELF.
Qubs 02 00005 g019
Figure 20. (a) Images of a relaxed and compressed drop modulated by cycling varying the acoustic levitation forces. (b) Plot of drop diameter vs time taken from images obtained using a Fastec IL3 camera. Image adapted from [58].
Qubs 02 00005 g020
Figure 21. FLIR A325 thermal images of two levitated samples. The top sample is Styrofoam, the bottom one is a drop of dichloromethane approximately five seconds after introduction. The temperature of the Styrofoam is ambient ~21 °C. The dichloromethane drop has cooled to ~−16 °C, approximately 37 °C below ambient temperature due to evaporative cooling. The blue and red triangles mark the low and high temperatures respectively measured in the selected area (Ar1 and 2) indicated by the boxes.
Qubs 02 00005 g021
Figure 22. Position of the principal leak in S(Q) as a function of log(time). The parameter tP marks the time at which the peak position plateaus and a viscous amorphous gel forms from the solution. The inset shows the X-ray intensity as a function of time during the early stages of the process where the main changes in structure occur. Data retrieved from [56].
Qubs 02 00005 g022
Figure 23. A drop of hydroxyapatite dissolved in phosphoric acid (H3PO4). The solution was acidic ~pH 2 when it was introduced. Ammonia was wafted over the sample to increase its pH to ~6. The change in pH resulted in precipitation of crystals in the solution. The cloudy appearance of the drop in the lower part of the image is due to the presence of a finely divided precipitate.
Qubs 02 00005 g023

