Article

Spatial Analysis of the Public Transport Accessibility for Modelling the Modal Split in the Context of Site Identification for Charging Infrastructure

Chair and Institute of Urban and Transport Planning, RWTH Aachen University, 52062 Aachen, Germany
*
Author to whom correspondence should be addressed.
Infrastructures 2018, 3(3), 21; https://doi.org/10.3390/infrastructures3030021
Submission received: 16 May 2018 / Revised: 18 June 2018 / Accepted: 29 June 2018 / Published: 4 July 2018
(This article belongs to the Special Issue Expanding Cities, Diminishing Space)

Abstract

:
The spread of charging infrastructure (CIS) for battery electric vehicles is crucial for coping with the increasing number of electric vehicles. Therefore, the selection of ideal (fast-) charging locations determines acceptance, utilization and, thus, the economic viability of a single site or the whole charging network. The methodology of the Integrated Model Approach STELLA (STELLA is the acronym for the German term “STandortfindungsmodell für ELektrische LAdeinfrastruktur”) for site identification of CIS uses reliable methods of traffic modeling such as the classic four-step traffic modeling in a new context to enable statements regarding the positioning of CIS. Because only (electric) motorized individual traffic is of importance for CIS, the share of trips is calculated by differentiating the modal split between various transport groups. To estimate the public transport share in the model approach STELLA there are several factors used. One aspect is the accessibility of stops, which can be determined with accessibility radii one the one hand, and with network analyses on the other hand. The methods have been evaluated for the region of Nuremberg. Depending on the spatial characteristics there is a difference of up to 60% between the two methods in the area covered by public transport. Therefore, the network analysis leads to a more accurate estimation of the public transport share. The modal split determination is then implemented in the model approach STELLA, which is currently developed for a planning area covering the entire territory of the Federal Republic of Germany.

Graphical Abstract

1. Introduction

A prerequisite for the spread of electromobility is the access to charging infrastructure (CIS). In addition to CIS located in private areas, which is how currently 92% of electro mobile road users use it [1], CIS positioned in public areas is not only important for public perception, but also for providing basic care and service in case of unplanned charging events. When entering the mass market, the current high proportion of private CIS can no longer be relied on. As a result, it is necessary to build publicly accessible charging points [2]. This is also enforced by the European directive 2014/94/EU [3], which demands a charging infrastructure network covering the Union [3]. The model approach STELLA is one method of determining the potential for the expected CIS utilization. For this, it is crucial to assign the estimated arising trips made by individuals according to trip generation and trip distribution as accurately as possible to the different transport modes. With a precise estimation of the public transport share, it is possible to draw indirect conclusions for the motorized individual traffic share, and hence electric vehicle users. The modal split of the trips can vary depending on the location and other accompanying circumstances, such as different transport offers. The results of the detailed modal split analysis for public transport can then be used in two ways: On the one hand, spatially differentiated public transport shares can be integrated into the model approach STELLA by means of specific analyzes of the public transport service. On the other hand, statements regarding the quality of service provided by public transport can also be derived on basis of these data.

2. Modeling Methodology STELLA

2.1. State of the Art for Site Identification of Public Charging Infrastructure

To handle the demand for public CIS [2,3] in a planned and reasonable way, it is necessary to identify suitable sites. This search for optimal CIS locations is analyzed in several research studies.
One kind of research contains methods that estimate demand for public CIS on a high spatial resolution, but only within a limited local scope like a single city or region. For example, Bernardo et al. [4] calculate the demand for fast charging infrastructure in the city of Barcelona on the basis of origin-destination trips with a discrete-choice model. Hardinghaus et al. [5] combine stakeholder consultations with simulations to deal with the site identification in the city of Berlin. Hawel and Hawel [6] perform an analysis of fast charging infrastructure along an axis on the German west coast/lower Elbe region. After identifying macroscopic areas for public CIS, they also implement a microscopic site evaluation. Lou et al. [7] study both the users demand and the position strategy for public CIS of suppliers. They apply their approach to the limited area of the district of San Pedro in Los Angeles, USA. In the JRC study [8], an allocation of charging infrastructure is performed only with freely available data for the city of Bolzano and for the surrounding road network in the region of Alto-Adige. All the above-mentioned studies apply their method only to limited areas.
In contrary, other research studies concentrate on identifying the site potential for charging infrastructure on large spatial scales like nationwide regions. Because the available data in this context is of a wide resolution, the studies estimate the general demand on the same resolution and, therefore, provide only a rough or even no location determination for public CIS. One example is the project Laden2020 [9]. In this study, the demand for public CIS is determined by researching the mobility behavior for both daily routines and long-distance travel. The covered region is the entire territory of the Federal Republic of Germany. Kleiner et al. [10] have a similar approach by simulating the nationwide demand for public CIS on the basis of vehicle and CIS specifications as well as spatially differentiated travel demand. The final estimation then has a spatial resolution of administrative districts (NUTS-3—about 400 districts for Germany). Colmenar-Santos et al. [11] perform a site identification for public CIS along highways in the whole of Spain.
Moreover, there are further research studies defining the demand for public CIS on the basis of potential users. Their approach is to identify the potential for public CIS usage by analyzing the development of electric vehicle users [12,13].

2.2. General Methodology of the Model Approach STELLA

The model approach STELLA quantifies the potential of public CIS in a large-scale observational space (entire Germany) and identifies locations sites on a high spatial resolution. It includes normal charging infrastructure (<22 kW), fast charging infrastructure (≥22 kW) and can even be extended to high-power charging infrastructure (350 kW) [3]. By refining the classic four-steps of traffic modelling it is not only possible to identify location sites but also to quantify the charging events. Therefore, STELLA provides simultaneously a high spatial resolution as well as a large-scale nationwide application.
In this model approach, different indicator groups are compiled, on the one hand, for the description, and on the other hand, for the spatial localization of the daily mobility of the population in a specialized, nationwide traffic model. The user behavior, the distribution of vehicles, the existing public useable CIS as well as the spatial structures and the existing transport infrastructure form the basis for further calculation steps. Likewise, the modular structure of the model makes it possible to integrate further basic conditions, such as different forecast years or political objectives [14].
The data base is both: open data content and data from commercial providers. For an actual overview of the used data in the model approach STELLA see Figure 1 (state of 31 January 2018).
One basis for the model approach STELLA is the calculation of the generated traffic volume for each small-scale urban quarter [17], which is formed depending on the 8-digit postcode level (PLZ8). The PLZ8 divides Germany into approximately 82,000 urban districts and represents a differentiated subdivision of the 5-digit postcodes into homogenous territorial units containing, on average, about 500 households each [17]. To determine the volume of the generated traffic in each urban quarter, the FGSV method from 2010 is used, which is, however, modified in the modal split calculation for the model approach STELLA. Within the FGSV method, the traffic volume is determined in a first step depending on the type of urban quarter investigated (residential, mixed and commercial zone) [29]. This is divided further by taking into account various influencing factors of the different traffic modes in terms of different modal split shares. To be able to apply this approach, which is individually interpretable for single areas (<50 ha), to a nationwide consideration (average built-up area size 29.3 ha), additional datasets and universally interpretable indicators have to be developed and integrated. Then the modal split of electric vehicles is determined. For this, it is necessary to calculate the motorized individual share first, which can be specified in more detail if there is an estimation of the modal share of the other transport modes like public transport. When determining the public transport shares for each of the approximately 82,000 urban quarters, the large-scale spatial structure as well as public transport related attributes like the stop density and characteristics of the public transport service quality in combination with the local traffic interlinkages can serve as guidelines. The results of the modified method for calculating the trip generation including the trip distribution of the traffic volume into the different traffic modes are incorporated directly into the model STELLA to quantify the need for public CIS.

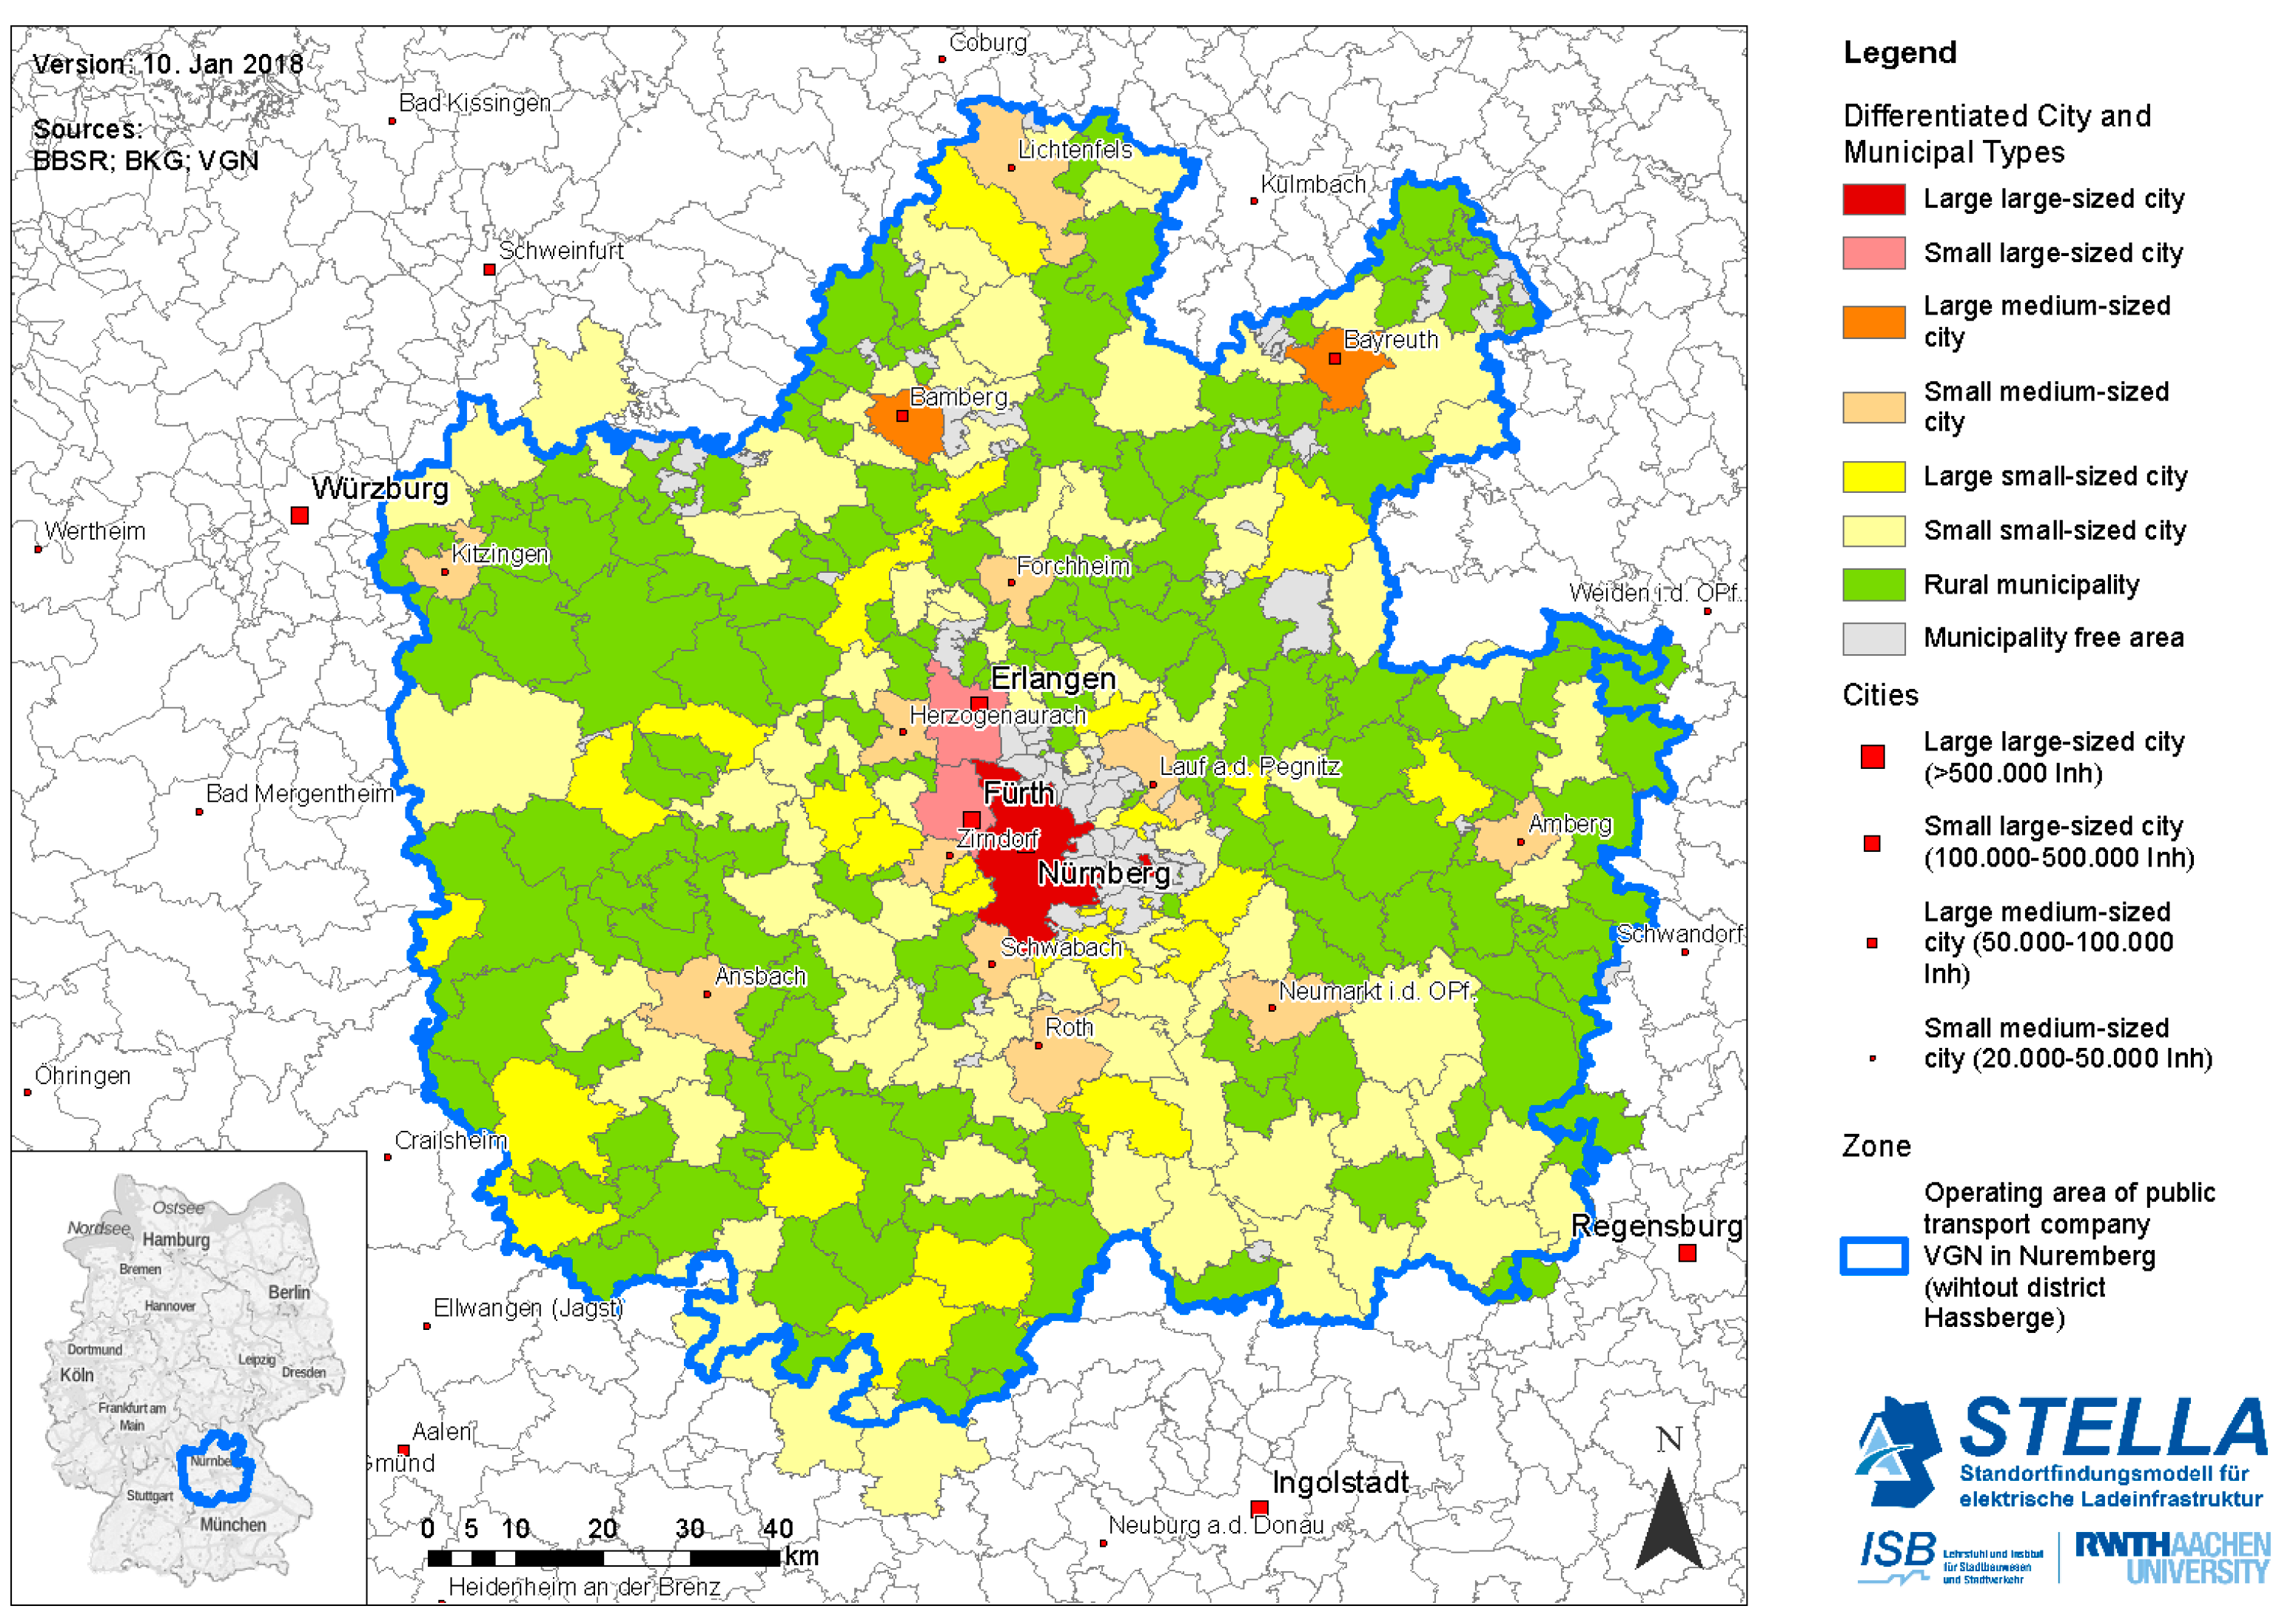
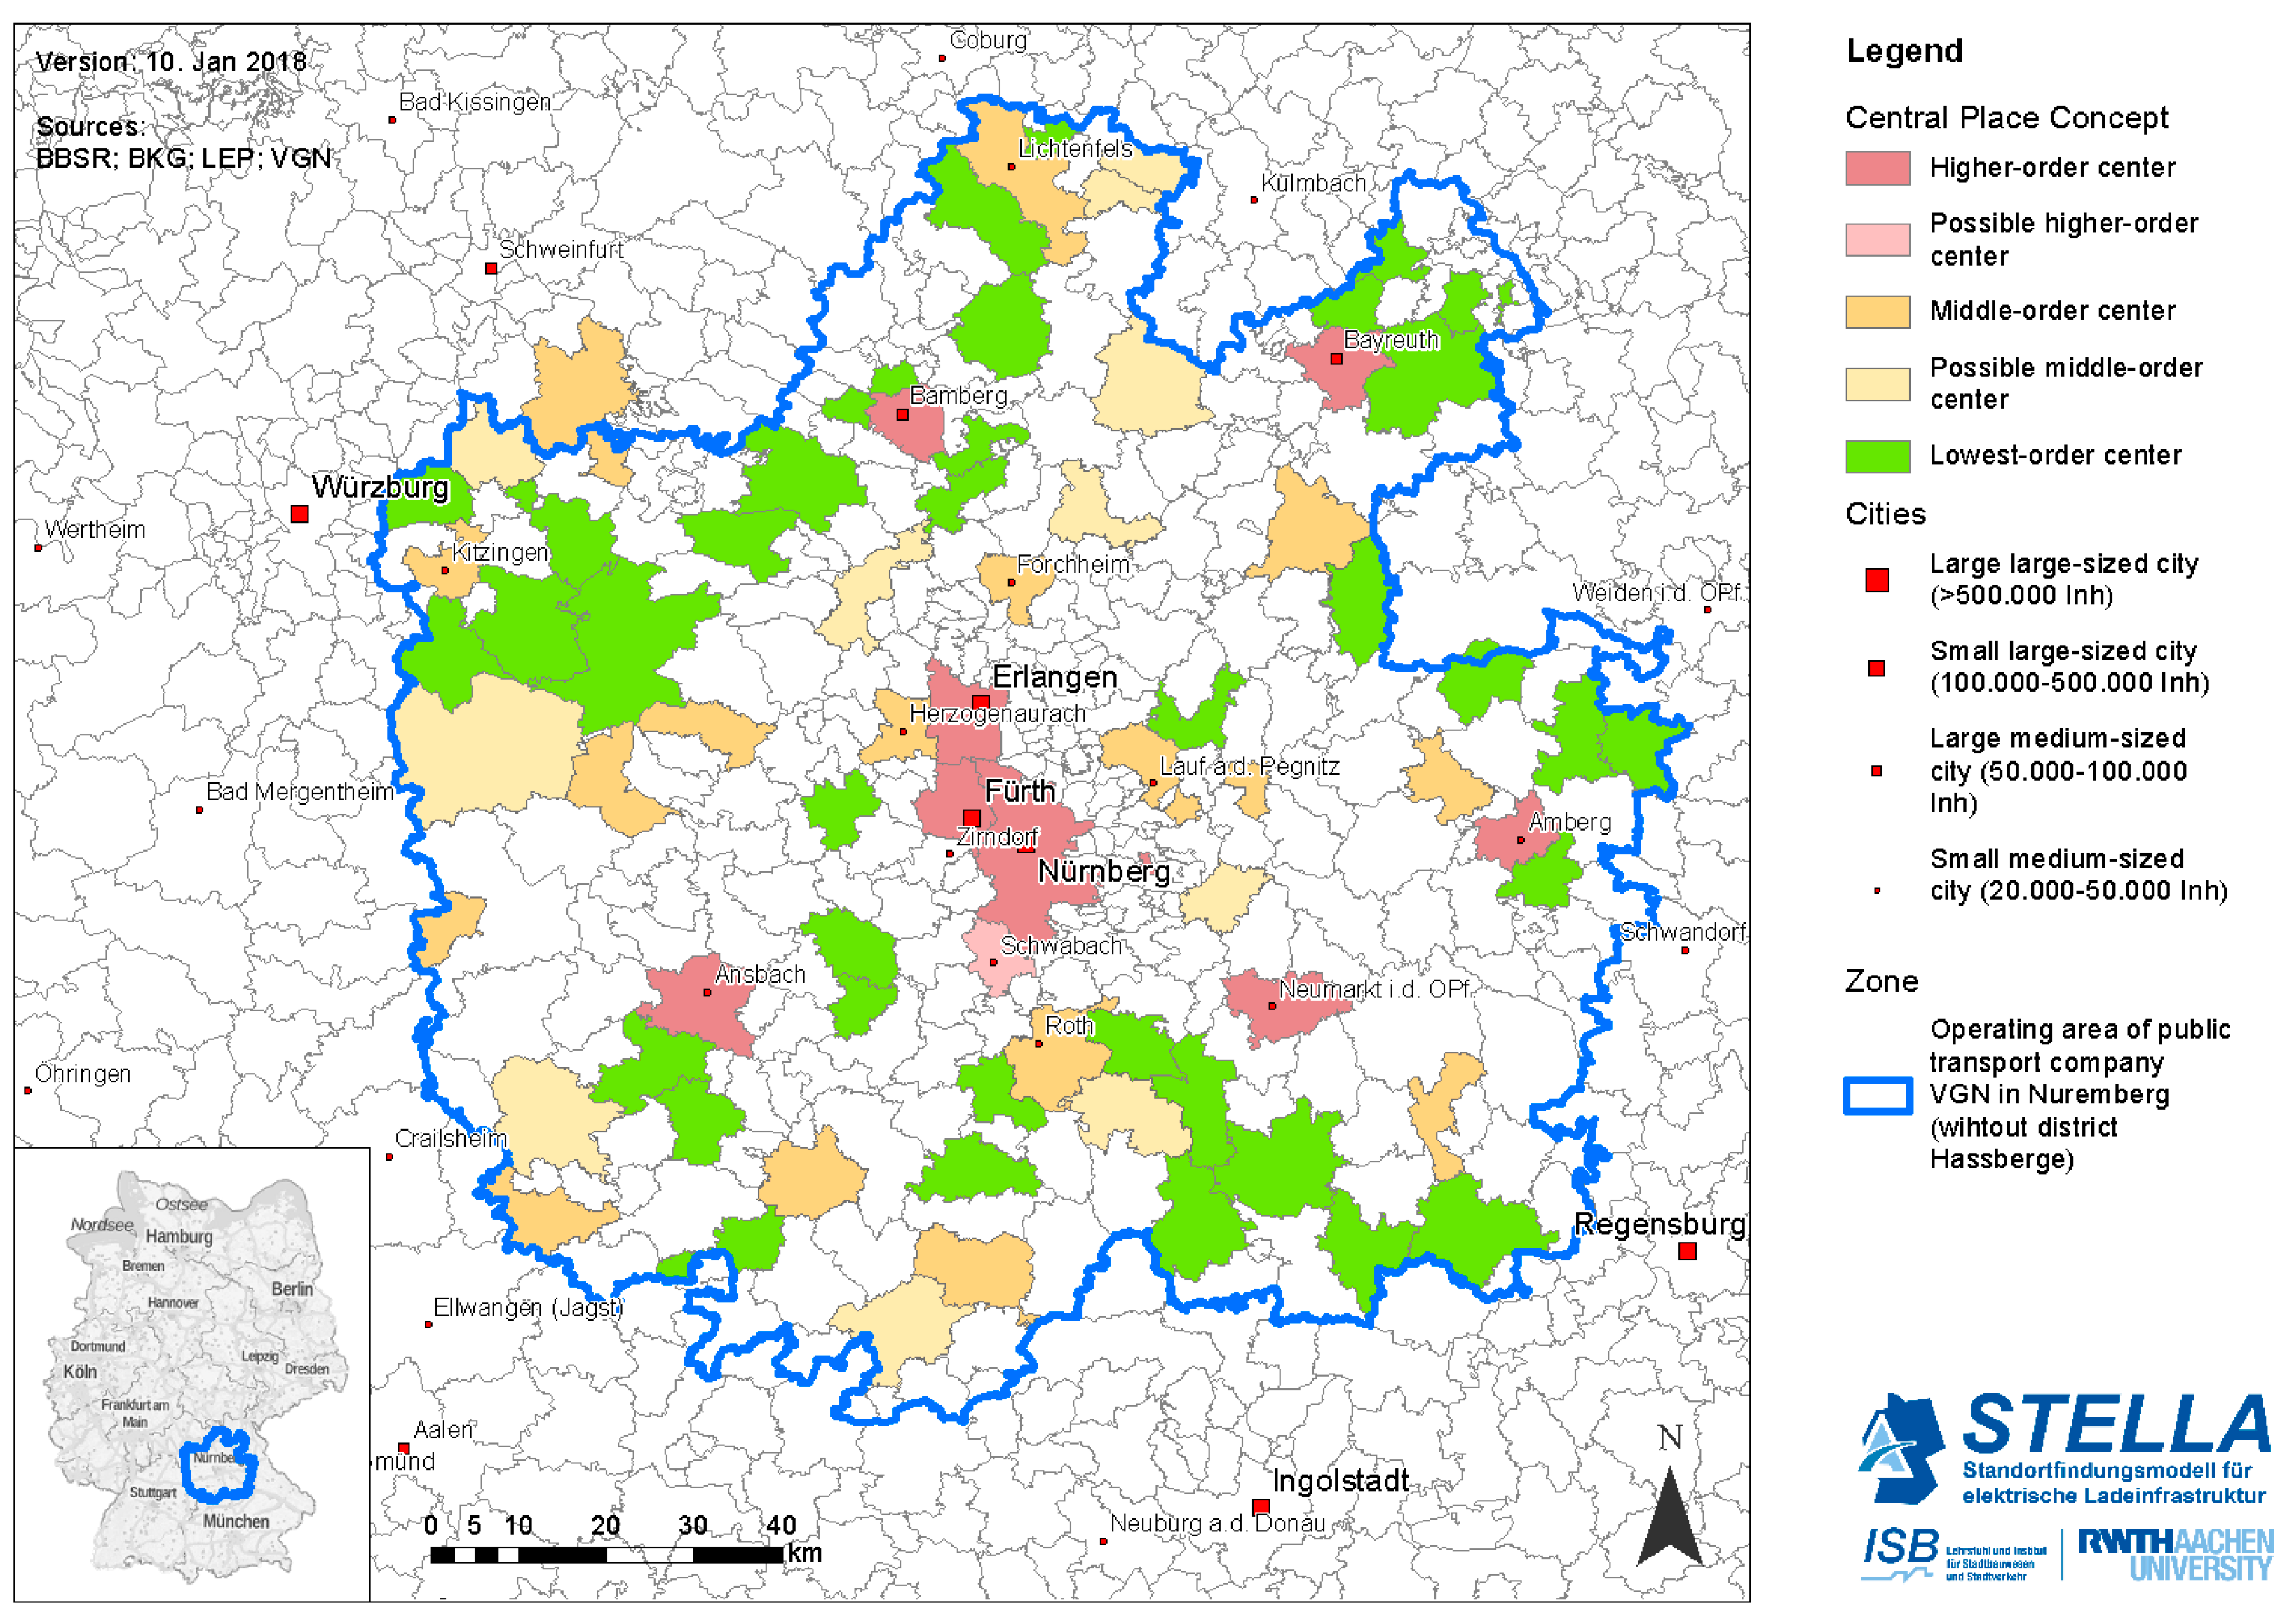
2.3. Spatial Analysis

For the nationwide spatial localization of the potential for public electrical CIS, it is necessary to define and characterize the space to consider different prerequisites in the spatial structure. This spatial delimitation is possible on various levels of resolution, since, depending on the level, different characterizing attributes can be added to the individual areas, for example, as a link to other databases. The following sections provide a brief overview of the different distinctions of the regions used in STELLA. The distinction that is relevant for the spatial differentiation of the public transport share is also presented.
The administrative division of Germany, for example, into counties, municipalities associations, municipalities or postal codes, can serve as a large-scale differentiation [30]. For the investigation of the potential for public electrical CIS, the purely administrative distinction, however, is not sufficient, since it provides no attributes for the structure of the space. Therefore, a characterization of the communities based on non-administrative characteristics such as centrality, densification or commuter relations is necessary [30]. The Federal Institute for Research on Building, Urban Affairs and Spatial Development (BBSR) within the Federal Office for Building and Regional Planning (BBR) provides relevant area types, so called “city and municipal types”, as shown in Figure 2 and Table 1 [16]. These differentiate the municipalities according to their size or their population as well as their respective central local function in the urban and rural municipality.
This classification provides a baseline for the spatial analysis but cannot cover all characteristics [15]. Therefore, a further delimitation is introduced, which extends the characterization of the municipalities by the classification into “metropolitan regions” at the level of municipal associations. This includes a distinction between the center of a metropolitan region, the supplementary area as well as a closer and further commuter connection space by using commuter movements in particular of employees paying social insurance contributions between their home and their workplace as a basis. The metropolitan regions thereby correspond to the territorial classification of the “urban-rural-regions” [16].
Especially in the context of the definition of the public transport modal split (see Section 3.2), the “Central Places Concept” (German: Zentrale Orte Konzept—ZOK) [16] represents another important categorization. The ZOK is a normative construct for the assignment of services of general interest to cities and municipalities [32] and thus provides indications of the existing or planned infrastructure and institutional equipment of a region [16]. In general, a distinction is made between higher-order centers (supply of specialized higher needs), middle-order centers (supply of upper-level needs) and lowest-/basic-/small-order centers (supply of basic needs), for example see Figure 3. Since the assignment of individual regions to the categories is a task for the federate state planning [16], there are differences in the definitions between federate states and hence differences in the allocation. Inter alia, this classification is taken into account for the estimation of the public transport modal split in order to be able to link it to other tested considerations and methods of analysis.
Another spatially detailed demarcation is provided on the level of urban quarters (see Section 2.2) for which the model approach STELLA calculates the potential for CIS. Each of these urban quarters is classified by linking the large-scale area types described above with the residential and commercial areas, the number of inhabitants, households and employees as well as the building areas in the residential, mixed and commercial zone [29]. For these derived types of urban quarters, a further differentiation is needed due to the predominant building typology in different urban space types [29,34]. A distinction is made between small, detached individual buildings, row, line and block buildings, large-scale housing developments and building structures with a village character. This categorization serves as a baseline for the differentiated determination of the spatial location of an urban quarter within the ZOK, which is in turn linked to the differentiation of the accessibility categories for public transport stops according to Table 2.

3. Methodology for Estimating the Public Transport Model Split in the Context of Site Identification for Charging Infrastructure

An important parameter for the modeling of public CIS is the electrically performed motorized individual traffic. With the help of assumptions as well as specific analyses of electric driving behavior and electric traffic volume, this share can be derived from the total traffic volume. The motorized individual traffic can, in turn, be determined in the step of the trip distribution. This step differentiates the total traffic volume according to the trip generation between the transport modes of the non-motorized induvial traffic (NMIT), the motorized individual traffic (MIT) as of well as of public passenger transport (PT). There are various models for this differentiation, such as the four-step algorithm or the FGSV 2010 [39], an adjusted version of which will be applied in the following. Because the electric motorized individual traffic as a parameter is of immense importance for the model approach STELLA, it is essential to be able to estimate it as accurately as possible, which is why it is also important to estimate the total motorized traffic precisely. This can be done in the step of the trip distribution either directly or indirectly: A direct determination would mean concretizing assumptions on the MIT share in the model algorithm. An indirect concretization implies a more detailed estimation of the further transport modes NMIT and PT share to concretize the MIT share. In this paper, the indirect concretization of the MIT over the determination of the PT share is applied on small spatial scale.

3.1. Trip Generation

The purpose of the trip generation is to generate undirected trip demand for each unit considered (here: urban quarter). The total number of the on origin-side departing and on destination-side arriving trips for the entire planning area (PA) (in the model STELLA all over Germany) is considered. To calculate the departing and arriving traffic of the individual cells of the PA, a differentiated structural class approach was used whose central input variables consist of various structural data (e.g., inhabitants and companies differentiated according to economic groups and employee classes). The procedure is primarily based on the guidelines for estimating traffic volume published by the FGSV in 2010.

3.2. Methodology for Specifying the Determination of Public Transport Modal Split

According to the method of the FGSV from 2010, after estimating the traffic volume, the differentiation between the groups of NMIT, MIT and PT is made. For the estimation of the public transport share, the method suggests different values, which depend, inter alia, on the traffic-generating groups (residents, visitors, employees), the city and municipal types, the (non) integrated location of the sites, characteristics of the traffic system or the accessibility of the access points. However, these values sometimes have large spans (“5–30%” [39] (Section 3.3.8)), are not considered separately from the NMIT (“public transport and NMIT share 50–90%” [39] (Section 3.3.8)) or use vague terms to describe the public transport service (“attractive public transport service” [39] (Section 3.3.8)), so that the estimation of the public transport share can be influenced by subjective assessments. By analyzing and determining various measurable indicators that influence the share of public transport in a residential district, the estimation of it can be objectified and systemized. Thus, when considering a large study area such as the Federal Republic of Germany in the model STELLA, it is possible to develop an algorithm for approximating the spatially differentiated public transport share. By specifying the public transport share, the IT share is also specified indirectly in the model which serves as the basis for the derivation of the electric trips, which, in turn, represent the basis of the potential determination for electrical CIS.
A review of existing literature on the topic shows that a great number of people and institutions already deal with the definition of quality criteria for public transport, which can be used as a guideline for the selection and definition of indicators for the development of the algorithm. Not only at the national level but also at European level with the DIN EN 13816 [40], a device was created that deals, inter alia, with the description of quality criteria for public transport differentiated into eight categories. However, only potential criteria are presented and no limits or guidelines are attached. On the contrary, Schwarze [41] deals in his work in detail with the concept of accessibility, different definitions, indicators and possible guidelines for it. Thus, he differentiates, based on an evaluation of North Rhine-Westphalian local transport plans, for example, between planning accessibility indicators and practically used accessibility indicators. From the multitude of quality criteria for public transport, which could be identified in our literary research, this study focusses on the accessibility of stops in a specific space. The importance of this indicator in the context of concretizing the determination of the public transport modal split is explained in the following sections.

3.2.1. Accessibility of Stops as a Quality Criterion

To begin with a simplified method, the detailed estimation of the public transport share is performed by looking only at the accessibility of public transport. The indicator of accessibility or, in other terms, the catchment area of stops serves as an indication of the quality of accessibility of public transport. For this aspect, different recommendations can be found in the literature. The VÖV [38] differentiates in its recommendation for an appropriate standard of public transport service between the transport mode groups metro and suburban train and local passenger rail traffic and bus and tram. Depending on a subdivision of the Central Places Concept regarding the spatial location as relative to the core area, distances between 300 m and 1200 m are considered to be adequate. About 20 years later, 40 distances between 300 m and 1000 m are recommended by the VDV [37] as reasonable beelines for the same transport groups, depending on the frequency of use within the ZOK. The lower maximum distances indicate a higher demanded standard of development over the years. In addition to recommendations at the federal level, the Bavarian State Ministry for Economic Affairs, Infrastructure, Transport and Technology [41] offers specified information on the catchment areas of stops in its guidelines on urban transport planning in Bavaria. In this case, a distinction is made between guide values (between 300 m and 1500 m) and upper limits (between 400 m and 1800 m) per group of vehicles. The FGSV [35] uses a slightly different approach to public transport accessibility in their planning aids for urban land-use planning, which is due to the fact that no recommendation but rather an assessment scheme for individual locations is presented. Therefore, various qualitative grades concerning the distance to stops are listed. In contrast to the above-mentioned approaches, in this approach, the transport modes are divided into bus and local rail transport.
Based on these four sources, the quality levels (QL) shown in Table 2 and Table 3 were developed. The QL 1 is based on the recommendations of the VÖV, the VDV and the benchmarks of the Bavarian Ministry of State, which differ only in individual categories. The basis for the QL 2 are limits of the Bavarian urban transport planning, while taking into account the limits of the upper three categories of the FGSV at the same time. Another survey of eleven Hessian local transport plans that was carried out by Winter [42] has a similar scale of assessment of station access levels to the other sources. Deviations occur in the Hessian local traffic plans, in particular for the accessibility for metro/suburban train and the local passenger rail traffic, for which the analysis itself already contains a large span of values.
In addition to the recommendations for the distances to stops, which usually refer to beelines, there are sources in the literature that set a maximum for walking distances, so the actual covered path. Both Boesch [43] and UVEK [44] suggest 600 m as the maximum walking distance to bus or tram stops and 1500 m to train stops. However, since no spatial differentiation is listed here, it can be assumed that, like in the other sources, certain variations in the recommended distances are possible for core and peripheral zones. These limits are also taken into account when defining the quality levels. A significant transgression of up to 500% above the maximum values of the evaluation scheme of the FGSV [35] is excluded for the development of the QL, since the actual use of stops at a distance of 3 km or a walking time of about 51 min is questionable. In this case, the conversion from the spatial distance to the time required for walking it is calculated using the average speed of 1.17 m/s (70 m/min) that is used in both the recommendations of the VÖV [38] and the VDV [37]. As Weidmann already pointed out in 1992, a variety of information on the pedestrian speed can be found in the literature, but in some cases, these differ significantly. The speed used in the recommendations is slightly below the average speed of 1.34 m/s that was suggested by Weidmann [45]. However, the speed can be influenced by characteristics of the pedestrian, accompanying circumstances of the movement as well as characteristics of the infrastructure [45]. The factor of 1.2 used by the VDV is also used for the required detour factor for the generalized approximation of the real walking distance based on the beeline distance, even though differences due to, for example, different trip purposes are possible [44]. A conversion of the quality levels into walking time, as presented in Table 3, shows that in QL 1 the 5 to 10 min recommended in the literature for stops of different modes of transport [42] were predominantly met. For the QL 2, this is also partially true for the core areas. Exceptions are peripheral areas of the lowest-order centers as well as rural municipalities.
Based on the defined quality levels of the accessibility of public transport stops, a spatial analysis can be carried out. Depending on the proportion of covered settlement area per quality level, the modal split share of public transport can then be influenced in the FGSV traffic estimation method. However, as already mentioned above, accessibility is only one of many indicators influencing public transport. In the final model approach STELLA, a more complex estimation method will be implemented including indicators for the public transport like the frequency of the service, the number of different public transport services and routes. For now, in the following parts of this paper, only the accessibility of public transport stops is analyzed in more detail.

3.2.2. Evaluation of the Quality Criterion of Accessibility for the Model Region VGN

As a model region for the first analyzes of public transport, the network of the metropolitan area of Nuremberg was chosen. On the one hand, this is due to the spatial structure and the existing public transport service. On the other hand, all pieces of information about stops and timetables are available online for free use [31]. The interconnected area of the Verkehrsverbund Großraum Nürnberg (VGN) contains all categories of city and municipal types, the ZOK and the different urban space types (see Section 2.2) as well as the different modes of transport: bus, tram, metro, suburban train and regional train.
The location-specific indicator of public transport stops is the focus of these studies. The quality is assessed based on the proportion of settlement area covered by public transport in comparison to the total settlement area per urban quarter. In accordance with the categories listed in Table 2, each urban district is assigned to a category of the ZOK in an upstream analysis, so that, depending on the type of public transport stop (bus and tram or metro and suburban train and local passenger rail traffic) and the QL (1 and 2), reachability distances can be allocated correspondingly.
The accessibility analysis is carried out using two different methodological approaches. The first method considers distances as accessibility radii (beeline), so that circles with corresponding radii are drawn around each stop. Subsequently, for each urban quarter, the settlement areas covered by the various QL are set in relation to the total settlement area. This method has the advantage that it is easy to implement and gives a homogeneous result. The disadvantage of this is, however, that the radii depict beelines, but the areas covered by these beelines cannot necessarily be reached with the existing network within the estimated ranges. The consideration of possible detour factor can only be applied generally, but the local road and path networks differ significantly in their directness. For this reason, an accessibility analysis of the pedestrian-friendly road and path network [18] is carried out additionally as a second method. Here, the stops are initially projected onto the next spatial road connection before the reachability distances are routed on the road and path network. In this way, it is possible to determine the areas that can be reached and thus the area of settlement actually covered. A schematic representation in Figure 4 illustrates these different results of the two methods.
The evaluation of the covered settlement areas per QL for each method is presented in Table 4 and Table 5. According to the information provided by the VDV [37] and other sources, “an area is considered to be developed if 80% of these people live or work in the catchment areas of stops (…)”. For reasons of simplicity, for now, the assumption is made that the inhabitants would be evenly distributed over the area, which would then be considered as developed when 80% of the settlement area is covered. Moreover, at this point, the urban quarter types business, office, administrative and industrial area are excluded. This typing requires a more detailed consideration, as a qualitative assessment of the area is not always useful. In the case of large-scale commercial enterprises, it is not the entire area that has to be reached by a public transport stop but the relevant access points. A pure area-based analysis would therefore adversely affect the results.
The analysis of the other residential district types (excluding the previously mentioned) using the method of accessibility radii clearly shows that the coverage of areas with stops of the transport system bus or tram within the VGN operating area is fulfilled almost everywhere. In contrast, the availability of stops for rail-bound public transport does not meet the VDV limit of area coverage in any of the spatial categories.
A different result can be seen in the analysis of the urban quarter types using the second, network-related method. In this case, it is noticeable that, in terms of the accessibility of bus and tram stops in any of the spatial categories, the complete coverage according to the VDV definition in QL 1 is not achieved. In the QL 2, accessibility decreases as the ZOK and the distance to the core areas increase. Also, the coverage of the settlement area by stops of the local passenger rail traffic is significantly lower or partly no longer available in comparison to the analysis using accessibility radii.
This confirms the previously established hypothesis that the accessibility radii cover a larger area than the network analysis. The differences in the proportions of the covered area amounts to spans between 6% and almost 60%. It is noticeable that the difference in the QL 2 is smaller than in the QL 1. This can possibly be explained by the fact that the higher distances cover a larger share of the settlement area altogether. Likewise, it is also possible that the accessible areas often have a “flatter” and “rounder” shape due to the larger footpath distance than small distances, since, for example, cross connections between two axes that lead straight away from the stop can also be reached and the area is therefore covered. Figure 4 shows that the accessibility of the areas depends on the shape of the roads or the networks. Depending on the network, covered areas form an almost “linear” area along an axis (Figure 4, left example) or become “flatter” and “rounder” (Figure 4, right example) and thus get more similar to the analysis results of the accessibility radii. This comparison exemplifies that the choice of the method of analysis is of particular importance for the evaluation of public transport services. Due to the nationwide available network including the consideration of special routes for pedestrians, further analyzes are carried out by means of network analyzes and thus by means of routed distances.
These results serve as a first indicator to influence the public transport modal split share. If there is no accessibility in respective areas, public transport as an alternative to the individual traffic is only of secondary importance. However, once settlement coverage is established, further analyzes of the supply may increase the importance of public transport, which in turn becomes apparent in the modal split share and thus influences the FGSV traffic estimation process. Further indicators that can influence the public transport share are currently developed. In addition to criteria of traffic development and the transport service, these also include properties of the potential user groups, such as the socio-demographic or socio-economic status. Further research is aimed at a review of the calculated impact on the modal split based on surveys and passenger numbers regarding the actual number of trips in public transport.

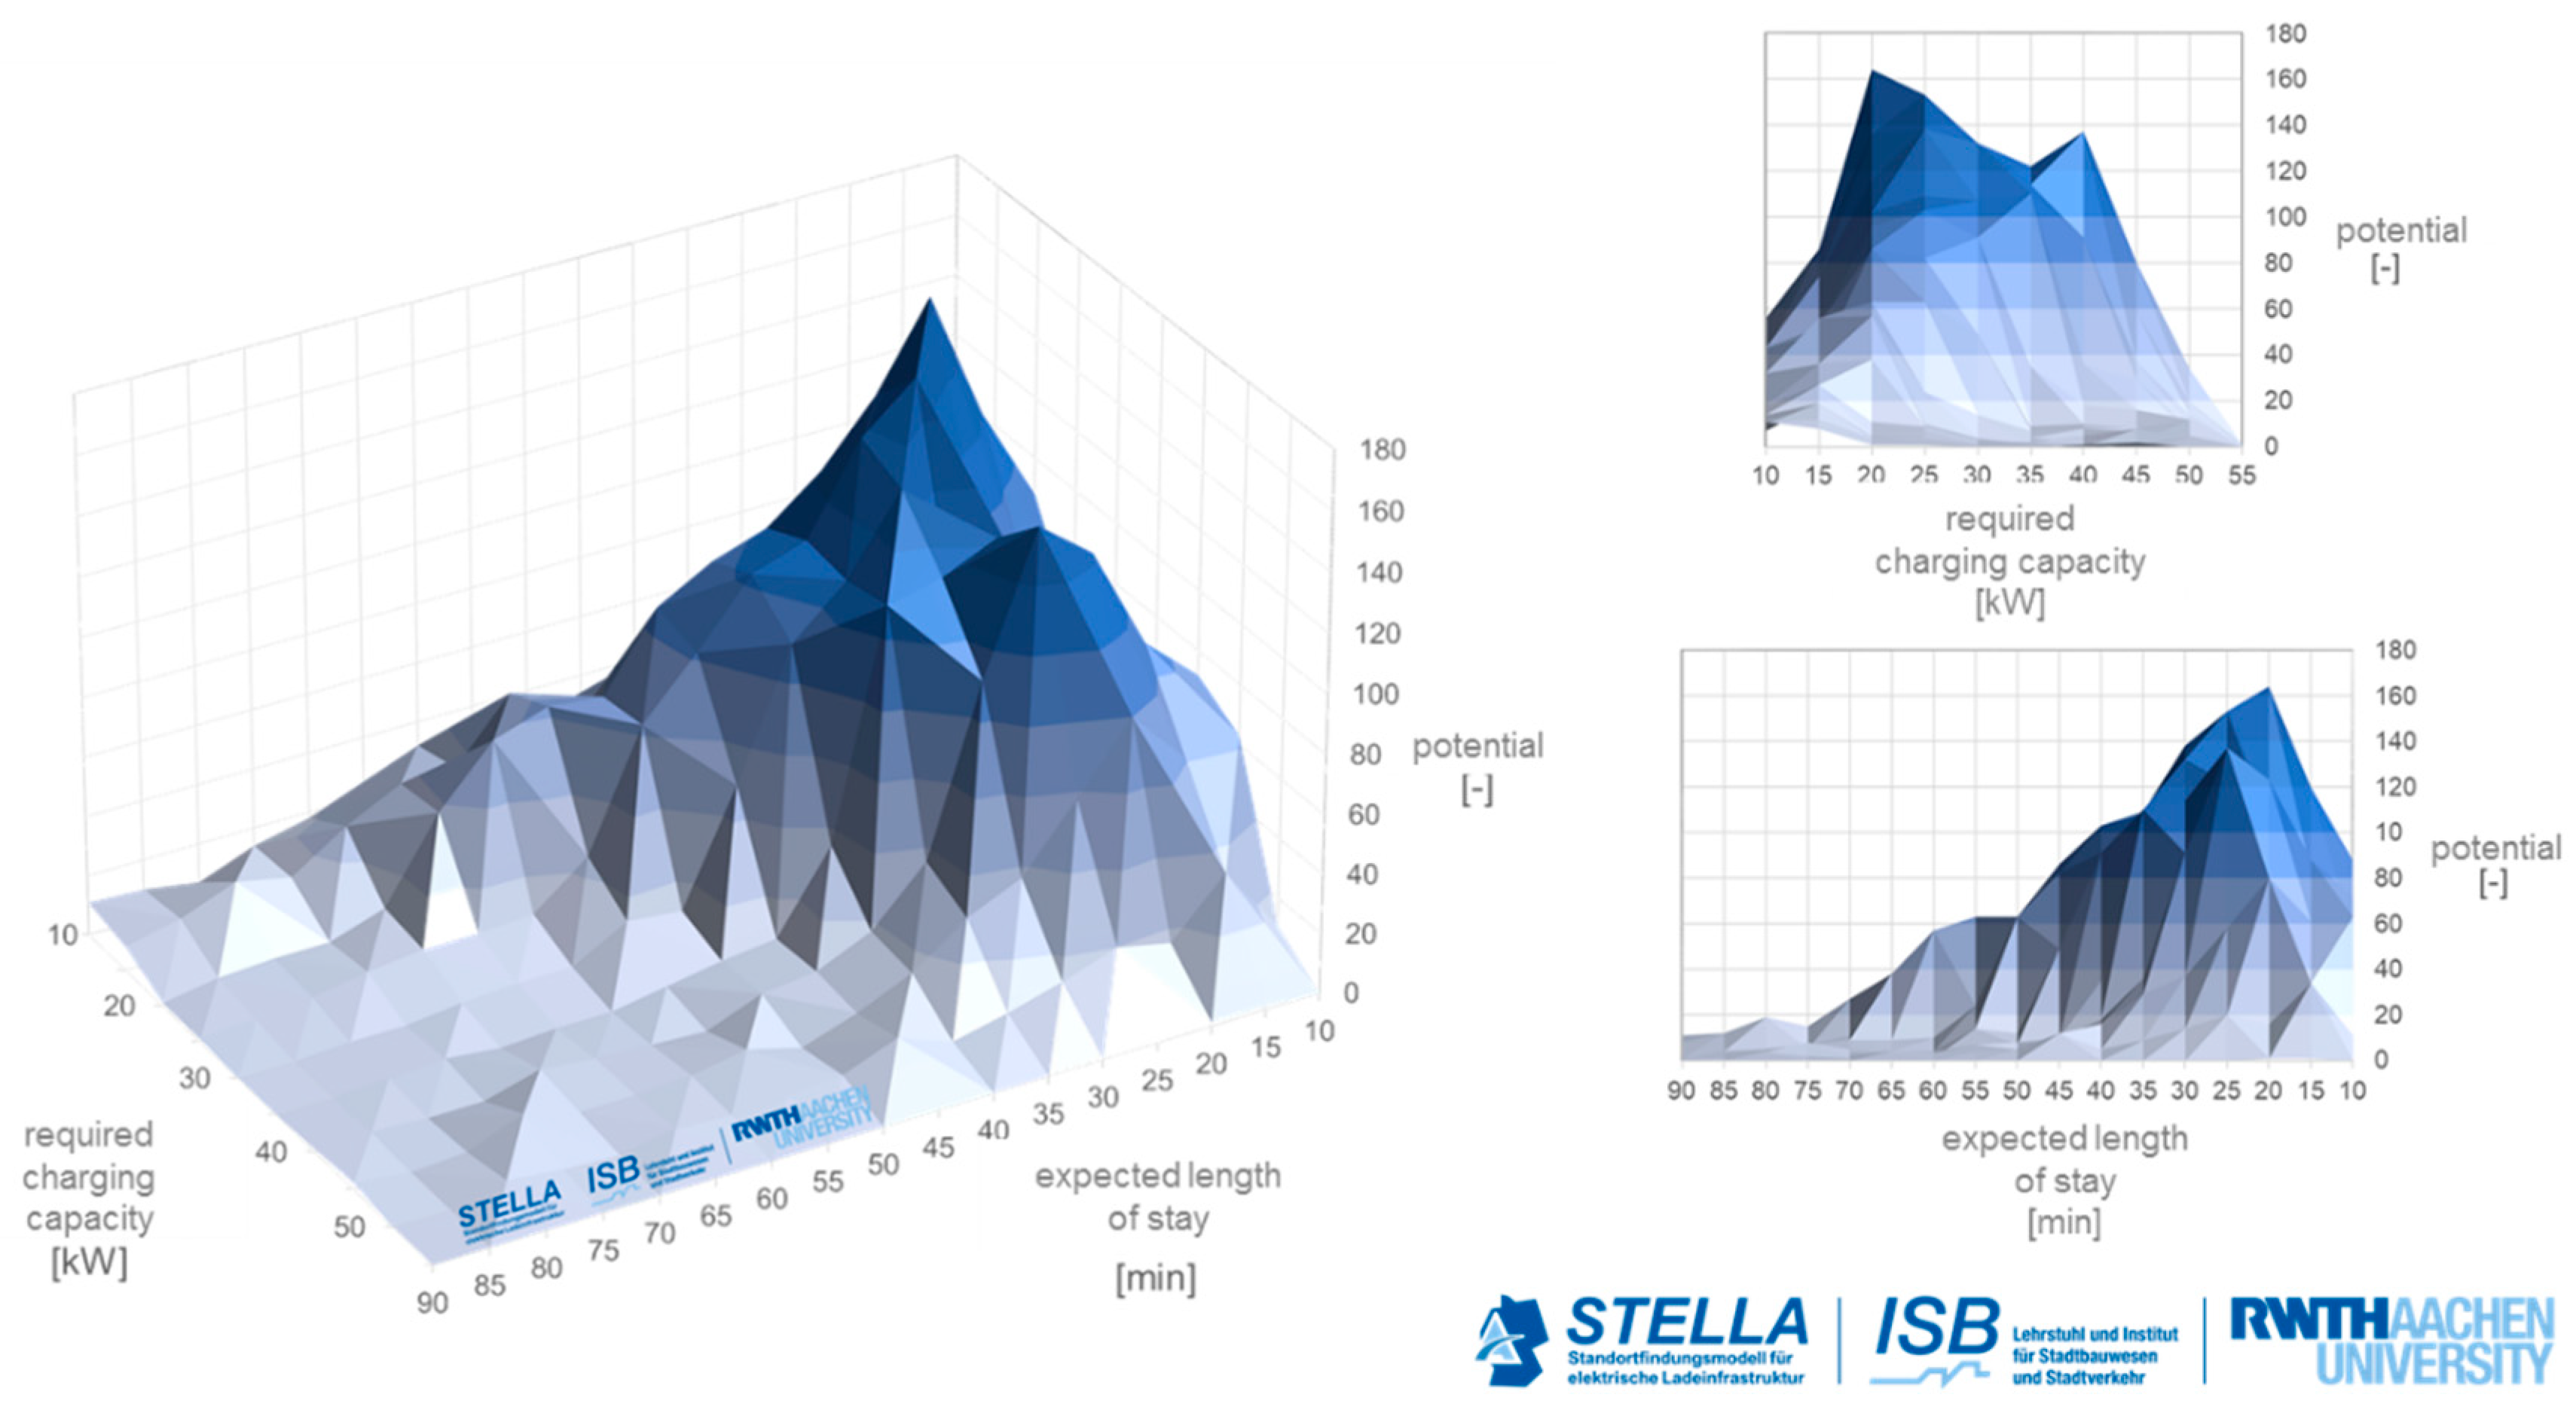
4. Model Results of STELLA

The presented spatial analysis of the public transport modal split estimation is included in the calculation of the traffic volume of the model approach STELLA. For the site identification for charging infrastructure the share of electric vehicle traffic is necessary. This method supports a more precise estimation of the electric vehicle traffic share by determining the share of public transport which in return leads to an improved estimation the share of motorized individual traffic. One overall modeling result of this approach shows the potential of the expected charges as a function of required charging power and expected length of stay for each urban quarter of the entire planning area “Germany” (e.g., see Figure 5). This result can be reduced to a model-internally comparable rank and then sorted accordingly. An iterative calculation, currently under development, can determine the order and the required amount of CIS in the planning area “Germany”. The iteration can be limited by variable termination criteria for area coverage and demand.

5. Conclusions

The resulting site selection model for electric CIS STELLA forms a tool with broad application possibilities in the planning steps of locating, planning and evaluating single existing or future locations or entire location systems for CIS at the urban quarter level. The main target group for the usage and interpretation of the model results as well as for the targeted use of the wide range of indicators and their parameterization are specialist planners. Through workshops and, if necessary, additional documentation supplemented by examples of interpretation, even a larger group of people could be able to use the tool for planning processes.
Due to the modular structure of the model, it is possible to transfer the method to other regions, countries or fuel strategies [2]. For example, to analyse the charging technology of hydrogen, the input data regarding the existing charging infrastructure or the new hydrogen vehicle range has to be changed. As a result, the potential for hydrogen charging infrastructure for each urban quarter is determined. In the same way it is possible to change regional data like the network or sociodemographic data and get results for other countries than Germany. Furthermore, it is possible to represent different scenarios (e.g. political priorities in the support strategy) and their influence on the potential for charging infrastructure requirements by weighting individual indicators.

Author Contributions

Waldemar Brost developed the structure of the model approach STELLA as a part of his dissertation. Teresa Funke contributed the analysis approaches of the public transport. Michael Lembach performed the calculation of accessibility radii and the network analysis.

Funding

The model approach STELLA was developed as a part of financially funded projects SLAM [25] and HansE [26] and through own research of the Chair and Institute of Urban and Transport Planning.
The project “SLAM—Fast-charging network for axes and metropolises” started in April 2014 and will run until February 2019. The Federal Ministry for Economic Affairs and Energy (BMWi) supports the project and thus the development of a national fast-charging network with almost 20.6 million Euros. The tasks of this project include the development of operator and business models for fast charging infrastructure, work out on criteria for optimal locations and setting up a research charging network.
The project is a cooperation between the BMWi, business partners (BMW Group, Daimler, DG Verlag, EnBW, Porsche, VW) and scientists (RWTH Aachen University, University of Stuttgart). The project “HansE—Creating a charging infrastructure adapted to traffic streams in the metropolitan area of Hamburg” started in March 2015 and will run until September 2018. It aims to systematically create a demand-based charging infrastructure in the metropolitan area of Hamburg with a target of 50 charging stations, mostly normal charging ones. This project is funded by the Federal Ministry of Transport and Digital Infrastructure (BMVI) and a cooperation between (local) business partners (hySOLUTION GmbH, E.ON Technologies GmbH, Landkreis Harburg, Metropolregion Hamburg) and the RWTH Aachen University.

Conflicts of Interest

The authors declare no conflicts of interest.

References

  1. Trommer, S.; Jarass, J.; Kolarova, V. Early adopters of electric vehicles in Germany unveiled. World Electr. Veh. J. 2015, 7, 722–732. [Google Scholar] [CrossRef] [Green Version]
  2. Bundesministerium für Verkehr und digitale Infrastruktur (BMVI). Nationaler Strategierahmen über den Aufbau der Infrastruktur für alternative Kraftstoffe; Bundesministerium für Verkehr und digitale Infrastruktur (BMVI): Berlin, Germany, 2016; Available online: https://www.bmvi.de/SharedDocs/DE/Anlage/MKS/mks-nationaler-strategierahmen-afid.pdf?__blob=publicationFile (accessed on 12 June 2018).
  3. EU. Directive 2014/94/EU of the European Parliament and of the Council. 2014. Available online: https://eur-lex.europa.eu/legal-content/EN/TXT/?uri=celex%3A32014L0094 (accessed on 13 June 2018).
  4. Bernardo, V.; Borrell, J.-R.; Perdiguero, J. Fast Charging Stations: Network Planning vs. Free Entry; cemfi: Madrid, Spain, 2013; Available online: https://editorialexpress.com/cgi-bin/conference/download.cgi?db_name=JEI2013&paper_id=44 (accessed on 13 June 2018).
  5. Hardinghaus, M.; Blümel, H.; Seidel, C. Charging infrastructure implementation for EVs—The case of Berlin. Transp. Res. Procedia 2016, 14, 2594–2603. [Google Scholar] [CrossRef]
  6. Hawel, B.W.; Hawel, J. Schnellladenetz Westküste/Unterelbe; Regionale Kooperation A23/B5, Machbarkeitsstudie; Regionalmanagement Regionale Kooperation Westküste, Projketgesellschaft Norderelbe mbH: Itzehoe, Germany, 2015; Available online: http://www.xn--rk-westkste-0hb.de/fileadmin/Redakteur/Downloads/Seite%20Schnellladenetz/REKA23B5-Machbarkeitsstudie_Schnellladenetz_Westkueste-Unterelbe-end.pdf (accessed on 12 June 2018).
  7. Luo, C.; Huang, Y.-F.; Gupta, V. Placement of EV Charging Stations—Balancing Benefits among Multiple Entities. IEEE Trans. Smart Grid 2017, 8, 759–768. [Google Scholar] [CrossRef]
  8. Gkatzoflias, D.; Drossinos, Y.; Zubaryeva, A.; Zambelli, P.; Dilara, P.; Thiel, C. Optimal allocation of electric vehicle charging infrastructure in cities and regions. JRC Rep. 2016. [Google Scholar] [CrossRef]
  9. DLR, KIT. Laden 2020—Schlussbericht. 2016. Available online: http://www.dlr.de/vf/Portaldata/12/Resources/dokumente/projekte/laden2020/LADEN2020_Schlussbericht.pdf (accessed on 13 June 2018).
  10. Kleiner, F.; Brokate, J.; Blaser, F.; Friedrich, H.E. Quantitative analysis of the public charging-point evolution: A demand-driven spatial modeling approach. Transp. Res. Part D 2018, 62, 212–224. [Google Scholar] [CrossRef]
  11. Colmenar-Santos, A.; de Palacio, C.; Borge-Diez, D.; Monzón-Alejandro, O. Planning Minimum Interurban Fast Charging Infrastructure for Electric Vehicles. Methodology and Application to Spain. Energies 2014, 7, 1207–1229. [Google Scholar] [CrossRef]
  12. Aktualisierung und Fortführung der Studie. Bundesverband der Energie- und Wasserwirtschaft e.V. (BDEW). Die Zukünftige Elektromobilitätsinfrastruktur Gestalten; Aktualisierung und Fortführung der Studie. Bundesverband der Energie- und Wasserwirtschaft e.V. (BDEW): Berlin, Germany, 2013. [Google Scholar]
  13. Cordera, R.; dell’Olio, L.; Ibeas, A.; de Dios Ortúzar, J. Demand for environmentally friendly vehicles: A review and new evidence. Int. J. Sustain. Transp. 2018, 1–14. [Google Scholar] [CrossRef]
  14. Brost, W.; Funke, T.; Philipsen, R.; Brell, T.; Ziefle, M. Integrated Model Approach STELLA. Method of Site Identification for Charging Infrastructure. In Proceedings of the 15th IFAC Symposium on Control in Transportation Systems, Project SLAM (BMWi), Savona, Italy, 6–8 June 2018. [Google Scholar]
  15. Bundesamt für Kartographie und Geodäsie (BKG). Open Data—Freie Daten und Dienste des BKG; Bundesamt für Kartographie und Geodäsie (BKG): Frankfurt, Germany, 2018; Available online: http://www.geodatenzentrum.de/geodaten (accessed on 2 January 2018).
  16. Bundesinstitut für Bau-, Stadt- und Raumforschung (BBSR). Raumabgrenzungen; Bundesinstitut für Bau-, Stadt- und Raumforschung: Bonn, Germany, 2018; Available online: http://www.bbsr.bund.de/BBSR/DE/Raumbeobachtung/Raumabgrenzungen/aumabgrenzungen_node.html (accessed on 2 January 2018).
  17. Data Distribution Service (DDS). Datenbeschreibung. In PLZ8 Deutschland Grenzen, PLZ8 Deutschland XXL; Digital Services GmbH: Karlsruhe, Germany, 2014. [Google Scholar]
  18. HERE International B.V. (HERE). Datensatz Deutschland; HERE International B.V. (HERE): Eindhoven, The Netherlands, 2017. [Google Scholar]
  19. Bundesinstitut für Bau-, Stadt- und Raumforschung (BBSR). INKAR—Indikatoren und Karten zur Raum- und Stadtentwicklung; Bundesinstitut für Bau-, Stadt- und Raumforschung (BBSR) im Bundesamt für Bauwesen und Raumordnung: Bonn, Germany, 2018; Available online: http://inkar.de/ (accessed on 13 June 2018).
  20. Zensus. Ergebnisse des Zensus 2011 zum Download—Erweitert. Available online: https://www.zensus2011.de/ (accessed on 11 April 2018).
  21. OSM. Datensatz; OpenStreetMap Foundation: Sutton Coldfield, UK, 2017. [Google Scholar]
  22. Infas, DLR. Mobilität in Deutschland 2008; Infas: Bonn, Germany; DLR: Berlin, Germany, 2010. [Google Scholar]
  23. Kraftfahrt-Bundesamt (KBA). Statistiken; Kraftfahrt-Bundesamt (KBA): Flensburg, Germany, 2017. [Google Scholar]
  24. GoingElectric. Available online: https://www.goingelectric.de (accessed on 8 October 2017).
  25. SLAM. Schnellladenetz für Achsen und Metropolen. 2017. Available online: http://www.slam-projekt.de/ (accessed on 8 October 2017).
  26. HansE. Aufbau Einer auf Verkehrsströme Abgestimmten Ladeinfrastruktur in der Metropolregion Hamburg; HansE: Hamburg, Germany, 2017. [Google Scholar]
  27. Bundesministerium für Verkehr und digitale Infrastruktur (BMVI). Verkehrsverflechtungsprognose; Bundesministerium für Verkehr und digitale Infrastruktur (BMVI): Berlin, Germany, 2010. [Google Scholar]
  28. Bundesanstalt für Straßenwesen (BASt). Automatische Zählstellen auf Autobahnen und Bundesstraßen; Bundesanstalt für Straßenwesen (BASt): Bergisch Gladbach, Germany, 2016; Available online: https://www.bast.de/BASt_2017/DE/Verkehrstechnik/Fachthemen/v2-verkehrszaehlung/Verkehrszaehlung.html (accessed on 8 October 2017).
  29. Brost, W.; Funke, T.; Phililpsen, R. Calculation of potential for setting up charging infrastructure for battery-powered electric vehicles—Fousing the calculation of potential according to the urban quarter level. In Proceedings of the International Scientific Conference on Mobility and Transport Urban Mobility—Shaping the Future Together (mobil.TUM 2018), Munich, Germany, 13–14 June 2018. [Google Scholar]
  30. Statistisches Bundesamt (DESTATIS). GV-ISys—Verzeichnis der Gebietseinheiten. Definitionen und Beschreibungen; Statistisches Bundesamt: Wiesbaden, Germany, 2015. [Google Scholar]
  31. Verkehrsverbund Großraum Nürnberg (VGN). Internetpräsenz. 2018. Available online: http://www.vgn.de (accessed on 4 January 2018).
  32. Flex, F.; Greiving, S.; Milstein, A.; van Gemmeren, C.; David, C.-H. Steuerungswirkung und Handlungsfelder eines Modernisierten Zentreale-Orte-Konzepts; Arbeitsberichte des ARL: Hannover, Germany, 2016. [Google Scholar]
  33. LEP. Anhang 2—Zentrale Orte und Siedlungsschwerpunkte. Available online: https://www.landesentwicklung-bayern.de/fileadmin/user_upload/landesentwicklung/Dokumente_und_Cover/Instrumente/s067.pdf (accessed on 10 January 2018).
  34. Hegger, M.; Dettmar, J.; Meinberg, T.; Drebes, C.; Schulze, J.; Sieber, S.; Sylla, O. EnEff:Stadt—UrbanReNet Phase 2: Weiterführung und inhaltliche Vertiefung des Forschungsprojektes UrbanReNet—Vernetzte regenerative Energiekonzepte im Siedlungs- und Landschaftsraum. Schlussbericht; Fachgebiet Entwerfen und Energieeffizientes Bauen, FB Architektur, Fachgebiet Entwerfen und Freiraumplanung, FB Architektur, TU Darmstadt, Förderkennzeichen 0327832E, Gefördert durch Bundesministerium für Wirtschaft und Energie; TU Darmstadt: Darmstadt, Germany, 2015. [Google Scholar]
  35. Forschungsgesellschaft für Straßen- und Verkehrswesen e.V. (FGSV). ÖPNV und Siedlungsentwicklung—Planungshilfe für die kommunale Bauleitplanung; FGSV 134; Forschungsgesellschaft für Straßen- und Verkehrswesen e.V. (FGSV): Köln, Germany, 1999. [Google Scholar]
  36. Bayerisches Staatsministerium für Wirtschaft, Infrastruktur, Verkehr und Technologie (STMWI). Leitlinie zur Nahverkehrsplanung in Bayern; Bayerisches Staatsministerium für Wirtschaft, Infrastruktur, Verkehr und Technologie (STMWI): Munich, Germany, 2018; Available online: http://www.demografie-leitfaden-bayern.de/fileadmin/user_upload/demografie-leitfaden/dokumente/LEITLINIE98.pdf (accessed on 4 January 2018).
  37. Verband Deutscher Verkehrsunternehmen (VDV). Verkehrserschließung und Verkehrsangebot im ÖPNV; VDV-Schrift 4, Ausgabe 06/2001; Verband Deutscher Verkehrsunternehmen (VDV): Köln, Germany, 2001. [Google Scholar]
  38. Verband Öffentlicher Verkehr (VÖV). Empfehlungen für einen Bedienungsstandard im öffentlichen Personenverkehr; VÖV-Schriften 1.41.1; Verband Öffentlicher Verkehr (VÖV): Köln, Germany, 1981. [Google Scholar]
  39. Forschungsgesellschaft für Straßen- und Verkehrswesen e.V. (FGSV). Hinweise zur Schätzung des Verkehrsaufkommens von Gebietstypen; FGSV 147; Forschungsgesellschaft für Straßen- und Verkehrswesen e.V. (FGSV): Köln, Germany, 2010. [Google Scholar]
  40. DIN EN 13816. Transportation—Logistics and Services—Public Passenger Transport; Service Quality Definition, Targeting and Measurement; German Version EN 13816:2002; Beuth Verlag: Berlin, Germany, 2002. [Google Scholar]
  41. Schwarze, B. Erreichbarkeitsindikatoren in der Nahverkehrsplanung; Arbeitspapier 184; Institut für Raumplanung, Fakultät Raumplanung, Universität Dortmund: Dortmund, Germany, 2005. [Google Scholar]
  42. Winter, O.M. Analyse und Evaluation von Nahverkehrsplänen und die Aufstellung von Kriterien zur Bewertung von Standards im ÖPNV; Heft 16. Juli 2005; Institut für Verkehrswesen Universität Kassel, Schriftenreihe Verkehr: Kassel, Germany, 2005; ISBN 3-89958-153-9. [Google Scholar]
  43. Boesch, H. Der Fussgänger als Passagier—Zugänge zu Haltestellen und Bahnhöfen; ORL-Bericht 73/1989; Institut für Orts-, Regional- und Landesplanung (ORL): Zürich, Switzerland, 1989. [Google Scholar]
  44. Eidgenössisches Departement für Umwelt, Verkehr, Energie und Kommunikation (UVEK). Grundlagen für den Fussverkehr; Forschungsauftrag VSS 2000/368; Bundesamt für Strassen: Zürich, Switzerland, 2011. [Google Scholar]
  45. Weidmann, U. Transporttechnik der Fussgänger—Transporttechnische Eigenschaft des Fußgängerverkehrs; ETH Zürich, Schriftenreihe des IVT Nr. 90; Institut für Verkehrsplanung, Transporttechnik, Strassen- und Eisenbahnbau (IVT): Zürich, Switzerland, 1992; Available online: https://doi.org/10.3929/ethz-a-000687810 (accessed on 17 May 2018).
Figure 1. Actual overview of the used input data in the model approach “STandortfindungsmodell für ELektrische LAdeinfrastruktur” (STELLA) (own depiction, state of 31 January 2018) [15,16,17,18,19,20,21,22,23,24,25,26,27,28].
Infrastructures 03 00021 g001
Figure 2. City and municipal types in the area of the traffic network metropolitan area of Nuremberg (Update 31 December 2017: District Hassberge is not included due to missing data) (own depiction based on [15,16,31]).
Infrastructures 03 00021 g002
Figure 3. Classification of the traffic network metropolitan area of Nuremberg on the basis of the “Central Places Concept” (own depiction based on [15,16,31,33]).
Infrastructures 03 00021 g003
Figure 4. Schematic comparison of accessibility radii and network analysis (own depiction).
Infrastructures 03 00021 g004
Figure 5. Visualization of the charging requirement profile of an urban quarter (own depiction).
Infrastructures 03 00021 g005
Table 1. Differentiated city and municipal types [16].
DenotationPopulationCentral Location Function
large-sized citylarge>500,000usually function of an higher-order center/at least function of a middle-order center
small100,000–500,000
medium-sized citylarge50,000–100,000predominantly function of a middle-order center
small20,000–50,000
small-sized citylarge10,000–20,000at least function of a basic-order center
small5000–10,000
rural municipality<5000less then the function of a basic-order center
Table 2. Quality levels of accessibility (beeline) of public transport stops (unit meters) (own depiction based on [35,36,37,38]).
DenotationBus/TramMetro/Suburban Train/Local Passenger Rail Traffic
QL 1QL 2QL 3QL 1QL 2QL 3
large-sized citycore zone≤300≤400>400≤400≤600>600
high density area≤400≤500>500≤600≤800>800
low density area≤600≤800>800≤1000≤1200>1200
medium-sized citycore zone≤300≤500>500≤400≤600>600
high density area≤400≤800>800≤600≤800>800
low density area≤600≤800>800≤1000≤1200>1200
small-sized citycentral area≤400≤500>500≤600≤800>800
remaining area≤600≤800>800≤1000≤1200>1200
municipality≤600≤800>800≤1000≤1200>1200
Table 3. Quality levels of accessibility (walking time) of public transport stops (unit minutes) (own depiction based on [35,36,37,38]).
DenotationBus/TramMetro/Suburban Train/Local Passenger Rail Traffic
QL 1QL 2QL 3QL 1QL 2QL 3
large-sized citycore zone≤5≤7>7≤7≤10>10
high density area≤7≤9>9≤10≤14>14
low density area≤10≤14>14≤17≤21>21
medium-sized citycore zone≤5≤9>9≤7≤10>10
high density area≤7≤14>14≤10≤14>14
low density area≤10≤14>14≤17≤21>21
small-sized citycentral area≤7≤9>9≤10≤14>14
remaining area≤10≤14>14≤17≤21>21
Municipality≤10≤14>14≤17≤21>21
Table 4. Proportionate coverage of settlement area per urban quarter differentiated by accessibility radii according to quality levels and transport mode group in the operating area of the Verkehrsverbund Großraum Nürnberg (VGN) (own depiction).
DepictionNumber of Urban Quarters *Bus/TramMetro/Suburban Train/Local Passenger Rail Traffic
QL 1QL 2QL 1QL 2
higher-order centercore area12089%98%38%62%
core edge zone42593%98%47%62%
outer zone37096%99%30%41%
middle-order centercore area1782%100%0%18%
outer zone2592%100%28%44%
districts34491%94%15%24%
lowest-order centercentral area1275%83%17%50%
districts31075%86%11%15%
rural municipality105281%89%14%18%
* Excluding the urban quarter types business, office, administrative and industrial area.
Table 5. Proportionate coverage of settlement area per urban quarter differentiated by network analysis according to quality levels and transport mode group in the operating area of the VGN (own depiction).
DepictionNumber of Urban Quarters *Bus/TramMetro/Suburban Train/Local Passenger Rail Traffic
QL 1QL 2QL 1QL 2
higher-order centercore area12051%80%18%48%
core edge zone42569%84%30%48%
outer zone37070%86%16%24%
middle-order centercore area1724%88%0%0%
outer zone2564%92%20%28%
districts34458%81%6%13%
lowest-order centercentral area1242%58%0%33%
districts31037%64%5%7%
rural municipality105237%69%7%12%
* Excluding the urban quarter types business, office, administrative and industrial area.

