Article

Sustainable Materials for Transportation Infrastructures: Comparison of Three Commercially-Available Metakaolin Products in Binary Cementitious Systems

College of Engineering, The University of Georgia, Athens, GA 30602, USA
*
Author to whom correspondence should be addressed.
Infrastructures 2018, 3(3), 17; https://doi.org/10.3390/infrastructures3030017
Submission received: 25 April 2018 / Revised: 9 June 2018 / Accepted: 19 June 2018 / Published: 21 June 2018
(This article belongs to the Special Issue Sustainable Transportation Infrastructures)

Abstract

:
Metakaolin is the only major natural pozzolan to be specified for use as a supplementary cementitious material in the United States. As a result, the metakaolin market for concrete has grown dramatically in the past 20 years. As of now, the specifications of up to 16 state departments of transportation allow for the use of commercially-available and high-reactivity metakaolin products. However, to the best of the authors’ knowledge, no study has been performed to evaluate whether these products are comparable in their performance. Three commercially-available (U.S.) metakaolin products, each replacing 10%, 15%, and 20% of the cement content in concrete and mortar mixtures are studied. Concrete mixtures contained a cementitious content of 422 kg/m3, a coarse aggregate fraction of 985 kg/m3, and a water-to-cementitious ratio equal to 0.43. Varying levels of a superplasticizer were used to maintain a uniform workability between mixtures. Each mixture was subjected to the following tests: compression, split-cylinder tension, modulus of rupture, dynamic elastic modulus, rapid chloride-ion penetrability, alkali–silica reactivity, sulfate resistance, the coefficient of thermal expansion, and drying shrinkage. Benefits from the inclusion of metakaolin were highly product-dependent and include increases in mechanical strength. All metakaolin supplemented concrete mixtures benefitted from decreased permeability and increased resistance to chemical attacks, with the exception of the sulfate resistance of mortars including a metakaolin product with high fineness. The inclusion of any metakaolin at any replacement level increased the coefficient of thermal expansion of concrete specimens. Reasons for difference in performance between products are discussed, and predictors of quality are recommended.

1. Introduction

Basic concrete generally consists of five basic ingredients: rock, sand, Portland cement, water, and air. By far, the most expensive and environmentally costly material in this system is the cement. During the production of cement clinker, CaCO3 (calcium carbonate) is converted into calcium oxide by means of calcination [1]. The second product, CO2 (carbon dioxide), is then emitted. A simplified chemical equation is given as Equation (1).
CaCO3 + heat → CaO + CO2
The Intergovernmental Panel on Climate Change (IPCC) states that cement production is the largest emitter of CO2 in the industrial sector [2]. Worldwide, it is estimated that for every ton of cement produced approximately 0.82 tons of carbon dioxide are released into the atmosphere [3]. The significance is that approximately 5% of the world’s anthropogenic carbon emissions can be traced to the production of cement [4]. However, it is because it is both financially and environmentally costly that reducing the proportion of cement in concrete mixtures has gained popularity for decades. To this end, supplementary cementitious materials (SCMs) have played a large role in reducing the amount of cement needed to meet required concrete quality. When properly specified, SCMs can benefit a concrete mixture in five possible ways:
  • Reduce costs
  • Improve fresh and hardened properties of concrete, including durability
  • Reduce environmental impact
  • Reuse waste materials
  • Enhance aesthetics
The inclusion of supplementary cementitious materials (SCMs) has been ubiquitous in North America since the 1970s because of their tendency to reduce cost, enhance concrete performance, and put waste material to reuse [5]. Until recently, a majority of the ready-mix concrete in the United States utilized three SCMs exclusively: fly ash (Class C or F), slag cement, and silica fume. All three of these SCMs are byproducts of other industries and have enjoyed widespread use as partial replacements of the cement in concrete mixtures.
Metakaolin, however, did not enjoy the same level of popularity initially. Literature on the use of metakaolin as a SCM began to proliferate starting in the early 1990s [6,7]. Before then, metakaolin was predominantly known for its use in ceramics, paints, and paper manufacturing industries [8].
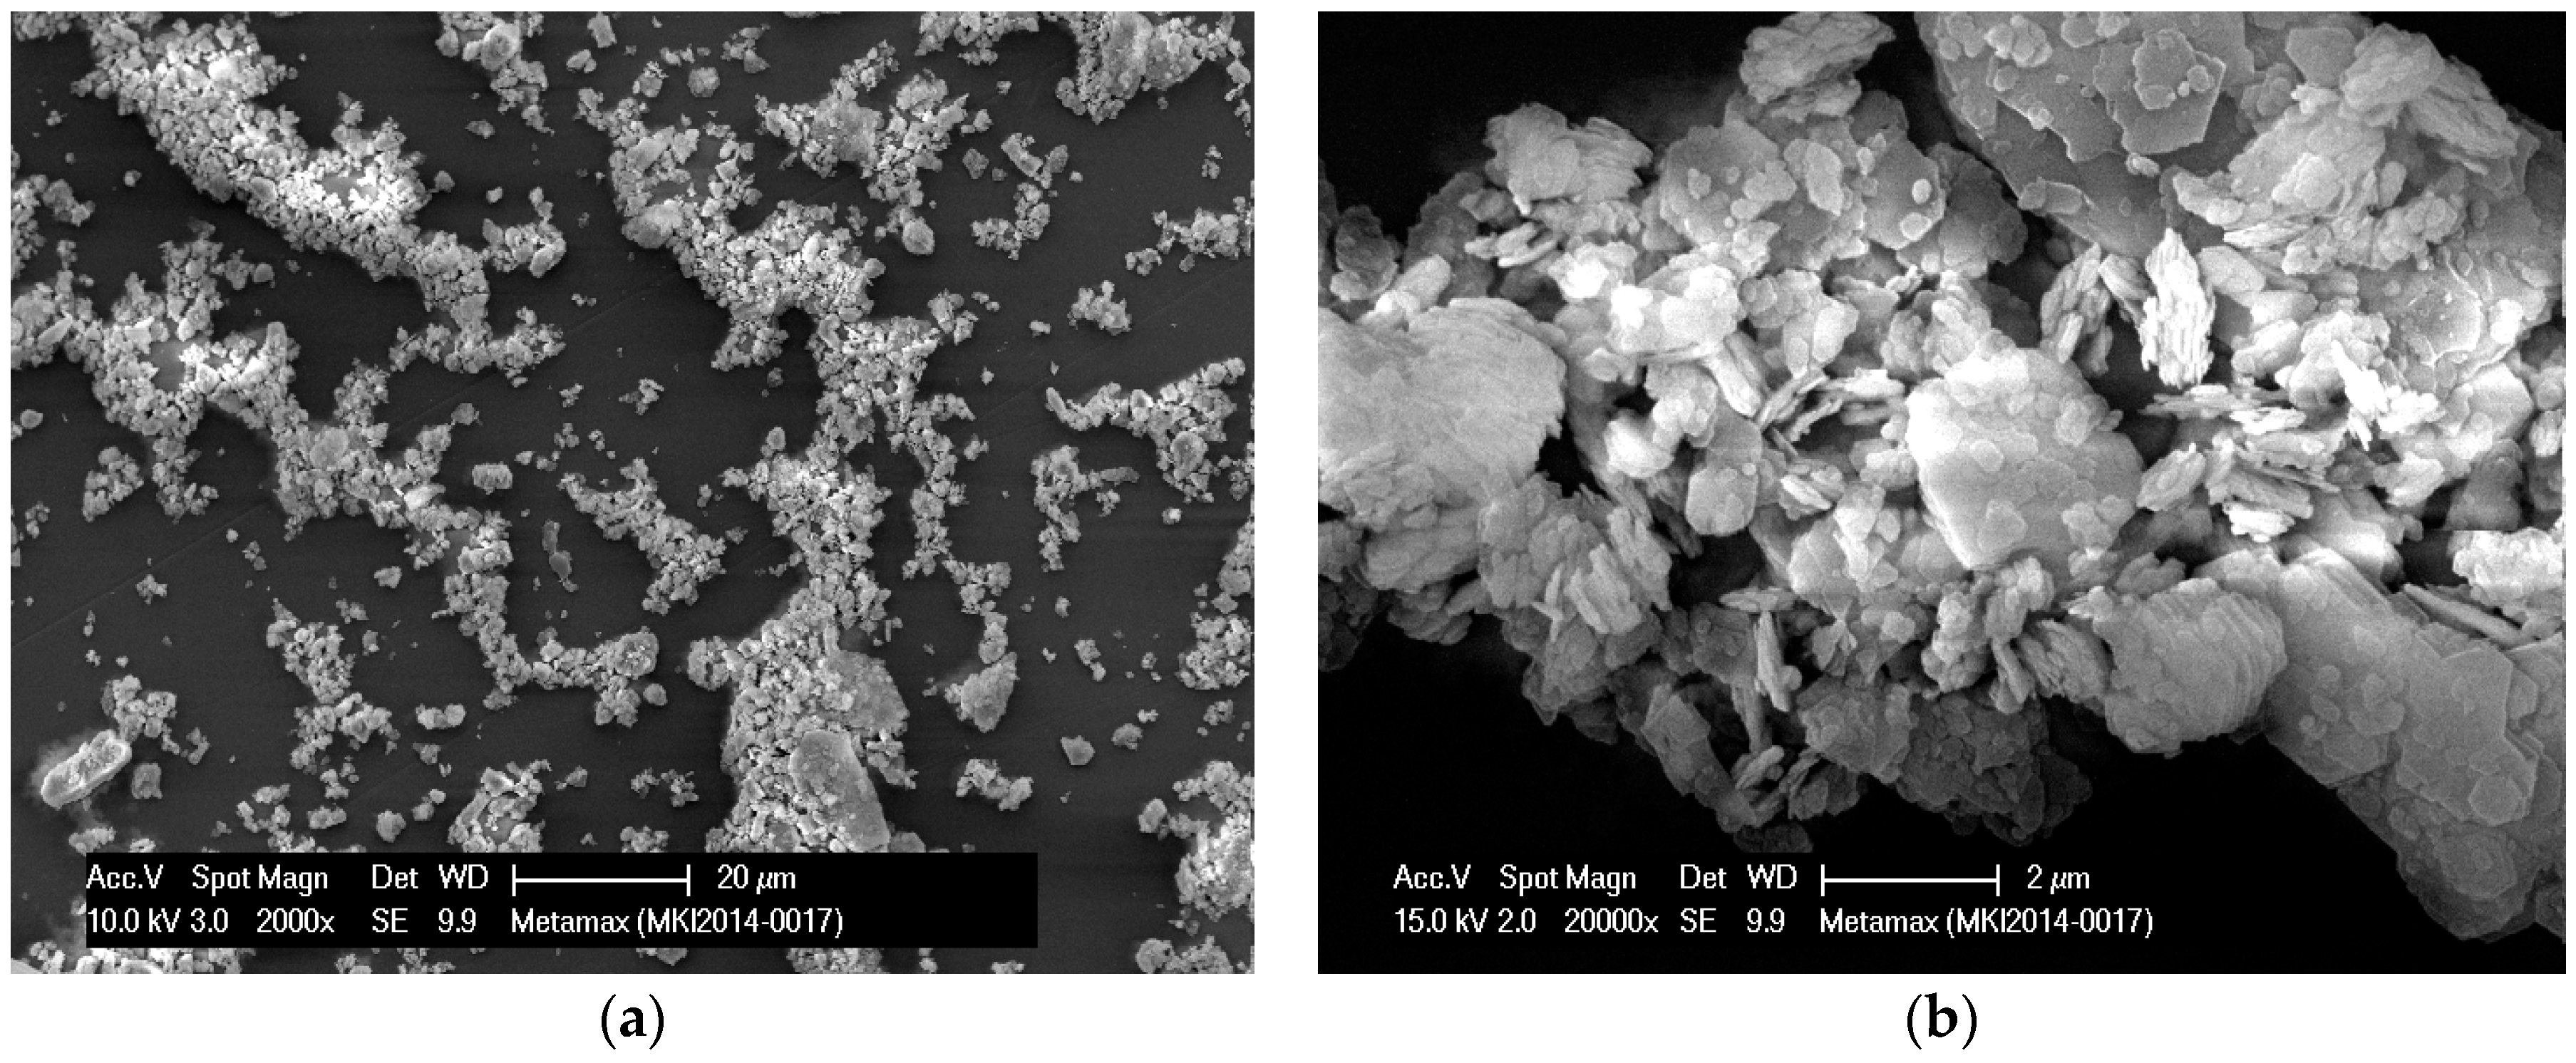
The paint and paper industries utilize the color and plate-like morphology (Figure 1) of the metakaolin in coating applications [9], while ceramics benefit from metakaolin’s pozzolanic activity [10]. Today, the literature is abundant with the benefits of using metakaolin as a SCM in concrete mixtures. Furthermore, the production of metakaolin, compared to Portland cement, requires much lower calcining temperature and emits less CO2 than Portland cement [10].
Metakaolin is an aluminous and siliceous natural pozzolan that conforms to ASTM C618, and is the product of thermally or mechanically activating kaolin clay. Typically, kaolin clay that is used in the production of metakaolin contains a high percentage (40–70%) of the clay mineral kaolinite, Al2Si2O5(OH)4 [11]. In its dehydroxylated form, metakaolin can be used in concrete to enhance mechanical properties and increase durability [12,13,14,15,16], while also improving the aesthetic appeal with its white color. The consensus within the literature is that metakaolin contributes to concrete performance in three ways [17,18]. The first is the filler effect. As with silica fume, the fineness of metakaolin densifies the paste matrix. The second is the acceleration of the cement hydration, which is a result of fine metakaolin providing additional surfaces for the nucleation of hydrates [19]. Lastly, the pozzolanic reactivity of the metakaolin contributes additional structural hydrates (C-S-H, C2ASH8, C4AH13, and C3AH6) to the paste matrix [20].
The high early-strengths reported in the literature [14,15,21,22] make metakaolins ideal for prestressing and other high-early strength applications. The most common SCM used for this purpose is silica fume, and metakaolin has shown itself to be comparable to silica fume in ability to achieve high early-strength in concrete [13,15]. The aesthetic difference here being that silica fume tends to make the concrete darker with its gray color.

1.1. Background

Currently in the U.S., metakaolin as a Class N pozzolan is permissible for use by 16 state departments of transportation (DOT), although most do not specify approved metakaolin products. The three metakaolin products (MK1, MK2, and MK3) shown in Table 1 are discussed later.
Although any calcined kaolin can be classified as a metakaolin, the use of metakaolin has typically been restricted to those that can be classified as high-reactivity metakaolins (HRMs). HRMs are frequently defined as a metakaolin that has a total of 90% or greater Al2O3 + SiO2 + Fe2O3. Furthermore, unlike other SCMs, metakaolin is not a byproduct of another industry. This status as a primary product ensures that it can be produced with a specific use in mind, and benefit from strict quality control. ASTM C618 requires that the Al2O3 + SiO2 + Fe2O3 content of a Class N pozzolan is greater than 70%, and thus it is rarely beneficial to produce a metakaolin that is not a HRM. Therefore, in the U.S. market, most commercially-available metakaolins are HRMs. Some states have already included the metakaolin products used in this study in their approved product lists (Table 1). As is typical in all concrete mixtures, concrete incorporating metakaolin varies widely in its performance based on a great number of factors including the water-to-cementitious material (w/cm) ratio, cement content and composition, SCM content and composition, aggregate content and size, and mixing and curing conditions.
The result is that the performance of metakaolin in concrete systems is usually contextualized by the metakaolin’s material fineness and oxide composition [14]. While these two factors are likely the best indicators of performance, the wide range of metakaolin products and mixture designs makes a practical and informed usage of metakaolin based on the literature difficult. Furthermore, little to no research has been conducted comparing commercially-available metakaolin products in the U.S. from different vendors, possibly to guide the practical use of metakaolin in concrete mixtures.

1.2. Objective

This research aims to investigate the variations in performance of concretes incorporating seemingly similar commercially-available metakaolins. To the best of the authors’ knowledge, the comparison of competing metakaolins, that are commercially-available in the U.S. market, has not yet been studied in the literature. Concrete mixtures containing a typical w/cm ratio, cement content, and coarse aggregate content are batched so that the metakaolins can be directly compared to each other at three separate cement-weight replacement levels (10%, 15%, and 20%). Each of these mixtures is tested for mechanical properties, durability, and dimensional stability. The replacement levels presented are chosen such that they contain the optimums for mechanical strengths that are prevalent in the literature (10–20%). In addition, the range was chosen to include higher replacements because durability tends to increase systematically with replacement level [12,23,24,25,26,27]. This concept of an ‘optimum’ replacement level is evoked because of the need to maximize performance and minimize cost. In addition to the hardened properties, some fresh-state properties are measured on concrete mixtures. HRMs are widely known to cause workability issues [12,28,29], hence fresh properties of these mixtures are crucial in informing the usage of metakaolin in U.S. ready-mixed concrete.
This research attempts to address the following research questions:
  • For each metakaolin product, what is the effect of replacement level on fresh and hardened concrete performance?
  • Are there significant differences in effect on concrete performance between metakaolin products? If so, how large is the variation, and what are the primary contributors to the change in concrete properties?
  • Can general guidelines be given for the inclusion of commercially-available metakaolin in concrete?

2. Materials and Methods

2.1. Materials

A type I/II cement was used for all mixtures, for which a portion was replaced by a commercially-available metakaolin product. Three metakaolin products produced by different companies were chosen. The first and third products are sourced from Georgia (processing and calcination performed by different vendors). The second product is sourced from South Carolina. Selected physical and chemical properties for all of the cementing materials are provided in Table 2. They are obtained from the manufacturers. The coarse aggregate is a standard size #57 (NMAS = 25 mm) graded granite stone sourced from Athens, Georgia. The fine aggregate is an alluvial river sand sourced from Watkinsville, Georgia and has shown no signs of deterioration from alkali reactivity when used for concrete projects. The gradations and composition of both meet ASTM C33 requirements. In addition, a superplasticizer has been included in each mixture to ensure adequate workability. The superplasticizer is a polycarboxylate ether (PCE) based plasticizer with 33% solids, and conforms to ASTM C494 Type A and F requirements. All material data for the chemical and mineral admixtures were provided by the material vendors.

2.2. Mixture Design

The concrete mixtures used in this study are designed such that the total cementitious content would equal 422 kg/m3. Each metakaolin product replaced cement at rates equaling 10%, 15%, and 20% by weight. The coarse aggregate content of the mixtures was maintained at a constant 985 kg/m3, and the sand contents slightly varied by mixture to attain an equal volume between mixtures in accordance with ACI 211 [29]. A w/cm ratio of 0.43 was used for all mixtures. Finally, the mixtures were designed with an air content of 4%. As previously mentioned, a PCE-based superplasticizer was used to retain workability of the mixtures, and the dosage needed in each mixture was determined upon mixing. Saturated surface dry mixture proportions can be found in Table 3. Batch quantities were such that the specimens were manufactured using the same materials to successfully conduct the following tests: compression, split-cylinder tension, modulus of rupture (MOR), dynamic modulus of elasticity (MOE), rapid chloride-ion penetrability test (RCPT), and the coefficient of thermal expansion (CTE).
Tests for sulfate resistance and alkali–silica reactivity (ASR) were performed on mortar specimens according to ASTM testing methods (C1012 and C1567, respectively). These testing standards require specific mixture proportions.
Sulfate specimens required 1:2.75 ratio of cementitious material to sand content, and a w/cm equal to 0.485. As with the concrete mixtures, the metakaolins replaced percentages of the cement by weight. In addition, a superplasticizer was used to retain a consistent workability between mixtures. This addition is a deviation from ASTM C1012. Currently, the standard specifies that the w/cm be increased in view of workability concerns, however, the superplasticizer was included because of the documented negative effects of increasing w/cm when using metakaolin [30].
As per ASTM C1567, the batching of ASR specimens included 990 g of sand (saturated surface-dry condition), 440 g of total cementitious material, and a w/cm ratio equal to 0.43. As with the sulfate mixtures, a superplasticizer was used to retain a consistent workability across all mixtures.

2.3. Batching and Molding

Concretes were machine mixed using a portable revolving drum mixer with a 0.35 m3 capacity. Saturated surface dry (SSD) mixture proportions were altered according to the volumetric method to accommodate the moisture condition of the aggregates upon mixing, and then weighed using a scale with a 136 kg capacity and 0.05 kg accuracy. Materials were added and mixed per ASTM C192. The superplasticizer was added to the mixing water and thoroughly agitated before the water was added to the mixer. Contents of the mixer were then discharged into a wheelbarrow so that fresh concrete tests could be performed, and molds could be filled. Material from the same batched filled the specimen molds for all hardened concrete tests excluding sulfate and ASR.
Mortar mixtures were mixed using a portable table-top mixer with a nominal capacity of 4.8 L, and according to ASTM C305 mixing procedure. Mixture proportions were slightly altered to accommodate for non-SSD sand moisture contents at the time of mixing. The superplasticizer was added separately after the mixing water as the paddle rotated. The plastic mixture was then discharged into molds.

2.4. Experimental Plan

2.4.1. Fresh Properties

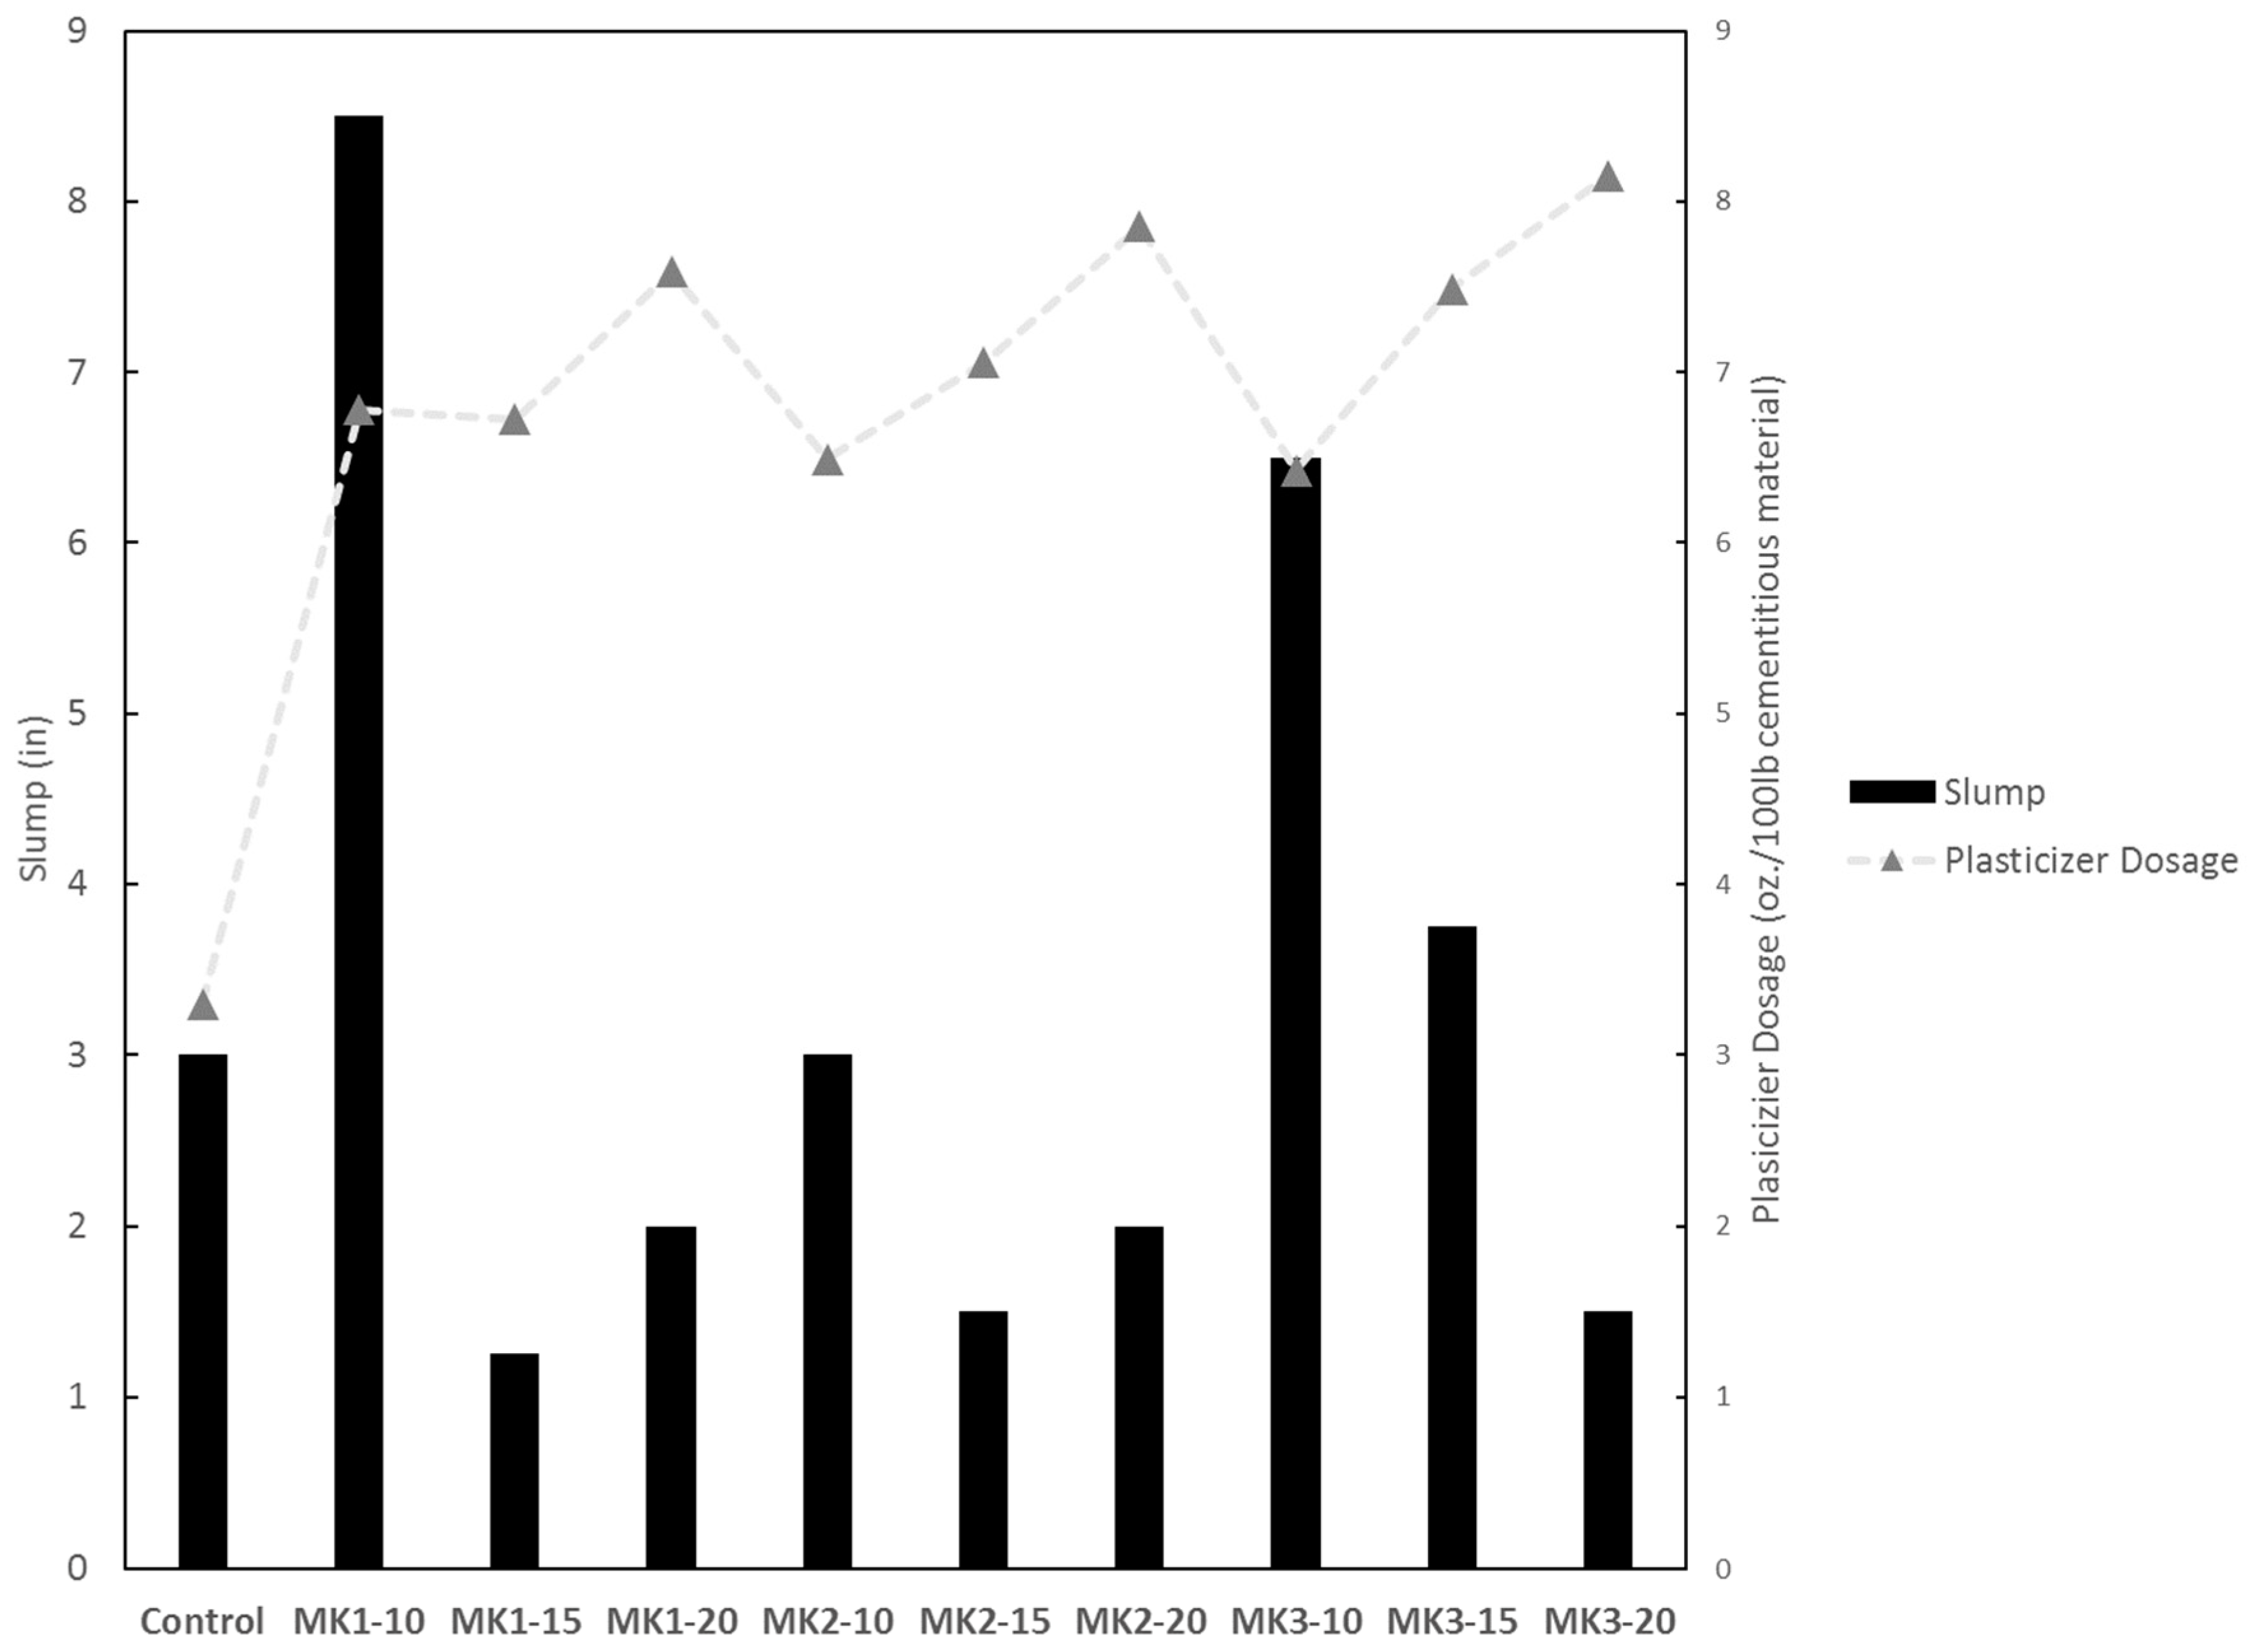
Concrete temperature, unit weight, air content, and slump were measured directly after batching. A thermometer was used to record the temperature per ASTM C1064. Unit weight and air content were measured as outlined in ASTM C138 and C231, respectively. Slump was measured in accordance with ASTM C143. Temperature and air content were measured to ensure concrete quality, and the unit weight was measured to ensure that metakaolin did not have a significant effect on concrete density. Slumps and superplasticizer dosages were measured to understand the extent of workability reduction that is associated with using metakaolin.

2.4.2. Mechanical Properties

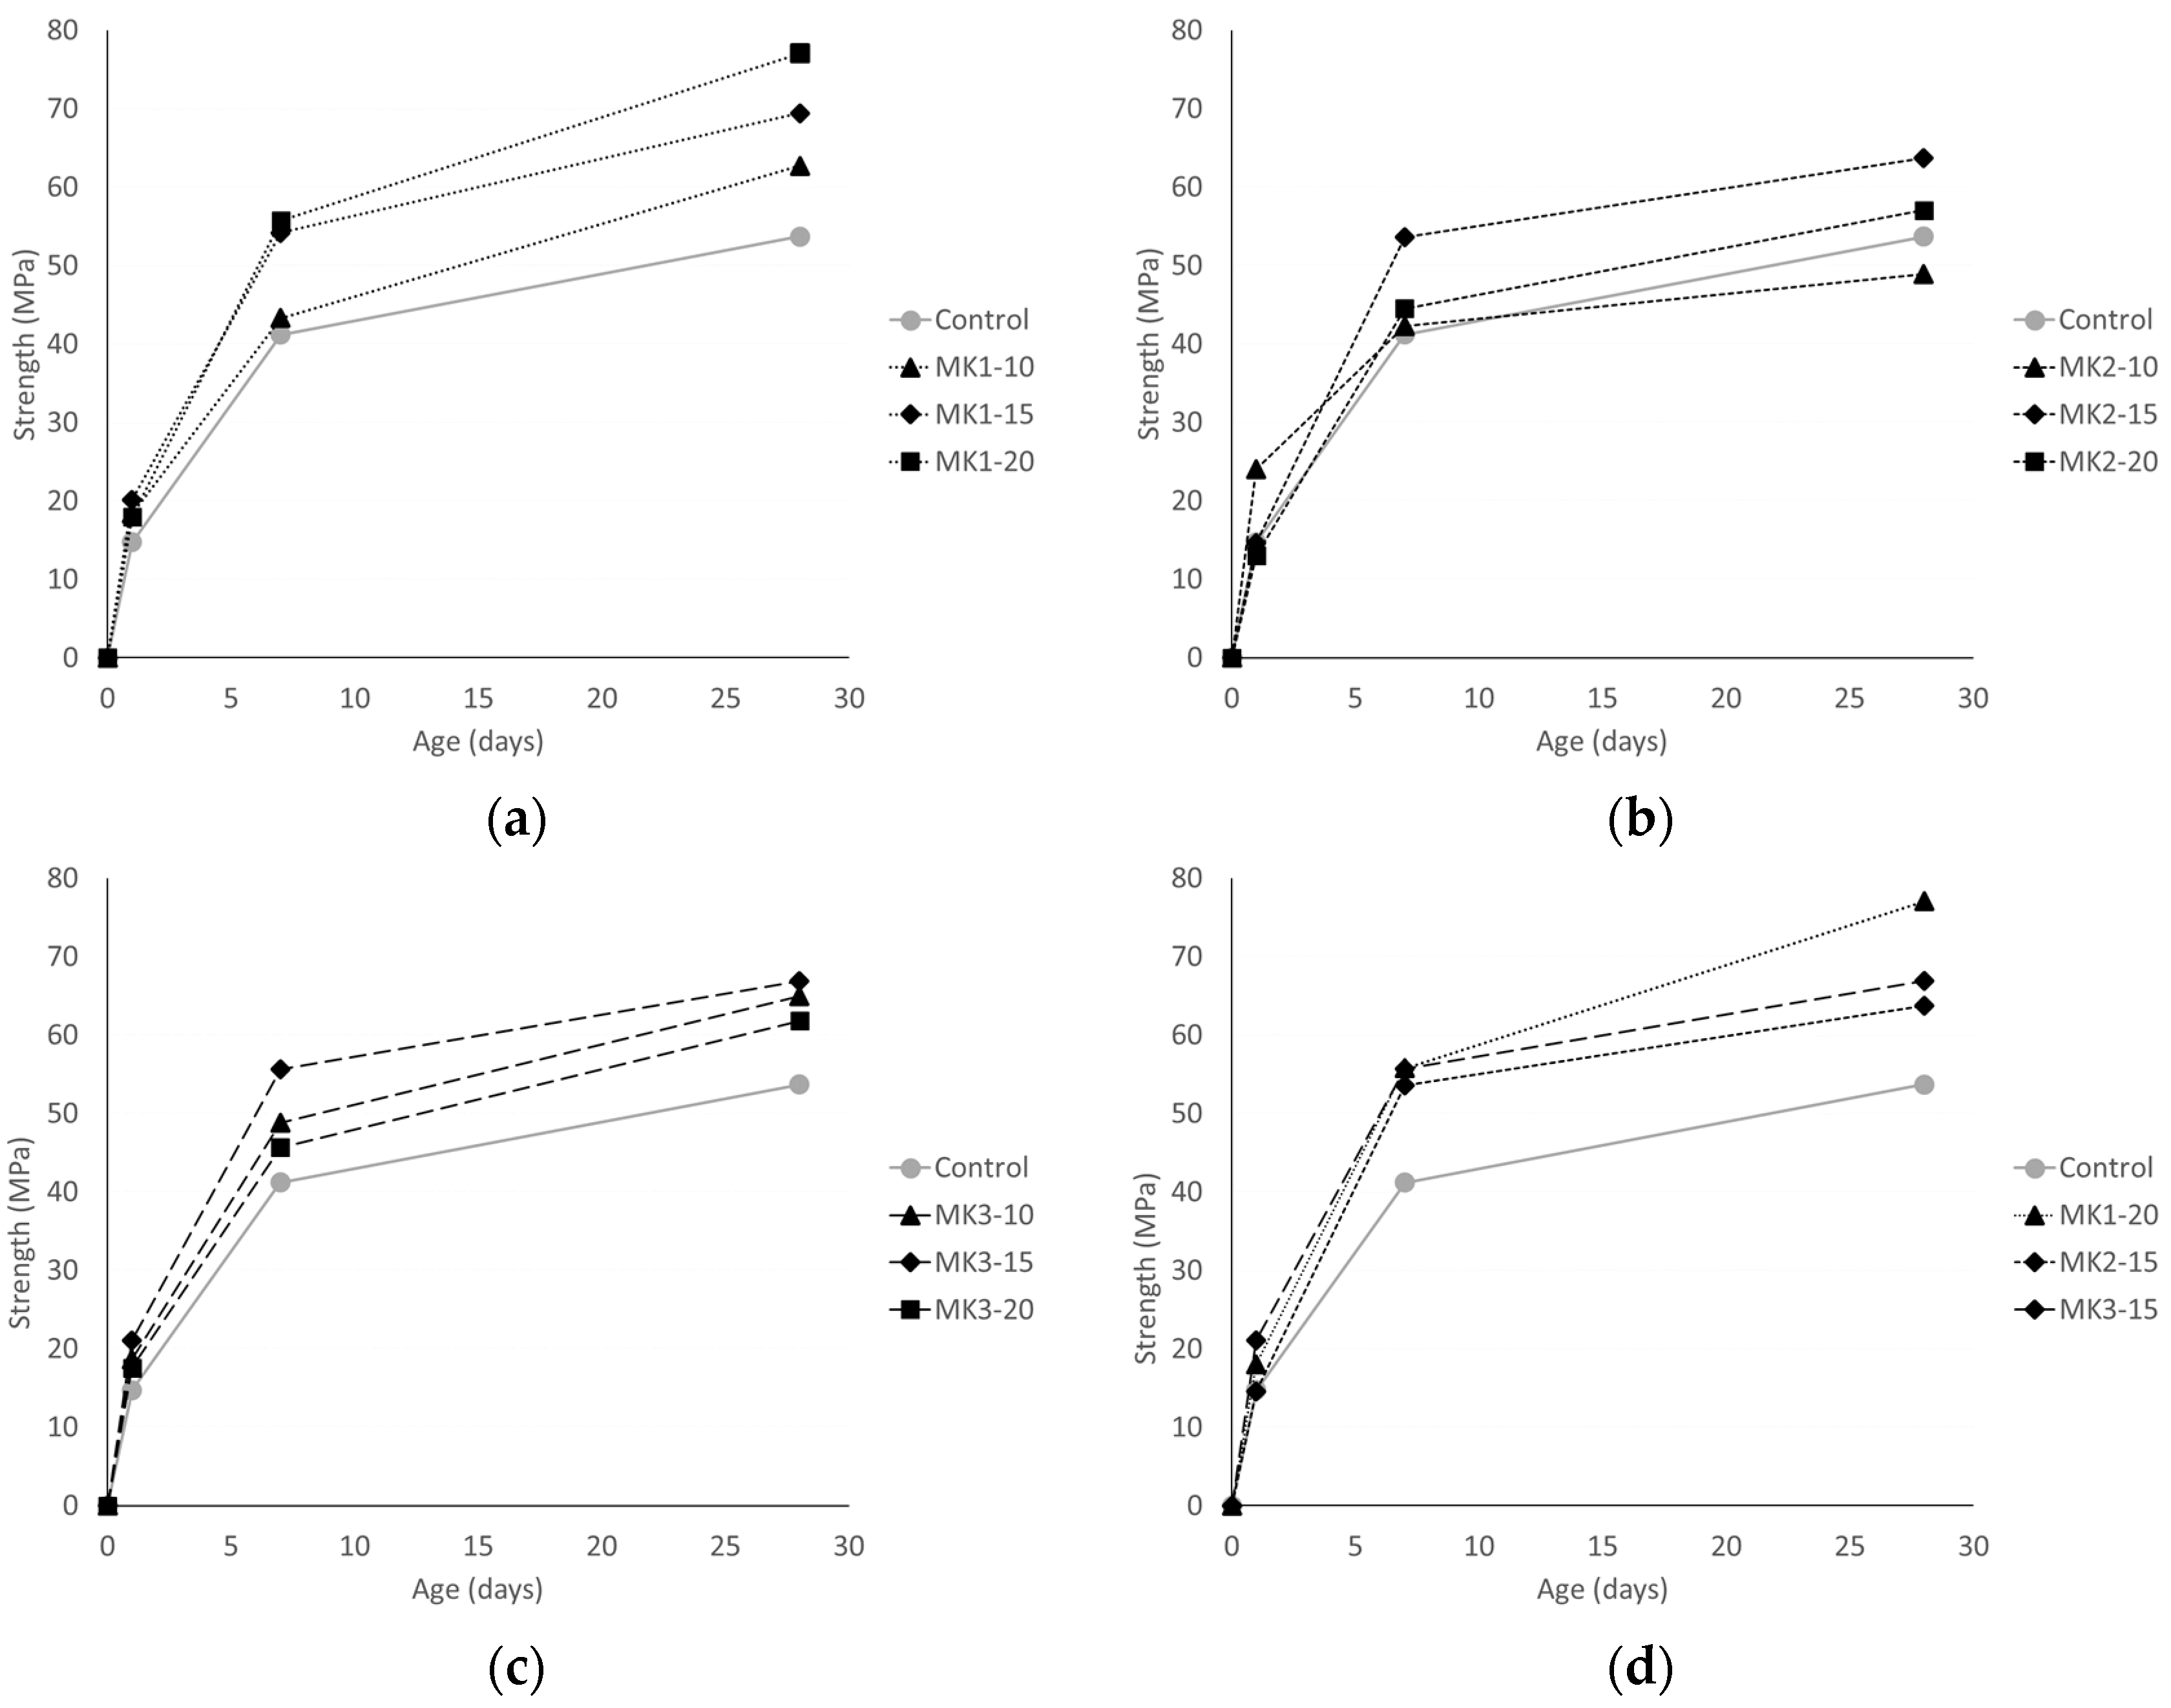
All specimens used in mechanical property testing were laboratory-molded in accordance with ASTM C192, and cured in a lime-saturated bath until the day of testing per ASTM C511. Nine 100 mm × 200 mm cylinders were made during each batching to test for compression: three each for 1-day, 7-day, and 28-day strengths. At the age of 1, 7, and 28 days, three cylinders from each mixture were broken in a universal testing machine with a capacity of 3.5 MN, and were constrained by neoprene caps. Cylinders were loaded at a rate of 2000 N/s until fracture per ASTM C39. The average strength of three specimens was taken as the compressive strength.
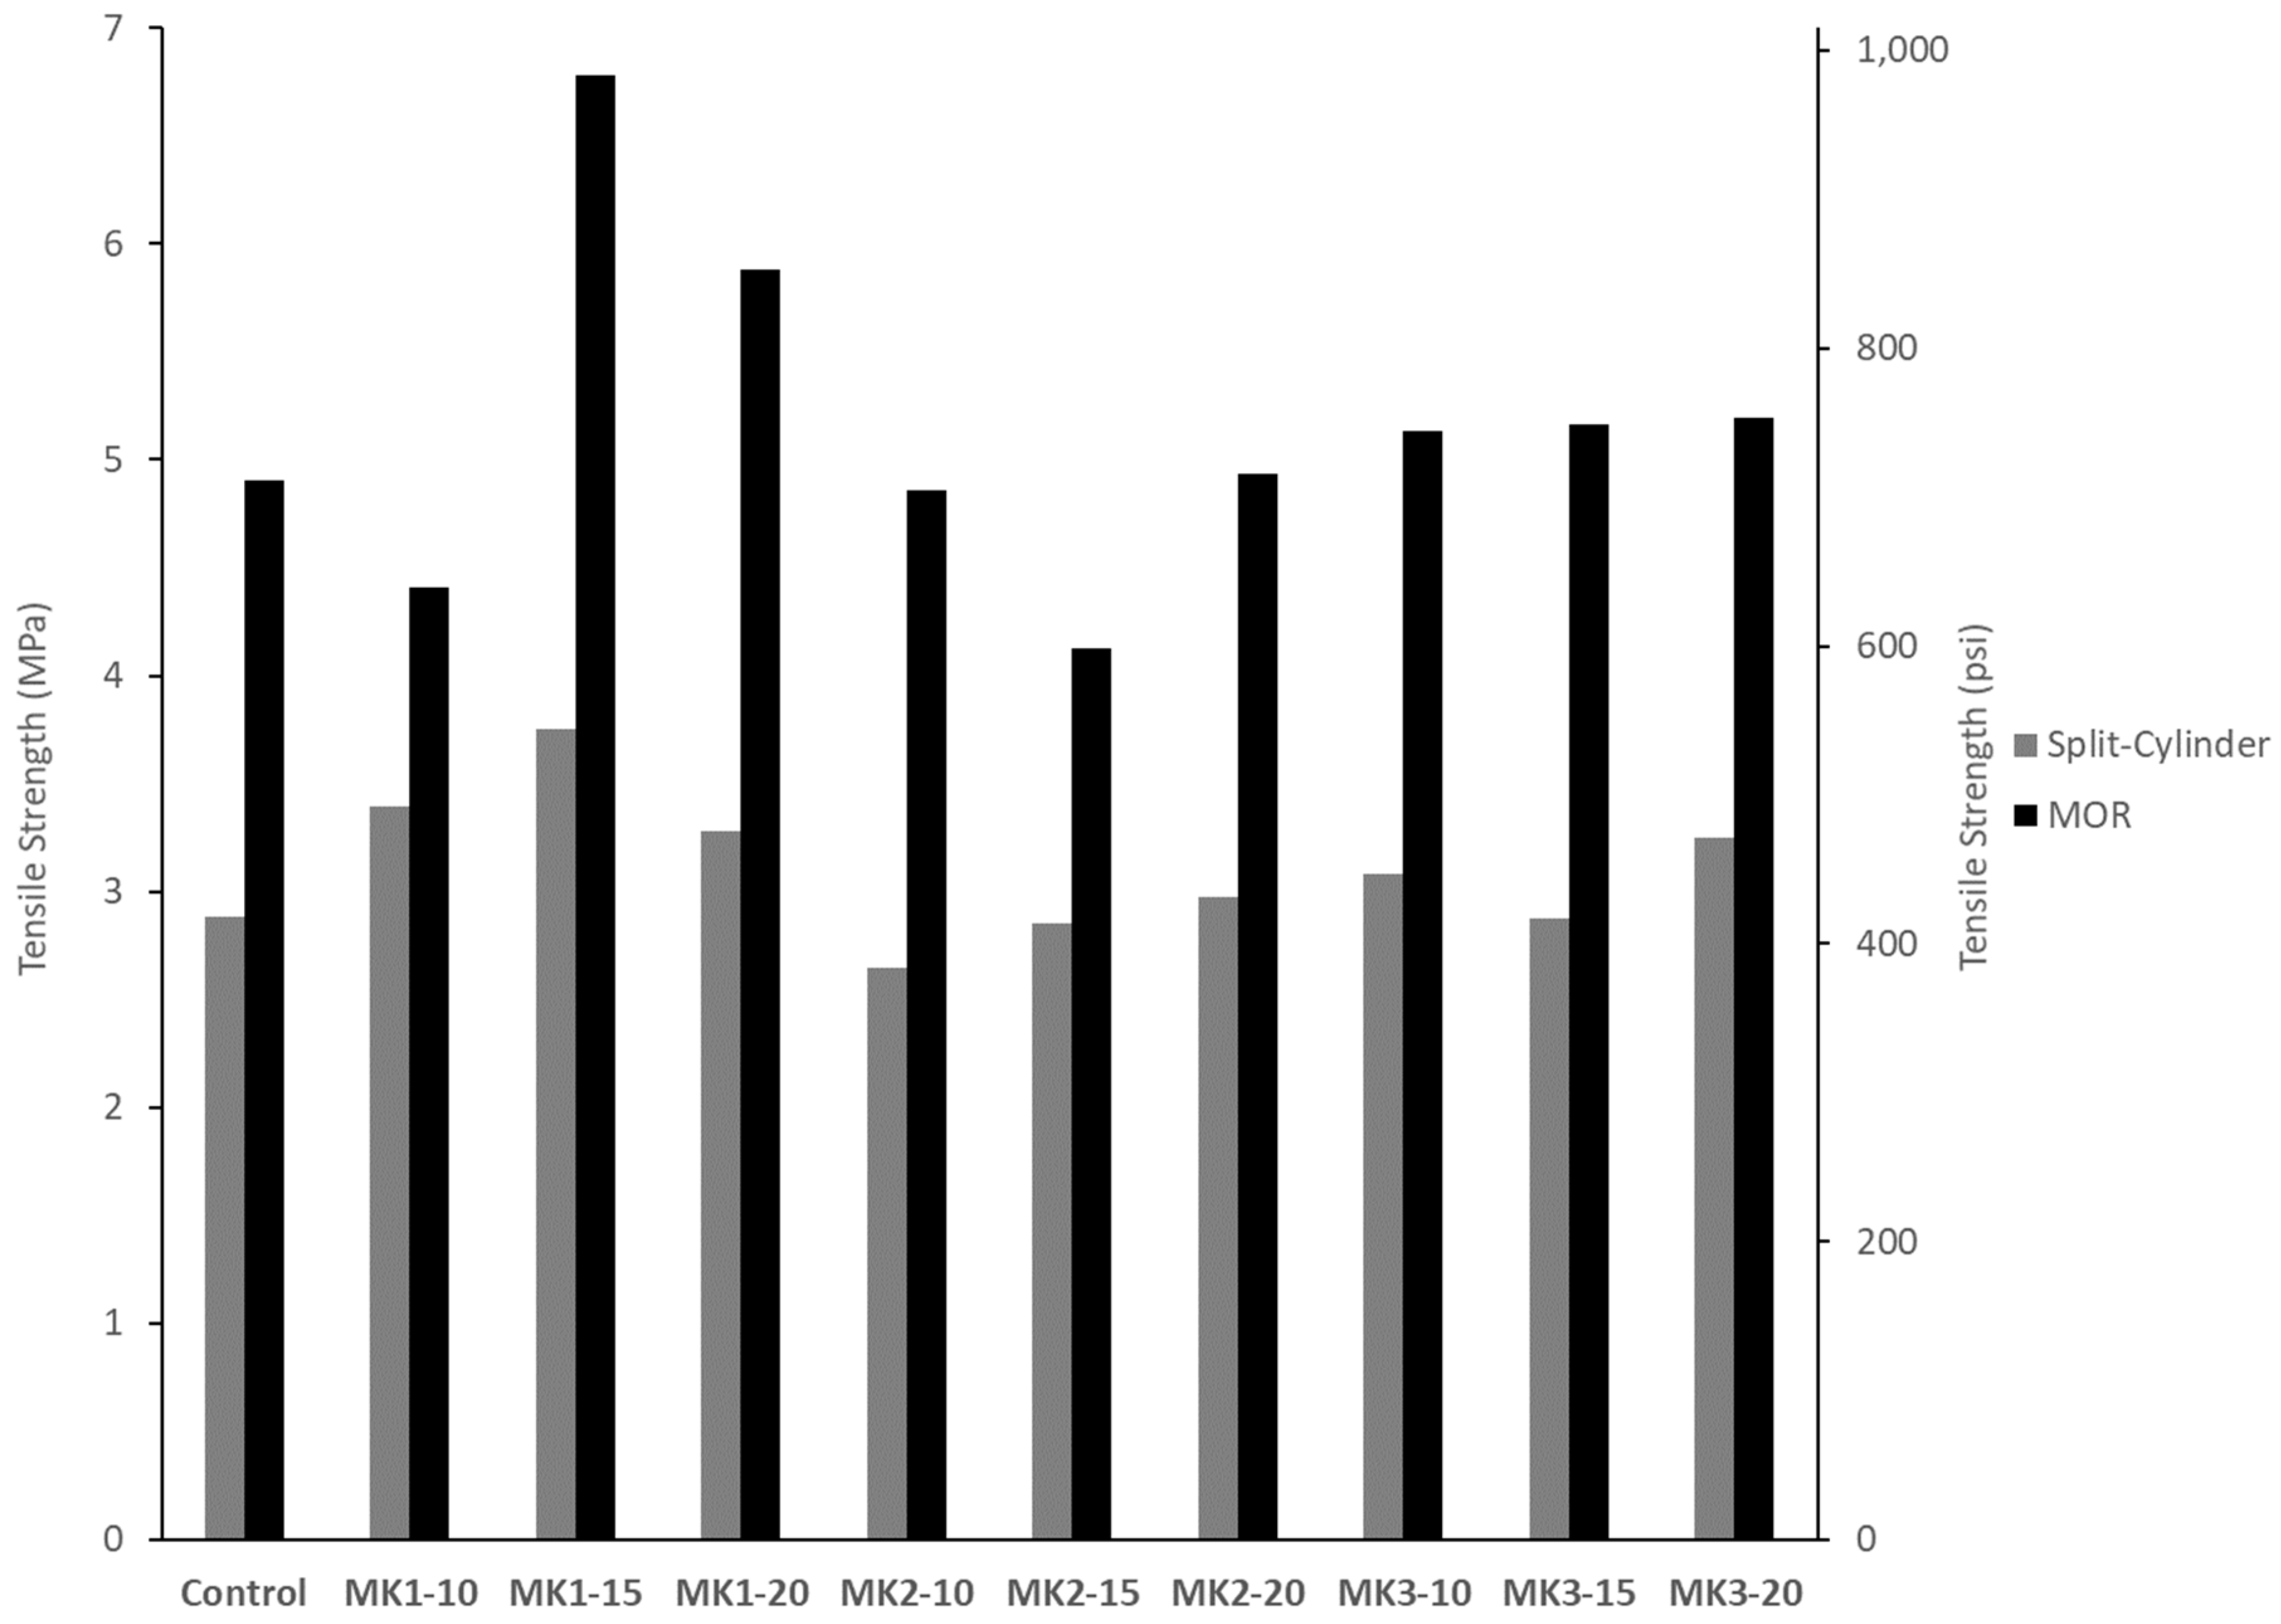
Two tests of tensile strength were performed. Split-cylinder tensile strength was tested using 100 mm × 200 mm cylinders, and in a procedure consistent with ASTM C496. Three specimens were broken at an age of 28 days, and the tensile strength was taken as the average. The loading rate was 130 N/s. The second test of tensile strength was the MOR. Three prisms of dimension 150 mm × 150 mm × 550 mm were broken by third-point loading (ASTM C78) at an age of 28 days, and the average breaking strength was taken as the MOR.
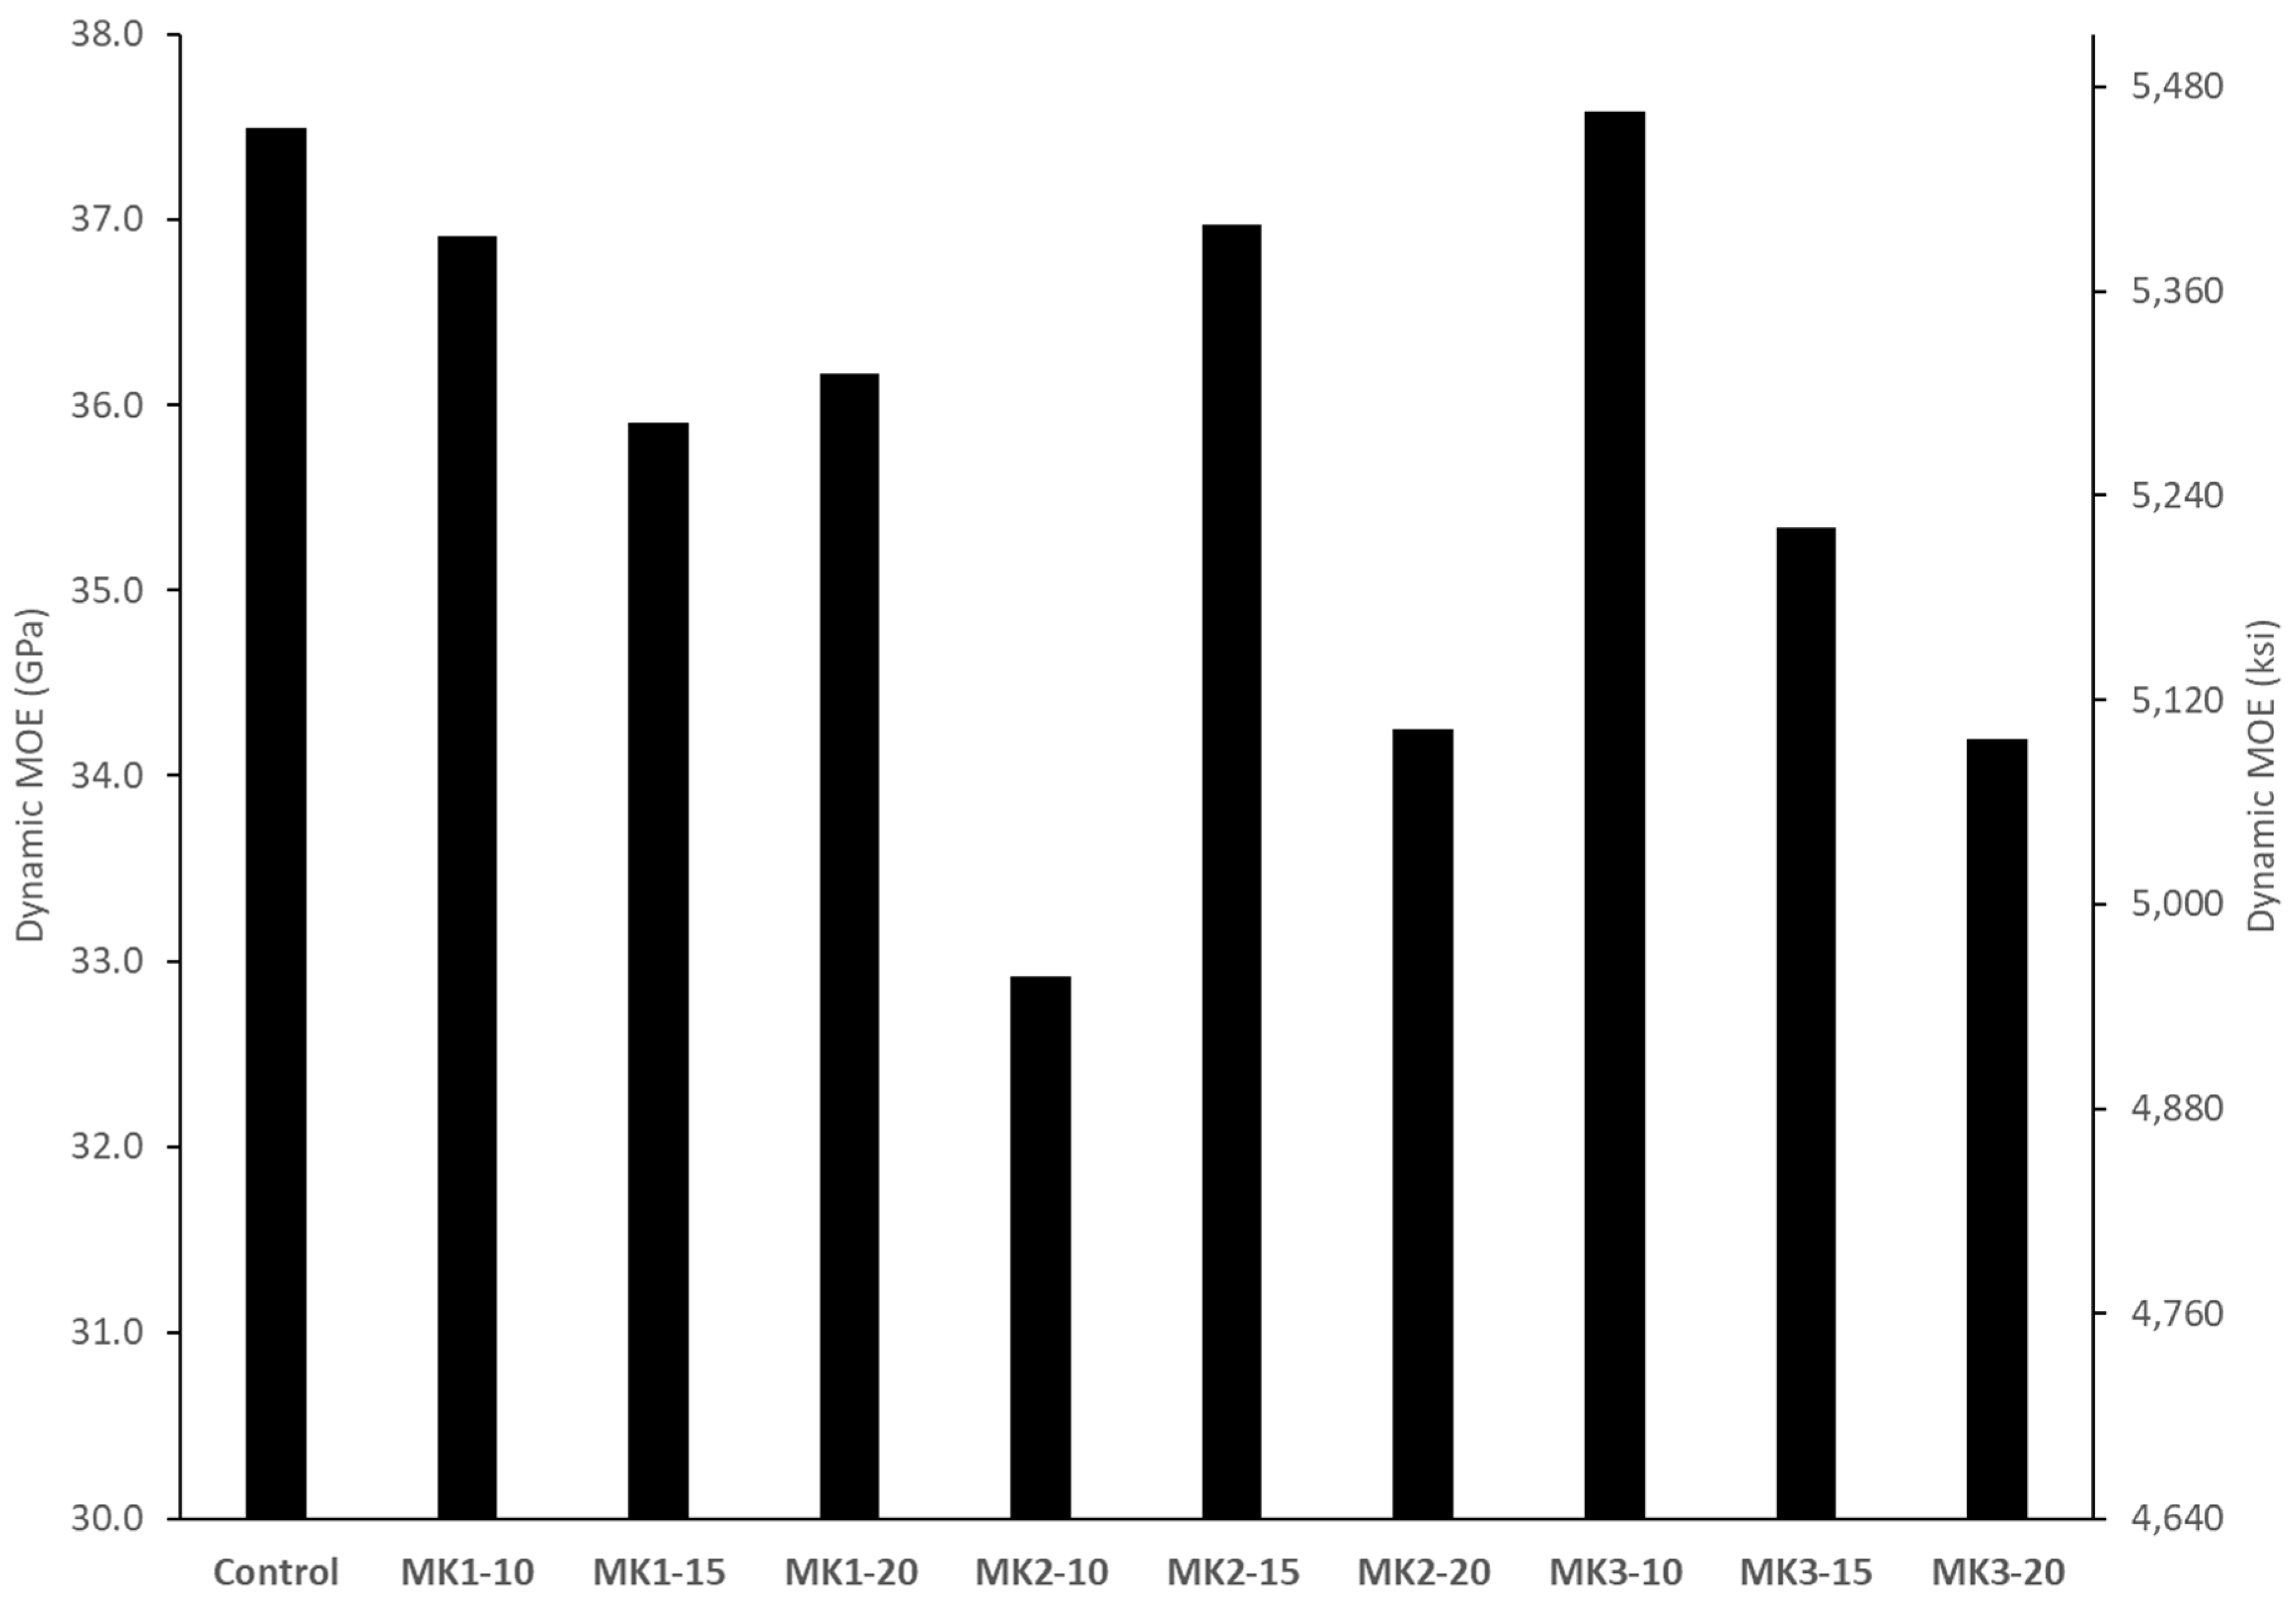
Tests to obtain the dynamic modulus of elasticity (Ed) were performed on 100 mm × 200 mm cylinders at an age of 28 days. The method used a longitudinal resonant frequency to calculate the dynamic modulus, which was obtained by the forced resonance method outlined in ASTM C215. The method for calculating Ed is provided in Equation. 2, where n′ = longitudinal frequency [Hz], M = mass of specimen [kg], and D = 5.093 × (length/diameter2) [m−1]. Dimensions for length and diameter were taken as the average of three measurements.
Ed = DM(n′)2

2.4.3. Durability

Three tests for durability were performed: one on concrete specimens, and two on mortar specimens. Concrete specimens were laboratory-molded in accordance with ASTM C192, and cured in a lime-saturated bath until the day of testing per ASTM C511.
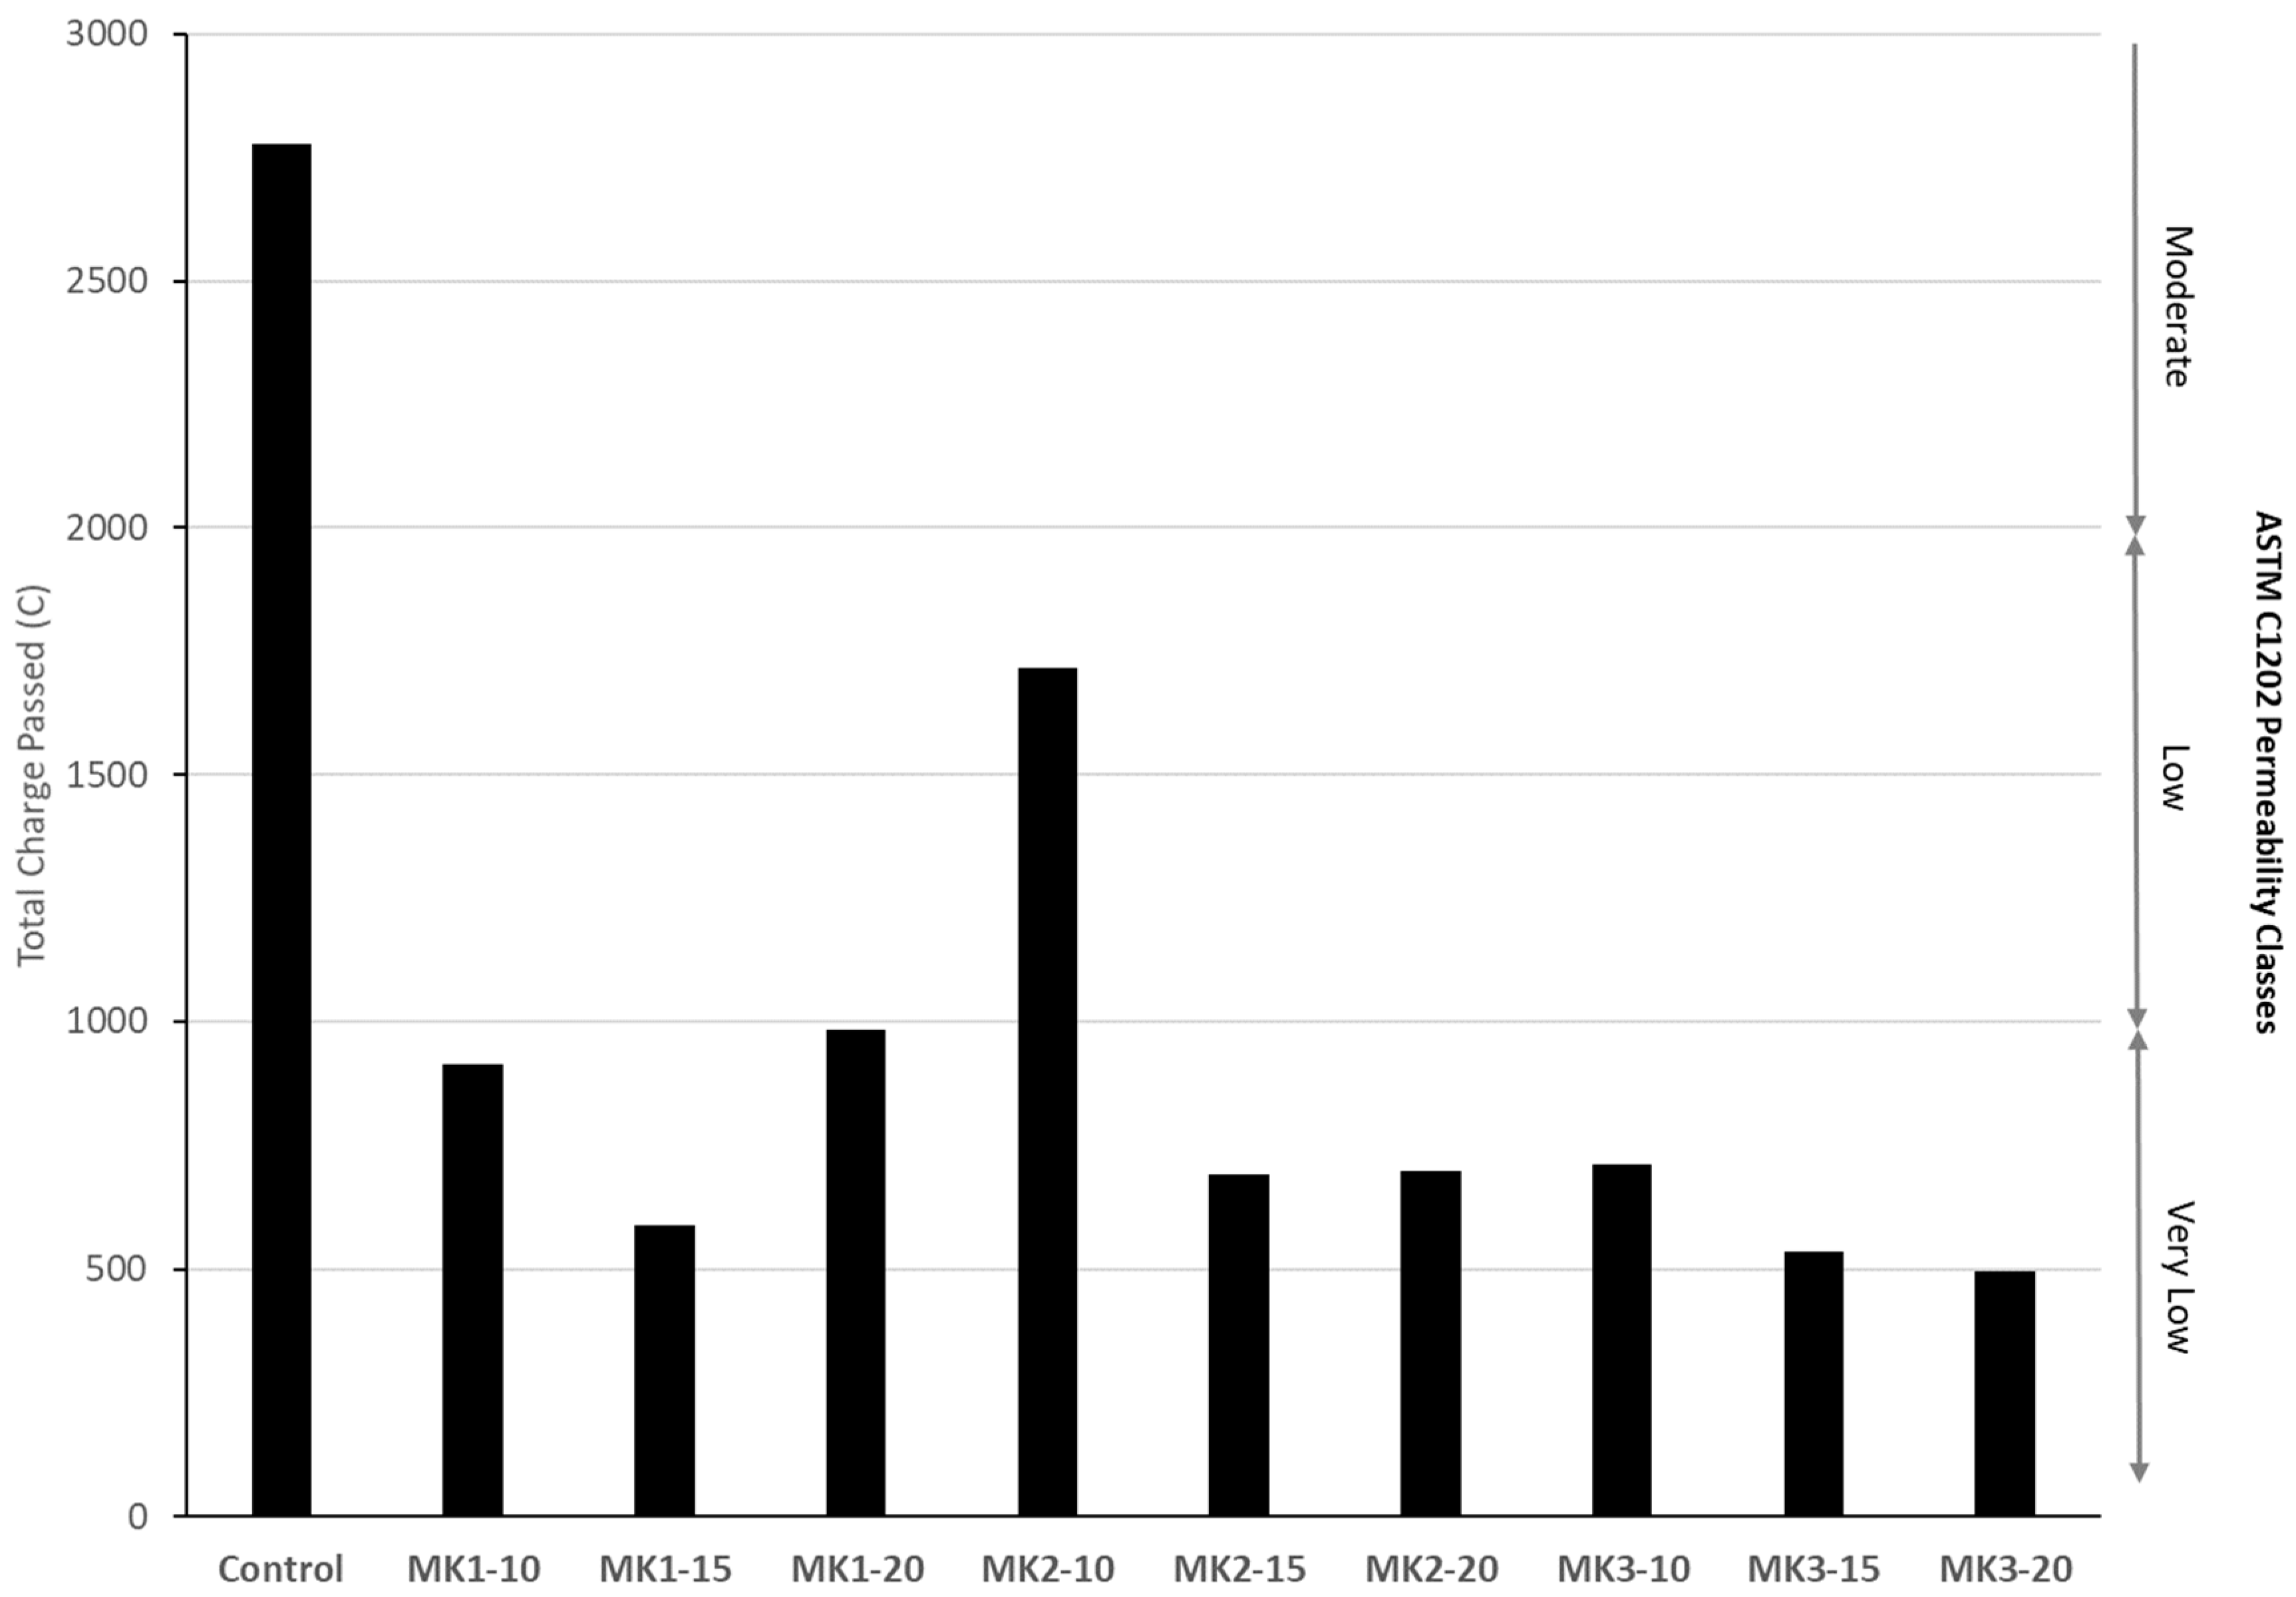
Permeability of concrete specimens were tested indirectly via rapid chloride-ion penetrability testing (RCPT) at an age of 28 days. Two 100 mm × 50 mm discs were cut from the top (most permeable section) of 100 mm × 200 mm cylinders by a diamond-tipped saw. RCPT was performed in accordance with ASTM C1202 for 6 h. The total charge, Coulombs (C), passed through each of the specimens was measured, and the average of the two was used as the measure of permeability.
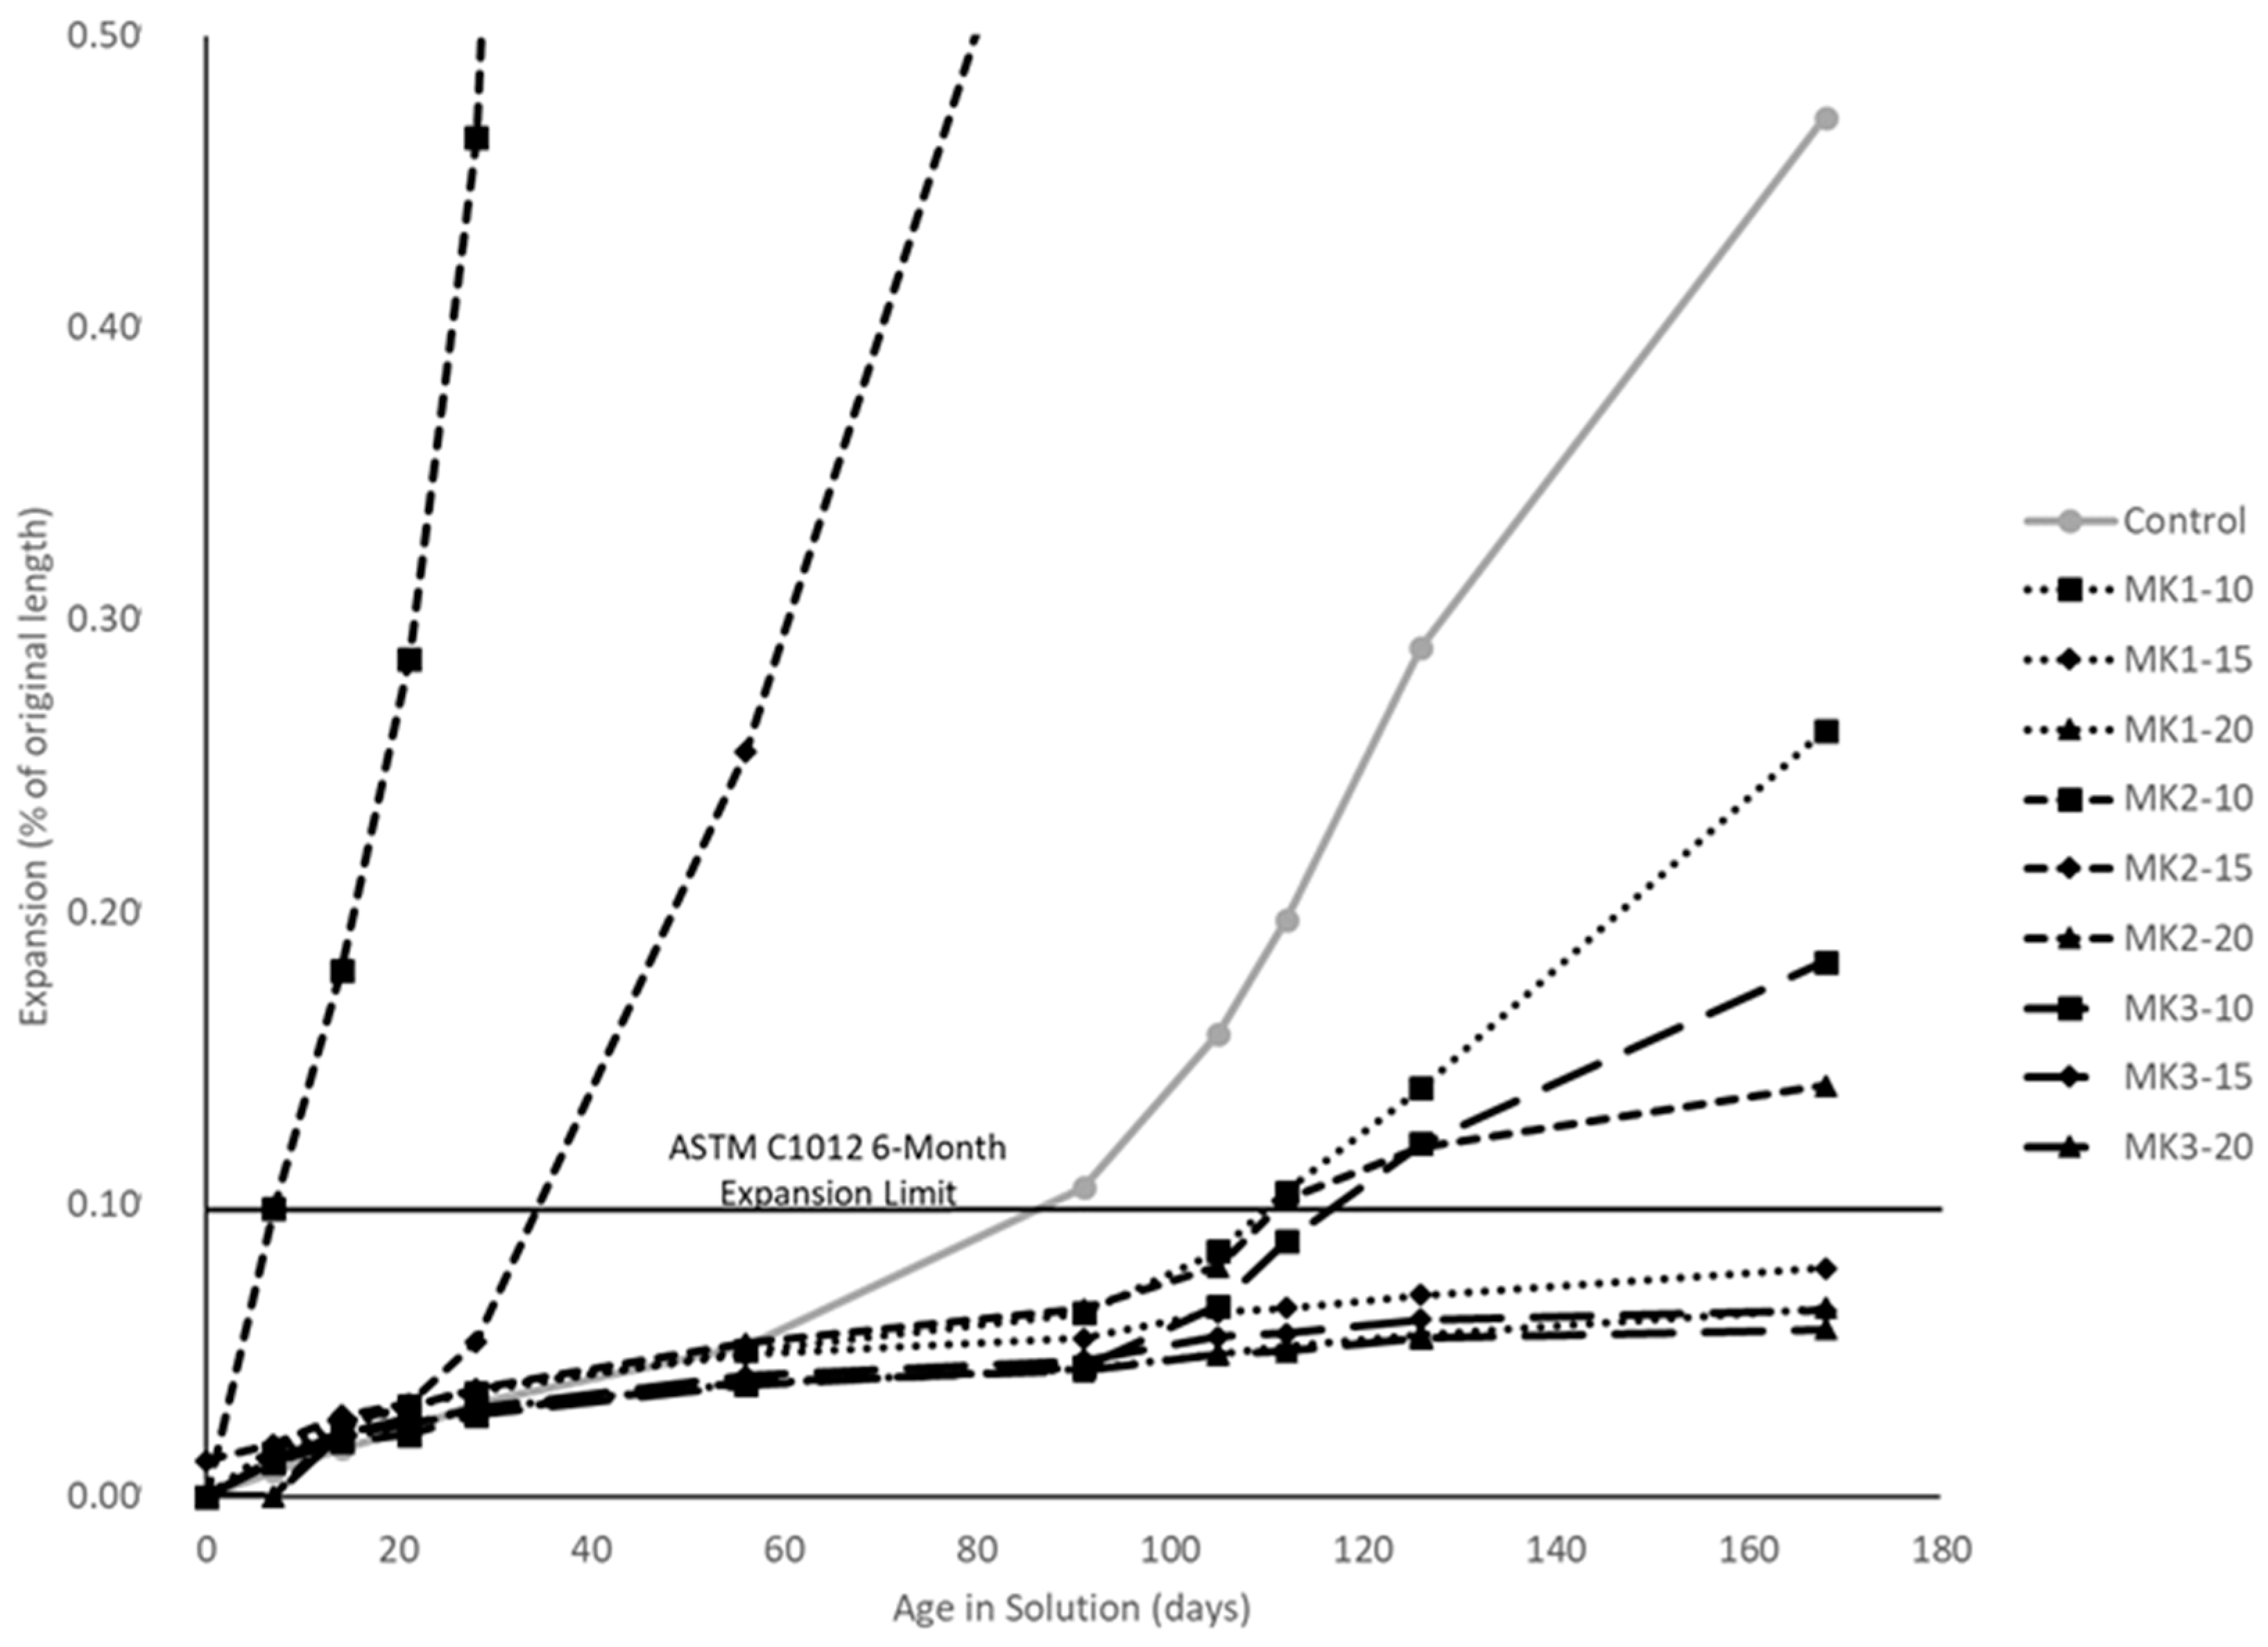
Resistance to sulfate attack was tested per ASTM C1012. Six mortar prisms of dimension 25 mm × 25 mm × 280 mm, and six mortar cubes of dimension 50 mm × 50 mm × 50 mm were batched and stored at 35 °C for 24 h. The specimens were then released, their lengths measured, and immersed in a lime saturated bath. The cubes were periodically broken per ASTM C109 until two cubes averaged above 20 MPa. Once the cubes tested above the required strength they were immersed in plastic containers with 0.75 l of aqueous Na2SO4 solution per mortar bar. The concentration of Na2SO4 was 40 g/L. Measurements were taken at ages of 7, 14, 21, 28, 56, 91, 105, 112, 126, and 168 days after first being immersed in solution. At each of the standard intervals (excluding 126 days), the solution was replaced. The expansion at any time was taken as the average of the six specimens. Expansion was measured as percentage length change. Any mixture with a percent expansion less than the standard limit of 0.01% at the end of the 6-month testing period was determined to effectively reduce the risk of sulfate attack.
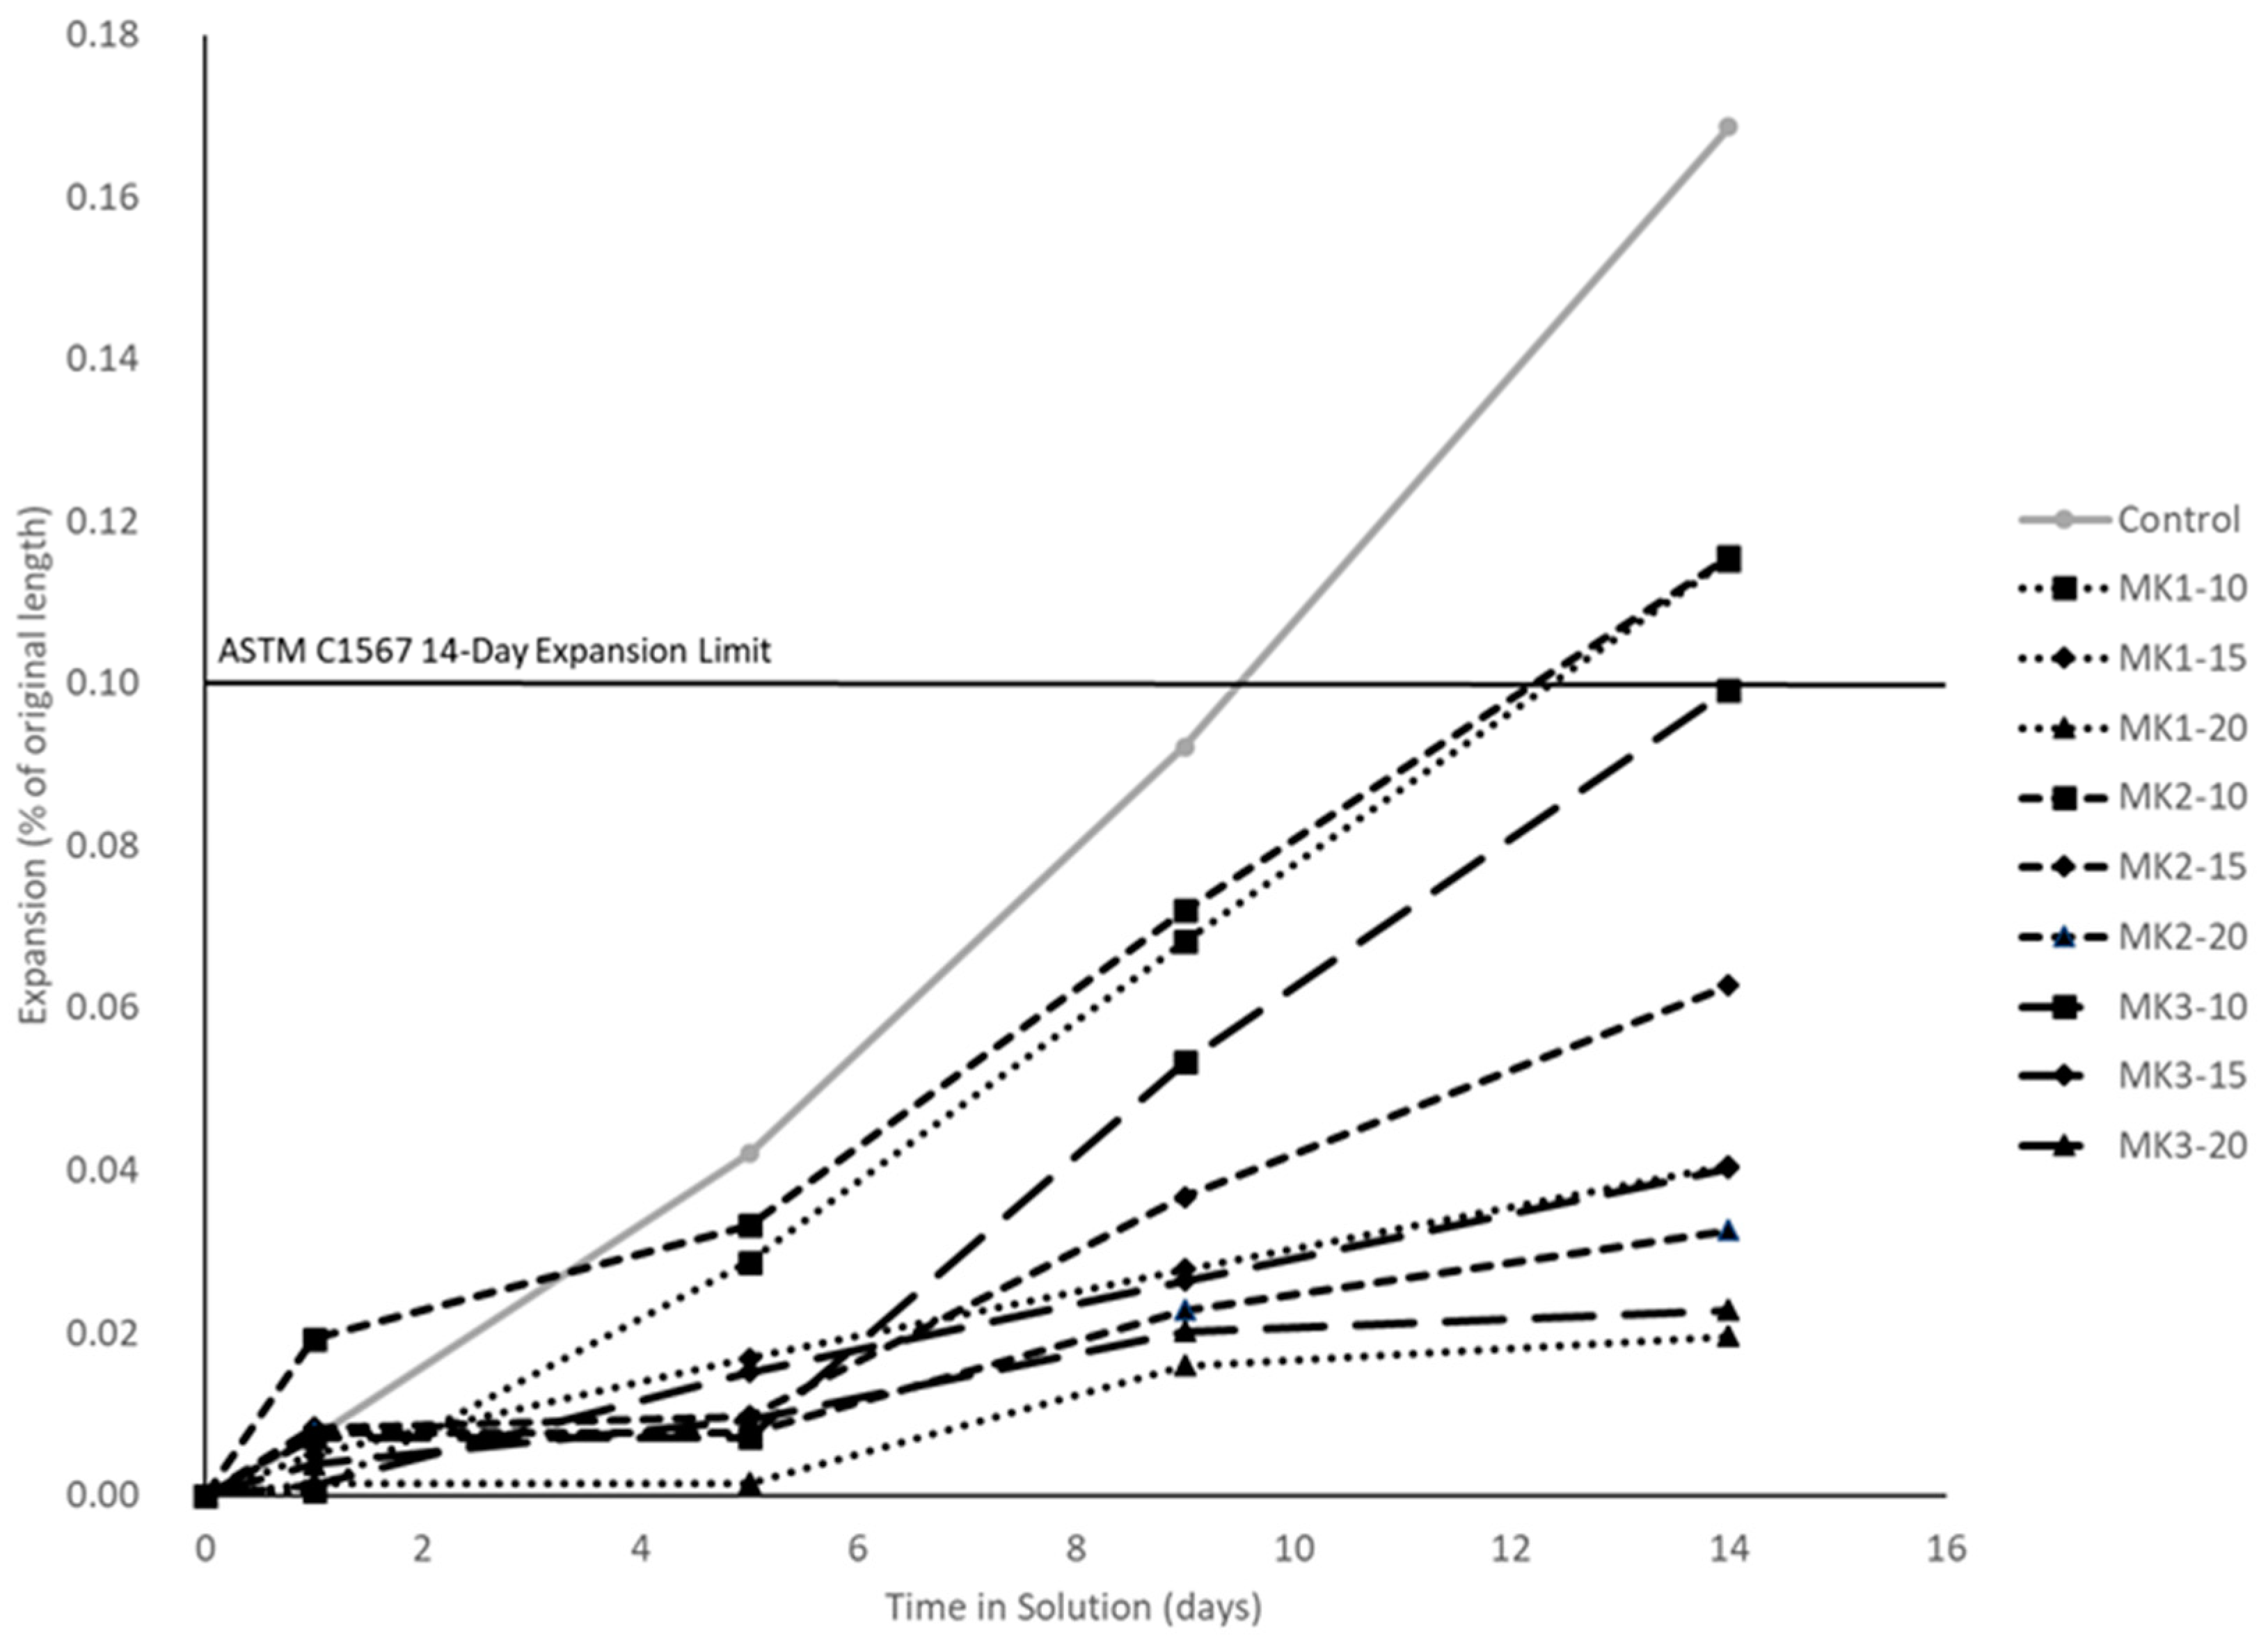
Resistance to ASR was determined by ASTM C1567. Three 25 mm × 25 mm × 280 mm mortar bars per mixture were batched, and burlap cured for 24 h where the ambient temperature was 23 °C. The bars were released from the molds at 24 h of age and immersed in 80 °C tap water for a period of 24 h. An initial comparator reading was then taken, and the specimens were immersed in an aqueous NaOH solution (40 g/L) at 80 °C for the remainder of the testing period. After this time, the specimens are measured with a length comparator and immersed in the NaOH solution for 14 days. Standard measurements were made at 1, 5, 9, and 14 days after immersion into solution. The expansion at any time was taken as the average of the three specimens. Any mixture with an expansion less than the expansion limit of 0.01% at the end of the 14-day testing period was the determined to effectively reduce the risk of ASR expansion.

2.4.4. Dimensional Stability

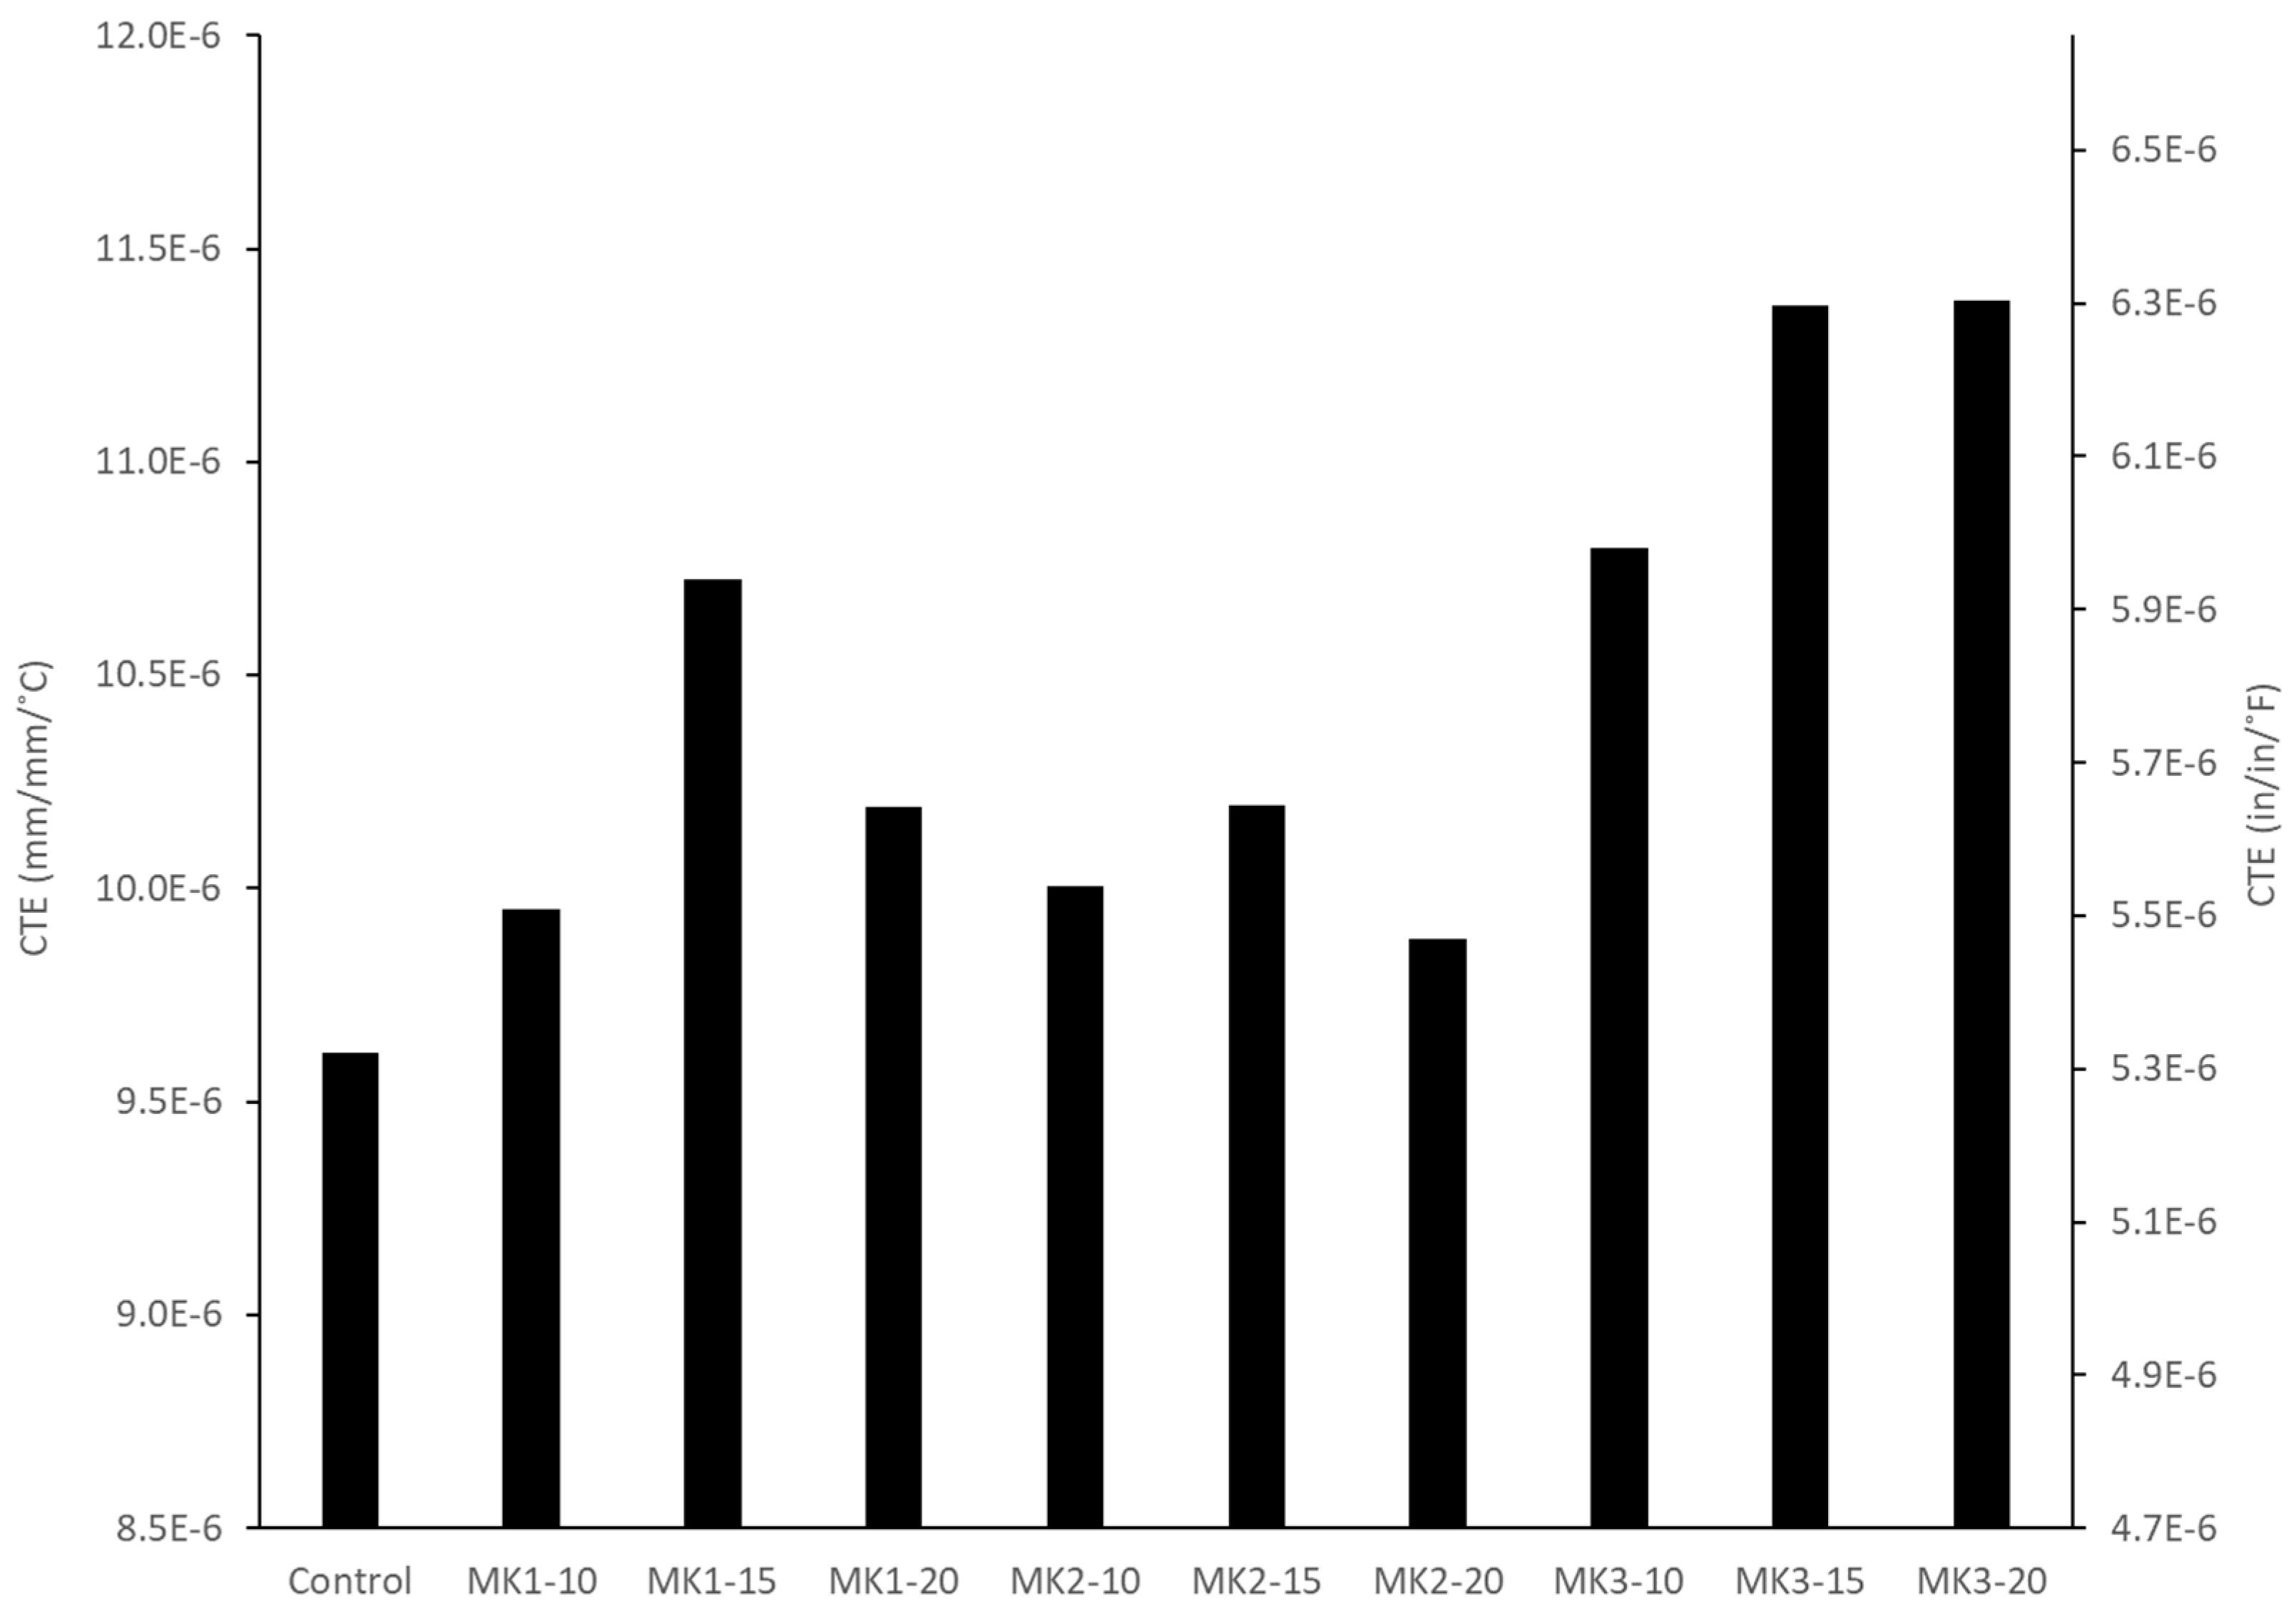
Testing for the coefficient of thermal expansion (CTE) of concretes was performed in accordance with AASHTO T336. Three 100 mm × 200 mm concrete cylinders were subjected to three heating and cooling cycles (10 °C to 50 °C) in a water bath, and the dimensional change was measured using a LVDT (sensitivity = 0.001 mm). Linear expansion was assumed, and the CTE (mm/mm/°C) was taken as the average thermal strain experienced over the 40 °C temperature gradient. The average of three specimens was taken as the CTE value for a given mixture.
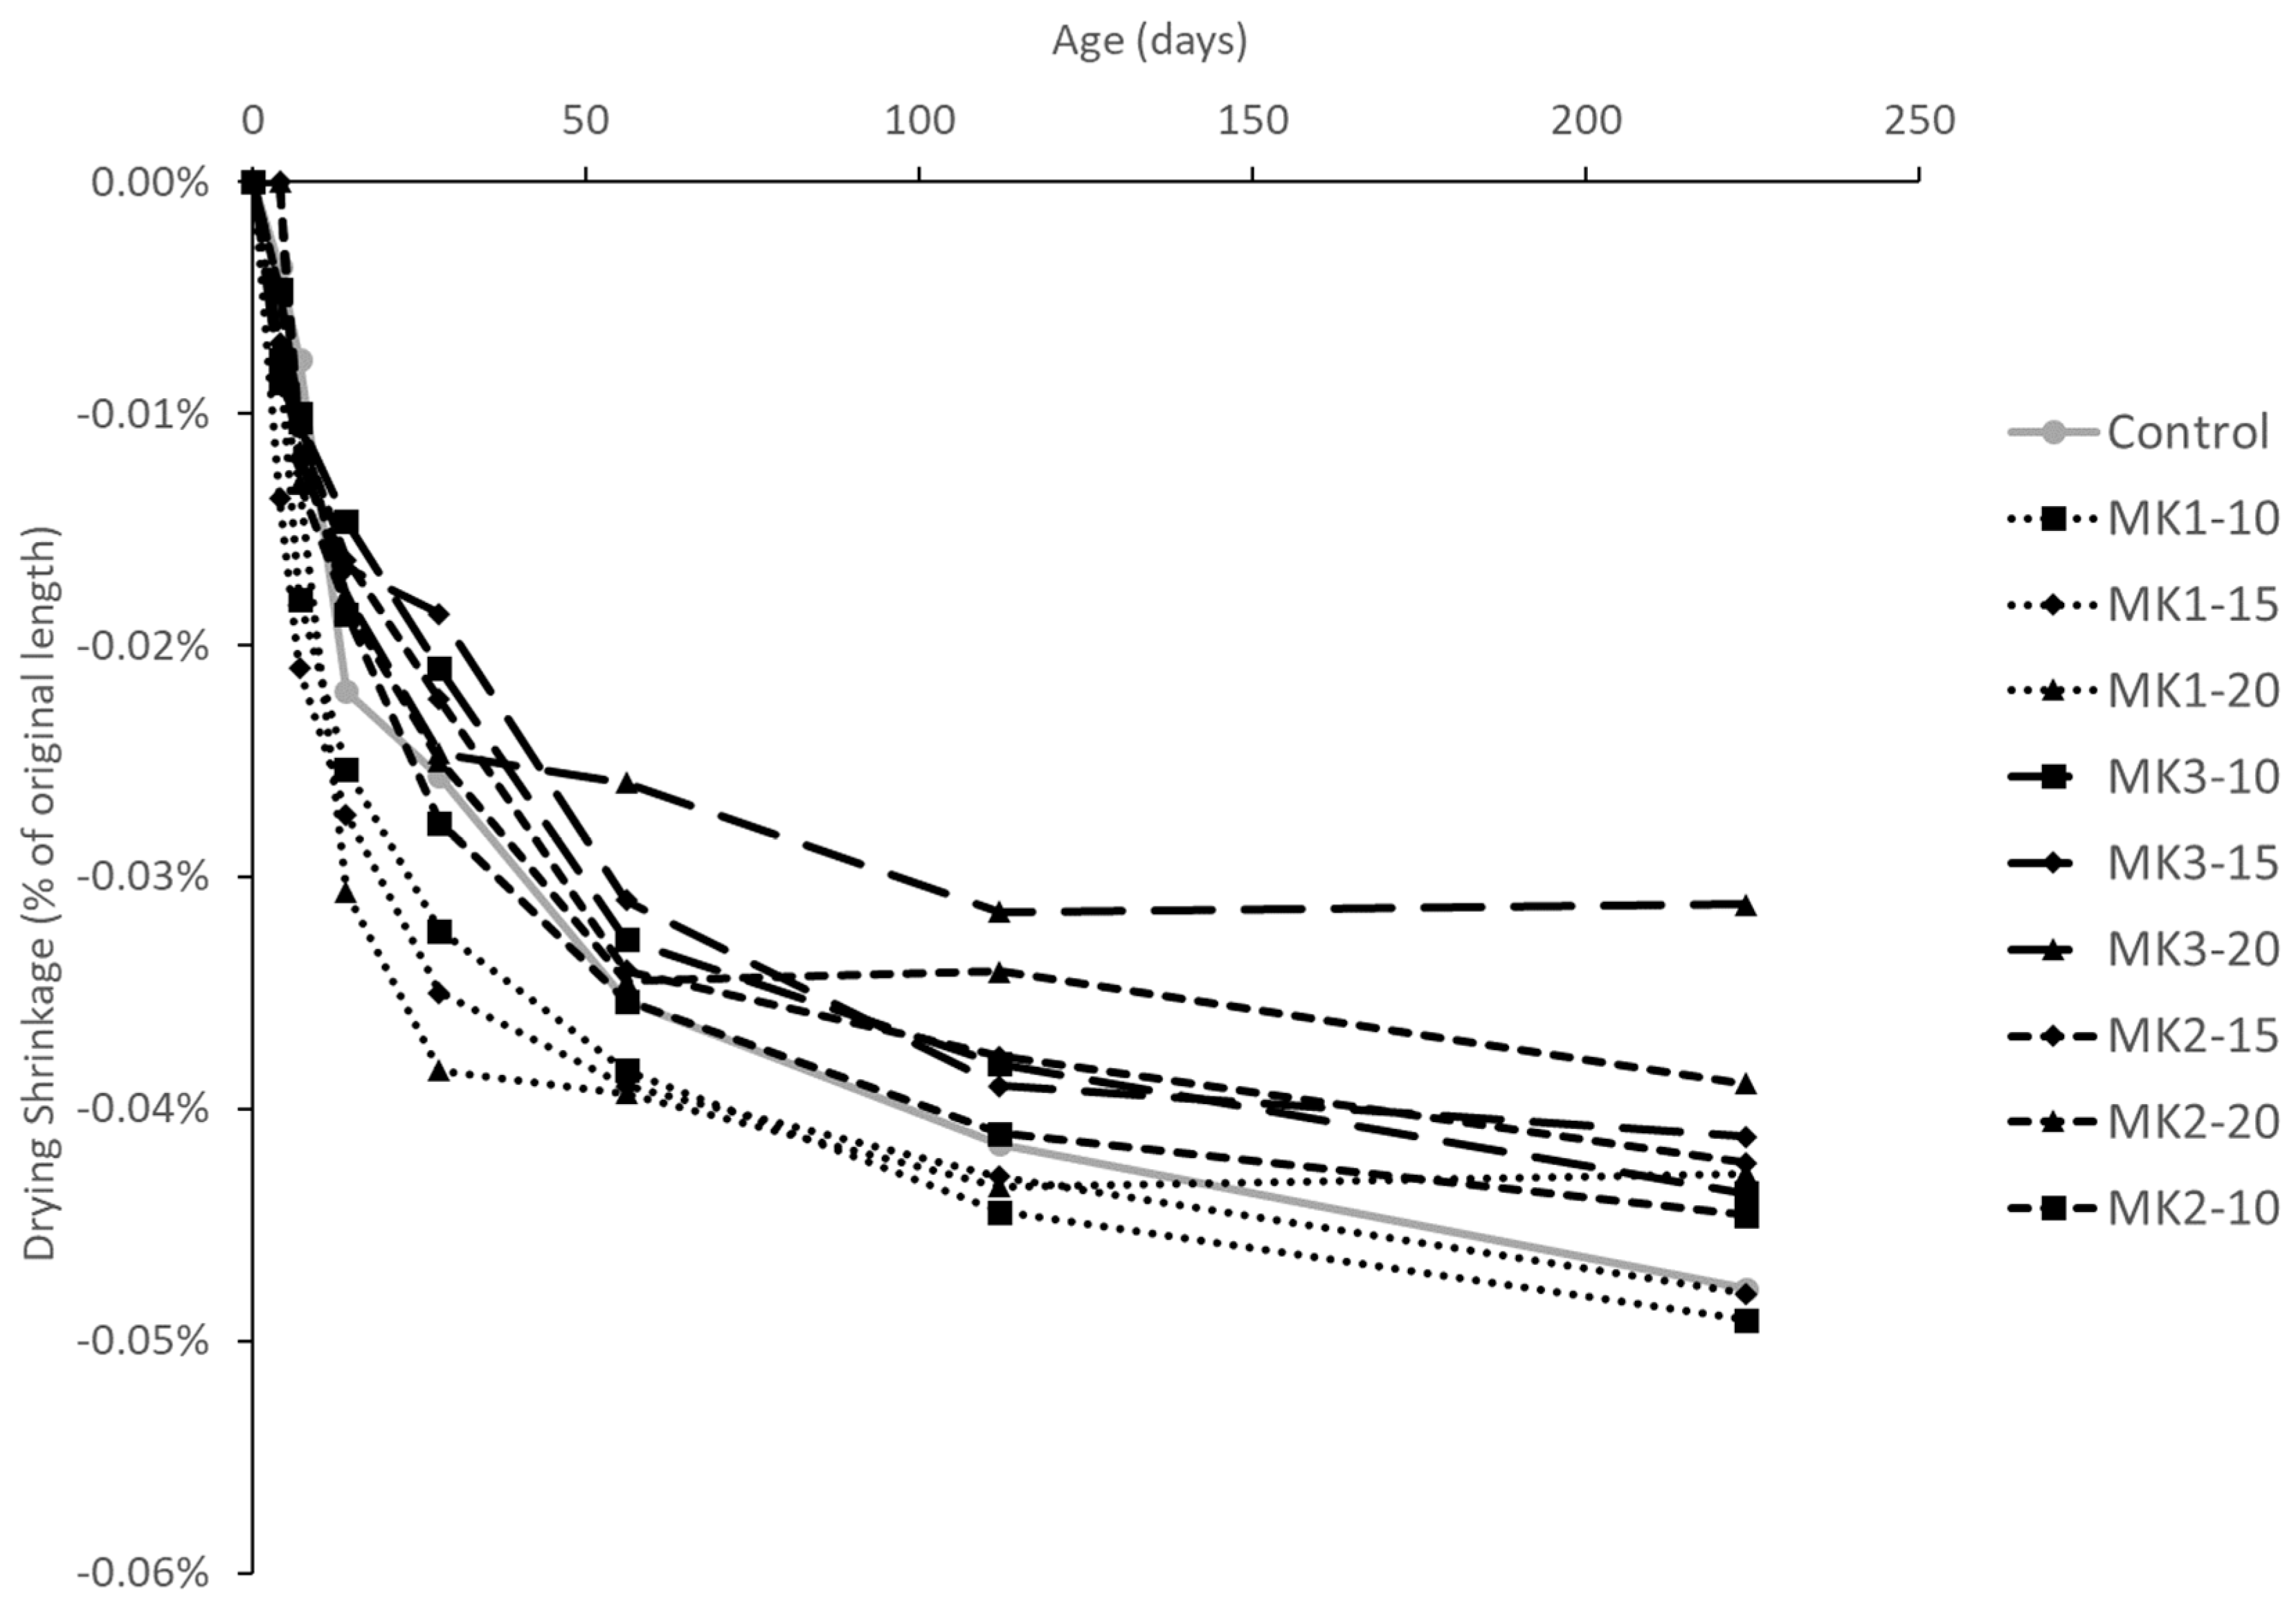
Drying shrinkage was performed in accordance with ASTM C157. Three 100 mm × 100 mm × 280 mm rectangular prisms were cast at the time of batching, and cured in a lime saturated bath after being released from the molds at 24 h of age. At an age of 28 days, the prisms were removed from the bath and allowed to air dry on a shelf while being supported at either end by wooden blocks. The room containing the specimens maintained an ambient temperature of 22 °C and 50% relative humidity. Drying shrinkage measurements were taken at concrete ages of 32, 35, 42, 56, 84, 140, and 252 days using a length comparator. Length change as a percentage of the nominal gauge length (250 mm) were calculated and reported as the average percent change of the three prisms.

3. Results

3.1. Fresh Concrete Properties

Unit weight, air content, and slump were measured for all concrete mixtures just after batching. The unit weights varied from 2297 kg/m3 to 2399 kg/m3. Air contents typically ranged from 2.0% to 8.5% as shown in Table 4. The superplasticizer dosage was chosen individually for each mixture based upon small-batch preliminary mixtures. This was done for two purposes: metakaolin supplemented concrete mixtures have been shown to have a high superplasticizer requirement, and the authors wished for the mixtures to be as comparable as possible in workability. The reason for this is that concrete slump is typically specified. The slumps range from four cm to 21 cm. Figure 2 displays the slump and plasticizer dosage for each mixture. Concrete mixtures including metakaolin can be seen to require a minimum of double the superplasticizer dosage of the control mixture, particularly when the slump-to-dosage ratios are considered, although MK1 and MK2 (10%) appear to have little effect on the concrete workability in Figure 2.

3.2. Mechanical Properties

3.2.1. Compression

Metakaolin products varied widely in their effect on compressive strength. MK1 caused a systematic increase in compressive strength with increasing levels of replacement, with the highest compressive strength at 28 days of age being 77 MPa (MK1-20). Compressive strengths measured 17–44% higher than control at 28 days of age across all replacement levels for MK1 mixtures. Rates of strength increase from 1–7 days were higher than control for the 15% and 20% replacement levels, and the one-day strengths for all replacement levels were an average of 28% (4 MPa) higher than control. Concrete specimens incorporating MK2 exhibited an optimum 28-day compressive strength at a replacement of 15% (64 MPa, 19% higher than control). While MK2-20 also yielded higher 28-day compressive strengths, MK2-10 yielded a 7% reduction in compressive strengths when compared to control, and showed a lower rate of strength gain after one day of curing when compared to control. However, the 15% and 20% replacement levels yielded higher rates of strength gain when compared to control between one and seven days. Overall, strength gains for MK2 ranged from 6–19%. MK3 performed consistently for all replacement rates, with the highest 28-day strength of 66 MPa (21% increase) contributed to the 15% replacement level. MK3-15 also showed a notable 43% higher compressive strength than control at one day of age. Regardless of replacement rate, MK3 showed no lower than a 15% increase in compressive strength over control at 28 days. Overall, only one mixture (MK2-10) did not exhibit a higher 28-day compressive strength than control. These increases range from 6% to 44%. The compressive strength evolution of the binary metakaolin mixtures is illustrated in Figure 3. Table 4 shows the fresh and hardened concrete properties for all concrete mixtures. Air contents typically ranged from 2.6–4.5% with a single outlier of 8.5% for MK2-10, which explains the reduced compressive strength. This mixture was repeated multiple times to confirm the findings. Table 5 shows the mean and standard deviation of the 28-day strength. MK2-10 is a clear outlier for the 95% confidence level.

3.2.2. Tensile Strength

The split-cylinder tensile strength of the control mixture was 2.88 MPa, and the MOR was 4.90 MPa. MK1-15 recorded both the highest split-cylinder tensile strength and MOR: 30% and 38% higher than control, respectively. Only one test of tension for MK1, MK1-10, produced a tensile value less than control (10%). Other than this value, MK1 saw increases of split-cylinder tensile strength between 14–30%, and increases of MOR between 20–38%. MK2-20 recorded similar split-cylinder and MOR values to control, and decreases in strength for the other two replacement levels were as high as 16% (MK1-15 MOR) when compared to control. All measures of tension for MK3 were the same or higher than control. The optimum replacement level for this metakaolin was 20%, with the split-cylinder tension 13% higher than control, and the MOR being 6% higher. Overall, MK3 exhibited split-cylinder strength increases between 0–13%, and MOR increases between 5–6%. Finally, MK1 yielded the most dramatic increases in tensile strength, and indicated a clear optimum replacement level of 15%. However, MK3 resulted in moderate increases in strength that were consistent among replacement levels. Overall, MK2 caused a reduction in strength. A bar graph comparing the split-cylinder and MOR tensile strengths can be seen in Figure 4. Table 5 indicates that MK1-15 is an outlier for the 95% confidence level although the standard deviation is relatively small.

3.2.3. Dynamic Young’s Modulus

The dynamic measures of Young’s modulus of elasticity of the control mixture was 37.5 GPa. Decreases across all replacement levels of MK1, MK2, and MK3 were observed, excluding MK 3–10. Decreases ranged from 2–4% for MK1 concrete specimens, 1–12% for MK2 concrete specimens, and 0–9% for MK3 specimens. No obvious trend was found for these mixtures as illustrated in Figure 5. Table 5 provides the standard deviation of 1.54 GPa due to a significant outlier of MK2-10.

3.3. Durability

3.3.1. Chloride-Ion Penetrability

Rapid Chloride Permeability Test (RCPT) indicates that metakaolin concrete mixtures, at all replacement percentages, achieved significantly lower permeability than the control. All MK1 mixtures belonged to the ‘very low’ permeability class (less than 1000 coulombs passed), with MK1-15 displaying the lowest permeability at 588 coulombs (C). MK2 required a 15% replacement or greater of cement before reaching the same permeability class, as MK2-10 passed a total of 1718 C. MK2-15 and MK2-20 passed 693 C and 697 C, respectively. MK3 achieved the lowest permeability, with the lowest being 496 C by MK2-20. However, other MK3 replacement levels performed similarly, with the highest being 712 C. Overall, all metakaolin concretes were classified as having a ‘very low’ permeability, excluding the aforementioned MK2-10 mixture. Figure 6 provides a visual representation of the RCPT results along with indicators for the permeability classes. It should be noted that MK2-10, while passing the most charge of any binary metakaolin mixture, was classified in a lower permeability class than the control. Concrete permeability affects durability because it influences the intrusion rate of moisture that could contain aggressive chemicals. Table 5 indicates that MK2-10 is a significant outliner.

3.3.2. Alkali–Silica Reactivity

As previously mentioned, according to ASTM C1567, an SCM combination has sufficiently mitigated expansion due to ASR if mortar specimens achieve an expansion of less than 0.10% of its original length at the end of the 14-day testing period. The ultimate expansion of the control mixture was 0.17%. A consistent, systematic trend of increased ASR resistivity can be seen as metakaolin replacement levels increase. For MK1 and MK2, a 15% replacement level was required to meet this expansion criterion. MK3 was the only metakaolin that was able to meet this criterion at all replacement levels, though MK3-10 expansion was exactly 0.10% at the end of the 14-day testing period. MK1-15 and MK3-15 performed very similarly, with an ultimate expansion of 0.04%. At the 20% replacement level, MK1-20 achieved the lowest ultimate expansion at below 0.02%, while MK3-20 was just over 0.02%. A time history of the expansions is shown in Figure 7.

3.3.3. Sulfate Resistance

The 6-month (24 week) expansion criterion set in ASTM C 1012 is 0.10% of the original length of the mortar bar. The control mixture exceeded this expansion limit, and ended the testing period with a total expansion of 0.47%. All mixtures consisting of a 10% replacement failed to meet the expansion criterion. Most notably, mortar bars for mixtures MK2-10 and MK2-15 deteriorated before they could reach the end of the testing period (91 days and 112 days, respectively), while MK2-20 also failed to meet the criterion. Expansions in excess of the control for mortars including metakaolin have been previously documented [31]. MK1 and MK3 sufficiently limited expansions at replacement levels of 15% and 20%. The systematic increase in sulfate resistance with increasing replacement levels is presented in Figure 8.

3.4. Dimensional Stability

The CTE of the control mixture was 9.61 × 10⁻⁶ mm/mm/°C. All binary concrete mixtures containing metakaolin exhibited higher CTEs than control. MK1 recorded a high of 10.71 × 10⁻⁶ mm/mm/°C (MK1-15) and a low of 9.95 × 10⁻⁶ mm/mm/°C (10%). MK2 generally yielded lower CTEs than did either MK1 or MK3, and had the lowest binary CTE equaling 9.88 × 10⁻⁶ mm/mm/°C for MK2-20. Finally, MK3 concrete specimens consistently observed the highest CTEs that ranged from 10.80 × 10⁻⁶ mm/mm/°C to 11.38 × 10⁻⁶ mm/mm/°C. MK1 and MK2 exhibited a peak CTE at a 15% replacement, with the 10% and 20% replacements seeing lower CTEs. However, MK3 showed no reduction in CTE from the 15% replacement level to the 20% replacement level. A bar graph of these results is shown in Figure 9.
Figure 10 shows the shrinkage results. Ultimate drying shrinkage of concrete specimens containing metakaolin were predominantly lower than control. The 242-day drying shrinkage of the control mixture was 0.048%. One mixture, MK1-10 was slightly larger at 0.049%. For each product, the overall drying shrinkage decreased systematically with increasing replacement levels. For MK1 these values decreased from 0.049% to 0.039%. For MK2 shrinkage, values decreased from 0.045% to 0.039%. Finally, MK3 concrete mixtures decreased from 0.044% to 0.031%, with MK3-20 showing the lowest drying shrinkage in this study.

4. Analysis of Results and Discussion

4.1. Summary

Table 6 provides the summary of results [32] for all mixtures compared to the control mixture. In the sulfate and ASR resistance, the ‘pass (P)’ and ‘fail (F)’ indicate metakaolin supplemented mixtures that met and did not meet the 0.1% expansion threshold limit.

4.2. Replacement Levels

With each product, the replacement levels that achieved the highest 28-day compressive strength also achieved the highest seven-day compressive strength. Moreover, the variation was low in these seven-day strengths. Figure 3d shows this tight clustering of seven-day strengths from all products at their ‘optimum’ replacement levels (54–56 MPa). It is worth noting that when these replacement levels were the same (MK2-15 and MK3-15), the rates of strength gain were very similar at all ages. It is only when the ‘optimum’ replacement is at 20% (MK1-20) that much higher compressive strength gain is seen after seven days of age. The tight clustering of the seven-day compressive strength values is considered to be the result of similar oxide composition (Table 2); this is not a poignant statement, as these metakaolins are being tested specifically because they are commercially-available HRMs (Al2O3 + SiO2 + Fe2O3 ≥ 90%). However, because some of the pozzolanic reaction is reported to be completed between 7 and 14 days of age [18], comparable seven-day compressive strengths may indicate a similar CH consumption and C-S-H formation rates from all metakaolins when their ‘optimum’ replacement level is used [18]. While this explanation would be consistent with MK1-20 having additional strength gain between seven and 28 days (additional pozzolanic activity between 7–14 days), it is unknown why MK1 displays a higher ‘optimum’ replacement level than the other two metakaolins.
Trends in the ‘optimum’ replacement level in compressive strength tests did not translate to the tensile strength results. MK1 yielded an optimum tensile strength at a 15% replacement rate, while MK2 and MK3 reached their optimum strengths at a 20% replacement rate. It should be noted that MK1 and MK2 showed much larger variations in their two measures of tensile strength. This is consistent with MK3’s compressive strength, in that there was less variation between replacement levels than the other two products. In fact, MK3 mixtures were more consistent across replacement levels than either of the other two metakaolins in all measures except in the dynamic measure of Young’s modulus. Here, MK3 exhibited the largest variation among any metakaolin products studied herein.
MK1 and MK3 were consistent in their ability to decrease permeability and increase resistance to chemical attacks. The inclusion of these metakaolins at all replacement levels resulted in very low RCPT permeability classifications, and beyond 15% replacement both products sufficiently mitigated deleterious expansion in aggressive solutions. In addition, MK2 was able to achieve the same permeability classification as the other two metakaolins at or above a 15% replacement level, and sufficiently mitigate ASR expansion only.

4.3. Abnormalities

MK2 had the highest fineness of the three metakaolins, and a similar oxide composition. Increased fineness of metakaolin has been shown to increase the rate of strength gain as well as the overall 28-day strength of concretes [14]. However, the inclusion of MK2 does not result in higher performance across all hardened concrete tests in this study when compared to the other two metakaolins.
Most dramatically, MK2-10 and MK2-15 deteriorated in sulfate solution in excess of control. Similar performance has only been recorded once in the literature, using a metakaolin with Al2O3 + SiO2 + Fe2O3 = 85% and a loss on ignition (LOI) of 14% [31]. In fact, Table 6 shows that MK2 exhibits significantly less performance for all replacement levels. Given this information, the following explanations of MK2’s poor performance are given:
  • MK2’s high fineness resulted in large agglomerations which were not properly deflocculated during the batching of the concrete. This would explain tensile strengths lower than control, but not the inordinate deterioration of the sulfate mortar bars.
  • An incomplete dehydroxylation of the metakaolin (see [8,33]) might have occurred because MK2’s alumina and silica contents were perhaps not as glassy as MK1 and MK3. This would explain the mechanical performance as well as the rapid destruction of MK2 sulfate mortar bars, as the non-amorphous kaolin would act as inert material. For compression and permeability, the inert kaolin would still contribute to particle packing [17], and the alumina content has shown to increase chloride-binding capacity [21,27]. Moreover, the fine material would still provide additional nucleation sites for cement hydration [18]. This does not explain why the optimum replacement level for tensile strengths was 20%. Therefore, an XRD analysis is highly recommended to verify the assumption.

4.4. Thermal Expansion and Shrinkage

All concrete specimens containing metakaolin exhibit increased expansion due to temperature change, as indicated by increased CTE values from control. Concrete specimens typically achieved a peak CTE value at a 15% replacement. To the knowledge of the authors, no research has been published on the CTE values of metakaolin concrete mixtures. Research has concluded that the inclusion of fly ash, slag, and silica fume reduces the CTE of cement pastes [34]. The mechanism by which the inclusion of silica fume reduces the CTE is different from that of fly ash and slag. Silica fume is reported to reduce CTE primarily by reducing the Ca(OH)2 (CH) contents, which has a higher CTE than that of plain cement pastes. Fly ash and slag are reported to reduce the CTE by CH consumption [32] and thus increased porosities—as decreased porosity is expected to decrease the CTE. This would support an increase in CTE by inclusion of metakaolin if the CTE reduction by CH consumption is less than the increase in CTE due to the reduction of porosity. Temporarily ignoring MK2 (poor performance), this explanation is supported by the finer metakaolin (MK1) achieving lower CTE values than MK3, as it is likely that the finer metakaolin exhibits a higher CH consumption. The deleterious results of jointed concrete pavements with CTE values higher than 10 × 10−6 mm/mm/°C have been reported [35].
The reduction in drying shrinkage of concretes by the inclusion of metakaolin [36] is supported by the literature [13,19,32]. Some researchers have reported a systematic decrease in drying shrinkage with increasing replacement levels of metakaolin [13,19], while others have reported no observable benefit from higher replacements [37].

5. Conclusions

Metakaolin (MK) is a naturally-occurring pozzolan and is included as an ASTM C618 Class N Pozzolan. MK provides improved concrete performance in the form of decreased permeability, improved strength and durability, and reduced shrinkage [32]. Low permeability and reduced shrinkage are two performance characteristics of metakaolin supplemented concrete that can prolong the service life of transportation infrastructure that is subjected to severe exposure conditions, although the increased coefficient of thermal expansion levels are observed and need further investigation. This paper concludes with the following key findings and answers to the research questions:
  • MK1 achieves an optimum compressive strength at a 20% replacement, tensile strength at a 15% replacement and, overall, measures of durability increase systematically with increasing replacement levels. MK2 achieves an optimum compressive strength at a 15% replacement, while tensile strengths are maximized at a 20% replacement. Measures of durability of MK2 concretes vary too greatly for its use to be recommended for increased durability. MK3 performance was the most consistent amongst the metakaolins. Optimum replacements for compressive strength and tensile strengths were 15% and 20%, respectively. All measures of durability increased systematically with increasing replacement levels.
  • MK2 was an obvious outlier in both mechanical and durability performance. Aside from this, MK1 performance greatly depends on the replacement level, while MK3 does not. Mechanical strengths varied at most 29% (MK1-20 and MK3-20 compression, by % of control) between MK1 and MK3. Measures of durability indicate that a replacement of 15% or higher by either MK1 or MK3 will be sufficient to ensure very low permeability and mitigate deleterious expansion resulting from ASR or sulfate attack.
  • All concrete mixtures incorporating metakaolin as a replacement of cement require a high level dosage of superplasticizer (≥4 mL per 100 kg of cementitious material), with higher dosage requirements at higher replacement levels. Increased mechanical strengths are seen at all replacement levels, and are generally optimized at a 15–20% replacement level. Resistance to chlorides and other chemicals is achieved by all well-performing metakaolins at a replacement level of 15% or higher.
It is also concluded that commercially available metakaolin products that conform to the threshold composition limit (Al2O3 + SiO2 + Fe2O3 ≥ 90%) could significantly vary in performance although the requirement ensures that the vast majority of the kaolin base material was kaolinite. Based on the findings of this study, a breakdown of oxides by weight and material fineness (11,000 m2/kg ≤ BET ≤ 14,200 m2/kg) is a typically good predictor of quality although the reactivity of any metakaolin product is dependent on the percentage of kaolinite that is dehydroxylated during calcination and product quality assurance.

6. Future Work

Finally, further study should evaluate the following:
  • A quantitative investigation about the pozzolanic activity of different mixes would have been useful.
  • The dispersion of high-fineness, plate-like metakaolin in concrete batching. Recommendations are provided by the Silica Fume Association [38].
  • The pozzolanic reactivity for various commercially-available metakaolins in the U.S., and its effect on performance of concrete mixtures.
  • The increased CTE levels and their effect on structural performance.
  • Costs and benefits.

Author Contributions

M.S.S. and M.G.C. conceived and designed the experiments; M.S. performed the experiment; All authors analyzed the data and wrote the paper.

Funding

The study presented in this paper was conducted by the University of Georgia under the auspices of the Georgia Department of Transportation (GDOT) Research Project 16-16.

Acknowledgments

The authors extend our sincere appreciation to GDOT staff and engineers that supported this research. Special thanks to David Jared, Peter Wu, and Gary Wood for their continuous support. The authors greatly appreciate generous material donations made by BASF, ACT, and Thiele/Burgess Pigment and thank Charles Cleary and A.J. Marisca for giving permission for publishing the SEM images (Figure 1).

Conflicts of Interest

The funding sponsors had no role in the design of the study; in the collection, analyses, or interpretation of data; in the writing of the manuscript, and in the decision to publish the results.

References

  1. Soyka, M.J.G.P.; Conneely, D. CO2 Emissions from Cement Production; IPCC: Geneva, Switzerland, 1996. [Google Scholar]
  2. Gale, J.; Bradshaw, J.; Chen, Z.; Garg, A.; Gomez, D.; Rogner, H.-H.; Simbeck, D.; Williams, R. Sources of CO2; IPCC: Geneva, Switzerland, 2006. [Google Scholar]
  3. Flower, D.J.M.; Sanjayan, J.G. Green house gas emissions due to concrete manufacture. Int. J. Life Cycle Assess. 2007, 12, 282. [Google Scholar] [CrossRef]
  4. Uwasu, M.; Hara, K.; Yabar, H. World cement production and environmental implications. Environ. Dev. 2014, 10, 36–47. [Google Scholar] [CrossRef]
  5. Kosmatka, S.H.; Wilson, M.L. Design and Control of Concrete Mixtures, 15th ed.; Portland Cement Association: New York, NY, USA, 2011. [Google Scholar]
  6. Michael, A.; Caldarone, K.A.G.; Ronald, G.B. High reactivity metakaolin (hrm): A new generation mineral admixture for high performance concrete. Concr. Int. 1994, 16, 37–41. [Google Scholar]
  7. Asbridge, A.H.; Jones, T.R.; Osborne, G.J. High performance metakaolin concrete: Results of large scale trials in aggressive environments. In Radical Concrete Technology, Proceedings of the International Conference Held at the University of Dundee, Scotland, UK, 24–26 June 1996; Taylor & Francis: Oxfordshire, UK; Volume 2, pp. 11–23.
  8. Murray, H.H.; Lyons, S.C. Correlation of Paper-Coating Quality with Degree of Crystal Perfection of Kaolinite; Indiana University: Bloomington, IN, USA, 1955. [Google Scholar]
  9. Elton, N.J.; Gate, L.F.; Hooper, J.J. Texture and orientation of kaolin in coatings. Clay Min. 1999, 34, 89–98. [Google Scholar] [CrossRef]
  10. Selmani, S.; Sdiri, A.; Bouaziz, S.; Joussein, E.; Rossignol, S. Effects of metakaolin addition on geopolymer prepared from natural kaolinitic clay. Appl. Clay Sci. 2017, 146, 457–467. [Google Scholar] [CrossRef]
  11. Bapat, J.D. Mineral Admixtures in Cement and Concrete; CRC Press: Boca Raton, FL, USA, 2013. [Google Scholar]
  12. Dinakar, P.; Sahoo, P.K.; Sriram, G. Effect of metakaolin content on the properties of high strength concrete. Int. J. Concr. Struct. Mater. 2013, 7, 215–223. [Google Scholar] [CrossRef]
  13. Güneyisi, E.; Gesoğlu, M.; Mermerdaş, K. Improving strength, drying shrinkage, and pore structure of concrete using metakaolin. Mater. Struct. 2008, 41, 937–949. [Google Scholar] [CrossRef]
  14. Justice, J.M.; Kurtis, K.E. Influence of metakaolin surface area on properties of cement-based materials. J. Mater. Civ. Eng. 2007, 19, 762–771. [Google Scholar] [CrossRef]
  15. Poon, C.S.; Kou, S.C.; Lam, L. Compressive strength, chloride diffusivity and pore structure of high performance metakaolin and silica fume concrete. Constr. Build. Mater. 2006, 20, 858–865. [Google Scholar] [CrossRef]
  16. Yazıcı, Ş.; Arel, H.Ş.; Anuk, D. Influences of metakaolin on the durability and mechanical properties of mortars. Arab. J. Sci. Eng. 2014, 39, 8585–8592. [Google Scholar] [CrossRef]
  17. Ramezanianpour, A.A. Cement Replacement Materials; Springer: Berlin/Heidelberg, Germany, 2014. [Google Scholar]
  18. Wild, S.; Khatib, J.M.; Jones, A. Relative strength, pozzolanic activity and cement hydration in superplasticised metakaolin concrete. Cem. Concr. Res. 1996, 26, 1537–1544. [Google Scholar] [CrossRef]
  19. Gleize, P.J.P.; Cyr, M.; Escadeillas, G. Effects of metakaolin on autogenous shrinkage of cement pastes. Cem. Concr. Compos. 2007, 29, 80–87. [Google Scholar] [CrossRef]
  20. Sabir, B.B.; Wild, S.; Bai, J. Metakaolin and calcined clays as pozzolans for concrete: A review. Cem. Concr. Compos. 2001, 23, 441–454. [Google Scholar] [CrossRef]
  21. Badogiannis, E.; Aggeli, E.; Papadakis, V.G.; Tsivilis, S. Evaluation of chloride-penetration resistance of metakaolin concrete by means of a diffusion—Binding model and of the k-value concept. Cem. Concr. Compos. 2015, 63, 1–7. [Google Scholar] [CrossRef]
  22. Khatib, J.M.; Hibbert, J.J. Selected engineering properties of concrete incorporating slag and metakaolin. Constr. Build. Mater. 2005, 19, 460–472. [Google Scholar] [CrossRef]
  23. Barbhuiya, S.; Chow, P.; Memon, S. Microstructure, hydration and nanomechanical properties of concrete containing metakaolin. Constr. Build. Mater. 2015, 95, 696–702. [Google Scholar] [CrossRef]
  24. Güneyisi, E.; Gesoğlu, M.; Karaboğa, F.; Mermerdaş, K. Corrosion behavior of reinforcing steel embedded in chloride contaminated concretes with and without metakaolin. Compos. Part B Eng. 2013, 45, 1288–1295. [Google Scholar] [CrossRef]
  25. Ramezanianpour, A.A.; Bahrami Jovein, H. Influence of metakaolin as supplementary cementing material on strength and durability of concretes. Constr. Build. Mater. 2012, 30, 470–479. [Google Scholar] [CrossRef]
  26. Ramlochan, T.; Thomas, M.; Gruber, K.A. The effect of metakaolin on alkali–silica reaction in concrete. Cem. Concr. Res. 2000, 30, 339–344. [Google Scholar] [CrossRef]
  27. Wang, G.M.; Kong, Y.; Shui, Z.H.; Li, Q.; Han, J.L. Experimental investigation on chloride diffusion and binding in concrete containing metakaolin. Corros. Eng. Sci. Technol. 2014, 49, 282–286. [Google Scholar] [CrossRef]
  28. Li, Z.; Ding, Z. Property improvement of portland cement by incorporating with metakaolin and slag. Cem. Concr. Res. 2003, 33, 579–584. [Google Scholar] [CrossRef]
  29. ACI Committee, American Concrete Institute, and International Organization for Standardization. 211.1-91: Standard Practice for Selecting Proportions for Normal, Heavyweight, and Mass Concrete; American Concrete Institute: Farmington Hills, MI, USA, 1991. [Google Scholar]
  30. Paiva, H.; Velosa, A.; Cachim, P.; Ferreira, V.M. Effect of metakaolin dispersion on the fresh and hardened state properties of concrete. Cem. Concr. Res. 2012, 42, 607–612. [Google Scholar] [CrossRef]
  31. Janneth Torres, A.; Mejía de Gutiérrez, R.; Gutiérrez, C. The performance of mortar containing added metakaolin regarding sulfate action. Ing. Investig. 2008, 28, 117–122. [Google Scholar]
  32. Lee, H.S.; Wang, X.Y.; Zhang, L.N.; Koh, K.T. Analysis of the Optimum Usage of Slag for the Compressive Strength of Concrete. Materials. 2015, 18, 1213–1229. [Google Scholar] [CrossRef] [PubMed]
  33. Brindley, G.W.; Nakahira, M. The Role of Water Vapour in the Dehydroxylation of Clay Minerals; The Pennsylvania State University: State College, PA, USA, 1957. [Google Scholar]
  34. Shui, Z.-H.; Zhang, R.; Chen, W.; Xuan, D.-X. Effects of mineral admixtures on the thermal expansion properties of hardened cement paste. Constr. Build. Mater. 2010, 24, 1761–1767. [Google Scholar] [CrossRef]
  35. Sabih, G.; Tarefder, R.A. Impact of variability of mechanical and thermal properties of concrete on predicted performance of jointed plain concrete pavements. Int. J. Pavement Res. Technol. 2016, 9, 436–444. [Google Scholar] [CrossRef]
  36. Sullivan, M.S. Comparison of Commercially-Available Metakaolins and Slags in Binary and Ternary Concrete Mixtures. Master’s Thesis, The University of Georgia, Athens, GA, USA, 2018. [Google Scholar]
  37. Brooks, J.J.; Johari, M.A.M. Effect of metakaolin on creep and shrinkage of concrete. Cem. Concr. Compos. 2001, 23, 495–502. [Google Scholar] [CrossRef]
  38. The Silica Fume Association. Making Silica-Fume Concrete in the Laboratory. Available online: http://www.silicafume.org/pdf/concrete-labmix.pdf (accessed on 24 March 2018).
Figure 1. SEM photographs of metakaolin at: (a) 2000 times magnification; (b) 20,000 times magnification. Courtesy of BASF USA.
Infrastructures 03 00017 g001
Figure 2. Slump and superplasticizer dosage for all mixtures.
Infrastructures 03 00017 g002
Figure 3. Compressive strength evolution for concretes incorporating metakaolin product: (a) MK1; (b) MK2; (c) MK3; Compressive strength evolution of: (d) optimum mixture based on 28-day strength.
Infrastructures 03 00017 g003
Figure 4. Tensile strength of metakaolin concretes as measured by split-cylinder tension and MOR.
Infrastructures 03 00017 g004
Figure 5. Young’s moduli of metakaolin concretes as measured by forced resonance method.
Infrastructures 03 00017 g005
Figure 6. Permeability of metakaolin concretes as measured by the rapid chloride-ion penetrability test (RCPT) (in Coulombs).
Infrastructures 03 00017 g006
Figure 7. Expansion of metakaolin mortars immersed in aqueous NaOH solution.
Infrastructures 03 00017 g007
Figure 8. Expansion of metakaolin mortars immersed in Na2SO4 solution.
Infrastructures 03 00017 g008
Figure 9. Thermal behavior of metakaolin concretes represented as their coefficients of thermal expansion.
Infrastructures 03 00017 g009
Figure 10. Drying shrinkage of metakaolin concrete mixtures after 28 days of curing.
Infrastructures 03 00017 g010
Table 1. Metakaolin products used in this study and approved for use in U.S. states.
StateProducts Approved
1CaliforniaMK2
2FloridaMK1, MK3
3GeorgiaMK1
4IllinoisMK2
5Montana*
6Nebraska*
7Nevada*
8New York*
9North CarolinaMK2
10Oregon*
11PennsylvaniaMK1
12Texas*
13Utah*
14VirginiaMK1, MK2
15Wisconsin*
16Wyoming*
* The state allows the use of metakaolin, but no specified product is found.
Table 2. Select physical and chemical properties of cementitious materials.
CementMK1MK2MK3
ChemicalSiO2 (%)19.7050.7554–5651.66
Al2O3 (%)4.7045.9140–4243.99
Fe2O3 (%)3.000.45<1.40.47
CaO (%)63.300.06<0.10.01
MgO (%)3.100.00<0.10.03
Na2O (%)<0.10.23<0.051.89
TiO2 (%)<0.11.87<31.89
SO3 (%)3.200.08<0.05-
PhysicalSpecific Gravity3.162.602.602.50
L.O.I. (%)2.700.42<1.00.50
Specific Surface (BET)387 m2/kg14,200 m2/kg20,000 m2/kg11,000 m2/kg
Table 3. Concrete batch quantities (per m3).
Mixture CodeCement (kg)Metakaolin (kg)Coarse Aggregate (kg)Fine Aggregate (kg)Water (kg)Air (%)Superplasticizer (mL per kg of Cementitious Material)
Control42209857231824%2.2
MK1-10380429857151824%4.4
MK1-15358639857111824%4.4
MK1-20338849857081824%4.9
MK2-10380429857151824%4.2
MK2-15358639857111824%4.6
MK2-20338849857081824%5.1
MK3-10380429857151824%4.2
MK3-15358639857111824%4.9
MK3-20338849857081824%5.3
Table 4. Air content and unit weight of the mixtures.
PropertiesTests Replacement LevelCtrlMK1 ProductMK2 ProductMK3 Product
0%10%15%20%10%15%20%10%15%20%
FreshAir content (%)4.14.53.83.68.53.93.63.53.12.6
FreshUnit weight (kg/m3)2345236723132297231023992319231323072310
Hardened28-day Compression53.762.769.477.048.957.063.764.966.961.8
(MPa)
Table 5. Mean, standard deviation, and an outlier of the binary mixture results.
PropertiesMeanStandard DeviationOutlier (p > 0.05%)
28-day Compression63.597.822MK2-10
MOR5.1620.7851MK1-15
Split Cylinder Tension3.1240.3336MK1-15
Dynamic MOE35.591.5443MK2-10
RCPT815.0374.82MK2-10
Table 6. Summary of test results for all mixtures compared to the control mixture.
PropertiesTests (Replacement Level)MK1 ProductMK2 ProductMK3 Product
10%15%20%10%15%20%10%15%20%
MechanicalCompression (28-day)
(% change)17%29%44%−9%19%6%21%25%15%
Split-Cylinder Tension
(% change)18%30%14%−8%−1%3%7%0%13%
MOR
(% change)−10%38%20%−1%−16%1%5%5%6%
Dynamic MOE
(% change)−2%−4%−4%−12%−1%−9%0%−6%−9%
DurabilityRCPT Permeability
(% change)−67%−79%−65%−38%−75%−75%−74%−81%−81%
Sulfate Resistance---------
Pass (P) or Fail (F)FPPFFFFPP
ASR Resistance---------
Pass (P) or Fail (F)FPPFPPPPP
Dimensional StabilityCTE
(% change)4%12%6%4%6%3%12%18%18%
Shrinkage
(% change)3%0%−10%−7%−11%−19%−9%−15%−35%
Note: ‘-’ indicates not applicable.

