Machine Learning with Applications in Breast Cancer Diagnosis and Prognosis


1
Department of Computer Science, Brunel University London, Uxbridge, Middlesex UB8 3PH, UK
2
School of Mathematics, Southeast University, Nanjing 210096, China
*
Author to whom correspondence should be addressed.
Designs 2018, 2(2), 13; https://doi.org/10.3390/designs2020013
Submission received: 2 February 2018
/
Revised: 22 April 2018
/
Accepted: 23 April 2018
/
Published: 9 May 2018
(This article belongs to the Special Issue Optimization, Health Monitoring and Control Methods for Modern Complex Systems)
Abstract
:Breast cancer (BC) is one of the most common cancers among women worldwide, representing the majority of new cancer cases and cancer-related deaths according to global statistics, making it a significant public health problem in today’s society. The early diagnosis of BC can improve the prognosis and chance of survival significantly, as it can promote timely clinical treatment to patients. Further accurate classification of benign tumours can prevent patients undergoing unnecessary treatments. Thus, the correct diagnosis of BC and classification of patients into malignant or benign groups is the subject of much research. Because of its unique advantages in critical features detection from complex BC datasets, machine learning (ML) is widely recognised as the methodology of choice in BC pattern classification and forecast modelling. In this paper, we aim to review ML techniques and their applications in BC diagnosis and prognosis. Firstly, we provide an overview of ML techniques including artificial neural networks (ANNs), support vector machines (SVMs), decision trees (DTs), and k-nearest neighbors (k-NNs). Then, we investigate their applications in BC. Our primary data is drawn from the Wisconsin breast cancer database (WBCD) which is the benchmark database for comparing the results through different algorithms. Finally, a healthcare system model of our recent work is also shown.
1. Introduction
Over the past few decades, ML techniques have been widely used in intelligent healthcare systems, especially for breast cancer (BC) diagnosis and prognosis. Traditionally the diagnostic accuracy of a patient depends on a physician’s experience [1], however, this expertise is built up over many years of observations of different patients’ symptoms and confirmed diagnoses. Even then the accuracy still cannot be guaranteed. With the advent of computing technologies, it is now relatively easy to acquire and store a lot of data, for example the dedicated databases of electronic patient records [2], and the European Friedreichs Ataxia Consortium for Translational Studies (EFACTS) patient database [3]. Without the aid of computers it is impossible for health professionals to analyse these complex datasets particularly when undertaking complex interrogations of the data. The intelligent healthcare system is therefore a valuable and important domain. The intelligent healthcare system can assist physicians to diagnose patients with greater accuracy or provide more meaningful benchmarks, and further it can aid people to plan for their physical condition into the future. In this context, ML techniques can take over some complex manual works from the physicians, for instance, text and voice analysis, which have been applied to identify/code patient emotions corresponding to healthcare professionals’ responses. Note that more and more evidences have shown that the emotions of patients can predict and further affect health outcomes [4,5].
As the most prevalent cancer in women, BC has always had a high incidence rate and mortality rate. According to the latest cancer statistics [6,7,8], BC alone is expected to account for of all new cancer diagnoses and 15% of all cancer deaths among women worldwide. Scientists have been aware of the dangers of BC from very early on, therefore much early research has already been implemented in the treatment of BC. Due to the efforts of researchers and early detection methods, the mortality rate has shown a steady and declining trend over the past decades. According to the statistics of Cancer Research UK, the five years survival rate for BC is almost if detected at its earliest stage, but can be as low as when detected at the latest stage. Lately, ML techniques are playing a significant role in diagnosis and prognosis of BC by applying classification techniques to identify people with BC, distinguish benign from malignant tumours and to predict prognosis. Accurate classification can further assist clinicians to prescribe the most appropriate treatment regime.
Classification is a kind of complex optimization problem. Many ML techniques have been applied by researchers in solving this classification problem. In the following sections, a comprehensive explanation of different classification methods applied to BC will be given. We focus on the artificial neural network (ANNs), support vector machine (SVMs), decision tree (DTs) and k-nearest neighbor (k-NNs) techniques as they are the main methods used in BC diagnosis and prognosis. Scientists strive to find the best algorithm to achieve the most accurate classification result, however, data of variable quality will also influence the classification result. Further, the rarity of data will influence the number of algorithm applications as well. Overall, most ML techniques are first tested in open source databases. Over time, a benchmark dataset has arisen in the literature: Wisconsin breast cancer diagnosis (WBCD) [9,10]. There are also many other BC benchmark data sets, for instance Wisconsin Prognostic Breast Cancer Chemotherapy (WPBCC), Wisconsin Diagnostic Breast Cancer (WDBC) [11] and so on. ML techniques that have been used on the WBCD database in BC diagnosis and prognosis show different levels of accuracy that ranged between and . Similarly, there are results with differently modified algorithms relating to BC databases. This review attempts to provide readers with the essential elements of BC diagnosis and prognosis using ML techniques on WBCD. By using ML techniques to analyse the WBCD database, BC can be diagnosed accurately base on 9 attributes as can be seen from Table 1. In the main body of the review section we will concentrate on how the WBCD has been used to illustrate the great promise of ML algorithms.
2. ML Approaches
Throughout the decades, ML algorithms have been widely used in BC diagnosis and prognosis to gain different insights from data samples. ML is a form of Artificial Intelligence (AI) that uses a variety of statistical, probabilistic and optimization tools to learn and improve performance automatically from new data and past experiences, without explicitly programmed instructions. Both statistics and ML are used for analysing data. In dealing with complex, large, high dimensional data, ML approaches are typically capable of extracting key features and potential rules which might be difficult to be discovered using traditional statistics. As discussed in [12,13,14,15] for BC datasets, ML approaches have proved to be more suitable than statistics ones.
Traditional statistical methods of data analysis to predict medical outcomes include but are not limited to, logistic regression, linear regression and discriminant analysis [16,17,18,19,20]. Much work comparing different traditional statistical methods with traditional ML classification methods have been published to demonstrate the advantages of ML and its potential [21]. The early findings showed results to the contrary; in 1998, Fogel et al. compared ANN with linear discriminant analysis of the radiographic features of masses and patient’s age in 139 suspicious masses to detect whether they developed breast cancer and demonstrated the superiority of latter [22]. Lately however with the maturity and improvement of the ML algorithms, and the increasing quantity and complexity of the data, results show ML approaches have better classification accuracy [12,14,15,23,24,25]. In 2004, two ML classification methods (DT and ANN) were compared with a statistical method (linear regression) to predict the breast cancer survival using a large dataset which has more than cases and demonstrated that ML methods could be a promising classification method for practical use. The results showed that DT was the best predictor with the accuracy of with ANN achieving and both were better than linear regression achieving accuracy [12].
ML algorithms can also be used to perform nonlinear statistical modelling demonstrating advantages when compared to standard statistical methods, these include the ability to dispose and detect complicated nonlinear relationships between variables, the ability to detect all possible interactions between predictor variables, and the availability of multiple training algorithms [24]. The major trend illustrated in the literature in recent decades is to move away from using statistical methods as the amount of data being analysed increases [26,27,28]. ML algorithms can be classified into two general categories based on the way they “learn” about data; supervised learning and unsupervised learning. Supervised learning is so named because the programmer teaches the learning process about what results should be from the training data, as a guide to the algorithms. It is similar to the way that the parents teach their child the names of different objects. Supervised learning requires all training data to be labelled, and then algorithms can learn to predict the output from the input data. In contrast, in unsupervised learning, all the data is unlabelled. It should be able to find the internal structure or relationship between different inputs. Actually, unsupervised learning is how humans learn about novel things. The most representative technique of unsupervised learning is clustering [29].
Choosing whether to use a supervised or an unsupervised ML algorithm generally depends on the data types and structures. A review of current research reveals that almost all the ML algorithms employed in the BC diagnosis and prognosis are supervised [30]. In the next section, we will provide a detailed introduction on the main types of supervised classification learning algorithms that have been used in the BC diagnosis and prognosis, which are ANN [31,32], SVM [33], DT [34] and k-NN [35].
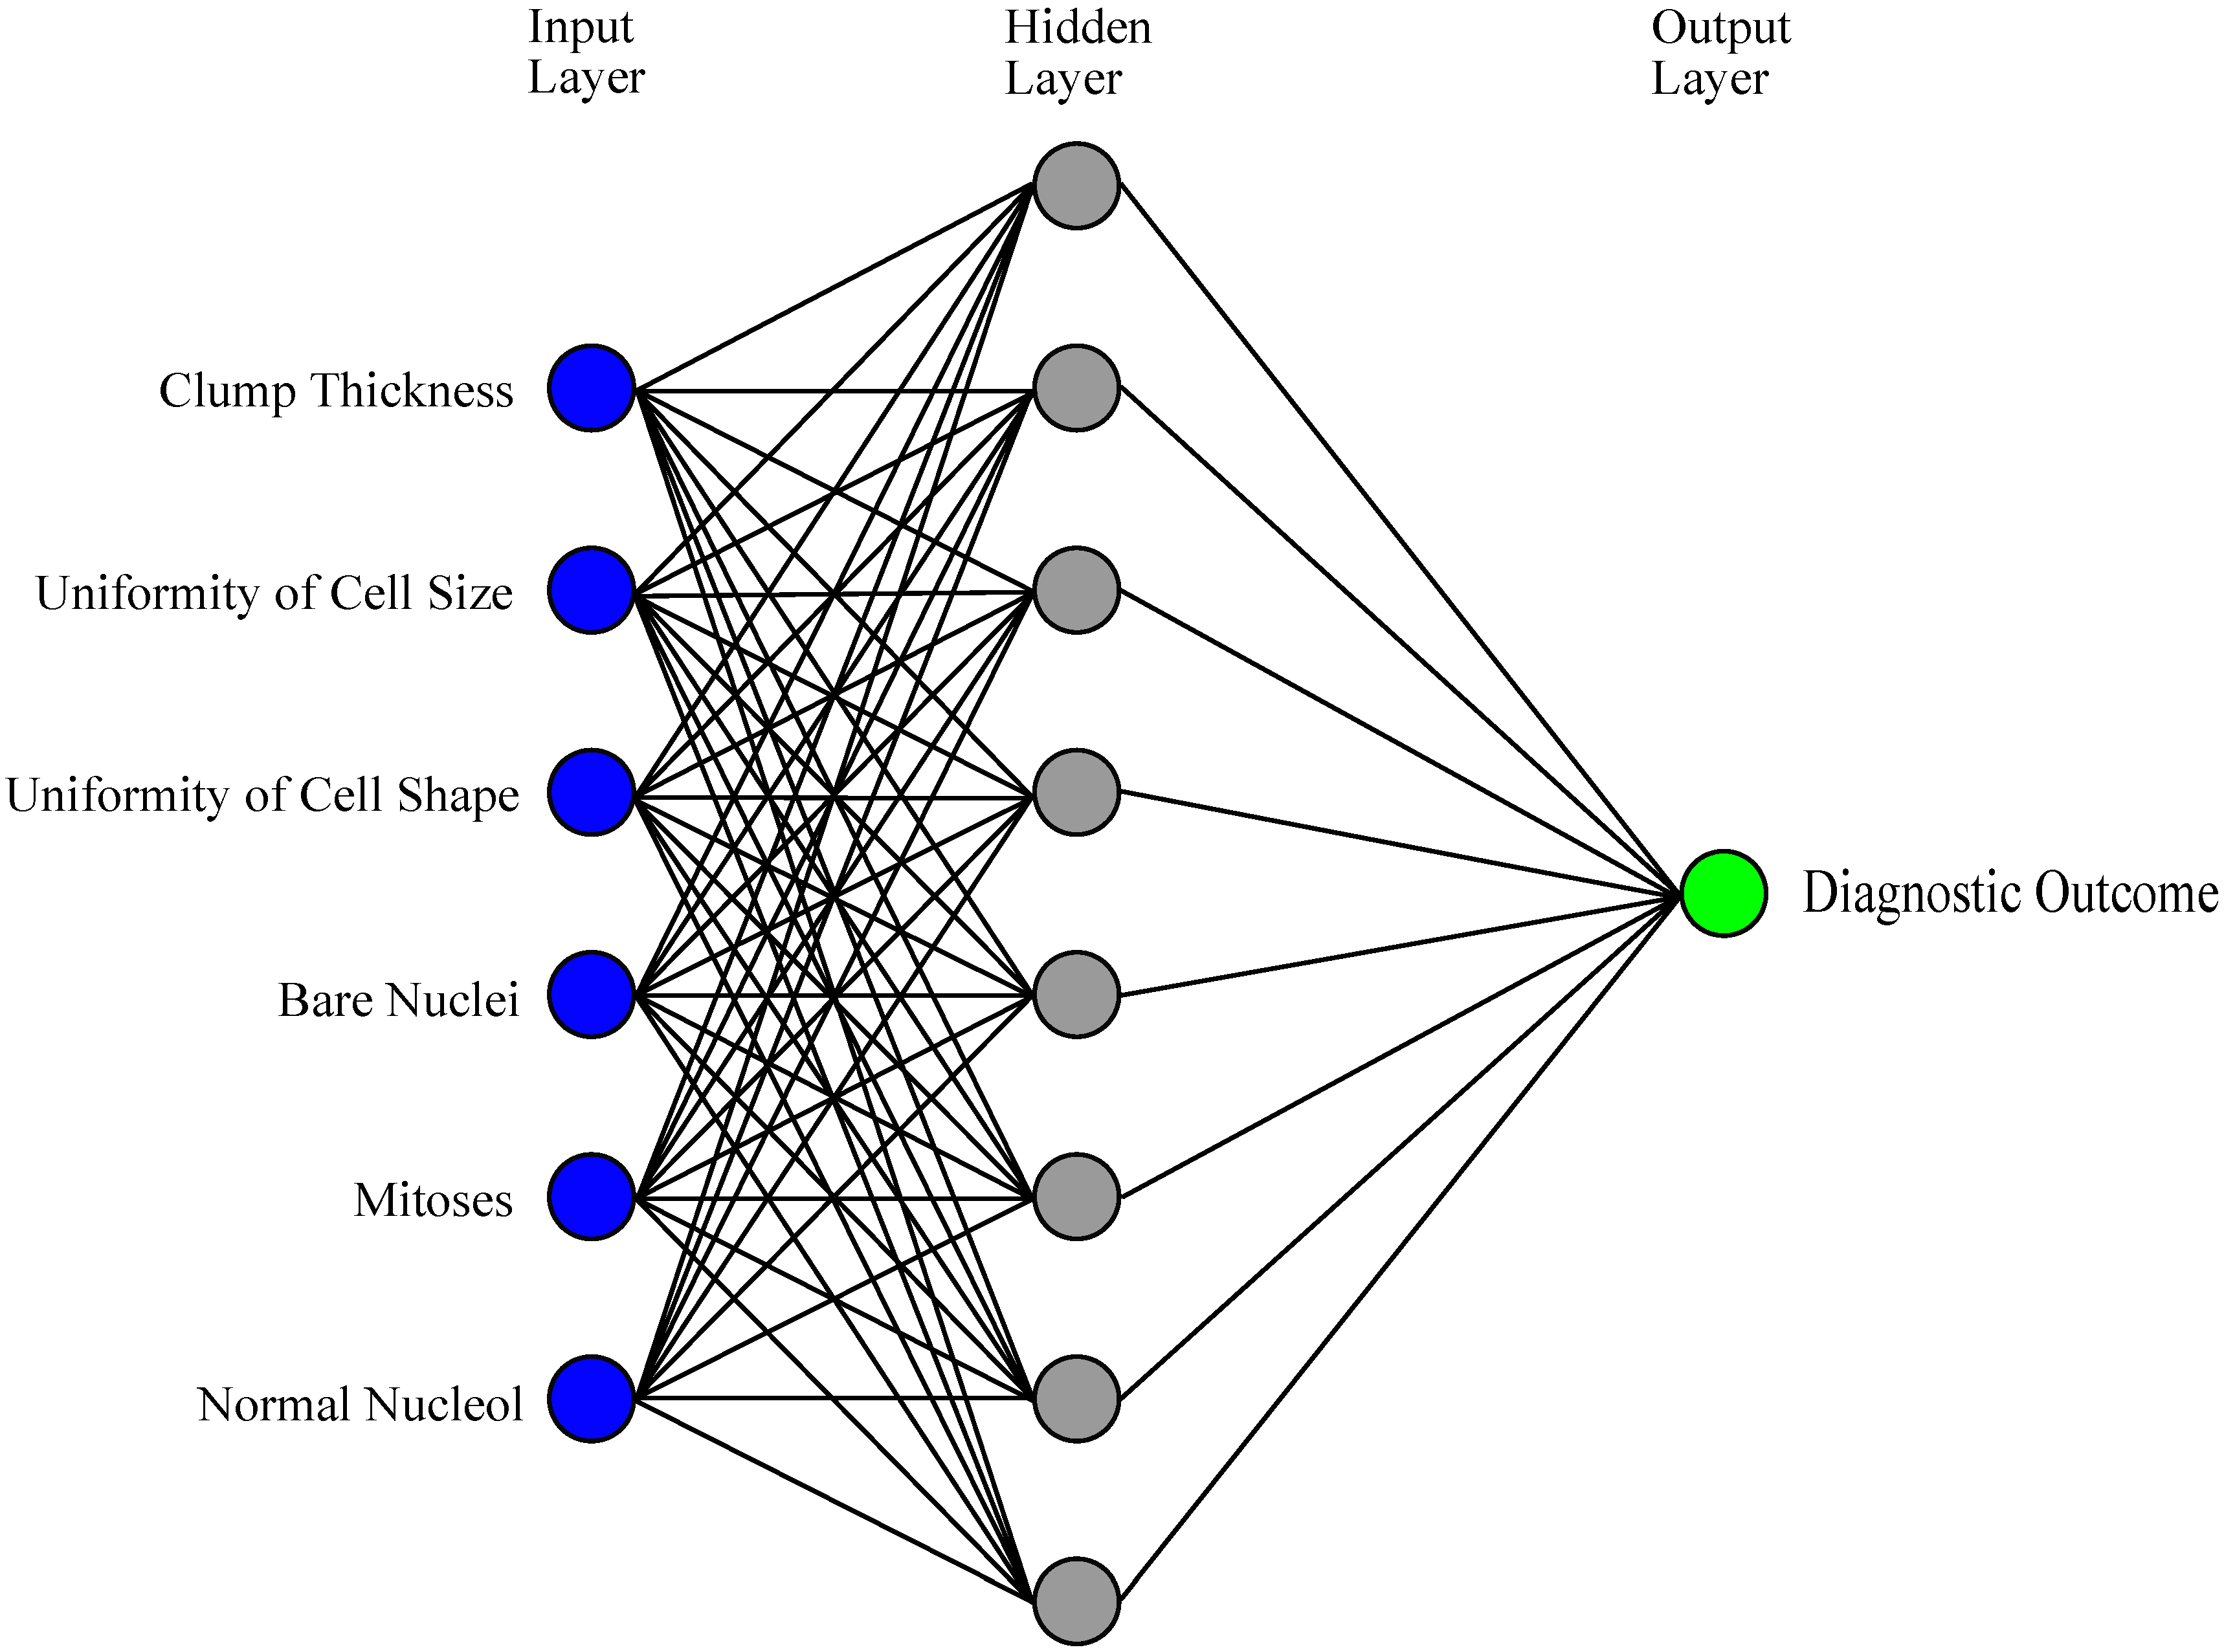
An artificial neural network (ANN) can be defined as a model of reasoning based on the human brain [36]. Over the past few decades, ANNs have been employed increasingly by more and more researchers, and become an active research area [37,38,39,40]. ANNs have afforded numerous successes with great progress in BC classification and diagnosis in the very early stages [22,41,42,43,44,45,46,47]. A typical ANN model is made up of a hierarchy of layers: input, hidden and output layers (Figure 1) [48]. Layers are composed of interconnected neurons which contain an activation function for nonlinear transformation to strengthen the nonlinear expression ability. The input layer receives the data and then transmits the data to a hidden layer which is used for processing the data and providing the training results to the output layer. The output layer shows the classification results. However, depending on the problems, the process of training an ANN may involve long causal chains of computational stages. Since 1986, a novel efficient gradient descent algorithm called backpropagation (BP) has had wide applications, especially for medical data [49]. It was created by generalizing the Widrow-Hoff learning rule to multiple-layer networks and nonlinear differentiable transfer functions. Although the BP algorithm is used, it still has some weaknesses when presented with vast and complicated data. The calculations of BP are extensive and, as a result, training is slow, thus a pure BP algorithm is rarely used in practical applications. Researchers are working to improve the BP algorithm to increase computational efficiency. Different novel algorithms based on ANN that have been used to analyse WBCD will be discussed in the next sections.
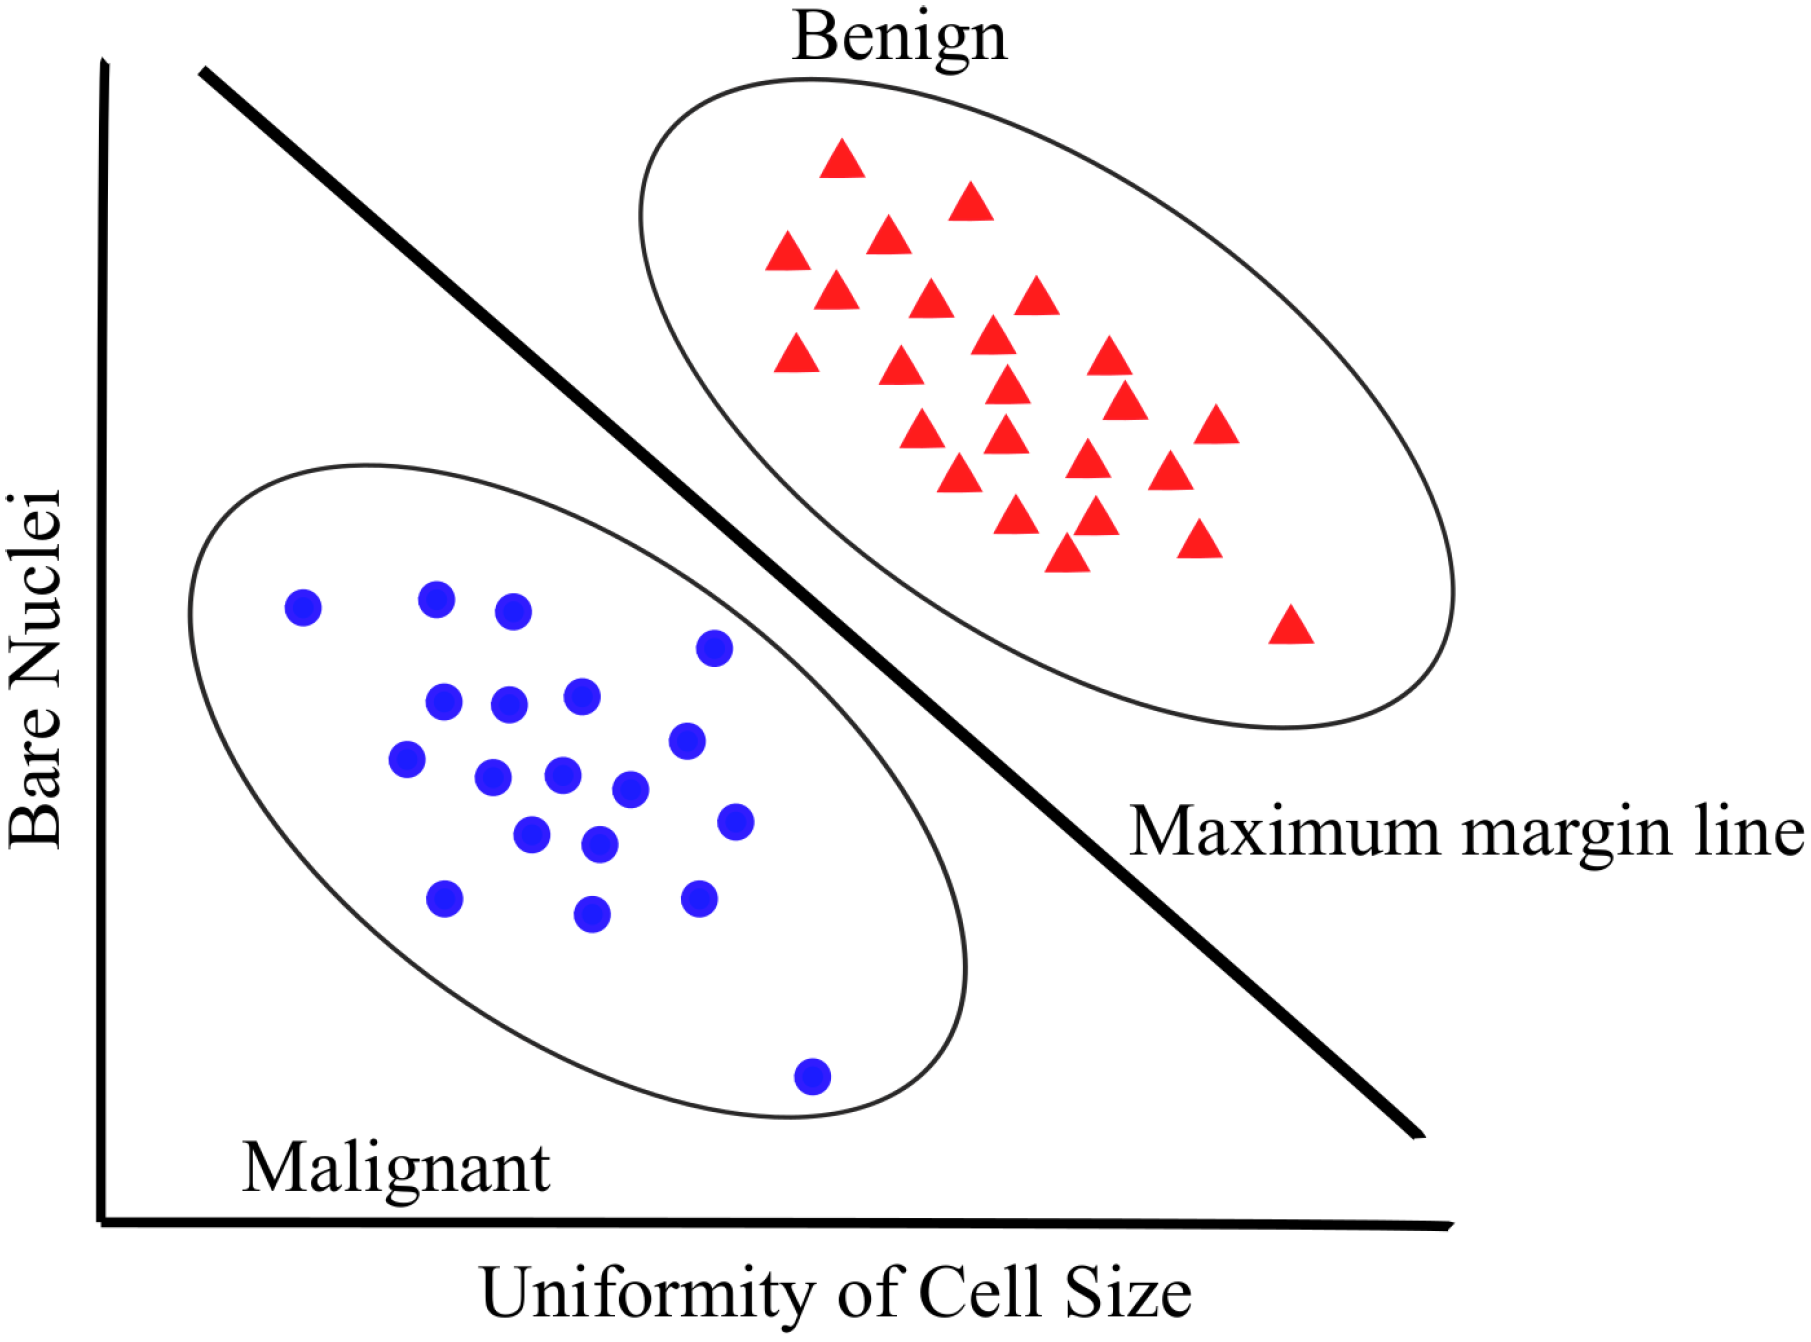
The concept of SVM, which was proposed by Vapnik on the basis of the statistical learning theory [50], has become an essential component in ML techniques. SVM was initially developed for binary classification, but it can be efficiently extended for multiclass problems [33,51] with widespread use in fields of handwritten digit recognition [52], speaker identification [53], text categorization [54], etc. The key feature of an SVM classifier is to find an optimized decision boundary that represents the largest separation (maximum margin) between the classes. The principle of SVM starts from solving linear separable problems then extends to deal with nonlinear problems. The way of solving nonlinear problems is to map training samples from the original finite dimensional space to a higher dimensional space to realize linear separability. SVM is one of the most popular approaches in BC diagnosis and prognosis [55]. An example of SVM structure [33] for BC diagnosis is shown in Figure 2.
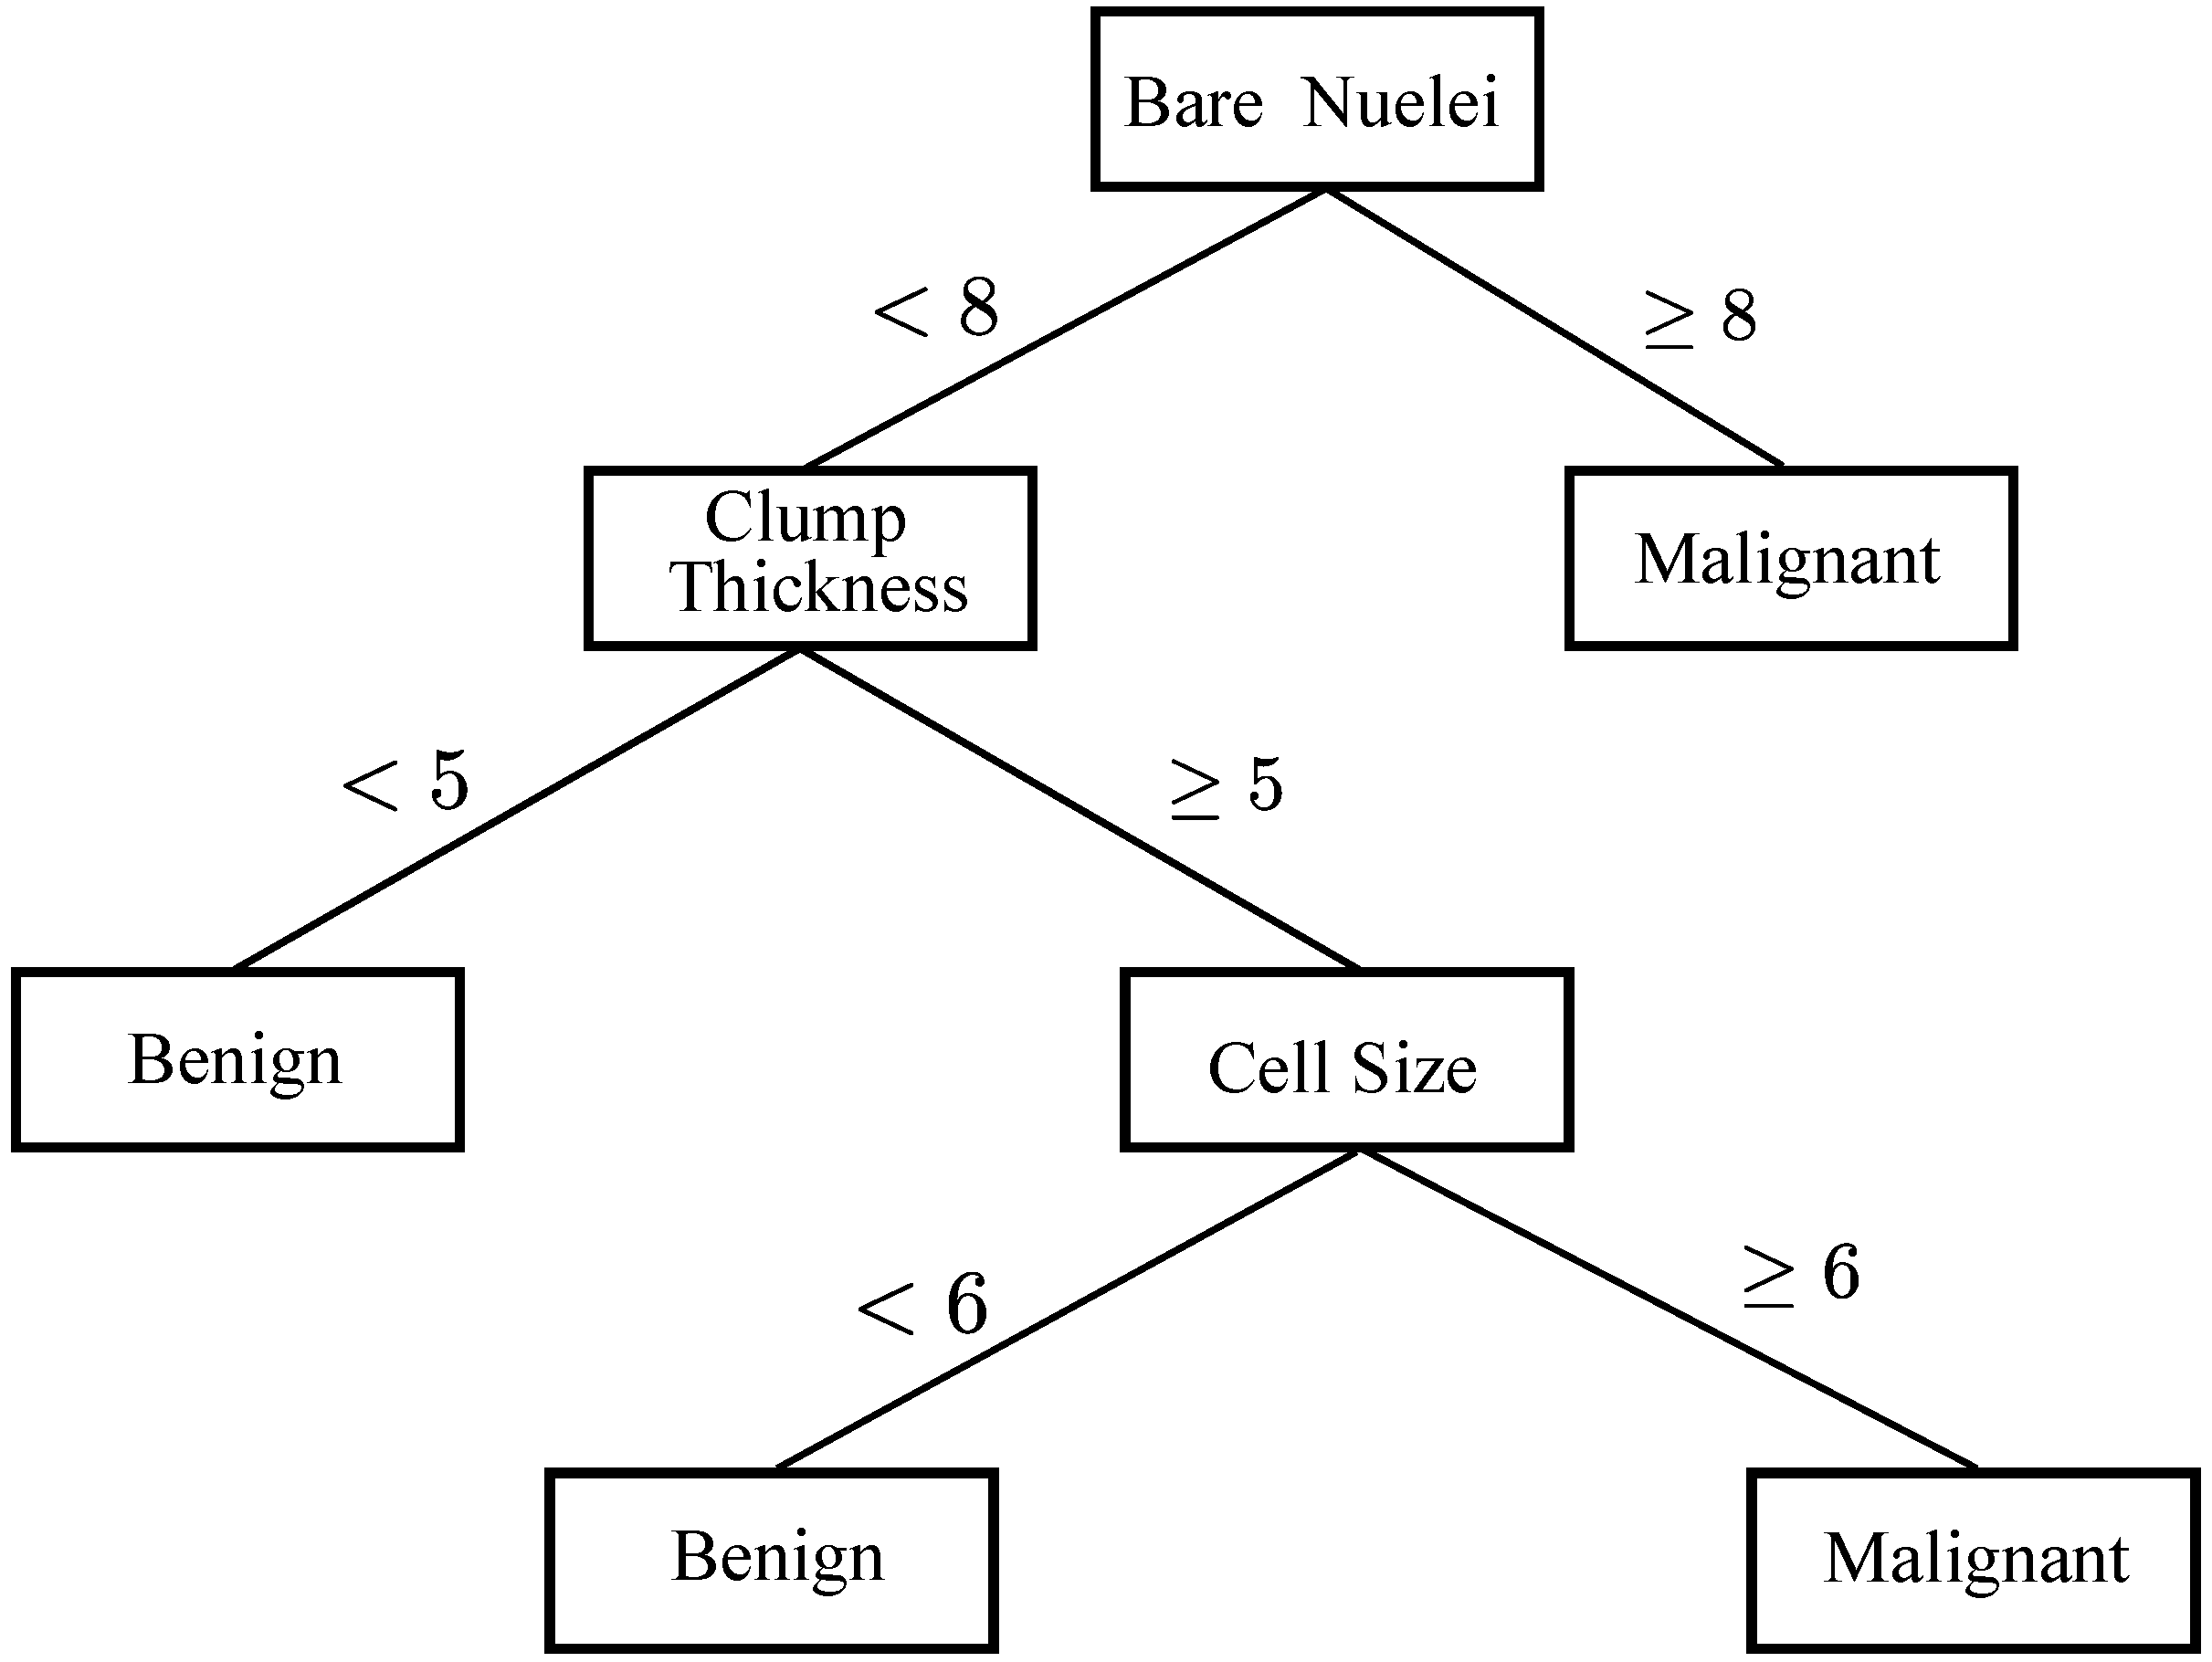
In ML, DT is a predictive model that represents a mapping between object attributes and object values [56,57]. A DT is a tree-like classifier that partitions every possible outcome of data recursively into classes. DT is similar to the flowchart, in which every non-leaf node indicates a test on a particular attribute, every branch represents an outcome of that test and every leaf node expresses a classification or decision. The node at the topmost label in the tree is called root node, which corresponds to the best predictor. By using DT, both numerical and categorical data can be processed. Based on maximum information gain, decision-makers can choose best alternative and traversal from root node to leaf nodes denoting unique class separation [58]. The most popular DT methods are Iterative Dichotomiser 3 (ID3) [34], C [59], C and classification and regression tree (CART) which use entropy-based measures to grow the tree. To understand how DT works in the context of BC diagnosis and prognosis, there is an example of a BC diagnosis and prognosis decision tree structure [34] in Figure 3, which is used to predict whether a person has malignant or benign BC.
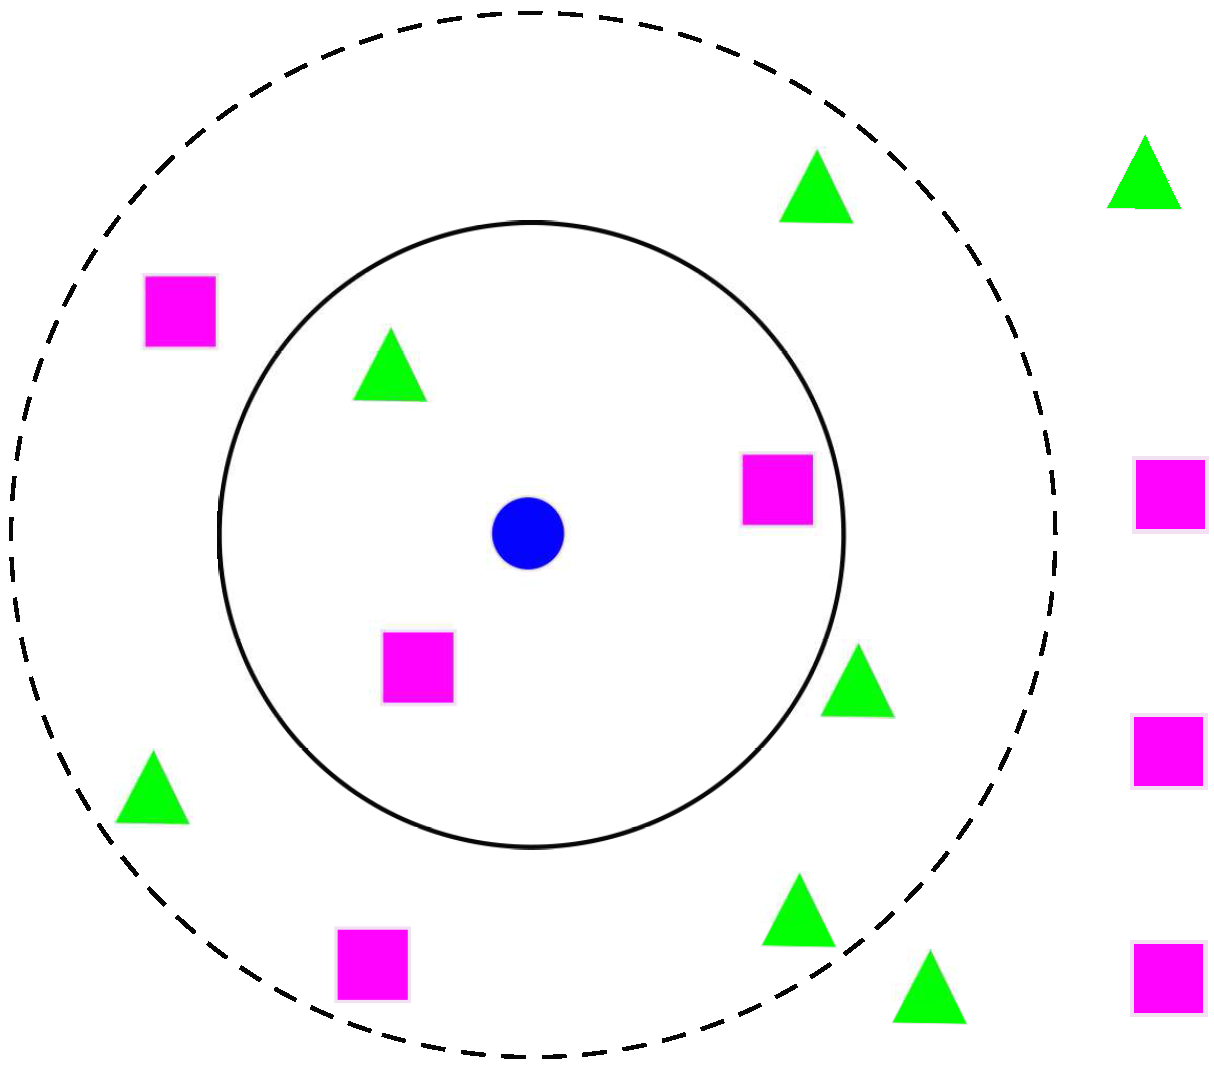
k-NN is one of the most central ML techniques in classification [60]. k-NN is a non-parametric lazy learning algorithm used for classification, which classifies the objects using their “k” nearest neighbours. k-NN only considers the neighbours around the object, not the underlying data distribution. Additionally, there is no training phase with the training data [61]. In Figure 4, an example of k-NN structure [35] is presented for determining BC diagnosis and prognosis if , the test sample (circle) is assigned to malignant BC (square) because there are 2 squares and only 1 triangle inside the inner circle. If , the test sample is assigned to benign BC (triangle).
3. ML Applications in BC Diagnosis and Prognosis
In the early 1990s, WBCD was released and in the next few decades, a large number of ML algorithms have been used to analyse this dataset. In this section, detailed reviews of ANNs, SVMs, DTs and k-NNs with their utilizations in BC diagnosis and prognosis using the WBCD are given. A complete list of the four methods with their references, algorithm names, sample strategies and classification accuracies will be shown in Table 2 at the end of this section. The WBCD includes 9 conclusive attributes to determine the BC class, excluding the first one (sample code number) and the last one (output class). A brief structure of WBCD attributes can be seen in Table 1 based on the contents in [9,10]. There are 699 samples in WBCD, but researchers generally remove 16 out of 699 samples as these contain missing values. In some cases, more samples are removed in the pre-processing phase.
In WBCD, ML techniques have been used to predict BC tumor class (benign or malignant) via analysing combinations of different values in key attributes. Because of the differences between individual patients, even if they have the same BC class, the values of different attributes will not be the same. Depending on these values, the same BC tumor class can be divided into different serious situations by physicians thus to assist cancer prognosis, such as predicting cancer susceptibility, survivability, progression and so on. Sequentially, effective treatments can be provided to the patients.
There is a wide variety of BC data including open source and private. WBCD is one of the three datasets collected by Wisconsin hospital in 1990s. Owing to the fact that many algorithms have been applied to WBCD dataset, it has strong comparability and representation. The classification accuracies of different algorithms range from 94.36% to 99.90%. Although a great number of algorithms have achieved very high accuracy, the development of different improved ML algorithms is still necessary for providing more alternative solutions to the real-wold complex BC data (or other medical data). Classification accuracy is a very important and intuitive criterion but it is not the only one. It should be stressed that different algorithms have specific advantages as well as drawbacks, so the development of new algorithms to further improve the existing ones is still indispensable. These algorithms can help to build healthcare systems to assist physicians as a second opinion for their final decision to improve decision accuracies. The ML algorithms listed in the next subsections are all used to analyse open source benchmark database, which start with ANNs, followed by SVMs, DTs and k-NNs.
3.1. ANNs
As early as 1993, a three-layer feedforward network with BP algorithm was utilized to predict whether patients had malignant or benign lesions by analysing a mammography atlas of breast cancer from a database of 133 cases [47]. The mammography atlas database was compiled by Taber and Dean in 1985 [62]. This paper proved ANN can be helpful in the mammography analysis at early on. A year after, Floyd et al. proposed an ANN method for predicting breast cancer from mammographic findings [41]. At that time, Floyd et al. used the basic BP algorithm with a three-layer architecture. The use of the ANN proved to give better diagnostic performance than the radiologists when the network output was compared to the radiologists’ categorical assessment. Both [41,47] utilized ANN to predict malignancy using different mammographic elements as inputs. The accuracies were significant and improved by 3–5% compared with conventional experts’ judgment.
Thus, more than twenty years ago, ANN has been proved excellent in BC diagnosis and prognosis. Although ANN has shown a good predictor of results in pattern classification problems, the ANN is not easily explained as ANN has been considered as a series of “black box”. By having a better understanding of ANN, a three-phase algorithm [63] has been proposed to unveil the ANN workings by building a weight-decay BP network, deleting insignificant connections and extracting rules by recursively discretizing the activation values of the hidden unit. The rules from this pruned network keep the accuracy as high as the rules from the standard ANN through a series of tests. After a year, based on the previous method, a modified pruned network was presented with fewer connections between each neuron, and higher accuracy [45]. This paper proposed an idea to extract rules from pruned ANN for BC diagnosis using two processes. The first step was to prune network structures by introducing a novel penalty function; as a result, only a few inputs, hidden units and connections were left. The penalty term was normally added to the error function so that unnecessary connections would have subtle weights assigned to them at end of the training process. Subtle-weighted connections were eliminated from the networks without too much effect on the accuracy of ANN prediction. The second step was to cluster the hidden unit activation values of a pruned network, which means fewer hidden unit activation values are considered and the accuracy of the original ANN is retained. These extracted rules in the “if-then” structure, which is similar to an expert system, has advantages of natural knowledge representation, uniform structure, separation of the knowledge from their processing, and coping with incomplete and uncertain knowledge. For WBCD analysis, simple rules were proposed to achieve more than accuracy on both the training set and testing set. There is a balance between the interpretability and the computational burden according to the practical requirements. This algorithm can provide interpretability but, when dealing with complex data, the computation for rule extraction by recursively discretizing the activation values of the hidden unit is extremely large. Setiono in 2000 showed that by pre-processing the WBCD data, the overall accuracy can be increased to more than [64].
In [65], an evolutionary ANN approach based on the Pareto-different evolution (PDE) algorithm was employed by combining the advantages of evolutionary ANN and PDE algorithm. This method not only has better network performance and architecture than ANN but also can deal with multi-objective problems by minimizing the errors and the number of hidden units. WBCD was used and an average accuracy of was achieved. The radial basis network (RBN) [66], general regression neural network (GRNN) [67] and probabilistic neural network (PNN) [68] were then used to examine the WBCD [69]. Authors did not modify the algorithms. The 683 complete data records were split into training and testing datasets to test these three kinds of ANNs. Compared with the classical multilayer perceptron (MLP), RBF (), PNN () and GRNN () all provided better performances than MLP (). According to overall performance, GRNN is considered to be a preferred ANN model to classify WBCD or similar medical data.
After years of studying ANNs applications in BC, researchers discovered hybrid methods, combining different approaches with ANNs, which achieved better outcomes in some aspects. The hybrid intelligent system aims to exploit the advantages of the constituent models and, at the same time, alleviate their limitations. In 2009, an expert system was introduced to detect BC in WBCD based on association rules (AR) and ANN [70]. The AR approach has been used to reduce the dimension of the database from 9 attributes to 4 attributes, without reducing the accuracy, while combining it with a basic ANN method. AR aims at discovering the patterns of co-occurrence of attributes in a database. Karabatak and Ince found that the 2nd (Uniformity of cell size), 8th (Normal nucleoli) and 9th (Mitoses) have the largest itemsets for benign class, and the 6th (Bare nuclei) has the largest itemset for malignant class so these four parameters were used as the inputs for ANN. Although the correct classification rate of AR + ANN () was just slightly higher than ANN (), the number of epochs needed to train AR + ANN (33 epochs) is lower than ANN (61 epochs). WBCD does not contain a lot of data, and therefore cannot fully reflect the advantage of AR + ANN in training time. The major limitation of this method is the difficulty of selecting appropriate features. If the features are not chosen well, the overall performance would be greatly affected.
In 2011, a metaplasticity ANN was proposed by Marcano-Cedeño et al. inspired by Shannon’s information theory and activity-dependent changes in neural functions named artificial metaplasticity multilayer perceptron (AMMLP) algorithm [71]. The word “metaplasticity” came from biological terminology, which is defined as the modulation of subsequent synaptic plasticity depending on prior activity [72]. This approach referenced the entropy concept of Shannon’s information theory [73] where the information in less frequent patterns is more than frequent ones. So the AMMLP algorithm provides prioritization for weights, updating the less frequent activations over the frequent activations. Thus, AMMLP increases the efficiency during the training phase. An overall classification accuracy of based on the WBCD was achieved using the AMMLP algorithm.
Two years later, rotation forest ANN (RF-ANN) was proposed to classify the entries in the WBCD [74]. Rotation Forest (RF) [75] is an ensemble classifier which uses a group of individual classifiers which are trained on different feature sets in a supervised classification problem. There are two main approaches to obtain the feature sets, one is the principal component analysis, which was used in this paper and the other is independent component analysis. When 9 classifiers were used in rotation forest, the classification accuracy using WBCD was at its best at . Particle swarm optimization ANN (PSO-ANN) was also tested. PSO is a stochastic optimization technique [76] that was inspired by the social behaviour of birds flocking and fish schooling. PSO was used to adjust the weights of an ANN to enhance the classification accuracy and was achieved using the PSO-ANN approach with the objective function Griewank.
In 2015, using genetic programming (GP) based on ANN [77], a new genetically optimized ANN (GOANN) algorithm was proposed to solve classification problems using the WBCD [78]. This paper took the best features of the GP to optimize both the weights and architecture for an ANN, it also proposed modified crossover and mutation operators which expanded the search area and increased the performance. This modified approach of crossover and mutation can eliminate the destructive nature of the standard method for crossover and mutation. classification accuracy has been achieved by using 10-fold cross validation. In the same year, was achieved using rough set BPANN (RS-BPANN) with 7 attributes (Number 1 to 7 from Table 1) [79]. A year later, a deep belief network (DBN) approach with ANN architecture (DBN-ANN) was proposed to help increase the accuracy of a computer-aided diagnosis (CAD) system in the area of breast cancer [80]. The main idea was to initialize the weights from the deep belief network path, learnt by the restricted Boltzmann machine (RBM). This method used the WBCD to test the results. A “nine inputs-four hidden-two hidden-one output” DBN-ANN architecture was used to test WBCD. was obtained by the utilizing scaled conjugate gradient BP method with 63.84–36.16 training-testing data and was obtained by applying Levenberg-Marquardt with 54.9–45.1 training-testing data.
3.2. SVMs
A few decades ago, a basic SVM approach was used to interrogate the WBCD [81] and classification accuracy was obtained. The result has proved the basic SVM approach achieved a high accuracy given quality data in BC. Then in 2007, a least square SVM (LS-SVM) [82] was used to improve the accuracy up to [83]. The main difference between SVM and LS-SVM is that LS-SVM uses a set of linear equations instead of quadratic programming in SVM due to the equality constraints in the formulation. An SVM-based algorithm combined with feature selection was proposed to achieve when classifying the WBCD data [84]. This method chose the best feature combination (of five features) by calculating the F-score of different feature combinations.
With the same database, a rough set (RS)-based SVM classifier (RS-SVM) was proposed, in which a different feature selection method using the rough set attribute reduction algorithm was applied to generate 20 subsets of attributes [85]. The further reduction of subsets (from 20 to 7) was achieved by calculating the correlation between each condition attribute with a decision attribute. The condition attribute with the weakest relevancy was kept, since the prediction accuracy can be improved by a weakly relevant feature [86]. The highest classification accuracies were , and , simultaneously the averages were , and in 50–50, 70–30 and 80–20 training-testing datasets. A year after, another paper was published by the same group using PSO-SVM to analyse the WBCD data to achieve a classification accuracy [87]. In 2014, five types of SVMs; proximal support vector machine (PSVM), finite Newton method for Lagrangian support vector machine (NSVM), linear programming support vector machine (LPSVM), Lagrangian support vector machine (LSVM), and smooth support vector machine (SSVM), were tested on WBCD data [88]. Overall accuracy was in LPSVM, in SSVM, in NSVM, in PSVM and in LSVM.
In 2017, a weighted-particle swarm optimization (WPSO) with smooth support vector machine (SSVM) for classification achieved [89]. In the same year, a two-step-SVM algorithm has been presented by combining two-step clustering algorithm with an efficient probabilistic support vector machine to analyse WBCD with classification accuracy. Different from other clustering methods, the two-step clustering algorithm can identify the number of clusters, provide effective analysis efficiency for big corpus, and have the capability of making groups of elements [90].
3.3. DTs
In 1996, Quinlan applied a modified C decision tree which has the benefits of having a smaller construction and higher predictive accuracy, to twenty UCI databases, which included the WBCD [91]. In 2005, 3 features were extracted from the WBCD using the C decision tree with expert suggestions. The 6 remaining features were used by an artificial immune recognition system (AIRS) [92] to do the classification. The new feature selection AIRS (FS-AIRS) could achieve accuracy [93]. A year after, a novel fuzzy decision tree (FDT) was constructed to test on the WBCD [94]. Each attribute was processed using fuzzy trapezoidal membership functions, and then the “if-then” fuzzy structure mapped into a decision tree form. This provided a compact and interpretable look with a classification accuracy. A hybrid model method for medical data classification was proposed by combining case-based reasoning and fuzzy decision tree methods (CBFDT) in 2011 [95]. Fan et al. discovered that researchers were interested in finding potential disease factors, so they proposed an approach consisting of applying a case-based fuzzy decision tree to diagnose the potential illness symptoms. It is a hybrid model method because before using the fuzzy decision tree, they used stepwise regression analysis (SRA) to select the important input factors. Afterwards they used a genetic algorithm to improve the accuracy of the fuzzy decision tree in medical symptom decisions. Genetic algorithms found the best number of fuzzy terms for every input data, then the fitness function was recalculated after getting each new set of fuzzy terms. The final result had an average classification accuracy of when used on data of the WBCD.
In 2014, a J48 decision tree method, originally developed by the WEKA project team [96], was used to classify WBCD with a classification accuracy of [97]. In 2016, an accuracy of was achieved using three steps [98]: clustering using farthest first clustering (FFC), pre-processing using outlier detection (OD) and classification using the J48 decision tree. By removing 120 extreme values from malignant data, the new dataset only contained 578 instances. Although classification accuracy has been attained, this algorithm has the limitation of not considering all instances. In the same year, a hybrid intelligent system for medical data classification was proposed [99] consisting of a combination of the fuzzy min-max (FMM) ANN [100,101], the classification and regression tree (CART) and random forest (FF) model [102]. This hybrid intelligent system combined the advantages of these three techniques. This novel system was able to learn incrementally from data samples (owing to the fuzzy min-max ANN), explain its predicted outputs (owing to the classification and regression tree) and achieve high classification performances (owing to random forest). By analysing the benchmark dataset WBCD, accuracy was obtained. In 2017, a voting classifier technique has been applied to WBCD. It is an ensemble approach to combine multiple models with a strategy that the predicted reliability of each classifier differs among the different types of output classes. This technique combined SVM, Naive Bayes and J48 using voting classifier technique to achieve which is better than each of individual classifiers [103].
3.4. k-NNs
k-NN related algorithms have a number of applications in BC diagnosis and prognosis. The quality of the classification depends on the selection of k. In 2000, the k-NN and fuzzy k-NN algorithms were implemented to classify the WBCD [104]. The different values of k from 1 to 15 were considered, and the best performance was when k equalled 1. The k-NN algorithm achieved the accuracy of in the testing set, and fuzzy k-NN acquired . In 2003, rank k-NN has been used to achieve [105]. In 2013, four methods of calculating distance were used for k-NN to determine the distance between each WBCD of the data points [106]. The results showed that the highest classification accuracy was when using the Euclidean distance with k = 1. The Cityblock distance with k = 1, achieved , and Cosine distance obtained and Correlation, .
4. Conclusions and Future Work
In this paper, we have provided explanations of different ML approaches and their applications in BC diagnosis and prognosis used to analyse the data in the benchmark database WBCD. ML techniques have shown their remarkable ability to improve classification and prediction accuracy. Various methods have been shown in Table 2 with references, algorithms, sampling strategies and classification accuracies, providing a clear and intuitive catalogue of information. Although lots of algorithms have achieved very high accuracy in WBCD, the development of improved algorithms is still necessary. Classification accuracy is a very important assessment criteria but it is not the only one. Different algorithms consider different aspects, and have different mechanisms. Although for several decades ANNs have dominated BC diagnosis and prognosis, it is clear that more recently alternative ML methods have been applied to intelligent healthcare systems to provide a variety of options to physicians.
In the last few years, our group has achieved many noteworthy results in improving the PSO algorithms [107,108,109,110]. Compared with traditional PSO algorithms, our modified PSO algorithms have better performances in many aspects. For instance, using the switching particle swarm optimization (SPSO) algorithm based on Markov chains and the competitive penalized method can achieve faster local convergence speed with higher accuracy and reliability, and the switching delayed particle swarm optimization (SDPSO) algorithm has been validated showing it can improve global search and increase possibility of reaching the global best. Next, we will test these different novel PSO algorithms in combination with ANN via tuning weights to find out whether we can achieve a higher classification accuracy with WBCD data. Additionally, our novel PSO algorithms can be applied to SVM to resolve the problem of parameter optimization in kernel function.
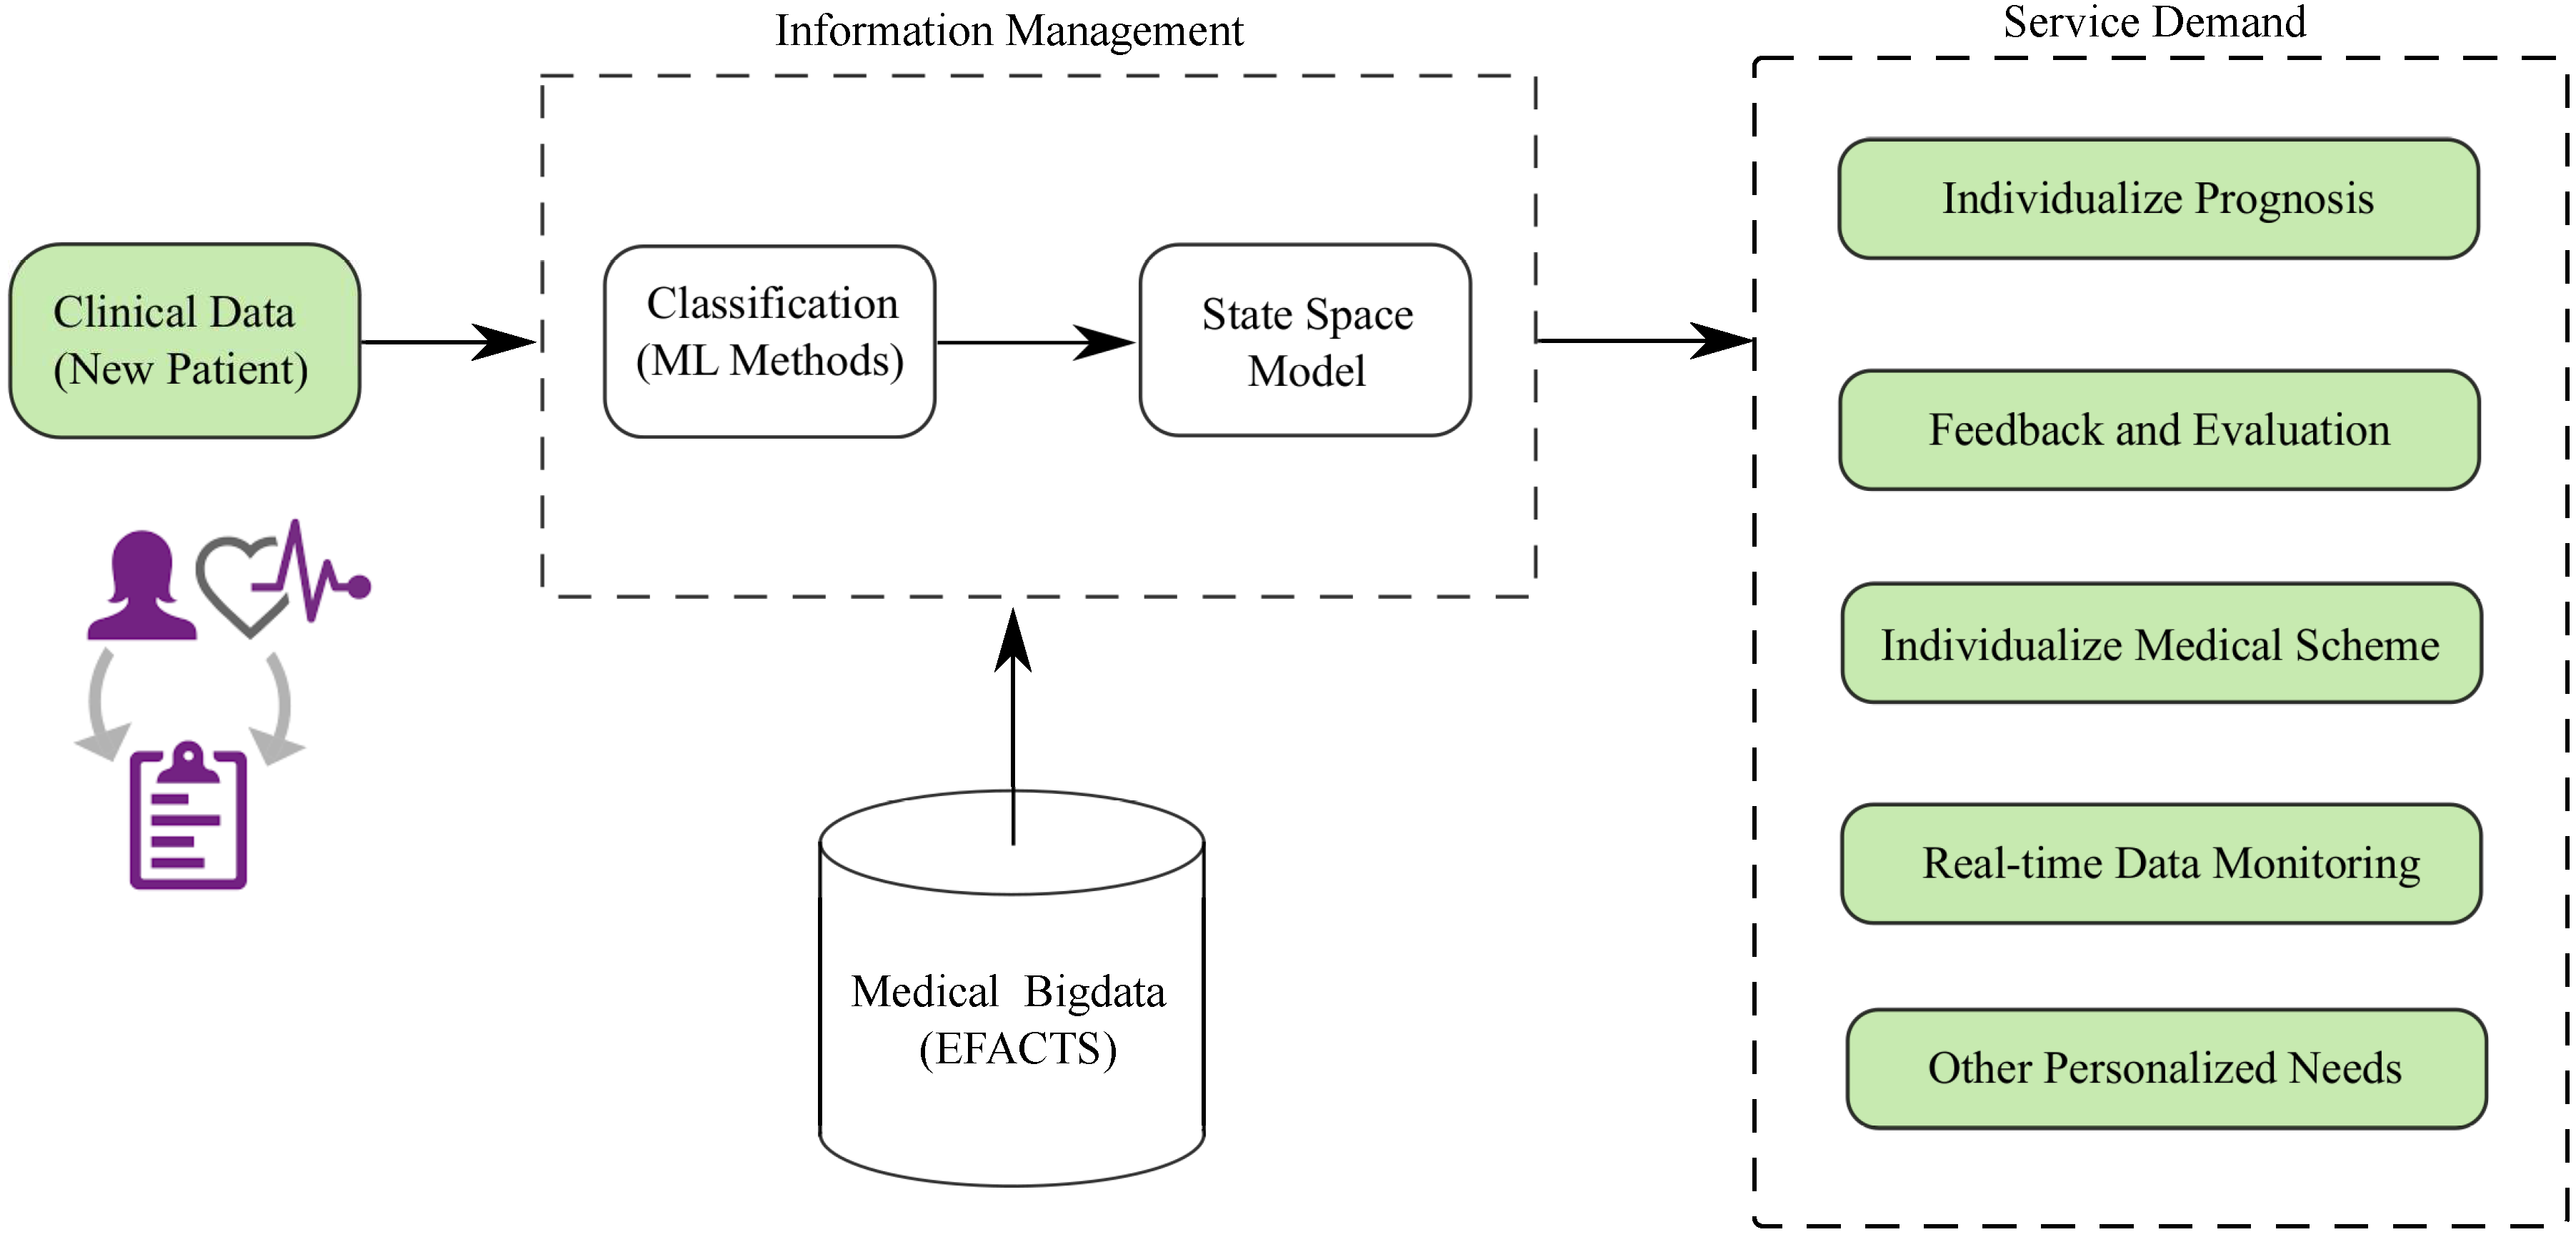
Furthermore, we are going to process a set of rare datasets obtained from Friedreich Ataxia (FRDA) patients. These datasets have been analysed using some traditional statistical approaches, such as cross-sectional [3] and linear regression analysis [111], to gain general statistical knowledge about the distribution and variation of the data. We intend to conduct an in-depth study of these datasets using ML techniques to explore some potential rules between different data and datasets consecutively and their state space model [112], with the purpose of establishing an intelligent FRDA healthcare system. The basic idea of our FRDA healthcare system shown in Figure 5, and the corresponding results will be published in future papers.
Author Contributions
W.Y. and Z.W. reviewed the literature, surveyed the updated state-of-the-art of the area, and wrote the paper. H.C. helped with the figures and diagrams. A.P. and X.L. justified the research problem and improved the presentation.
Conflicts of Interest
The authors declare no conflict of interest.
References
- Meesad, P.; Yen, G.G. Combined numerical and linguistic knowledge representation and its application to medical diagnosis. IEEE Trans. Syst. Man Cybern. 2003, 33, 206–222. [Google Scholar] [CrossRef]
- Pavlopoulos, S.A.; Delopoulos, A.N. Designing and implementing the transition to a fully digital hospital. IEEE Trans. Inf. Technol. Biomed. 1999, 3, 6–19. [Google Scholar] [CrossRef] [PubMed]
- Reetz, K.; Dogan, I.; Costa, A.S.; Dafotakis, M.; Fedosov, K.; Giunti, P.; Parkinson, M.H.; Sweeney, M.G.; Mariotti, C.; Panzeri, M.; et al. Biological and clinical characteristics of the European Friedreich’s Ataxia Consortium for Translational Studies (EFACTS) cohort: A cross-sectional analysis of baseline data. Lancet Neurol. 2015, 14, 174–182. [Google Scholar] [CrossRef]
- Barracliffe, L.; Arandjelović, O.; Humphris, G. A pilot study of breast cancer patients: Can machine learning predict healthcare professionals’ responses to patient emotions? In Proceedings of the International Conference on Bioinformatics and Computational Biology, Honolulu, HI, USA, 20–22 March 2017; pp. 101–106. [Google Scholar]
- Birkett, C.; Arandjelović, O.; Humphris, G. Towards objective and reproducible study of patient-doctor interaction: Automatic text analysis based VR-CoDES annotation of consultation transcripts. In Proceedings of the IEEE Engineering in Medicine and Biology Society Conference, Jeju Island, Korea, 11–15 July 2017; pp. 2638–2641. [Google Scholar]
- Chen, W.; Zheng, R.; Baade, P.D.; Zhang, S.; Zeng, H.; Bray, F.; Jemal, A.; Yu, X.Q.; He, J. Cancer statistics in China, 2015. CA Cancer J. Clin. 2016, 66, 115–132. [Google Scholar] [CrossRef] [PubMed]
- Siegel, R.L.; Miller, K.D.; Jemal, A. Cancer statistics, 2016. CA A Cancer J. Clin. 2016, 66, 7–30. [Google Scholar] [CrossRef] [PubMed]
- Torre, L.A.; Bray, F.; Siegel, R.L.; Ferlay, J.; Lortet-Tieulent, J.; Jemal, A. Global cancer statistics, 2012. CA Cancer J. Clin. 2015, 65, 87–108. [Google Scholar] [CrossRef] [PubMed]
- Mangasarian, O.L.; Setiono, R.; Wolberg, W.H. Pattern recognition via linear programming: Theory and application to medical diagnosis. In Large-Scale Numerical Optimization; SIAM: Philadelphia, PA, USA, 1990; pp. 22–31. [Google Scholar]
- Wolberg, W.H.; Mangasarian, O.L. Multisurface method of pattern separation for medical diagnosis applied to breast cytology. Proc. Natl. Acad. Sci. USA 1990, 87, 9193–9196. [Google Scholar] [CrossRef] [PubMed]
- Sharma, A.; Kulshrestha, S.; Daniel, S. Machine learning approaches for breast cancer diagnosis and prognosis. In Proceedings of the International Conference on Soft Computing and Its Engineering Applications, Changa, India, 1–2 December 2017. [Google Scholar]
- Delen, D.; Walker, G.; Kadam, A. Predicting breast cancer survivability: A comparison of three data mining methods. Artif. Intell. Med. 2005, 34, 113–127. [Google Scholar] [CrossRef] [PubMed]
- Funahashi, K.; Nakamura, Y. Approximation of dynamical systems by continuous time recurrent neural networks. Neural Netw. 1993, 6, 801–806. [Google Scholar] [CrossRef]
- Razi, M.A.; Athappilly, K. A comparative predictive analysis of neural networks (NNs), nonlinear regression and classification and regression tree (CART) models. Expert Syst. Appl. 2005, 29, 65–74. [Google Scholar] [CrossRef]
- Subasi, A.; Ercelebi, E. Classification of EEG signals using neural network and logistic regression. Comput. Methods Prog. Biomed. 2005, 78, 87–99. [Google Scholar] [CrossRef] [PubMed]
- Breiman, L.; Friedman, J.H.; Olshen, R.A.; Stone, C.J. Classification and Regression Trees; CRC Press: Boca Raton, FL, USA, 1984. [Google Scholar]
- Howell, A.; Cuzick, J.; Baum, M.; Buzdar, A.; Dowsett, M.; Forbes, J.F.; Hoctin-Boes, G.; Houghton, J.; Locker, G.Y.; Tobias, J.S.; et al. Results of the ATAC (Arimidex, Tamoxifen, Alone or in Combination) trial after completion of 5 years’ adjuvant treatment for breast cancer. Lancet 2004, 365, 60–62. [Google Scholar]
- Pincus, S.M.; Gladstone, I.M.; Ehrenkranz, R.A. A regularity statistic for medical data analysis. J. Clin. Monit. Comput. 1991, 7, 335–345. [Google Scholar] [CrossRef]
- Wasson, J.H.; Sox, H.C.; Neff, R.K.; Goldman, L. Clinical prediction rules: Application and methodological standards. N. Engl. J. Med. 1985, 313, 793–799. [Google Scholar] [CrossRef] [PubMed]
- West, M.; Blanchette, C.; Dressman, H.; Huang, E.; Ishida, S.; Spang, R.; Zuzan, H.; Olson, J.A.; Marks, J.R.; Nevins, J.R.; et al. Predicting the clinical status of human breast cancer by using gene expression profiles. Proc. Natl. Acad. Sci. USA 2001, 98, 11462–11467. [Google Scholar] [CrossRef] [PubMed]
- Paliwal, M.; Kumar, U.A. Neural networks and statistical techniques: A review of applications. Expert Syst. Appl. 2009, 36, 2–17. [Google Scholar] [CrossRef]
- Furundzic, D.; Djordjevic, M.; Bekic, A.J. Neural networks approach to early breast cancer detection. J. Syst. Archit. 1998, 44, 617–633. [Google Scholar] [CrossRef]
- Behrman, M.; Linder, R.; Assadi, A.H.; Stacey, B.R.; Backonja, M.-M. Classification of patients with pain based on neuropathic pain symptoms: Comparison of an artificial neural network against an established scoring system. Eur. J. Pain 2007, 11, 370–376. [Google Scholar] [CrossRef] [PubMed]
- Ture, M.; Kurt, I.; Kurum, A.T.; Ozdamar, K. Comparing classification techniques for predicting essential hypertension. Expert Syst. Appl. 2005, 29, 583–588. [Google Scholar] [CrossRef]
- Pérez-Ortiz, M.; Gutiérrez, P.A.; Hervás-Martínez, C.; Yao, X. Graph-Based Approaches for over-Sampling in the context of ordinal regression. IEEE Trans. Knowl. Data Eng. 2015, 27, 1233–1245. [Google Scholar] [CrossRef]
- Chang, L.-Y. Analysis of freeway accident frequencies: Negative binomial regression versus artificial neural network. Saf. Sci. 2005, 43, 541–557. [Google Scholar] [CrossRef]
- Kumar, U.A. Comparison of neural networks and regression analysis: A new insight. Expert Syst. Appl. 2005, 29, 424–430. [Google Scholar] [CrossRef]
- SubbaNarasimha, P.N.; Arinze, B.; Anandarajan, M. The predictive accuracy of artificial neural networks and multiple regression in the case of skewed data: Exploration of some issues. Expert Syst. Appl. 2000, 19, 117–123. [Google Scholar] [CrossRef]
- Hartigan, J.A. Clustering Algorithms; Wiley: New York, NY, USA, 1975. [Google Scholar]
- Cruz, J.A.; Wishart, D.S. Applications of machine learning in cancer prediction and prognosis. Cancer Inform. 2006, 2, 59–77. [Google Scholar] [CrossRef]
- McCulloch, W.S.; Pitts, W. A logical calculus of the ideas immanent in nervous activity. Bull. Math. Biophys. 1943, 5, 115–133. [Google Scholar] [CrossRef]
- Rumelhart, D.E.; Hinton, G.E.; Williams, R.J. Learning representations by back-propagating errors. Nature 1986, 323, 533–536. [Google Scholar] [CrossRef]
- Cortes, C.; Vapnik, V. Support-vector networks. Mach. Learn. 1995, 20, 273–297. [Google Scholar] [CrossRef]
- Quinlan, J.R. Induction of decision trees. Mach. Learn. 1986, 1, 81–106. [Google Scholar] [CrossRef]
- Cover, T.; Hart, P. Nearest neighbor pattern classification. IEEE Trans. Inf. Theory 1967, 13, 21–27. [Google Scholar] [CrossRef]
- Hinton, G.E. How neural networks learn from experience. Sci. Am. 1992, 267, 144–151. [Google Scholar] [CrossRef] [PubMed]
- Fu, Q.; Luo, Y.; Liu, J.; Bi, J.; Qiu, S.; Cao, Y.; Ding, X. Improving learning algorithm performance for spiking neural networks. In Proceedings of the 17th IEEE International Conference on Communication Technology, Chengdu, China, 27–30 October 2017. [Google Scholar]
- Liu, W.; Wang, Z.; Liu, X.; Zeng, N.; Liu, Y.; Alsaadi, F.E. A survey of deep neural network architectures and their applications. Neurocomputing 2017, 234, 11–26. [Google Scholar] [CrossRef]
- Wang, L.; Wang, Z.; Wei, G.; Alsaadi, F.E. Finite-time state estimation for recurrent delayed neural networks with component-based event-triggering protocol. IEEE Trans. Neural Netw. Learn. Syst. 2018, 29, 1046–1057. [Google Scholar] [CrossRef] [PubMed]
- Yang, F.; Dong, H.; Wang, Z.; Ren, W.; Alsaadi, F.E. A new approach to non-fragile state estimation for continuous neural networks with time-delays. Neurocomputing 2016, 197, 205–211. [Google Scholar] [CrossRef]
- Floyd, C.E.; Lo, J.Y.; Yun, A.J.; Sullivan, D.C.; Kornguth, P.J. Prediction of breast cancer malignancy using an artificial neural network. Cancer 1994, 74, 2944–2948. [Google Scholar] [CrossRef]
- Fogel, D.B.; Wasson, E.C.; Boughton, E.M. Evolving neural networks for detecting breast cancer. Cancer Lett. 1995, 96, 49–53. [Google Scholar] [CrossRef]
- Fogel, D.B.; Wasson, E.C.; Boughton, E.M.; Porto, V.W.; Angeline, P.J. Linear and neural models for classifying breast masses. IEEE Trans. Med. Imaging 1998, 17, 485–488. [Google Scholar] [CrossRef] [PubMed]
- Pendharkar, P.C.; Rodger, J.A.; Yaverbaum, G.J.; Herman, N.; Benner, M. Association, statistical, mathematical and neural approaches for mining breast cancer patterns. Expert Syst. Appl. 1999, 17, 223–232. [Google Scholar] [CrossRef]
- Setiono, R. Extracting rules from pruned neural networks for breast cancer diagnosis. Artif. Intell. Med. 1996, 8, 37–51. [Google Scholar] [CrossRef]
- Wilding, P.; Morgan, M.A.; Grygotis, A.E.; Shoffner, M.A.; Rosato, E.F. Application of backpropagation neural networks to diagnosis of breast and ovarian cancer. Cancer Lett. 1994, 77, 145–153. [Google Scholar] [CrossRef]
- Wu, Y.; Giger, M.L.; Doi, K.; Vyborny, C.J.; Schmidt, R.A.; Metz, C.E. Artificial neural networks in mammography: Application to decision making in the diagnosis of breast cancer. Radiology 1993, 187, 81–87. [Google Scholar] [CrossRef] [PubMed]
- Minsky, M.; Papert, S. Perceptrons; MIT Press: Cambridge, MA, USA, 1969. [Google Scholar]
- Rumelhart, D.E.; Mcclellend, J.L. Parallel Distributed Processing: Explorations in the Microstructure of Cognition; MIT Press: Cambridge, MA, USA, 1986. [Google Scholar]
- Vapnik, V.N. An overview of statistical learning theory. IEEE Trans. Neural Netw. 1999, 10, 988–999. [Google Scholar] [CrossRef] [PubMed]
- Cristianini, N.; Shawe-Taylor, J. An Introduction to Support Vector Machines and Other Kernel-Based Learning Methods; Cambridge University Press: Cambridge, UK, 2000. [Google Scholar]
- Schölkopf, B.; Sung, K.; Burges, C.J.C.; Girosi, F.; Niyogi, P.; Poggio, T.; Vapnik, V. Comparing Support vector machines with Gaussian kernels to radial basis function classifiers. IEEE Trans. Signal Process. 1997, 45, 2758–2765. [Google Scholar] [CrossRef]
- Wan, V.; Campbell, W.M. Support vector machines for speaker verification and identification. In Proceedings of the IEEE Signal Processing Society Workshop on Neural Networks for Signal Processing, Sydney, Australia, 11–13 December 2000; Volume 2, pp. 775–784. [Google Scholar]
- Joachims, T. Transductive inference for text classification using support vector machines. In Proceedings of the International Conference on Machine Learning, Bled, Slovenia, 27–30 June 1999; Volume 99, pp. 200–209. [Google Scholar]
- Lee, Y.-J.; Mangasarian, O.L.; Wolberg, W.H. Breast cancer survival and chemotherapy: A support vector machine analysis. DIMACS Ser. Discret. Math. Theor. Comput. Sci. 2000, 55, 1–20. [Google Scholar]
- De Mántaras, R.L. A distance-based attribute selection measure for decision tree induction. Mach. Learn. 1991, 6, 81–92. [Google Scholar] [CrossRef]
- Mingers, J. An empirical comparison of selection measures for decision-tree induction. Mach. Learn. 1989, 3, 319–342. [Google Scholar] [CrossRef]
- Apté, C.; Weiss, S. Data mining with decision trees and decision rules. Future Gener. Comput. Syst. 1997, 13, 197–210. [Google Scholar] [CrossRef]
- Quinlan, J.R. C4.5: Programs for Machine Learning; Elsevier: New York, NY, USA, 1993. [Google Scholar]
- Moreno-Seco, F.; Micó, L.; Oncina, J. A modification of the LAESA algorithm for approximated k-NN classification. Pattern Recognit. Lett. 2003, 24, 47–53. [Google Scholar] [CrossRef]
- Senturk, Z.K.; Kara, R. Breast cancer diagnosis via data mining: Performance analysis of seven different algorithms. Comput. Sci. Eng. 2014, 4, 35–46. [Google Scholar] [CrossRef]
- Tabár, L.; Dean, P.B. Teaching Atlas of Mammography; Thieme: Stuttgart, Germany, 1985. [Google Scholar]
- Setiono, R.; Liu, H. Understanding neural networks via rule extraction. In Proceedings of the 14th International Joint Conference on Artificial Intelligence, Montreal, QC, Canada, 20–25 August 1995; Volume 1, pp. 480–485. [Google Scholar]
- Setiono, R. Generating concise and accurate classification rules for breast cancer diagnosis. Artif. Intell. Med. 2000, 18, 205–219. [Google Scholar] [CrossRef]
- Abbass, H.A. An evolutionary artificial neural networks approach for breast cancer diagnosis. Artif. Intell. Med. 2002, 25, 265–281. [Google Scholar] [CrossRef]
- Chen, S.; Cowan, C.F.N.; Grant, P.M. Orthogonal least squares learning algorithm for radial basis function networks. IEEE Trans. Neural Netw. 1991, 2, 302–309. [Google Scholar] [CrossRef] [PubMed]
- Lu, C.; Brabanter, J.D.; Huffel, S.V.; Vergote, I.; Timmerman, D. Using artificial neural networks to predict malignancy of ovarian tumors. In Proceedings of the 23th Annual International Conference of the IEEE Engineering in Medicine and Biology Society, Istanbul, Turkey, 25–28 October 2001; pp. 1637–1640. [Google Scholar]
- Bishop, C. Neural Networks for Pattern Recognition; Oxford University Press: Oxford, UK, 1995. [Google Scholar]
- Kiyan, T.; Yildirim, T. Breast cancer diagnosis using statistical neural networks. IU-J. Electr. Electron. Eng. 2004, 4, 1149–1153. [Google Scholar]
- Karabatak, M.; Ince, M.C. An expert system for detection of breast cancer based on association rules and neural network. Expert Syst. Appl. 2009, 36, 3465–3469. [Google Scholar] [CrossRef]
- Marcano-Cedeño, A.; Quintanilla-Domłnguez, J.; Andina, D. WBCD breast cancer database classification applying artificial metaplasticity neural network. Expert Syst. Appl. 2011, 38, 9573–9579. [Google Scholar] [CrossRef]
- Abraham, W.C.; Bear, M.F. Metaplasticity: The plasticity of synaptic plasticity. Trends Neurosci. 1996, 19, 126–130. [Google Scholar] [CrossRef]
- Shannon, C.E. A mathematical theory of communication. ACM SIGMOBILE Mob. Comput. Commun. Rev. 2001, 5, 3–55. [Google Scholar] [CrossRef]
- Koyuncu, H.; Ceylan, R. Artificial neural network based on rotation forest for biomedical pattern classification. In Proceedings of the 36th International Conference on Telecommunications and Signal Processing, Rome, Italy, 2–4 July 2013; pp. 581–585. [Google Scholar]
- Rodriguez, J.; Cuncheva, L.; Alonso, C.J. Rotation forest: A new classifier ensemble method. IEEE Trans. Pattern Anal. Mach. Intell. 2006, 28, 1619–1630. [Google Scholar] [CrossRef] [PubMed]
- Parsopoulos, K.E.; Vrahatis, M.N. Particle swarm optimization method for constrained optimization problems. Intell. Technol. Theory Appl. New Trends Intell. Technol. 2002, 76, 214–220. [Google Scholar]
- Koza, J.R.; Rice, J.P. Genetic generation of both the weights and architecture for a neural network. In Proceedings of the IJCNN-91-Seattle International Joint Conference on Neural Networks, Seattle, WA, USA, 8–12 July 1991; Volume 2, pp. 397–404. [Google Scholar]
- Bhardwaj, A.; Tiwari, A. Breast cancer diagnosis using genetically optimized neural network model. Expert Syst. Appl. 2015, 42, 4611–4620. [Google Scholar] [CrossRef]
- Nahato, K.B.; Harichandran, K.N.; Arputharaj, K. Knowledge mining from clinical datasets using rough sets and backpropagation neural network. Comput. Math. Methods Med. 2015, 2015, 460189. [Google Scholar] [CrossRef] [PubMed]
- Abdel-Zaher, A.M.; Eldeib, A.M. Breast cancer classification using deep belief networks. Expert Syst. Appl. 2016, 46, 139–144. [Google Scholar] [CrossRef]
- Bennett, K.P.; Blue, J.A. A support vector machine approach to decision trees. In Proceedings of the IEEE International Joint Conference on Neural Networks, Anchorage, AK, USA, 4–9 May 1998; Volume 3, pp. 2396–2401. [Google Scholar]
- Suykens, J.A.K.; Vandewalle, J. Least squares support vector machine classifiers. Neural Proccess. Lett. 1999, 9, 293–300. [Google Scholar] [CrossRef]
- Polat, K.; Güneş, S. Breast cancer diagnosis using least square support vector machine. Digit. Signal Process. 2007, 17, 694–701. [Google Scholar] [CrossRef]
- Akay, M.F. Support vector machines combined with feature selection for breast cancer diagnosis. Expert Syst. Appl. 2009, 36, 3240–3247. [Google Scholar] [CrossRef]
- Chen, H.-L.; Yang, B.; Liu, J.; Liu, D.-Y. A support vector machine classifier with rough set-based feature selection for breast cancer diagnosis. Expert Syst. Appl. 2011, 38, 9014–9022. [Google Scholar] [CrossRef]
- John, G. H.; Kohavi, R.; Pfleger, K. Irrelevant features and the subset selection problem. In Proceedings of the Eleventh International Conference on Machine Learning, New Brunswick, NJ, USA, 10–13 July 1994; pp. 121–129. [Google Scholar]
- Chen, H.-L.; Yang, B.; Wang, G.; Wang, S.-J.; Liu, J.; Liu, D.-Y. Support vector machine based diagnostic system for breast cancer using swarm intelligence. J. Med. Syst. 2012, 36, 2505–2519. [Google Scholar] [CrossRef] [PubMed]
- Azar, A.T.; El-Said, S.A. Performance analysis of support vector machines classifiers in breast cancer mammography recognition. Neural Comput. Appl. 2014, 24, 1163–1177. [Google Scholar] [CrossRef]
- Latchoumi, T.P.; Parthiban, L. Abnormality detection using weighed particle swarm optimization and smooth support vector machine. Biomed. Res. 2017, 28, 4749–4751. [Google Scholar]
- Osman, A.H. An enhanced breast cancer diagnosis scheme based on two-step-SVM technique. Int. J. Adv. Comput. Sci. Appl. 2017, 8, 158–165. [Google Scholar]
- Quinlan, J.R. Improved use of continuous attributes in C4.5. J. Artif. Intell. Res. 1996, 4, 77–90. [Google Scholar]
- Watkins, A.B.; Boggess, L.C. A resource limited artificial immune classifier. In Proceedings of the 2002 Congress on Evolutionary Computation, Honolulu, HI, USA, 12–17 May 2002; pp. 926–931. [Google Scholar]
- Polat, K.; Sahan, S.; Kodaz, H.; Gnes, S. A new classification method for breast cancer diagnosis: Feature selection artificial immune recognition system (FS-AIRS). In Proceedings of the International Conference on Natural Computation, Changsha, China, 27–29 August 2005; Volume 3611, pp. 830–838. [Google Scholar]
- Pach, F.P.; Abonyi, J. Association rule and decision tree based methods for fuzzy rule base generation. World Acad. Sci. Eng. Technol. 2006, 13, 45–50. [Google Scholar]
- Fan, C.-Y.; Chang, P.-C.; Lin, J.-J.; Hsieh, J.C. A hybrid model combining case-based reasoning and fuzzy decision tree for medical data classification. Appl. Soft Comput. 2011, 11, 632–644. [Google Scholar] [CrossRef]
- Witten, I.H.; Frank, E.; Trigg, L.E.; Hall, M.A.; Holmes, G.; Cunningham, S.J. Weka: Practical Machine Learning Tools and Techniques with Java Implementations. Available online: https://researchcommons.waikato.ac.nz/handle/10289/1040 (accessed on 10 January 2018).
- Sumbaly, R.; Vishnusri, N.; Jeyalatha, S. Diagnosis of breast cancer using decision tree data mining technique. Int. J. Comput. Appl. 2014, 98, 16–24. [Google Scholar] [CrossRef]
- Devi, R.D.H.; Devi, M.I. Outlier detection algorithm combined with decision tree classifier for early diagnosis of breast cancer. Int. J. Adv. Eng. Technol. 2016, 12, 93–98. [Google Scholar]
- Seera, M.; Lim, C.P. A hybrid intelligent system for medical data classification. Expert Syst. Appl. 2014, 41, 2239–2249. [Google Scholar] [CrossRef]
- Frayman, Y.; Wang, L. Data mining using dynamically constructed recurrent fuzzy neural networks. In Proceedings of the Pacific-Asia Conference on Knowledge Discovery and Data Mining, Melbourne, Australia, 15–17 April 1998; pp. 122–131. [Google Scholar]
- Wang, L.; Chu, F.; Xie, W. Accurate cancer classification using expressions of very few genes. IEEE/ACM Trans. Comput. Biol. Bioinform. 2007, 4, 40–53. [Google Scholar] [CrossRef] [PubMed]
- Zhang, J.; Zulkernine, M.; Haque, A. Random-forests-based network intrusion detection systems. IEEE Trans. Syst. Man Cybern. 2008, 38, 649–659. [Google Scholar] [CrossRef]
- Kumar, U.K.; Nikhil, M.B.S.; Sumangali, K. Prediction of breast cancer using voting classifier technique. In Proceedings of the IEEE International Conference on Smart Technologies and Management for Computing, Communication, Controls, Energy and Materials, Chennai, India, 2–4 August 2017. [Google Scholar]
- Sarkar, M.; Leong, T.Y. Application of k-nearest neighbors algorithm on breast cancer diagnosis problem. In Proceedings of the AMIA Symposium, Los Angeles, CA, USA, 4–8 November 2000; pp. 759–763. [Google Scholar]
- Bagui, S.C.; Bagui, S.; Pal, K.; Pal, N.R. Breast cancer detection using rank nearest neighbor classification rules. Pattern Recognit. 2003, 36, 25–34. [Google Scholar] [CrossRef]
- Medjahed, S.A.; Ait Saadi, T.; Benyettou, A. Breast cancer diagnosis by using k-nearest neighbor with different distances and classification rules. Int. J. Comput. Appl. 2013, 62, 1–5. [Google Scholar]
- Zeng, N.; Wang, Z.; Li, Y.; Du, M.; Liu, X. A hybrid EKF and switching PSO algorithm for joint state and parameter estimation of lateral flow immunoassay models. IEEE/ACM Trans. Comput. Biol. Bioinform. 2012, 9, 321–329. [Google Scholar] [CrossRef] [PubMed]
- Zeng, N.; Wang, Z.; Zhang, H.; Alsaadi, F.E. A novel switching delayed PSO algorithm for estimating unknown parameters of lateral flow immunoassay. Cogn. Comput. 2016, 8, 143–152. [Google Scholar] [CrossRef]
- Tang, Y.; Wang, Z.; Fang, J. Parameters identification of unknown delayed genetic regulatory networks by a switching particle swarm optimization algorithm. Expert Syst. Appl. 2011, 38, 2523–2535. [Google Scholar] [CrossRef]
- Tang, Y.; Wang, Z.; Fang, J. Feedback learning particle swarm optimization. Appl. Soft Comput. 2011, 11, 4713–4725. [Google Scholar] [CrossRef]
- Reetz, K.; Dogan, I.; Hilgers, R.D.; Giunti, P.; Mariotti, C.; Durr, A.; Boesch, S.; Klopstock, T.; de Rivera, F.J.R.; Schöls, P.L.; et al. Progression characteristics of the European Friedreich’s Ataxia Consortium for Translational Studies (EFACTS): A 2 year cohort study. Lancet Neurol. 2016, 15, 1346–1354. [Google Scholar] [CrossRef]
- Liu, Q.; Wang, Z.; He, X.; Ghinea, G.; Alsaadi, F.E. A resilient approach to distributed filter design for time-varying systems under stochastic nonlinearities and sensor degradation. IEEE Trans. Signal Process. 2017, 65, 1300–1309. [Google Scholar] [CrossRef]
Figure 1.
A simple example of how ANN is trained to predict the diagnostic outcome from six inputs and one hidden layer with 8 neurons.
Figure 1.
A simple example of how ANN is trained to predict the diagnostic outcome from six inputs and one hidden layer with 8 neurons.

Figure 2.
A simple example of how an SVM might work in distinguishing between benign and malignant tumor.
Figure 2.
A simple example of how an SVM might work in distinguishing between benign and malignant tumor.

Figure 3.
An example of how DT is used to solve BC diagnosis problem.

Figure 4.
k-Nearest neighbor for breast cancer diagnosis. Blue circle means the test sample, green triangle means the malignant BC and pink square means the benign BC.
Figure 4.
k-Nearest neighbor for breast cancer diagnosis. Blue circle means the test sample, green triangle means the malignant BC and pink square means the benign BC.

Figure 5.
Friedreich Ataxia healthcare system model.


Table 1.
WBCD Attributes.
| Number | Attribute | Domain |
|---|---|---|
| 0 | Sample code number | id number |
| 1 | Clump Thickness | 1–10 |
| 2 | Uniformity of Cell Size | 1–10 |
| 3 | Uniformity of Cell Shape | 1–10 |
| 4 | Marginal Adhesion | 1–10 |
| 5 | Single Epithelial Cell Size | 1–10 |
| 6 | Bare Nuclei | 1–10 |
| 7 | Bland Chromatin | 1–10 |
| 8 | Normal Nucleoli | 1–10 |
| 9 | Mitoses | 1–10 |
| 10 | Class | 2 for benign |
| 4 for malignant |
Table 2.
Summary list of ML methods involving the use of ANNs, SVMs, DTs and k-NNs in WBCD.
| References | Algorithms | Sampling Strategies | Classification Accuracies (%) |
|---|---|---|---|
| Quinlan 1996 [91] | C DT | 10–fold cross validation | |
| Setiono 1996 [45] | Pruned ANN | 50–50 training-testing | |
| Bennett & Blue 1998 [81] | SVM | 5–fold cross validation | |
| Setiono 2000 [64] | Neuro-rule ANN | 10-fold cross validation | |
| Sarkar & Leong 2000 [104] | k-NN | 50–50 training-testing | |
| Fuzzy k-NN | 50–50 training-testing | ||
| Abbass 2002 [65] | EANN | 80–20 training-testing | |
| Bagui et al., 2003 [105] | k-RNN | 10-fold cross validation | |
| Kiyan & Yildirim 2004 [69] | RBN | 50–50 training-testing | |
| GRNN | 50–50 training-testing | ||
| PNN | 50–50 training-testing | ||
| MLP | 50–50 training-testing | ||
| Polat et al., 2005 [93] | C + FS-AIRS | 10–fold cross validation | |
| Pach & Abonyi 2006 [94] | F-DT | 10–fold cross validation | |
| Polat & Gne 2007 [83] | LS-SVM | 10–fold cross validation | |
| Akay 2009 [84] | F-score-SVM | 10–fold cross validation | |
| Karabatak & Ince 2009 [70] | AR-ANN | 3–fold cross validation | |
| Marcano-Cedeño et al., 2011 [71] | AMMLP | 60–40 training-testing | |
| Chen et al., 2011 [85] | RS-SVM | 80–20 training-testing | |
| Fan et al., 2011 [95] | CBFDT | 75–25 training-testing | |
| Chen et al., 2012 [87] | PSO-SVM | 10-fold cross validation | |
| Koyuncu & Ceylan 2013 [74] | RF-ANN | 50–50 training-testing | |
| PSO-ANN | 50–50 training-testing | ||
| Medjahed & Saadi 2013 [106] | k-NN (Euclidean) | Holdout method | |
| Azar & El-Said 2014 [88] | PSVM | 4–fold cross validation | |
| NSVM | 4–fold cross validation | ||
| LPSVM | 4–fold cross validation | ||
| LSVM | 4–fold cross validation | ||
| SSVM | 4–fold cross validation | ||
| Sumbaly et al., 2014 [97] | J48 | 10–fold cross validation | |
| Seera & Lim 2014 [99] | FMM-CART-RF | 50–50 training-testing | |
| Bhardwaj & Tiwari 2015 [78] | GOANN | 10-fold cross validation | |
| Nahato et al., 2015 [79] | RS-BPANN | 80–20 training-testing | |
| Abdel-Zaher & Eldeib 2016 [80] | DBN-ANN | – training-testing | |
| Devi & Devi 2016 [98] | FFC + OD + J48 | 10–fold cross validation | |
| Kumar et al., 2017 [103] | SVM-Naive Bayes-J48 | 10–fold cross validation | |
| Latchoumi & Parthiban 2017 [89] | WPSO-SSVM | 5–fold cross validation | |
| Osman 2017 [90] | Two-Step-SVM | 10–fold cross validaiton |
“– training-testing” means of data for training set and of data for testing set. The algorithm only uses 578 of 699 samples.
© 2018 by the authors. Licensee MDPI, Basel, Switzerland. This article is an open access article distributed under the terms and conditions of the Creative Commons Attribution (CC BY) license (http://creativecommons.org/licenses/by/4.0/).
Share and Cite
MDPI and ACS Style
Yue, W.; Wang, Z.; Chen, H.; Payne, A.; Liu, X. Machine Learning with Applications in Breast Cancer Diagnosis and Prognosis. Designs 2018, 2, 13. https://doi.org/10.3390/designs2020013
AMA Style
Yue W, Wang Z, Chen H, Payne A, Liu X. Machine Learning with Applications in Breast Cancer Diagnosis and Prognosis. Designs. 2018; 2(2):13. https://doi.org/10.3390/designs2020013
Chicago/Turabian StyleYue, Wenbin, Zidong Wang, Hongwei Chen, Annette Payne, and Xiaohui Liu. 2018. "Machine Learning with Applications in Breast Cancer Diagnosis and Prognosis" Designs 2, no. 2: 13. https://doi.org/10.3390/designs2020013