
Changes in Foot Shape after Long-Distance Running

Faculty of Sport Sciences, Waseda University, 2-579-15, Mikajima, Tokorozawa, Saitama 359-1192, Japan
*
Author to whom correspondence should be addressed.
J. Funct. Morphol. Kinesiol. 2016, 1(1), 30-38; https://doi.org/10.3390/jfmk1010030
Submission received: 8 October 2015
/
Revised: 3 December 2015
/
Accepted: 7 December 2015
/
Published: 10 December 2015
Abstract
:Changes in foot shape during long-distance running may lead to alteration in shoe fit. However, little information is available on changes in foot shape following long-distance running. The purpose of this study was to assess changes in foot shape in experienced runners after a single long-distance run. Data from the right feet of 21 subjects were obtained using a foot scanner before and after running 35 km on an asphalt road. After the run, the dorsal height, navicular height, and arch height ratio were significantly decreased. Midfoot cross-sectional shape after the run was deformed laterally compared to before running. Lateral deformity of the lateral dorsum was seen in 76.2% of the feet. For the medial side, 47.6% of feet deformed medially and 38.1% of feet did not change. The findings of the present study suggest that foot shape is altered during a single long-distance run. These results suggest that footwear fit and comfort could be affected during long distance running because athletes tie their shoelaces based on their pre-running foot shape.
1. Introduction
In humans, the foot acts as an interface between body and ground and plays an important role in shock attenuation and functional adaptation during weight bearing tasks because of its mechanically-favorable dome shape and complex structure.
The shape of the foot is of interest for developing and designing footwear. However, foot shape does not remain fixed. For example, postural changes occur in the feet of pregnant women [1] and after exercise; McWhorter found that the foot volume change differed depending on the type of exercise, including loaded or unloaded and dynamic or static activity [2]. In recent years, new methodologies for dynamic, three-dimensional (3D) foot shape analysis have been developed to understand foot dynamics [3,4], and a few researchers have analyzed changes in foot shape during walking using a dynamic cross-sectional measurement [5] and a laser-triangulation principle with a multiple-line illumination technique [6]. These studies have shown that mechanical load properties are some of the factors affecting foot shape, and exercise has the potential to change foot shape. Changes in foot shape during long distance running leading to alteration in shoe fit is possible because long-distance runners tie their shoelaces tightly before running and do not retighten them during long-distance running in most cases. However, little information is available on changes in foot shape following long-distance running.
Poorly-fitted footwear is particularly relevant for dermatologic problems such as blisters and subungual hematomas owing to foot movement within footwear resulting in increased friction during long-distance running. Previous research has shown 0.2%–39% of marathon runners report to a medical tent for running-related blisters, which are the most common problem for long-distance runners [7]. Van Tiggelen et al. reported that runners who develop foot blisters experience significantly more knee overuse injuries in their knee during basic military training [8]. Although skin problems are often considered less serious than musculoskeletal injuries, painful blisters can have a negative effect on performance and may cause secondary musculoskeletal problems due to compensatory movement to avoid pain.
In recent years, 3D surface scanning systems have been used to obtain 3D digital representations of parts of the human body, calculate volume and cross-sectional information, and provide a quantitative description of the body part. Acquiring quantitative 3D foot shape data will improve our understanding of the changes in the shape of the foot under different loading conditions, which could be relevant for the design of foot-wear and orthotic devices [9].
Information on shape change occurring during long-distance running is of great importance for the development of running footwear, as proper fit is essential to achieve high-level performance and prevent injury. The purpose of this study was to measure changes in foot shape using a 3D foot scanner in experienced runners after a single long-distance run.
2. Materials and Methods
2.1. Subjects
A total of 22 male collegiate runners participated in this study (mean age, 20.2 ± 1.0 years; mean height, 170.9 ± 3.9 cm; mean weight, 54.3 ± 3.7 kg). At the time of the experiment, the study participants were on a university track and field team, and they participated in training sessions five or six days a week. The mean best performance on a 10,000 m run was 30 min 12 ± 52 s. All subjects were free from lower extremity and back pain, had no history of serious injuries or operative treatment, and had no subjective symptoms that would interfere with running. This study was approved by the institutional review board, and informed consent was obtained from all participants before the study.
2.2. Data Collection
A foot scanner (JMS-2100CU, Dream GP, Osaka, Japan) was used to obtain the 3D foot shape. Since this scanner is portable, we were able to obtain 3D foot shape data at sports fields. We confirmed the accuracy of the scanner used in this study beforehand. Using values obtained by scanning a cubic reference (10.0 cm × 10.0 cm × 10.0 cm) object, we compared the observed value with the true value, and the error was less than 0.2 mm each for longitudinal, transversal and vertical direction. Measurement repeatability was assessed by repeatedly analyzing three feet (three times each), with differences less than 0.2 mm for lengths and 0.2° for angles. Subjects were instructed to stand in a relaxed position with their bare feet approximately shoulder width apart and asked to align the longitudinal axis of their foot, which is the line connecting the most posterior point of the heel to the head of the second digit, parallel with the guidelines drawn on the foot bearing area of the foot scanner. Anatomical landmarks of the foot including the most medial point of the first metatarsophalangeal joint (1 MTJ), the most lateral point of the fifth metatarsophalangeal joint (5 MTJ), the center of the posterior calcaneus, the insertion of the Achilles tendon (superior edge of the posterior calcaneus), and the most medial point of the navicular were identified and marked using a permanent marker pen prior to pre-run scanning, and these marks were retained until the scanning session after running. The marks and their coordinates were automatically obtained and used to calculate parameters by the foot scanner.
Foot shape of the right and left foot was obtained before and after a 35 km road run with the subjects standing in an upright bipedal position. The average time to complete the 35 km run was 1 h 56 min 39 s. Total training session time, which included warm up and cool down, was approximately 3 h. This is the time between the two scans. The roadway surface was primarily asphalt, and the subjects wore their own footwear.
2.3. Data Processing
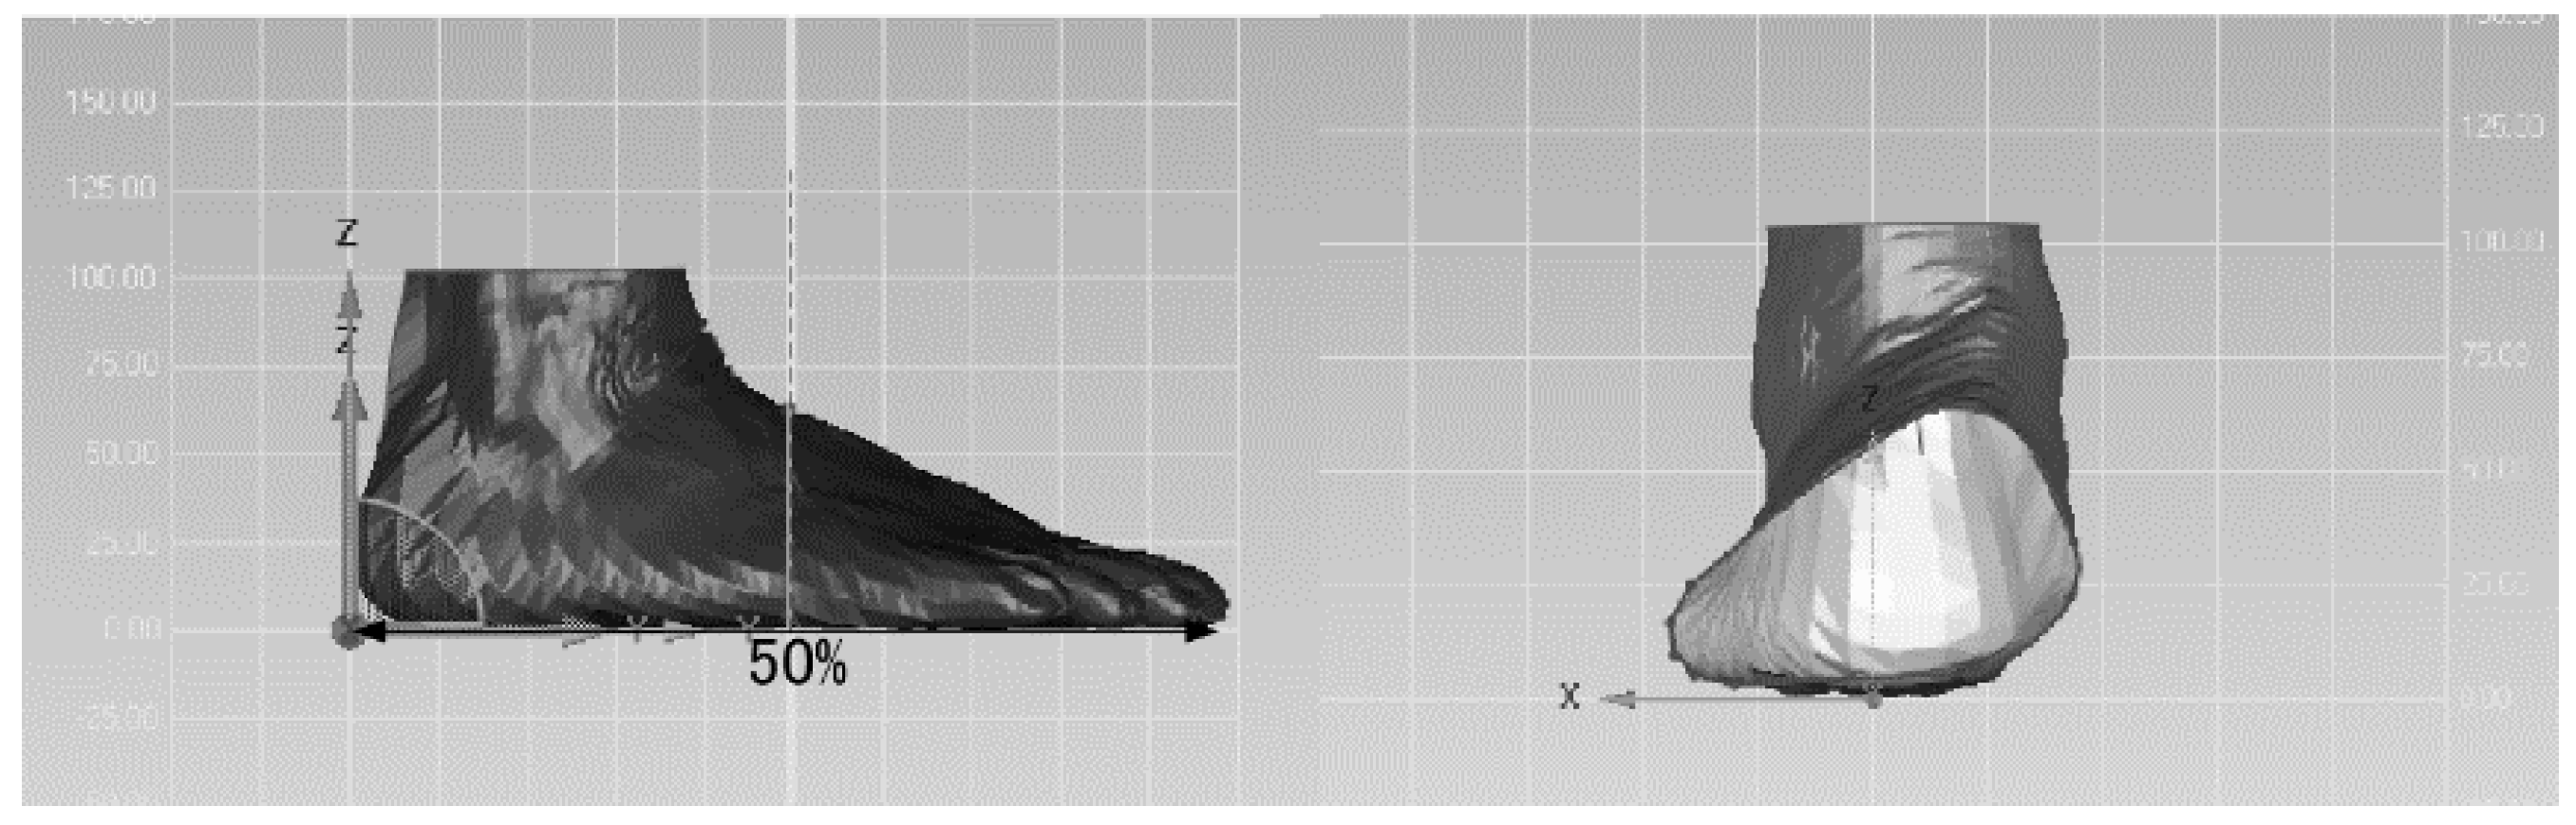
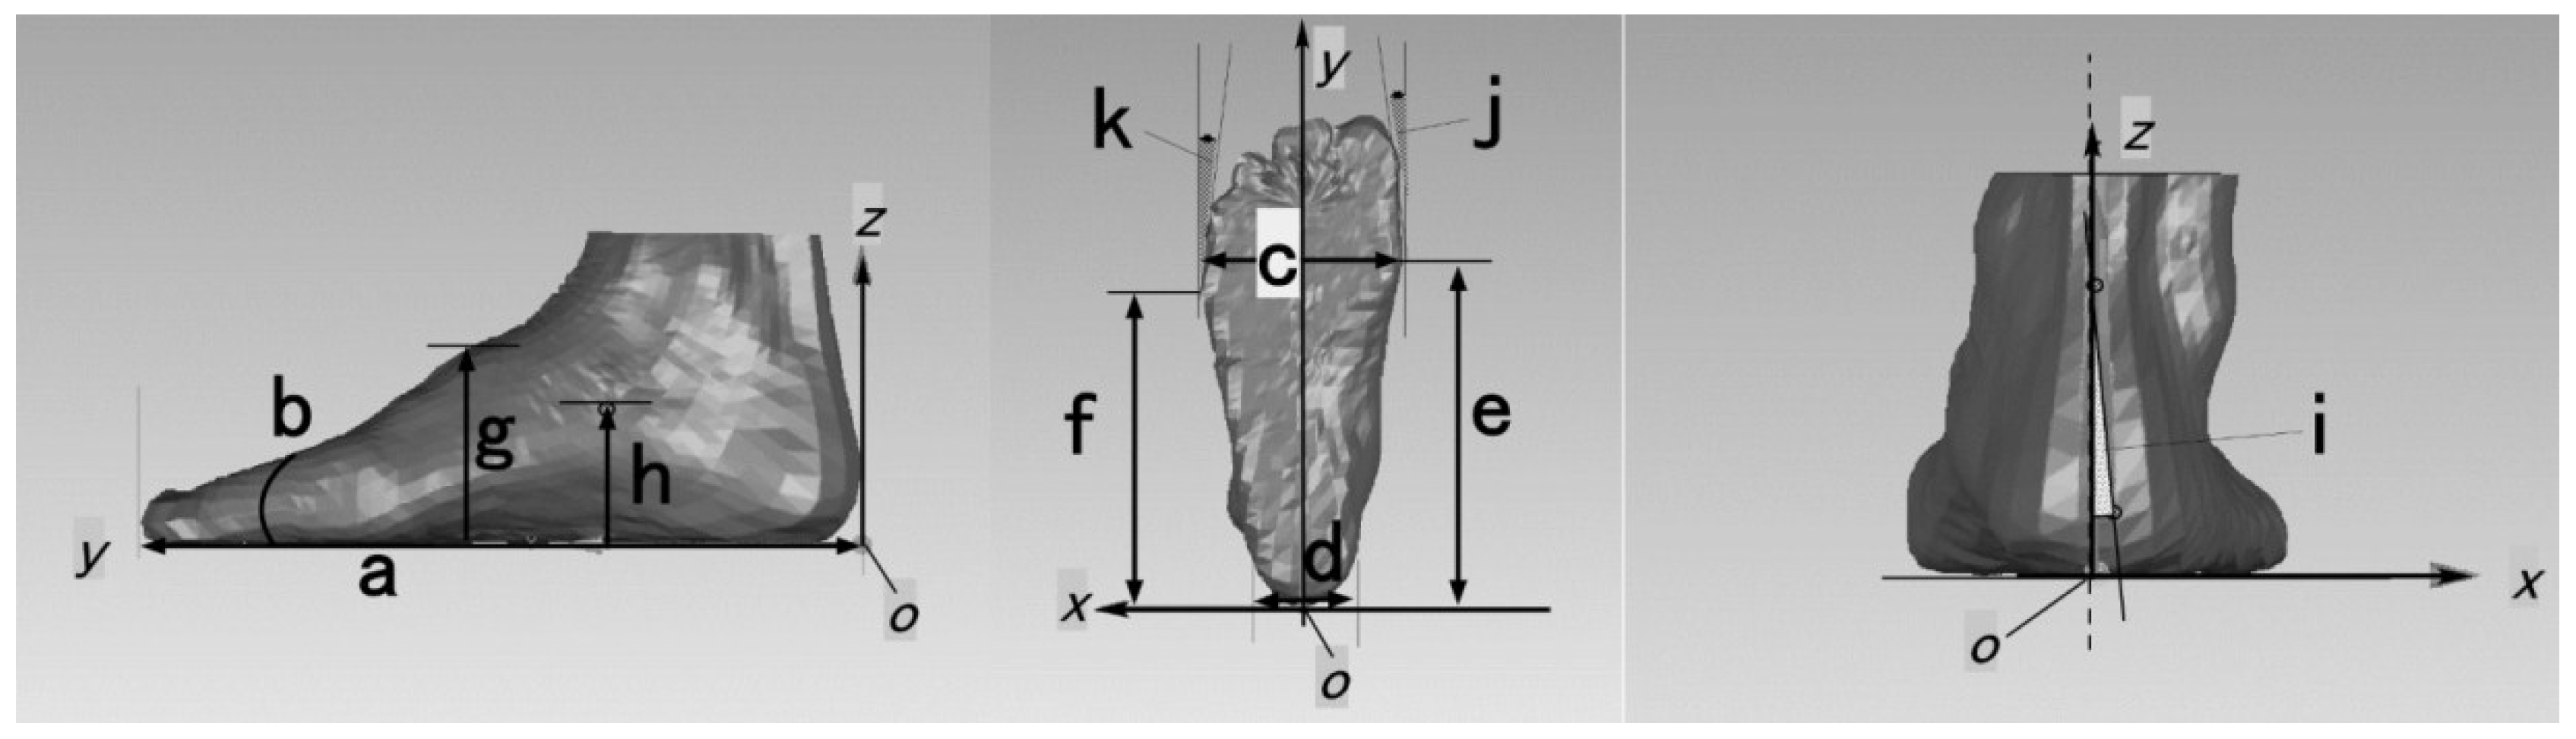
Data from the right feet of 21 subjects were analyzed for this study; one runner could not complete the 35 km road run. The data for foot shape were described using a foot coordinate system. The origin of the coordinate system was placed at the intersection point of the standing surface and a perpendicular line drawn from the most posterior point of the heel to the standing surface; the longitudinal axis (y-axis) was the line connecting the most posterior point of the heel and the head of the second digit, and the positive direction was the anterior; and the z-axis was vertical, and the positive direction was superior; the x-axis was perpendicular line to the y–z plane through the origin. Foot length, ball girth, ball width, navicular height, dorsal height, heel angle, great toe angle (Toe 1 angle), and little toe angle (Toe 5 angle) foot cross-sectional shapes were obtained from the scanning data (Figure 1). The foot length was defined as the length projected on the longitudinal (y) axis between the most posterior point of the heel and the head of the first or second digit, whichever was longer. The ball width was defined as the distance between 1 MTJ and 5 MTJ projected on the x–y plane. The ball girth was defined as the circumference that is passing 1 MTJ and 5 MTJ points. The heel width was the width at 17% of the foot length from the most posterior point of the heel to 40 mm in height from the standing surface. The medial and lateral lengths were the length between 1 MTJ and the most posterior point of the heel and 5 MTJ and the most posterior point of the heel, respectively. The dorsal height was defined as the height of the highest point from the floor at 55% of length of the foot from the heel. The navicular height was defined as the height of the most medial point of the navicular bone from the floor. The heel angle was defined as the angle between vertical and the line connecting the center of the posterior calcaneus and the insertion of the Achilles tendon. The toe 1/5 angle was the angle formed by the line connecting 1 MTJ/5 MTJ and lateral aspect of 1/5 digit and the foot longitudinal axis (Figure 1). Arch ratio was calculated as the navicular height divided by foot length times 100. Foot volumes and foot cross-sectional shape were obtained using 3D engineering software (Geomagic Studio 2014, 3DSystems, Rock Hill, SC, USA). Foot volume was defined as the volume from the standing surface to 10 cm proximal of the subject’s foot. Foot cross-sectional shape and its 100 equally spaced coordinate point on foot cross-sectional contour was obtained at 50% of the foot length between the most posterior point of the heel and the head of the first or second digit, whichever was longer, in the perpendicular plane (Figure 2).
Figure 1.
Definition of foot coordinate system and foot parameters: (o) origin of the foot, (x) x-axis, (y) y-axis, (z) z-axis, (a) foot length, (b) ball girth, (c) ball width, (d) heel width, (e) medial length, (f) lateral length, (g) dorsal height, (h) navicular height, (i) heel angle, (j) Toe 1 angle and (k) Toe 5 angle.

Figure 2.
Cross-sectional shape and 100 equally-spaced coordinate points were extracted at 50% of the foot length. The cross-sectional plane was perpendicular to the foot’s longitudinal (y) axis (left). Cross-sectional shape is shown at 50% of the foot length (right).
Figure 2.
Cross-sectional shape and 100 equally-spaced coordinate points were extracted at 50% of the foot length. The cross-sectional plane was perpendicular to the foot’s longitudinal (y) axis (left). Cross-sectional shape is shown at 50% of the foot length (right).
The cross-sectional shape was compared before and after the 35 km run processed by custom-written programs (MATLAB R2013a, MathWorks, Natick, MA, USA). The starting point of the 100 coordinate points was the most lateral point, i.e., the minimum x-coordinate, in each cross-section. Next, the program searched for a matched pair point with the shortest distance between the two points for every single point in a clockwise manner. The shape difference was specified as the shortest distance from the coordinate point before to the coordinate point after the 35 km run. A positive value for distance meant a post-run contour located lateral (laterally deformed) to the pre-run contour; conversely, a negative value for distance meant a post-run contour located medial (medially deformed) to the pre-run contour; we defined no deformation as occurring when the distance between pre- and post-run matched cross-sectional contour points was less than 0.2 mm.
2.4. Statistical Analysis
The normality of the distribution of each variable was confirmed using the Kolmogorv-Smirnov test. A paired t-test was performed to compare the values before and after the 35 km run (IBM SPSS Statistics 20, IBM, New York, NY, USA). A two-tailed test was used to test the null hypotheses. Significance was set at p < 0.05 and p < 0.01. The effect sizes (r) from Cohen’s d were calculated from the t-value and degrees of freedom.
3. Results
Table 1 shows the comparison of foot parameters before and after a 35 km run. The foot length, ball girth, ball width, medial length, lateral length, heel angle, and Toe 5 angle were comparable before and after running. The dorsal height (before, 58.9 ± 4.0 mm; after, 57.6 ± 4.1 mm), navicular height (before, 38.6 ± 6.2 mm; after, 37.1 ± 5.6 mm), arch height ratio (before, 15.2% ± 2.4%; after, 14.6% ± 2.2%), and foot volume (before, 827,759.6 ± 72,068.3 mm3; after, 814,073.2 ± 70,207.4 mm3) were significantly lower after running compared to before running. Toe 1 angle (before, 7.5° ± 3.3°; after, 9.6° ± 2.8°) was significantly greater after running. The effect sizes were large for the statistically significant differences.

| Condition | Pre-run | Post-run | Difference | p Value | Effect Size (r) | |||
|---|---|---|---|---|---|---|---|---|
| Variable | Mean | (SD) | Mean | (SD) | ||||
| foot length (mm) | 253.6 | 8.7 | 254.0 | 8.5 | −0.4 | ns | 0.26 | 0.25 |
| ball girth (mm) | 244.3 | 9.8 | 243.5 | 9.8 | 0.8 | ns | 0.28 | 0.24 |
| ball width (mm) | 99.5 | 4.2 | 99.6 | 4.4 | −0.1 | ns | 0.72 | 0.08 |
| heel width (mm) | 60.6 | 3.1 | 60.5 | 3.0 | 0.1 | ns | 0.20 | 0.29 |
| medial length (mm) | 183.6 | 7.0 | 183.7 | 6.7 | −0.1 | ns | 0.85 | 0.26 |
| lateral length (mm) | 160.2 | 5.7 | 160.2 | 5.5 | 0.0 | ns | 0.99 | 0.00 |
| dorsal height (mm) | 58.9 | 4.0 | 57.6 | 4.1 | 1.3 | ** | 0.00 | 0.77 |
| navicular height (mm) | 38.6 | 6.2 | 37.1 | 5.6 | 1.5 | ** | 0.00 | 0.62 |
| arch height ratio (%) | 15.2 | 2.4 | 14.6 | 2.2 | 0.6 | ** | 0.00 | 0.65 |
| heel angle (deg) | 3.7 | 3.5 | 3.4 | 5.3 | 0.3 | ns | 0.78 | 0.07 |
| toe 1 angle (deg) | 7.5 | 3.3 | 9.6 | 2.8 | −2.1 | * | 0.02 | 0.69 |
| toe 5 angle (deg) | 13.7 | 3.1 | 13.6 | 3.4 | 0.1 | ns | 0.69 | 0.09 |
| volume (mm3) | 827,759.6 | 72,068.3 | 814,073.2 | 70,207.4 | 13,686.4 | * | 0.03 | 0.70 |
ns: Not significant; *: p < 0.05; **: p < 0.01.
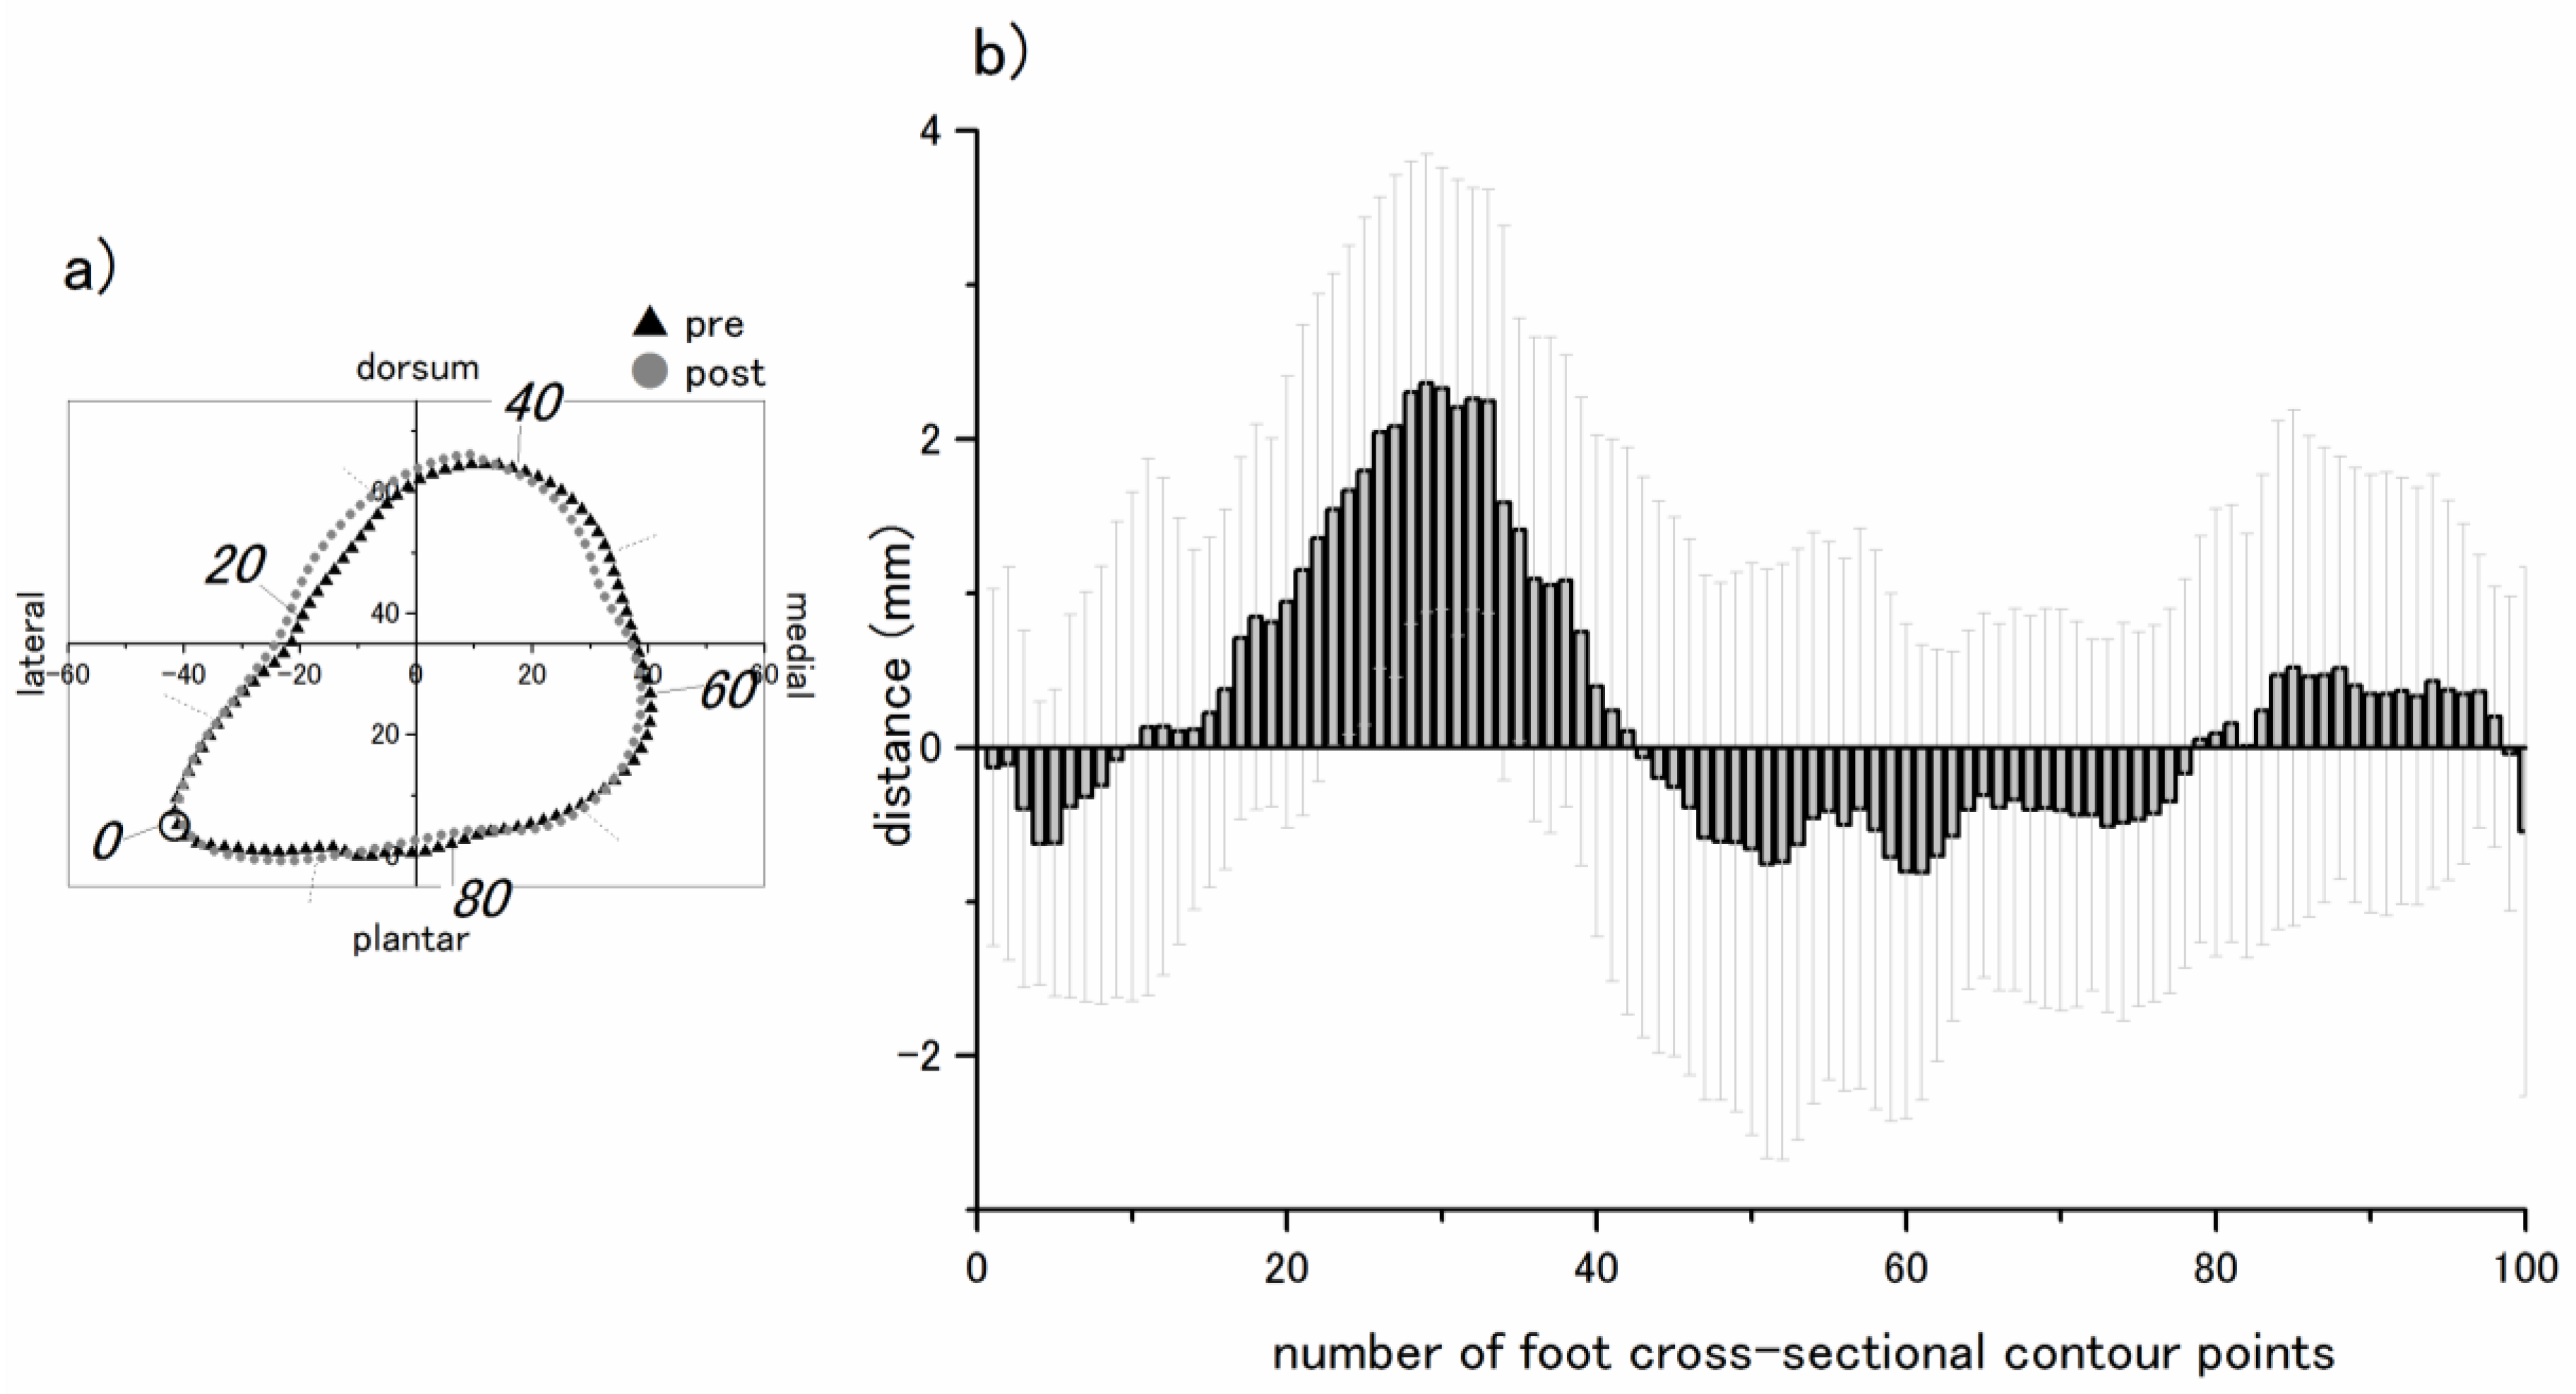
Figure 3 shows the average distance between pre- and post-run matched cross-sectional points at 50% of foot length. The lateral dorsum of the foot (from approximately 25–45 cross-sectional contour points) tended to be more laterally deformed after the 35 km run compared to before the run. Conversely, the medial side (from approximately 10–25 cross-sectional contour points) tended to be slightly medially deformed. Superposing figures of pre- and post-run cross-sectional contours, lateral deformation was observed in 76.2% of feet, no deformation was observed in 4.8% of feet, and medial deformation was observed in 19.0% of feet at the lateral dorsum of the foot after running compared to pre-run cross-sectional contours. On the medial dorsum of the foot, medial deformation was observed in 47.6% of feet, no deformation was observed 38.1% of feet, and lateral deformation was observed in 14% of feet post-run compared to the pre-run cross-sectional contours (Table 2).
Figure 3.
Differences in cross-sectional shape before and after a 35 km run. (a) A typical example of cross-sectional contours pre- and post-run at 50% of the foot length (left foot). The cross-sectional contour was specified by 100 equally spaced points. Italicized digits (0, 20, 40, 60, and 80) represent the number of foot cross-sectional contour points from the start point (0), set at the most lateral point; (b) Average distances between pre- and post-run matched cross-sectional contour points at 50% of foot length. A positive value indicates a post-run contour located lateral to the pre-run contour, and a negative value indicates a post-run contour located medial to the pre-run contour.
| Medial Side of the Foot (Number of Feet) | |||||
|---|---|---|---|---|---|
| Deformation Pattern | Lateral | None | Medial | Total | |
| Lateral Dorsum of the Foot (Number of Feet) | Lateral | 1 | 7 | 8 | 16 |
| None | 0 | 1 | 0 | 1 | |
| Medial | 2 | 2 | 0 | 4 | |
| Total | 3 | 10 | 8 | 21 | |
4. Discussion
The main objective of this study was to compare foot morphology before and after running 35 km. The results show that foot shape is altered during a single long-distance run.
Significant decreases were seen in the dorsal height, navicular height, and arch height ratio, indicating arch alignment is altered by a prolonged run. Several studies have assessed the effect of long-distance running on foot structure. Boyer et al. found no significant difference in arch deformation and rigidity in healthy recreational runners before and after a 45-min run at a comfortable pace [10]. In contrast, foot posture change to a more pronated position was reported after a half marathon race by Cowley et al. [11]. Since the intensity, running time, and measurement methodology were different in these two previous studies, we cannot directly compare our result with their results.
The arch structure allows it to act as a shock attenuator by functional deformation during various weight bearing tasks. Not only instantaneously deformed at every stance phase, this study revealed the arch gradually deforms due to repetitive loading during a 35 km run. By lowering the arch structure, it is possible to decrease the shock attenuation capacity transiently. Moreover, the navicular and dorsal height lowered without any change to foot length. These results suggest that the arch structure should not be regarded as a triangle linkage, a structure commonly used to characterize the medial longitudinal arch. Possible causes of this deformation include neuromuscular fatigue of intrinsic [12,13] and extrinsic [14,15] foot muscles and altering of mechanical properties of the soft tissues in the foot [16]. Further understanding of the interaction between foot morphology and function requires additional studies.
Midfoot cross-sectional shape of the foot after running was wholly deformed laterally compared to before running; 76.1% of foot deformed laterally at the lateral dorsum part and 85.7% of the foot did not change or medially deformed at the medial side of foot. As mentioned above, this change could be caused by multiple factors and could result in an alignment change during prolonged running. However, we observed no significant difference in the heel angle and a significant decrease in the foot volume; hence, this shape change may not be attributed solely to a difference in pronation or supination. This shape deformation could be related to an alteration of the load position laterally within the foot. A lateral shift in the center of pressure (COP) during the stance phase during treadmill marching was reported by Gefen et al. [17], and change to a more pronated position of the foot after a half marathon race was reported by Cowley et al. [11]. The present study, the deformation pattern was largely lateral, although some exceptions were observed. One possible factor contributing to the exceptions could be a morphologic attribute such as arch height and/or foot widths. In this study, we could not identify a relationship between deformation pattern and morphological attributes, so further study is needed.
The findings of this study indicate that footwear fit and/or comfort could be affected during long-distance running because athletes tie their shoelaces and adjust tightness based on foot shape before running. In fact, the present study demonstrated the foot volume of all subjects decreased following the 35 km run. The decline in foot volume may create a slight space between the foot and footwear, leading to foot slipping and/or skin friction. Therefore, the shape and function of footwear, especially footwear used for prolonged running, should be designed taking into account changes in foot shape that occur during prolonged running.
This study has some limitations. First, we examined changes in foot shape immediately after running. Therefore, it is not clear if foot shape is restored after several hours of rest. Another limitation is that the subjects of this study were relatively high-level runners, so the results may not be representative of foot deformation in recreational runners.
5. Conclusions
The current study assessed changes in foot shape in collegiate runners after a 35 km run. The study revealed that the dorsal height, navicular height, arch height ratio, and foot volume decreased after running 35 km, compared to before the run. The results of the study suggest that changes in foot shape during running should be taken into account when designing running footwear, such as responding to the height decrease and cross-sectional shape change at midfoot to achieve a better fit in the future.
Acknowledgments
The authors wish to acknowledge Masaaki Honda (Faculty of Sport Sciences, Waseda University, Japan) for his help in data processing of this study.
Author Contributions
Mako Fukano and Shigeo Iso conceived and designed the experiments; Mako Fukano and Shigeo Iso performed the experiments; Mako Fukano analyzed the data; Mako Fukano and Shigeo Iso wrote the paper.
Conflicts of Interest
The authors declare no conflict of interest.
References
- Gijon-Nogueron, G.A.; Gavilan-Diaz, M.; Valle-Funes, V.; Jimenez-Cebrian, A.M.; Cervera-Marin, J.A.; Morales-Asencio, J.M. Anthropometric foot changes during pregnancy: A pilot study. J. Am. Podiatr. Med. Assoc. 2013, 103, 314–321. [Google Scholar] [CrossRef] [PubMed]
- McWhorter, J.W. The effects of loaded versus unloaded activities on foot volumetrics in older healthy adults. N. Am. J. Sports Phys. Ther. 2008, 3, 34–40. [Google Scholar] [PubMed]
- Kimura, M.; Mochimaru, M.; Kanade, T. 3D measurement of feature cross-sections of foot while walking. Mach. Vis. Appl. 2011, 22, 377–388. [Google Scholar] [CrossRef]
- Thabet, A.K.; Trucco, E.; Salvi, J.; Wang, W.; Abboud, R.J. Dynamic 3D shape of the plantar surface of the foot using coded structured light: A technical report. J. Foot Ankle Res. 2014, 7. [Google Scholar] [CrossRef] [PubMed]
- Kouchi, M.; Kimura, M.; Mochimaru, M. Deformation of foot cross-section shapes during walking. Gait Posture 2009, 30, 482–486. [Google Scholar] [CrossRef] [PubMed]
- Novak, B.; Mozina, J.; Jezersek, M. 3D laser measurements of bare and shod feet during walking. Gait Posture 2014, 40, 87–93. [Google Scholar] [CrossRef] [PubMed]
- Mailler-Savage, E.A.; Adams, B.B. Skin manifestations of running. J. Am. Acad. Dermatol. 2006, 55, 290–301. [Google Scholar] [CrossRef] [PubMed]
- Van Tiggelen, D.; Wickes, S.; Coorevits, P.; Dumalin, M.; Witvrouw, E. Sock systems to prevent foot blisters and the impact on overuse injuries of the knee joint. Mil. Med. 2009, 174, 183–189. [Google Scholar] [CrossRef] [PubMed]
- Telfer, S.; Woodburn, J. The use of 3D surface scanning for the measurement and assessment of the human foot. J. Foot Ankle Res. 2010, 3. [Google Scholar] [CrossRef] [PubMed]
- Boyer, E.R.; Ward, E.D.; Derrick, T.R. Medial longitudinal arch mechanics before and after a 45-minute run. J. Am. Podiatr. Med. Assoc. 2014, 104, 349–356. [Google Scholar] [CrossRef] [PubMed]
- Cowley, E.; Marsden, J. The effects of prolonged running on foot posture: A repeated measures study of half marathon runners using the foot posture index and navicular height. J. Foot Ankle Res. 2013, 6. [Google Scholar] [CrossRef] [PubMed]
- Headlee, D.L.; Leonard, J.L.; Hart, J.M.; Ingersoll, C.D.; Hertel, J. Fatigue of the plantar intrinsic foot muscles increases navicular drop. J. Electromyogr. Kinesiol. 2008, 18, 420–425. [Google Scholar] [CrossRef] [PubMed]
- Fiolkowski, P.; Brunt, D.; Bishop, M.; Woo, R.; Horodyski, M. Intrinsic pedal musculature support of the medial longitudinal arch: An electromyography study. J. Foot Ankle Surg. 2003, 42, 327–333. [Google Scholar] [CrossRef] [PubMed]
- O’Connor, K.M.; Hamill, J. The role of selected extrinsic foot muscles during running. Clin. Biomech. 2004, 19, 71–77. [Google Scholar] [CrossRef]
- Kitaoka, H.B.; Luo, Z.P.; An, K.N. Effect of the posterior tibial tendon on the arch of the foot during simulated weightbearing: Biomechanical analysis. Foot Ankle Int. 1997, 18, 43–46. [Google Scholar] [CrossRef] [PubMed]
- Cheung, J.T.; Zhang, M.; An, K.N. Effects of plantar fascia stiffness on the biomechanical responses of the ankle-foot complex. Clin. Biomech. 2004, 19, 839–846. [Google Scholar] [CrossRef] [PubMed]
- Gefen, A. Biomechanical analysis of fatigue-related foot injury mechanisms in athletes and recruits during intensive marching. Med. Biol. Eng. Comput. 2002, 40, 302–310. [Google Scholar] [CrossRef] [PubMed]
© 2015 by the authors; licensee MDPI, Basel, Switzerland. This article is an open access article distributed under the terms and conditions of the Creative Commons Attribution license (http://creativecommons.org/licenses/by/4.0/).
Share and Cite
MDPI and ACS Style
Fukano, M.; Iso, S. Changes in Foot Shape after Long-Distance Running. J. Funct. Morphol. Kinesiol. 2016, 1, 30-38. https://doi.org/10.3390/jfmk1010030
AMA Style
Fukano M, Iso S. Changes in Foot Shape after Long-Distance Running. Journal of Functional Morphology and Kinesiology. 2016; 1(1):30-38. https://doi.org/10.3390/jfmk1010030
Chicago/Turabian StyleFukano, Mako, and Shigeo Iso. 2016. "Changes in Foot Shape after Long-Distance Running" Journal of Functional Morphology and Kinesiology 1, no. 1: 30-38. https://doi.org/10.3390/jfmk1010030