Article

Residual Strain Measurement Using Wire EDM and DIC in Aluminum

1
Graduate Institute of Manufacturing Technology and Department of Mechanical Engineering, National Taipei University of Technology, Taipei 10608, Taiwan
2
Department of Mechanical Engineering, National Yunlin University of Science and Technology, Douliou, Yunlin 64002, Taiwan
3
Iron and Steel Research and Development Department, China Steel, Kaohsiung 81233, Taiwan
*
Author to whom correspondence should be addressed.
Inventions 2016, 1(1), 4; https://doi.org/10.3390/inventions1010004
Submission received: 17 December 2015 / Revised: 24 February 2016 / Accepted: 29 February 2016 / Published: 4 March 2016

Abstract

:
In this paper, a technique that combines digital image correlation and wire electrical discharge machining for the measurement of the residual strain is presented. The significant potential benefits of this work include noncontact, high-speed, and online measurement. A ring-core-based groove in the surface of the specimen is cut to release the residual stresses present inside the core. The deformation due to these stresses can be measured by digital image correlation to measure the relieved strains. Moreover, the sizes of the reference areas on the specimens and the tracks of these areas after wire electrical discharge machining are investigated. The proposed method is applied to six different specimens to characterize their relieved strains.

Graphical Abstract

1. Introduction

Digital image correlation (DIC) is a non-contact optical technique used to measure displacements on the surface of an object by performing a correlation analysis of the random patterns, and spraying by an airbrush gun is widely used to create such patterns on surfaces. In [1], a criterion for the quantitative evaluation of random patterns, the characterization of their effectiveness for a DIC algorithm implementation, and patterns printed on the surfaces of interest are introduced. In [2], a practical approach was proposed for use in a mechanical-testing laboratory for optimizing the performance of DIC. This proposed approach allows for estimation of the average speckle size as well as the scatter of the speckle sizes to maximize the spatial resolution. Two-dimensional (2D) DIC provides full-field displacements at a subpixel accuracy and full-field strains by comparing the digital images of a test-object surface acquired before and after deformation [3]. Therefore, the stress can be identified on the basis of the 2D DIC technique. In [4], an analysis of the released stress was achieved by DIC applied to load-state scanning electron microscopy (SEM) images captured with a combination of SEM and focused ion beam (FIB) equipment. In [5], FIB microhole milling was combined with a 2D finite-element analysis (FEA) to model the resulting relaxation displacements on a specimen surface on the basis of a DIC analysis. In [6], measurement of the displacement field based on DIC was presented for a slot milled into a material. In [7], DIC was used to determine the coefficient of thermal expansion (CTE) of films. Hence, DIC has been established as a practical and effective deformation measurement technique.
The ring-core method is a partially destructive test method for measuring uniform and non-uniform residual stresses. The major advantage of the ring-core method is its greater sensitivity. For residual stress measurements, the ring-core method enables measurement of the profile of the residual stresses in a material up to a depth of 5 mm when using a strain gauge [8]. However, the use of a strain gauge is a pointwise technique. Further, the machining axis should be aligned with the center of the strain-gauge rosette. Furthermore, the use of a high-speed drilling technique to realize the strain-gauge measurement of the residual stress also inevitably results in a severe tool wear. The tool wear will further induce an additional stress and therefore decrease the accuracy of the measurement result. As a result, the wire electrical discharge machining (WEDM) technique has shown potential to be the optimal method for cutting grooves to relieve residual stresses and was applied in this work. This work uses the WEDM process to cut side grooves in plate specimens and generates a displacement field perpendicular to the slot plane.
The aim of this study is to use a wire electrical discharge cutting mechanism based on the ring-core method to reveal the residual stress in six different specimens when measuring strains using DIC. DIC offers the advantage of analyzing the strain relief in multiple directions. A new method to measure the non-uniform residual stress fields using DIC combined with the ring-core method by WEDM processing is proposed.

2. DIC Method by Cutting a Groove

With the DIC method, two speckle images are compared. The initial (reference) image with the calculation area (i.e., the region of interest (ROI)) is divided into evenly spaced subsets. The ROI is the reference region in which the displacement/deformation field is determined. The subset is a square matrix of pixels used as the basis of the image correlation technique. The matching of each initial subset to the respective calculated subset in the deformed image is then established by defining the maximum value of the correlation coefficient. The image is transformed into a grey scale.
Specimens were cut from an aluminum sheet (Al 5052) with a thickness of 6 mm, and the area of specimens is 20 × 70 mm2. Four-point bending tests of the specimens were conducted along the side length. Four-point bending was used to induce a residual stress in five specimens. After four-point bending, the strains obtained by a strain gauge pasted onto the specimen surface were 3150, 4450, 5750, 7000 and 8000 με (Figure 1). Moreover, one additional specimen was prepared without a residual stress induced by the four-point bending mechanism. A Sony ExwaveHAD 3CCD color video camera (640 × 480 pixel resolution) and a Olympus U-PMTVC 8C14561 microscope (25× magnification) were used to observe the working surface of the patterned specimens during testing. The camera’s optical axis was adjusted to be orthogonal to the studied surfaces, which are illuminated by a halogen lamp (Halopin). The area of the captured pattern was approximately 2608 × 1955 µm2. DIC was performed on a selected subimage (160 × 160 pixels) of the studied surface and captured by a digital camera with a 4.07 pixel/µm resolution. In this work, the DIC algorithm set the subpixel resolution to 0.01 and the accuracy of every measured point of the displacement field to 2.5 nm. The average released strain is computed as the sum of the values of the subset divided by the total number of subsets. The distance between the different electrical discharge machine (EDM) grooves is 0.2 mm, and the width of each groove is 2 mm. Figure 2 shows a schematic of the experimental setup and the actual experimental system using an optical imaging device for the 2D DIC method. These images were analyzed by the DIC technique to extract the released strains after milling. The arrangement used for cutting specimen surfaces to release the residual strain is presented in Figure 3 and Table 1. The wire-cut electric discharge machine consists of a machine tool, computer numerically controlled (CNC) pulse generator, and dielectric-fluid supply unit. The tool consists of a main worktable, an auxiliary table, and a wire drive mechanism. CuZn37 brass wire with a diameter of 0.2 mm was employed in this study. The wire travels through the workpiece from the wire supply wheel to the wire take-up reel. In the wire-cut electrical discharge machining (EDM) process, a spark is generated between the continuously traveling wire and the workpiece.

3. Experiments and Discussion

The use of WEDM to cut a surface slot into a specimen induces the release of the local strain that generates a displacement field perpendicular to the slot plane. The implementation of the 2D DIC method comprises the following three consecutive steps:
1)
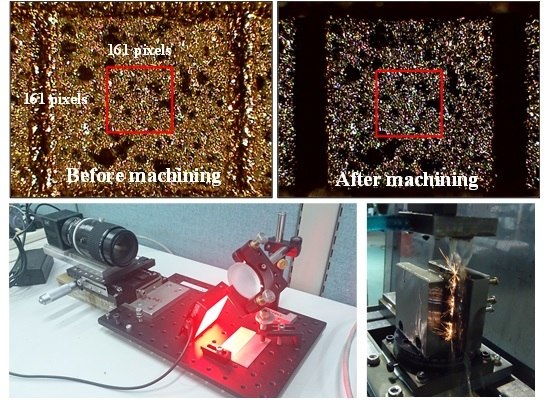
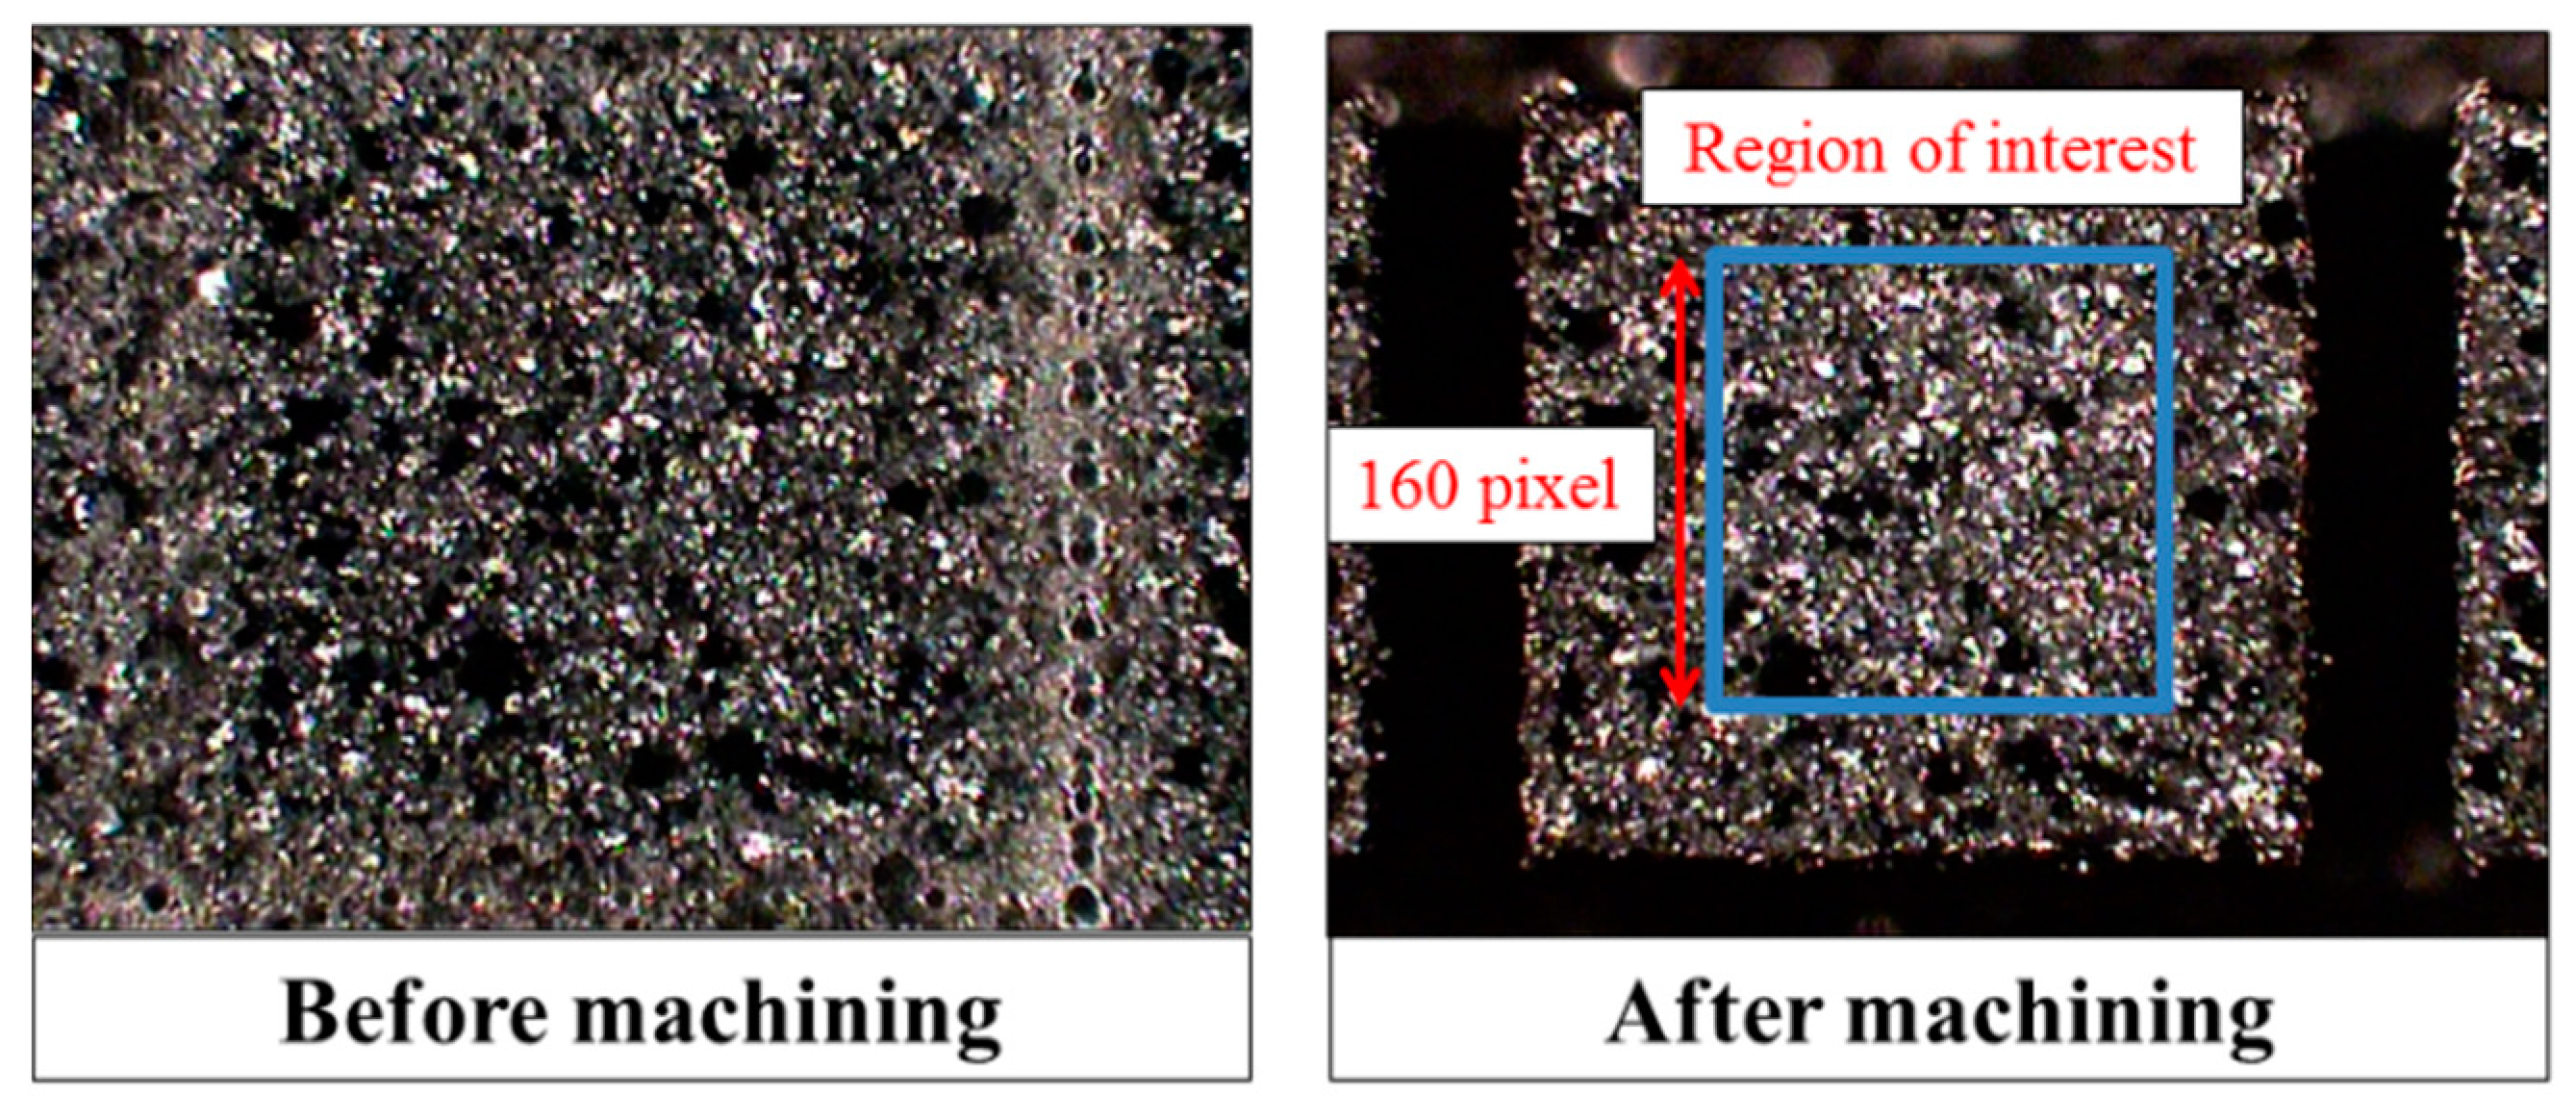
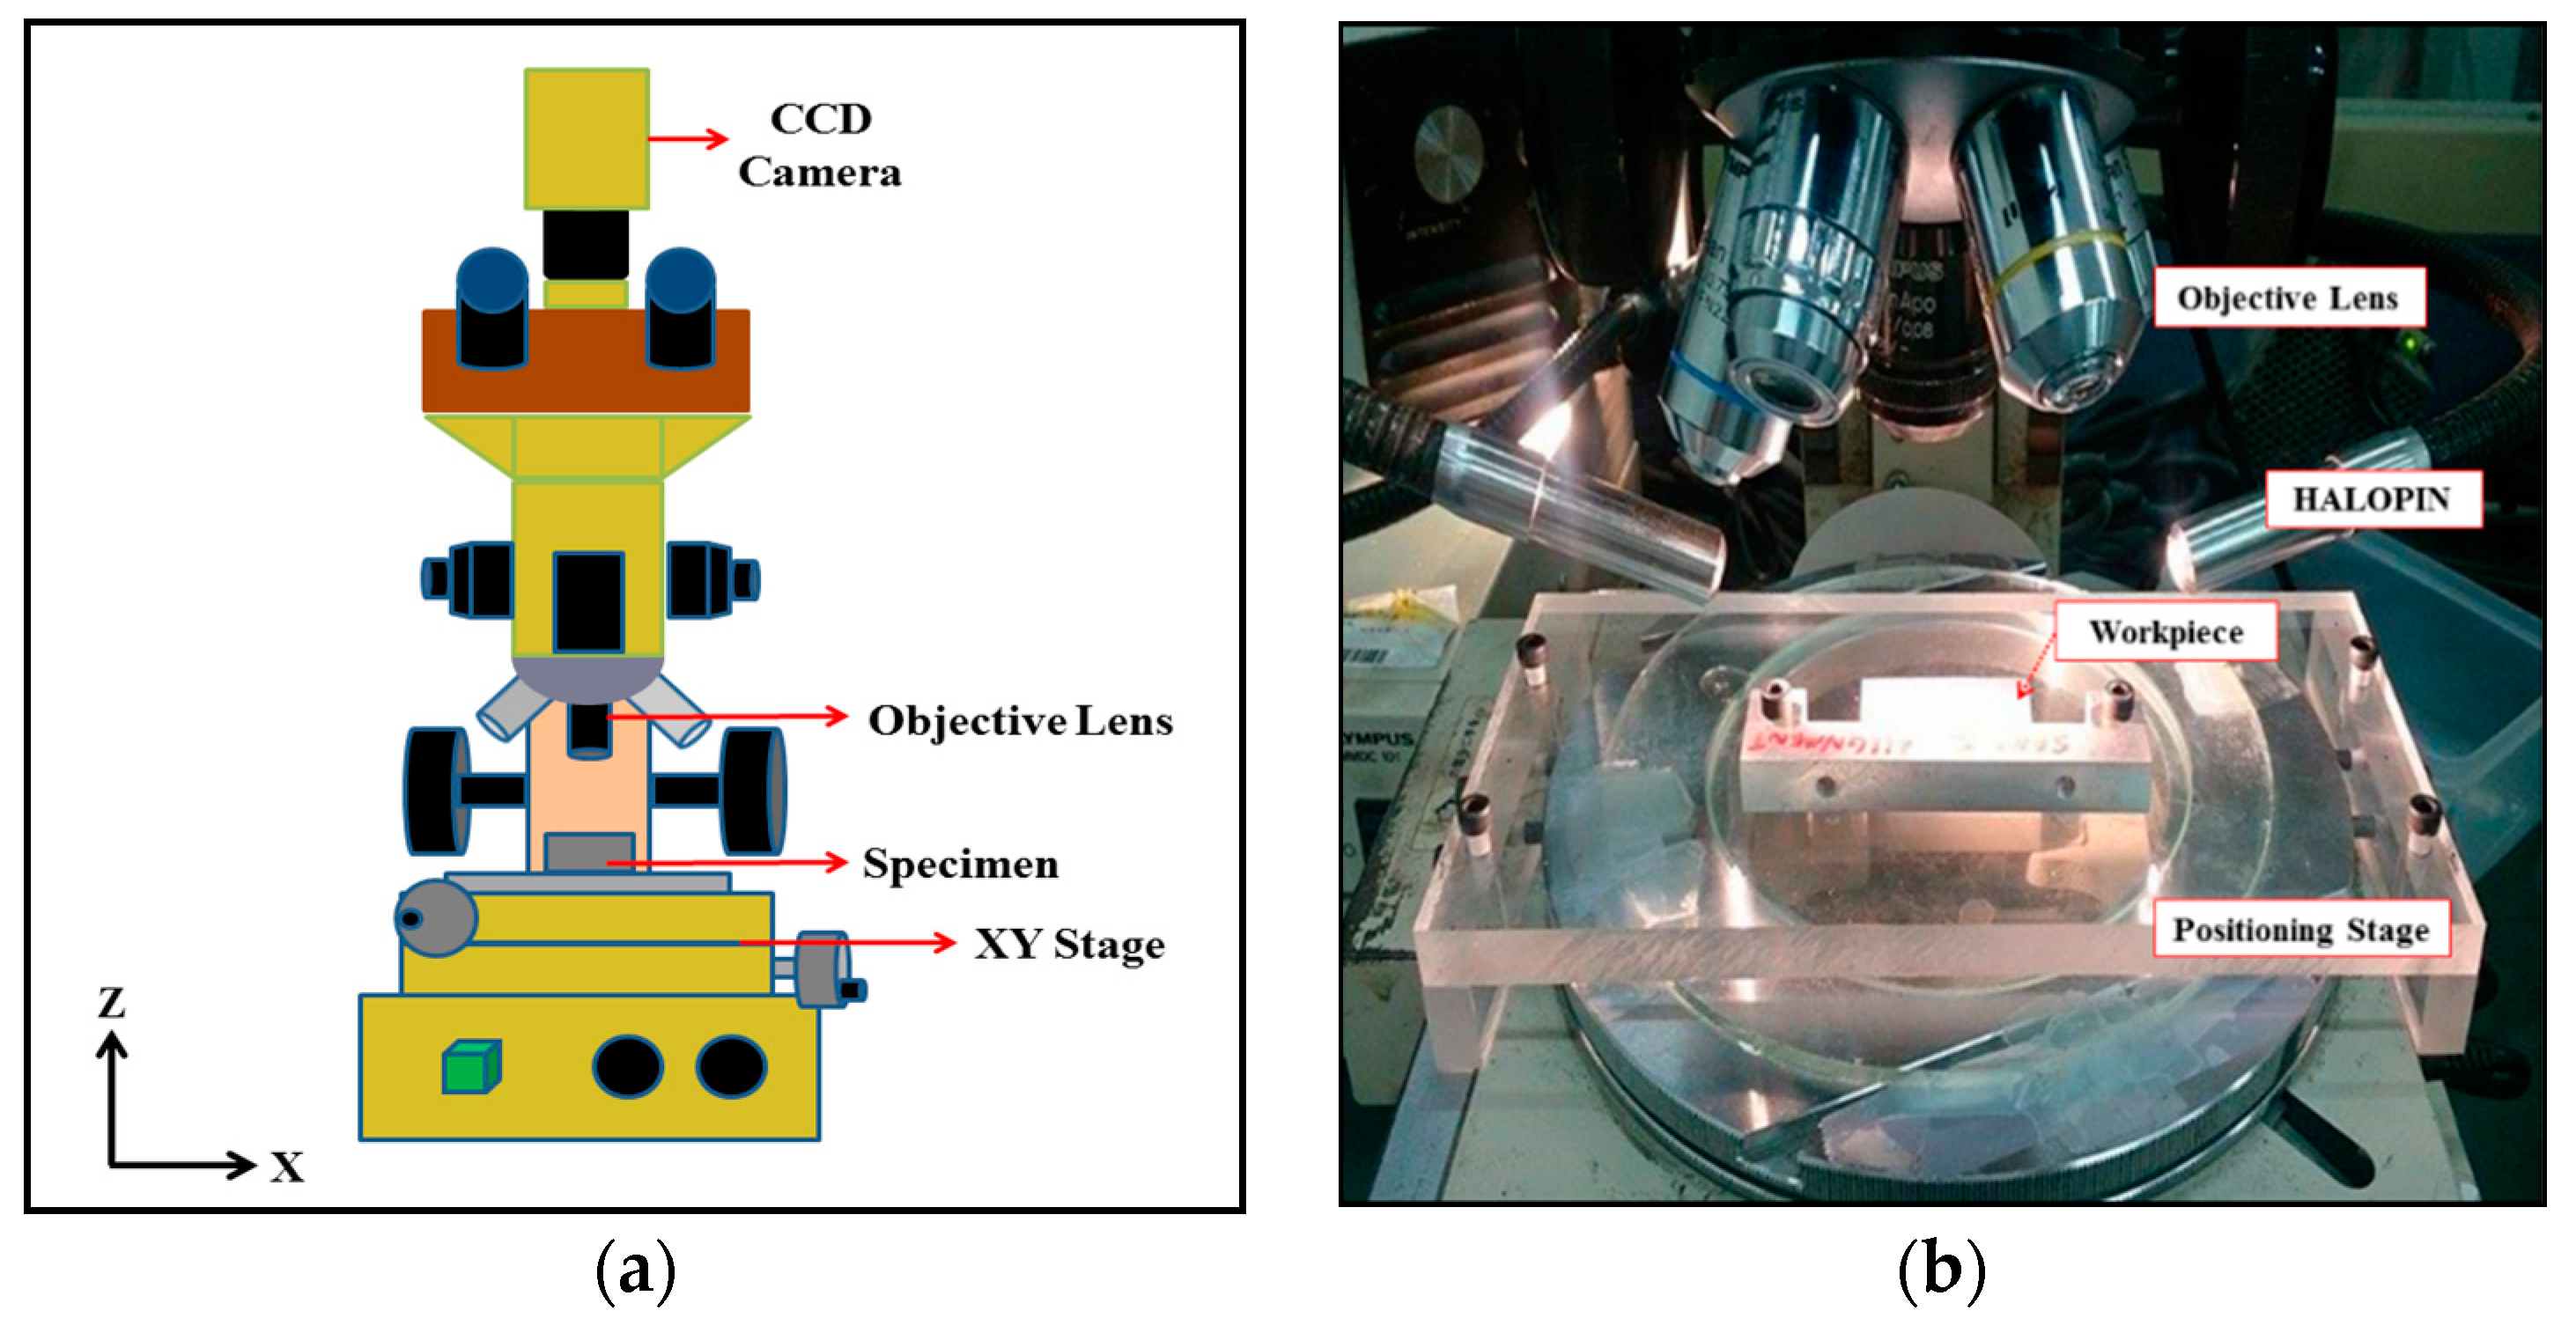
Specimen and experimental preparation for the reference image: a speckle pattern was sprayed onto the test specimen surface by an airbrush gun to visualize the deformation. Figure 4 shows the speckle images of a specimen surface after spraying with white and black paints. During the DIC analysis of the captured images, the square area in the middle of the specimen is chosen to be the ROI with subset size of 160 × 160 pixels.
2)
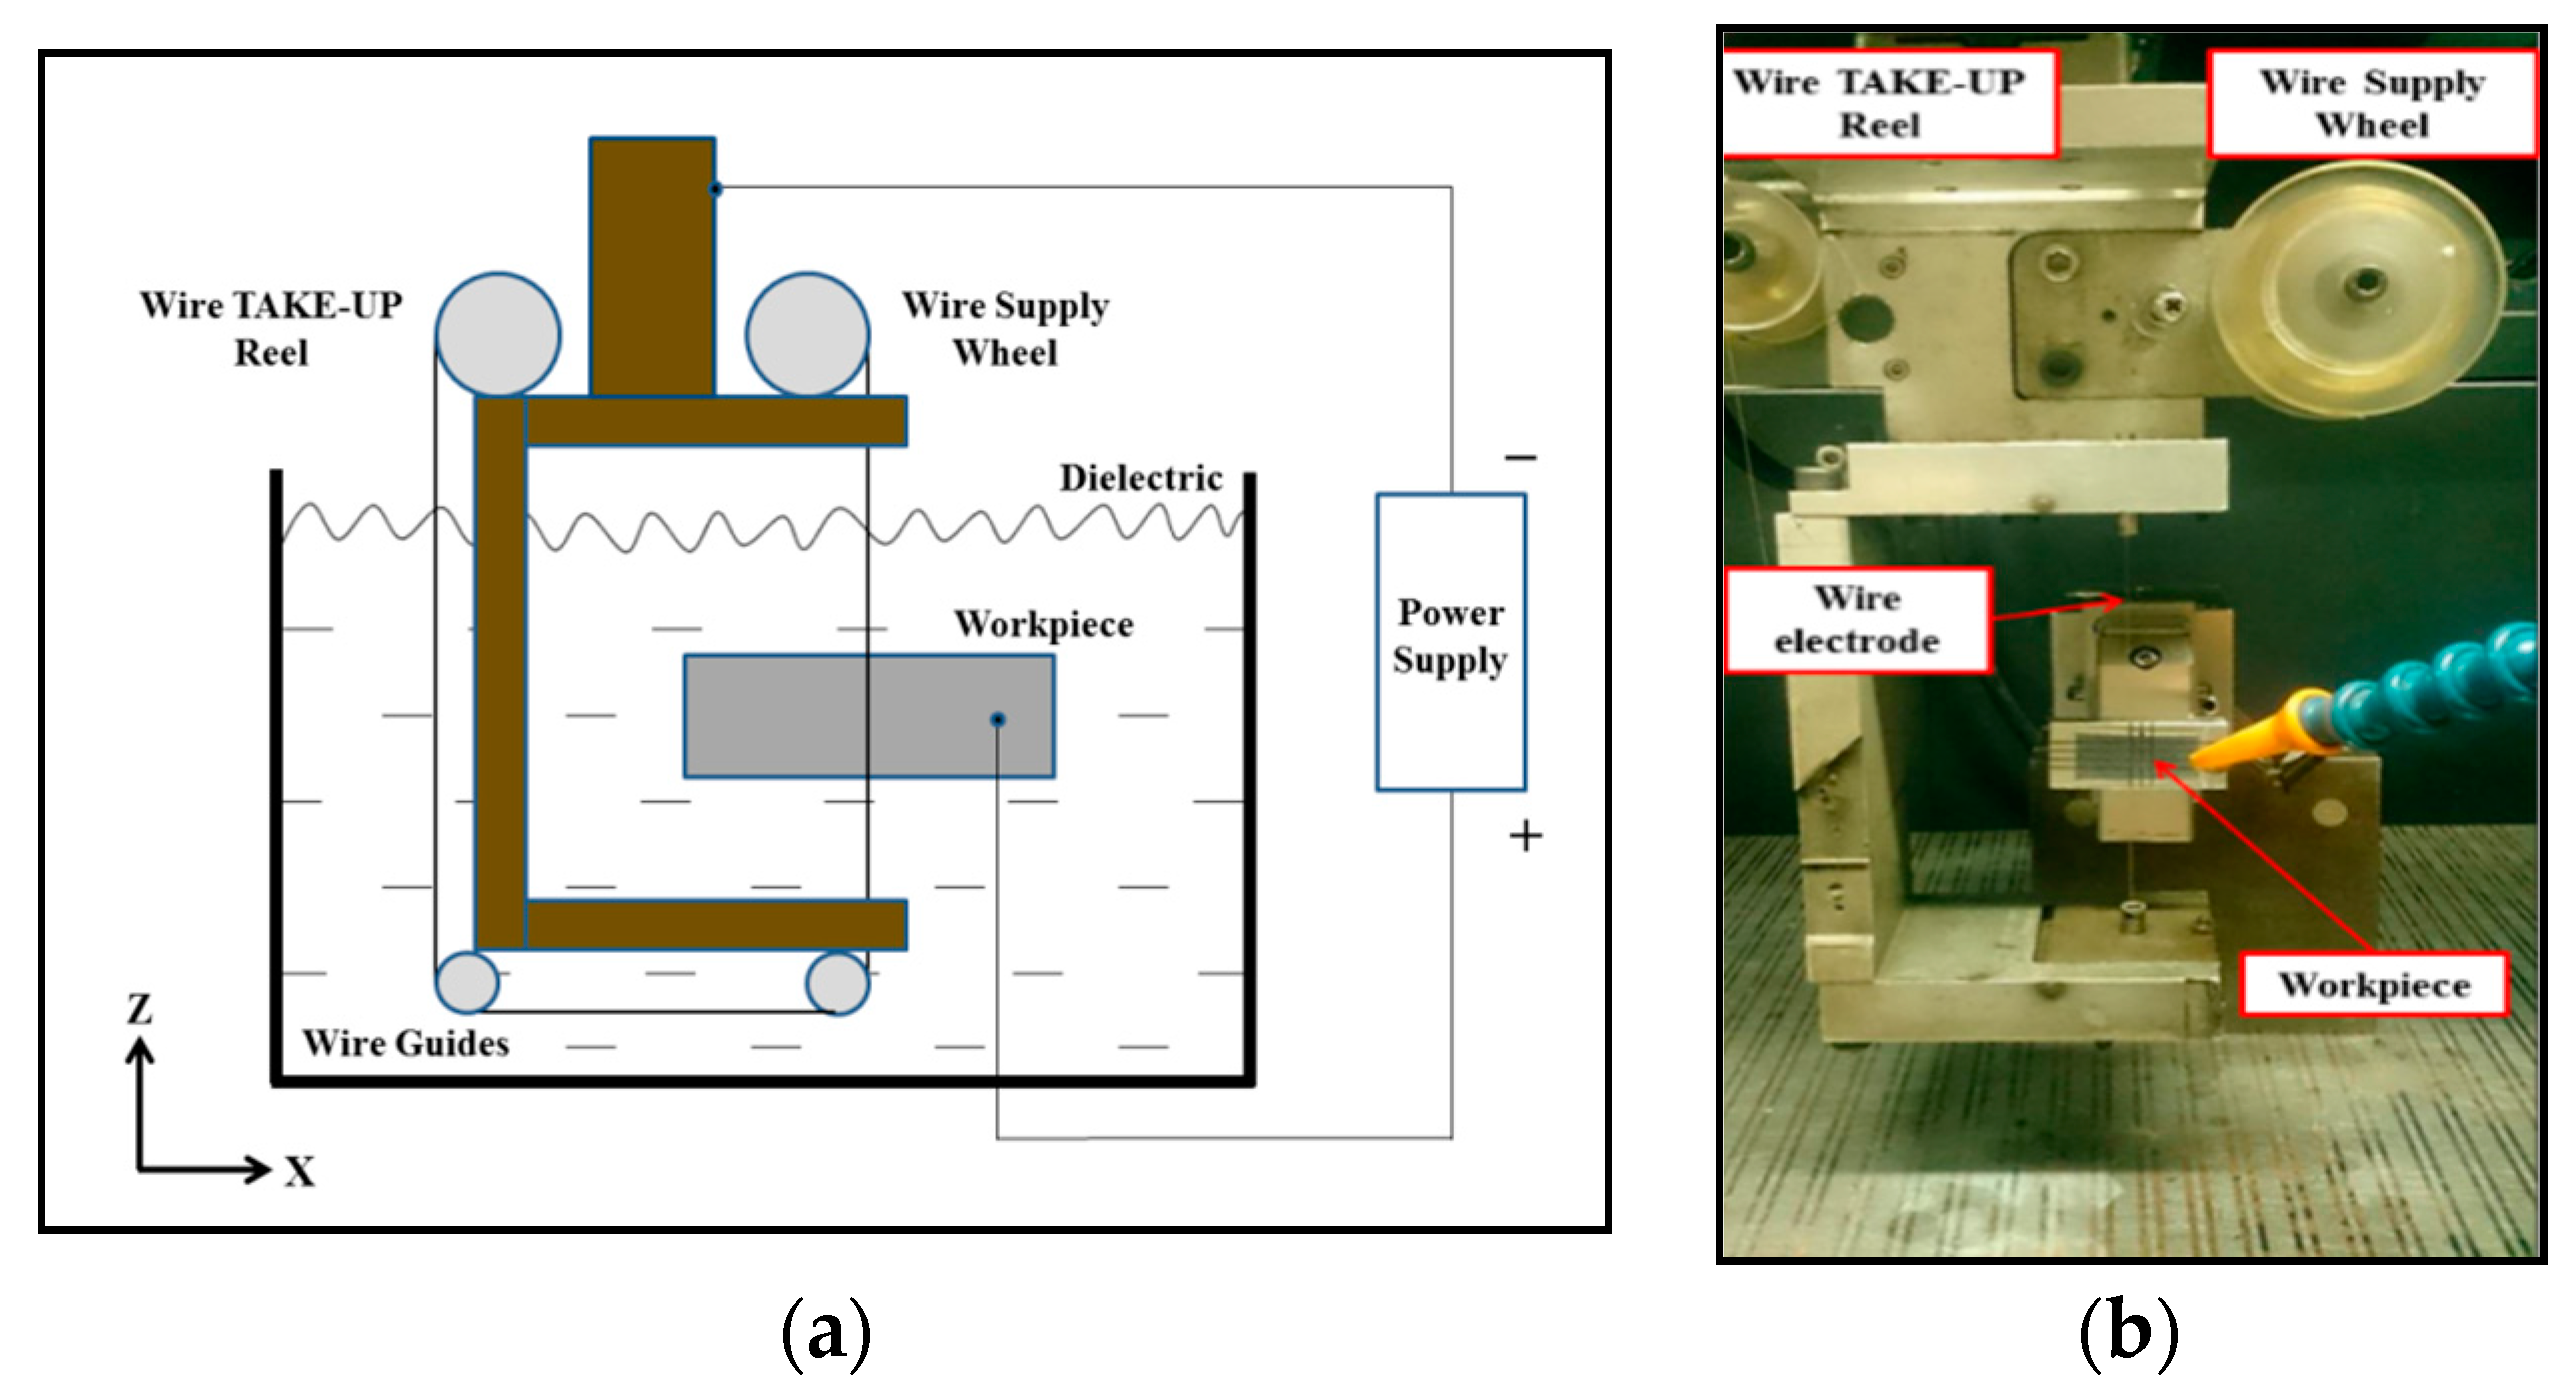
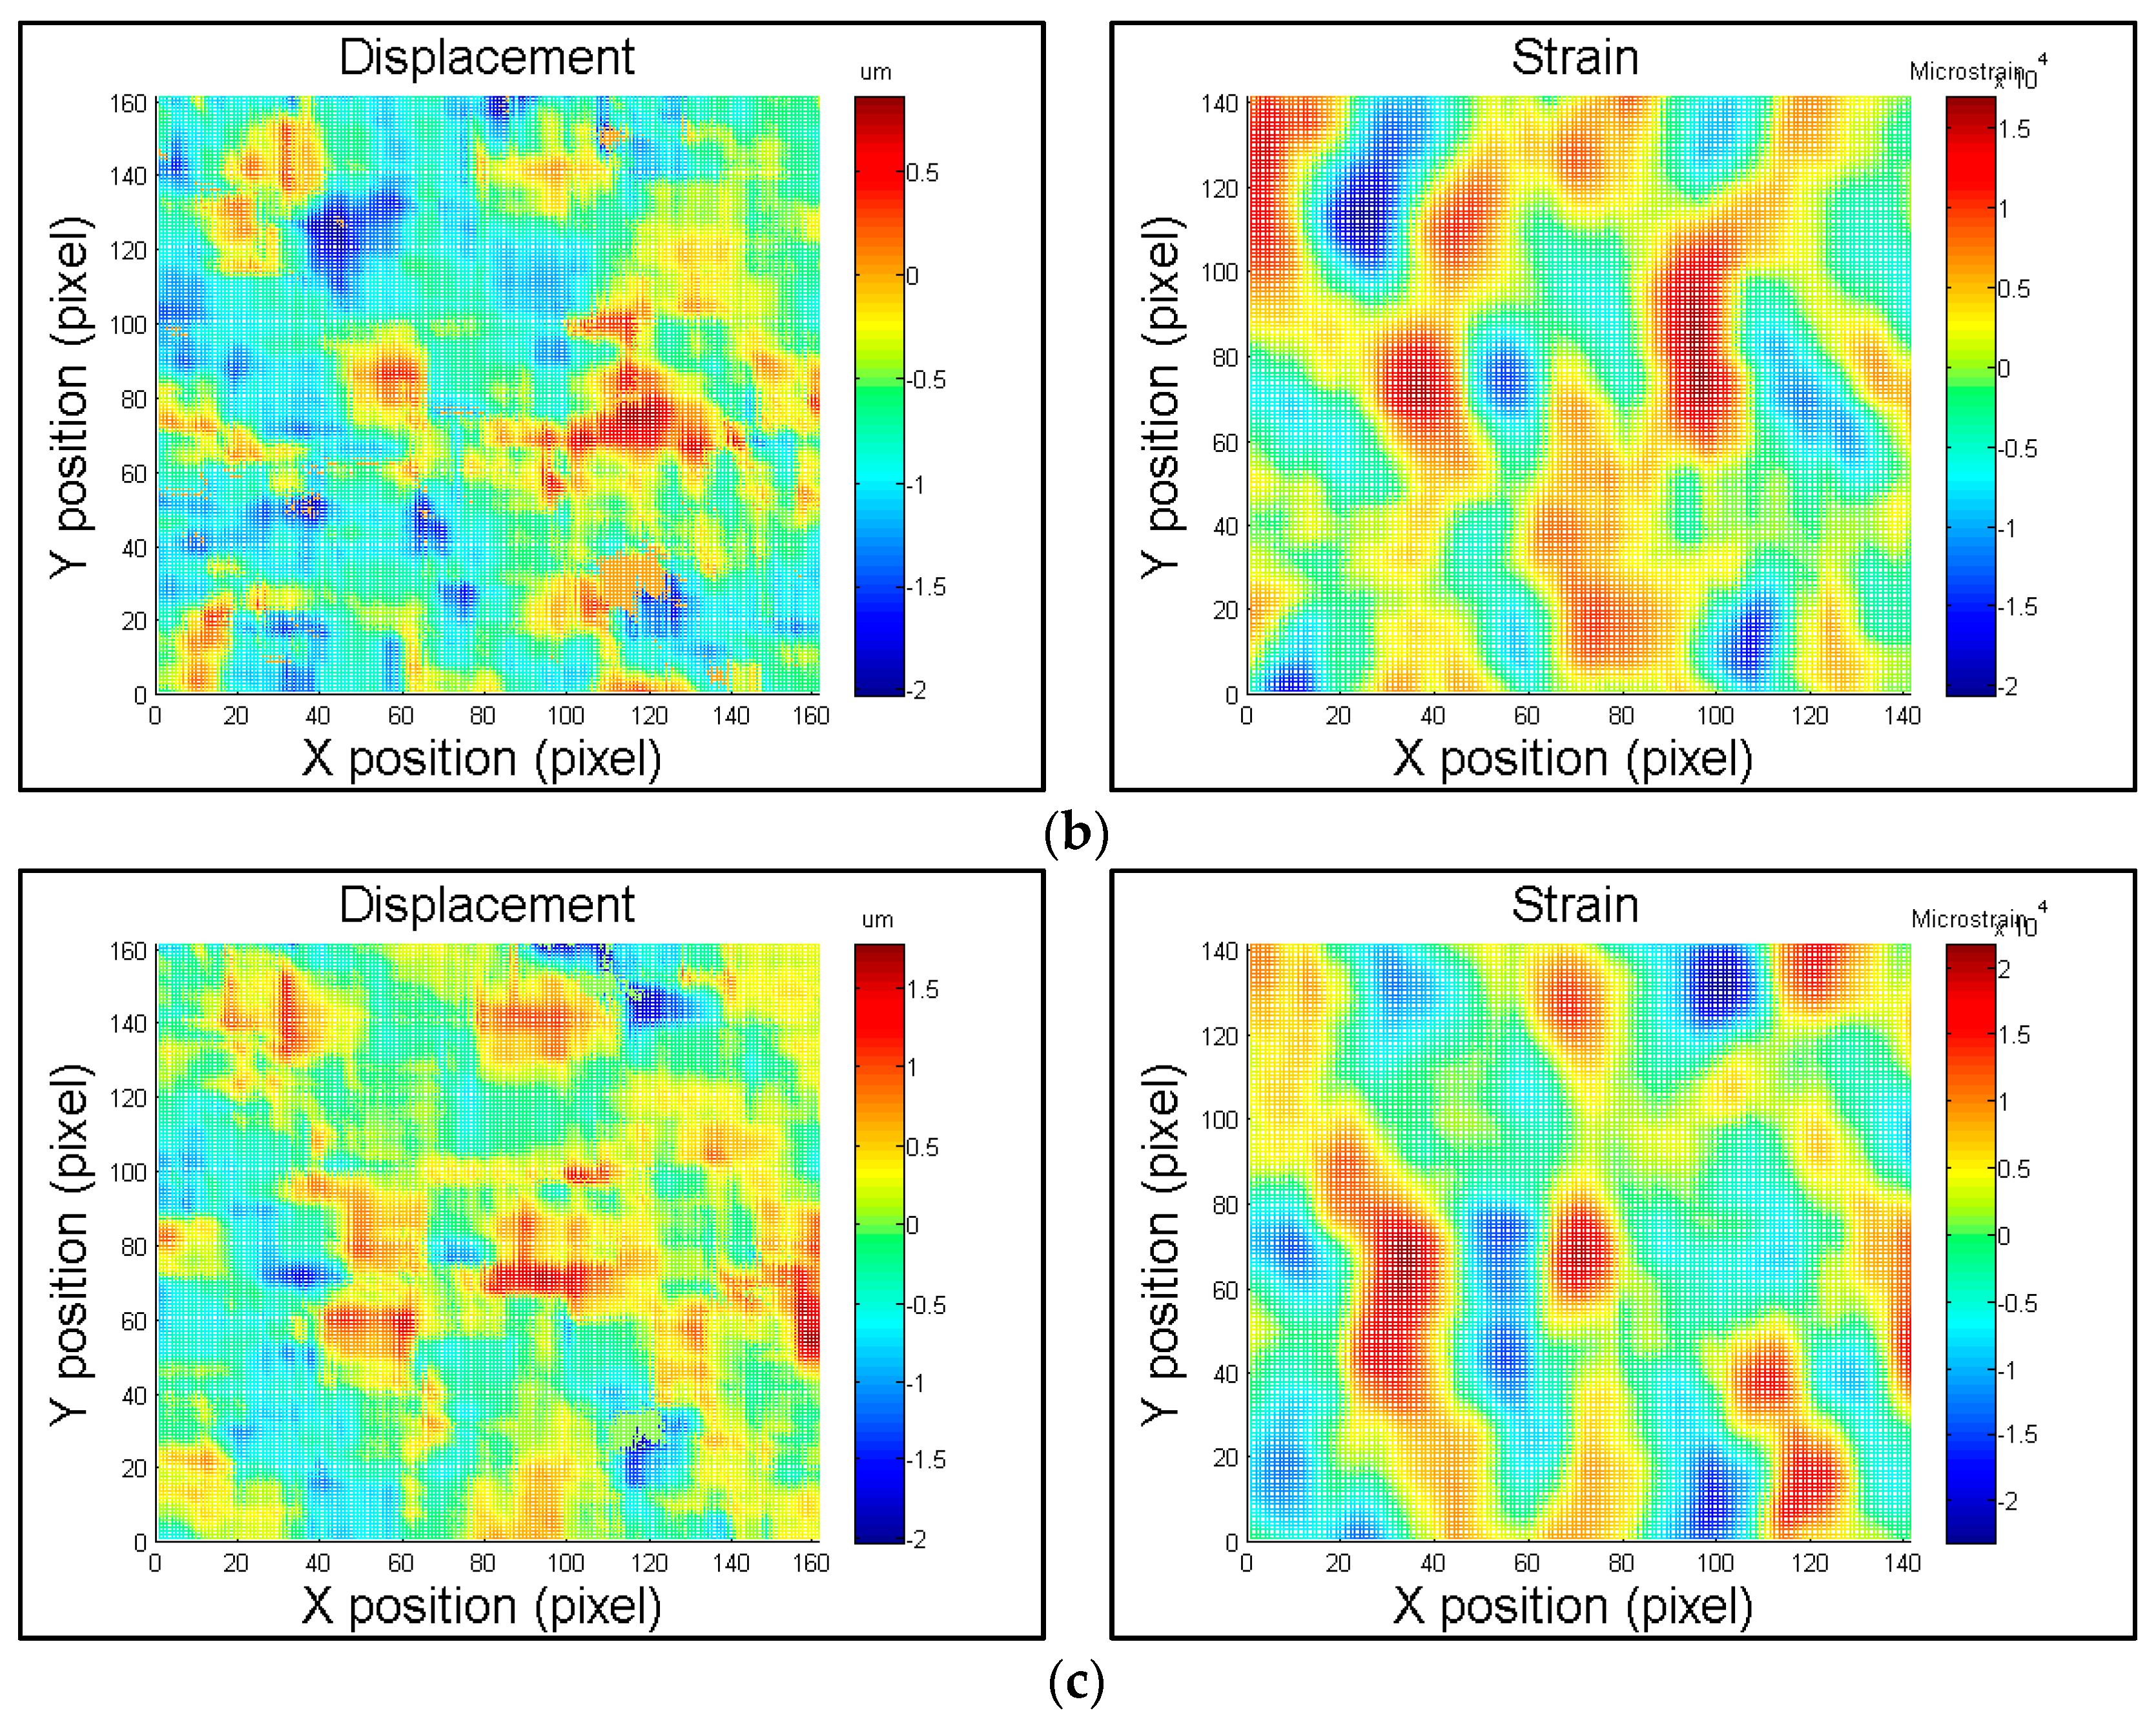
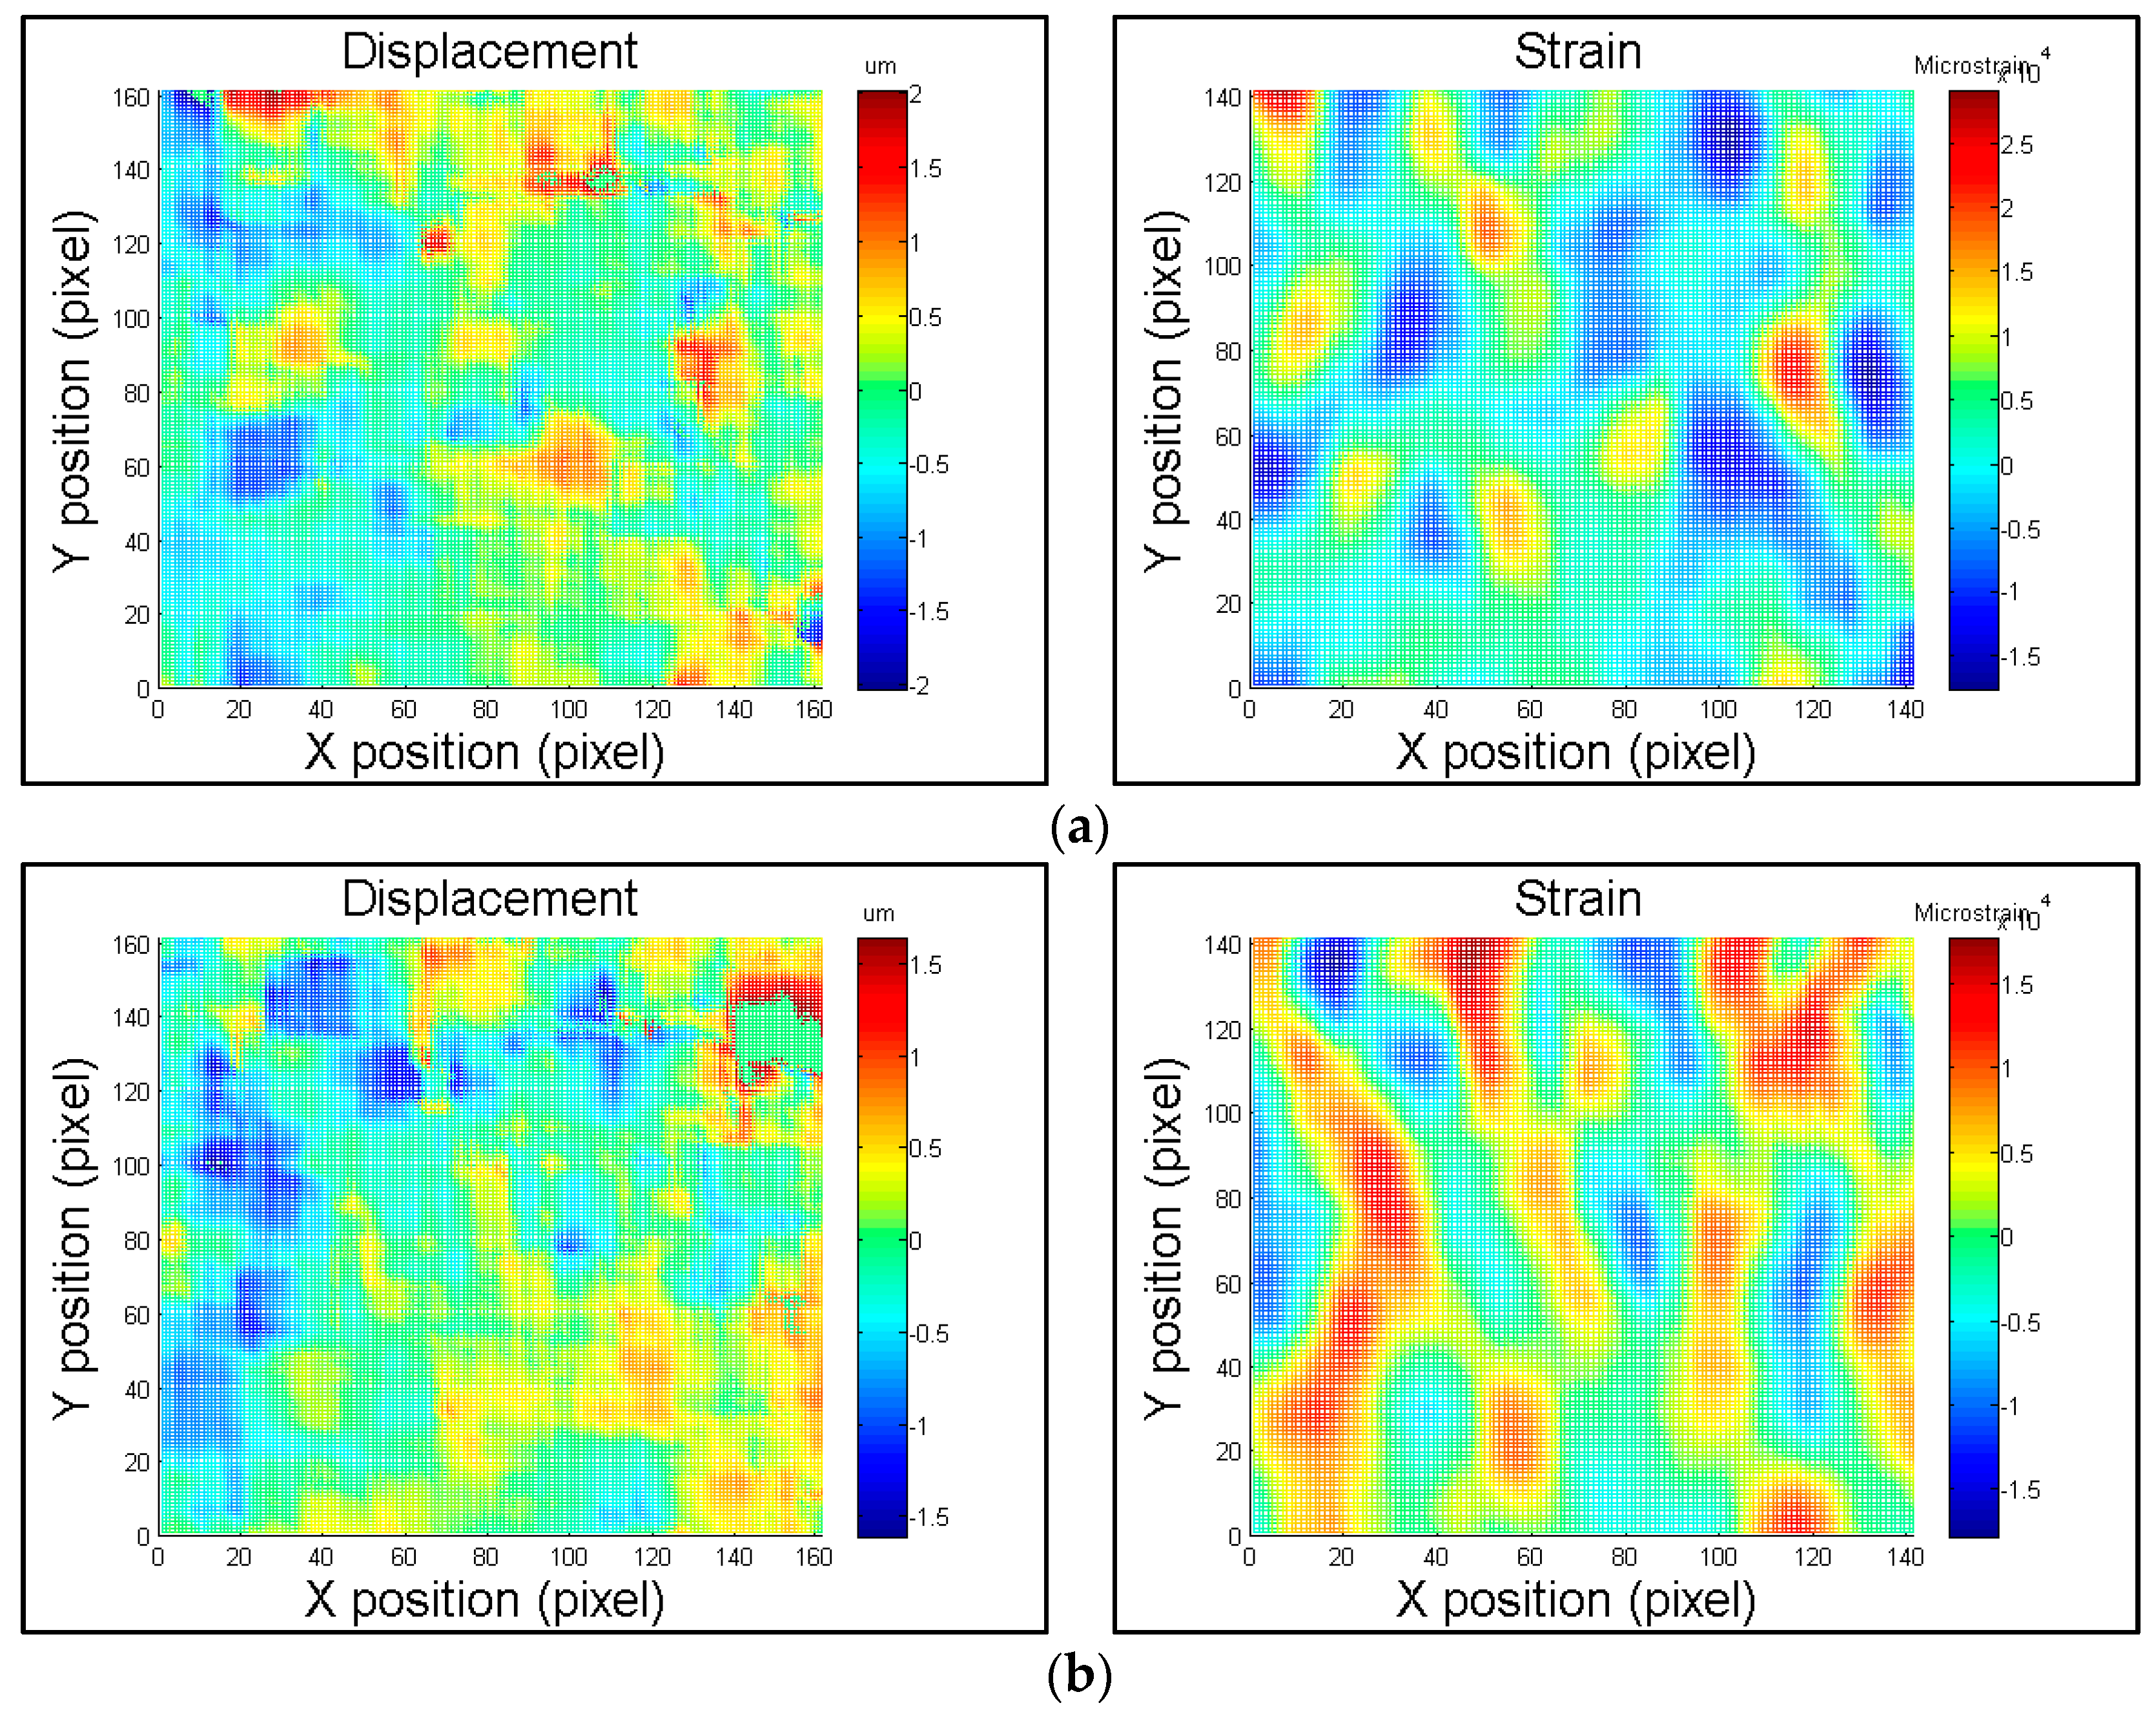
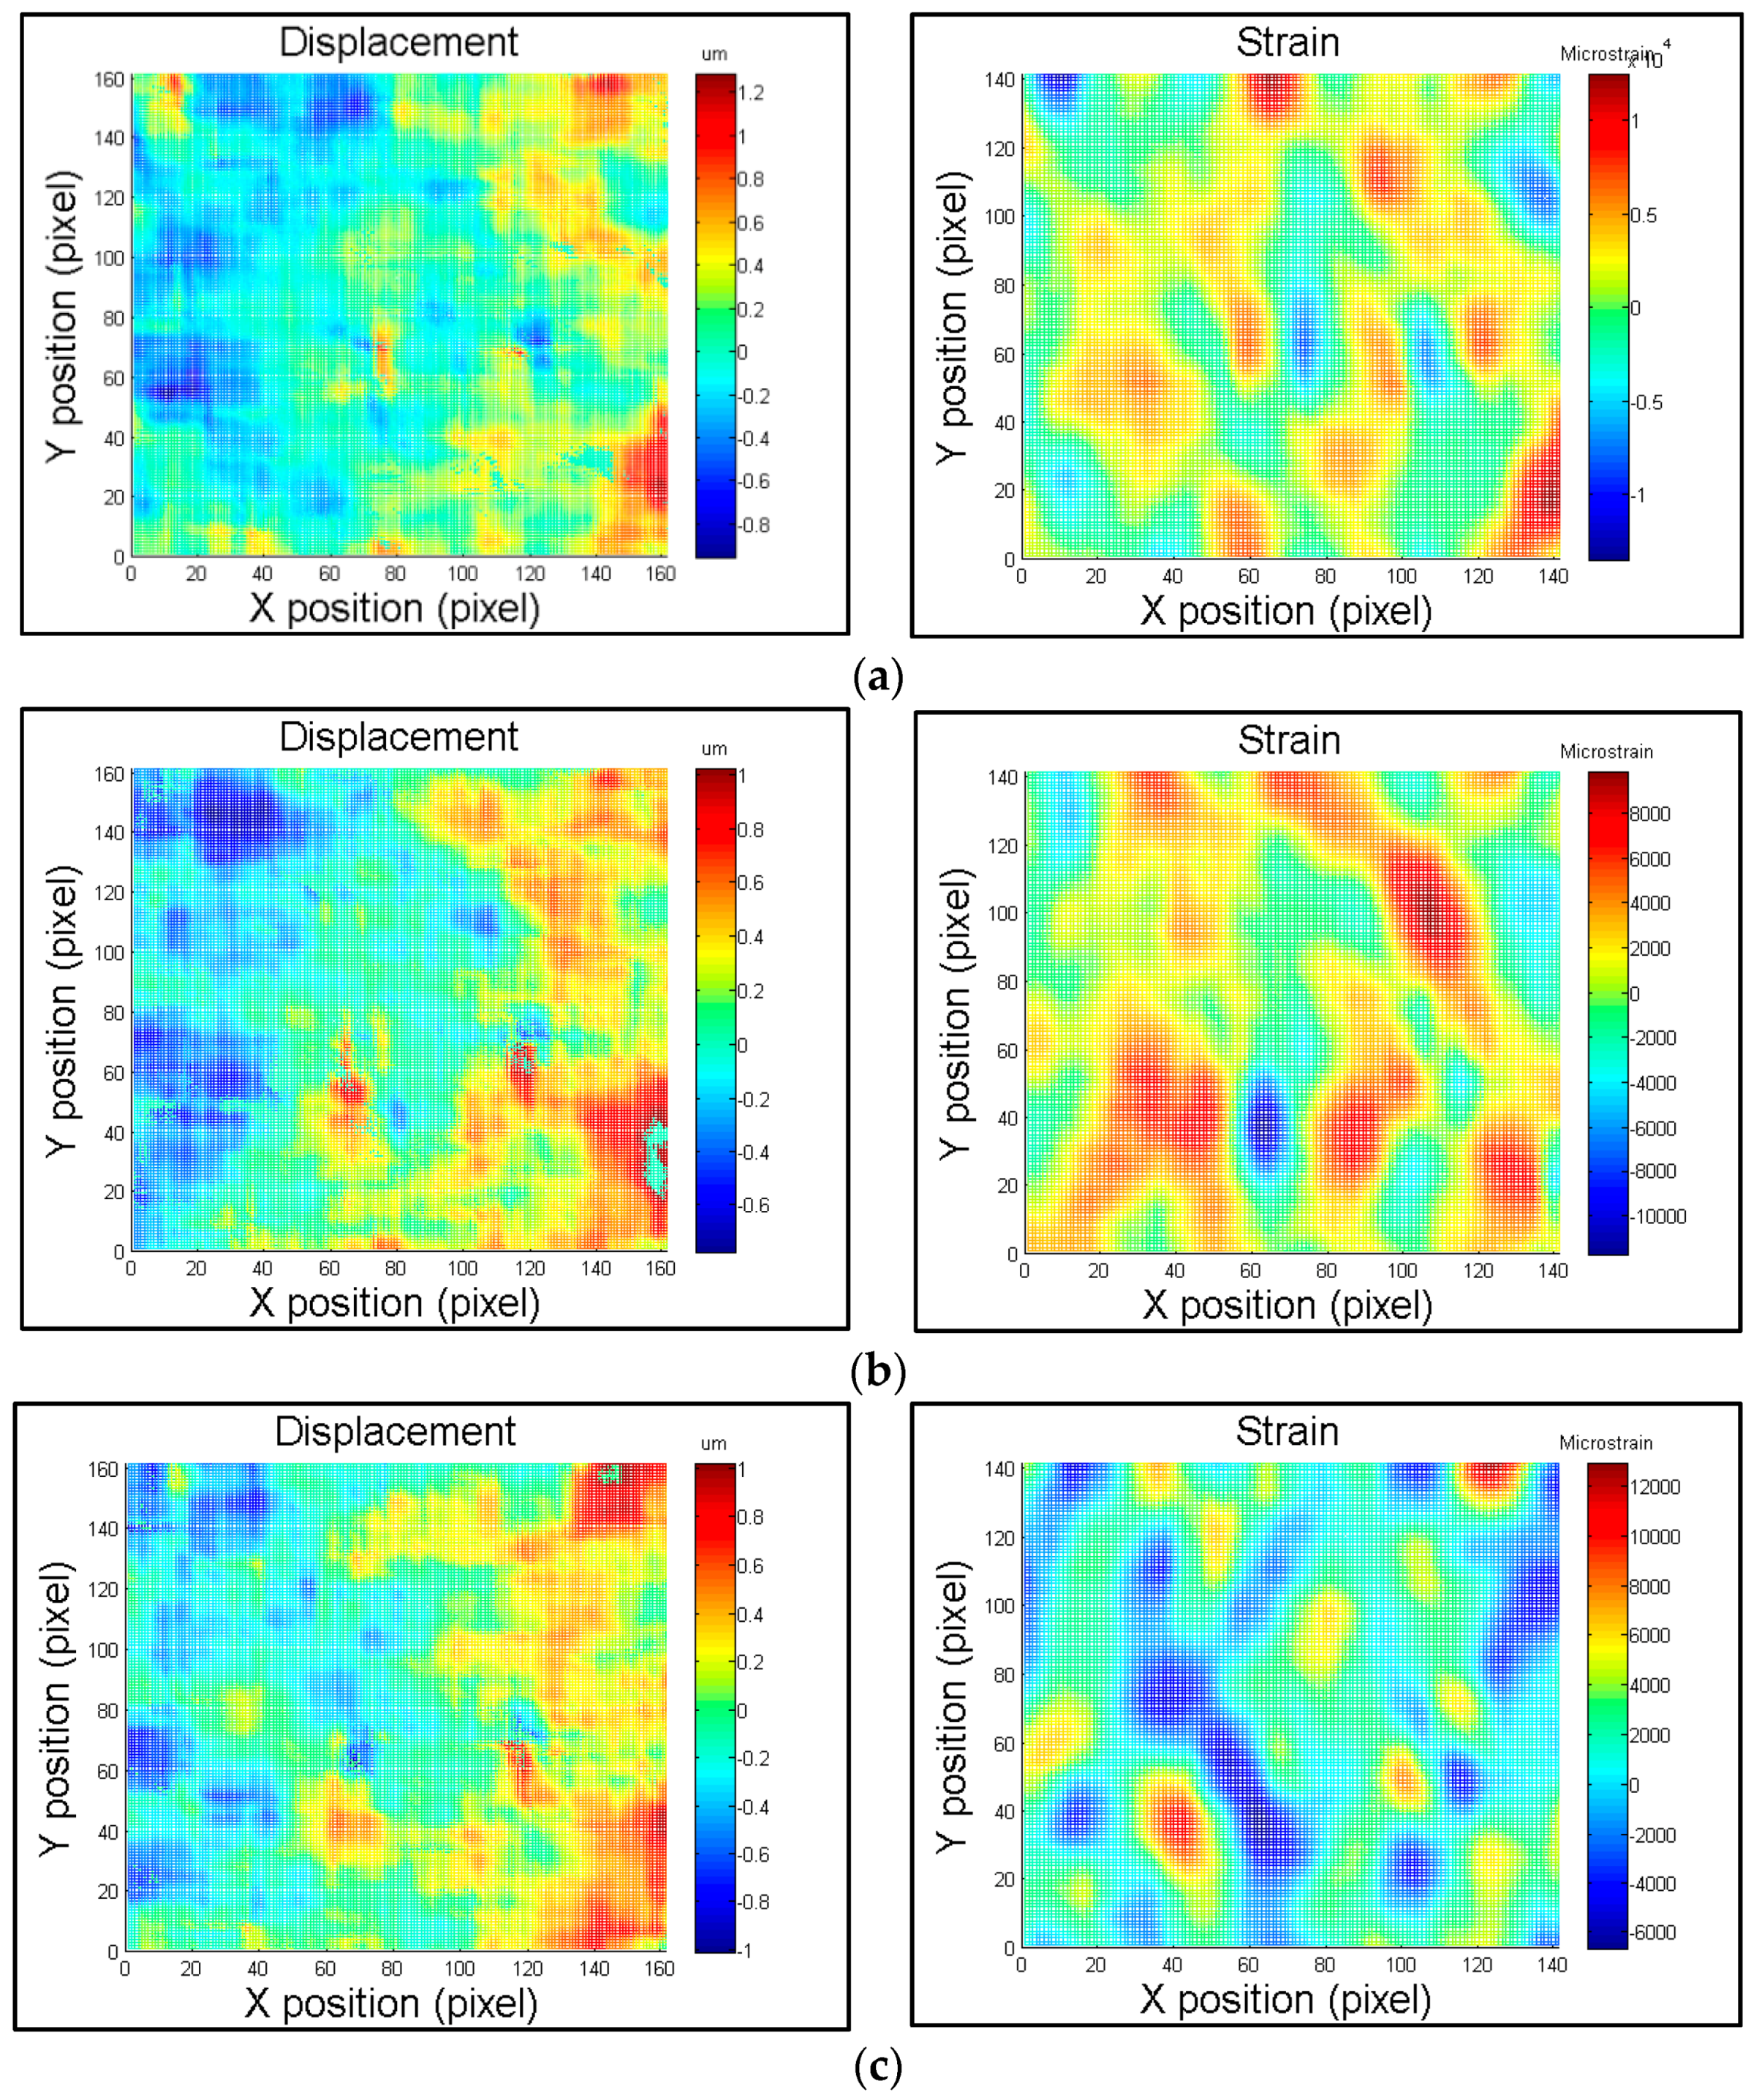
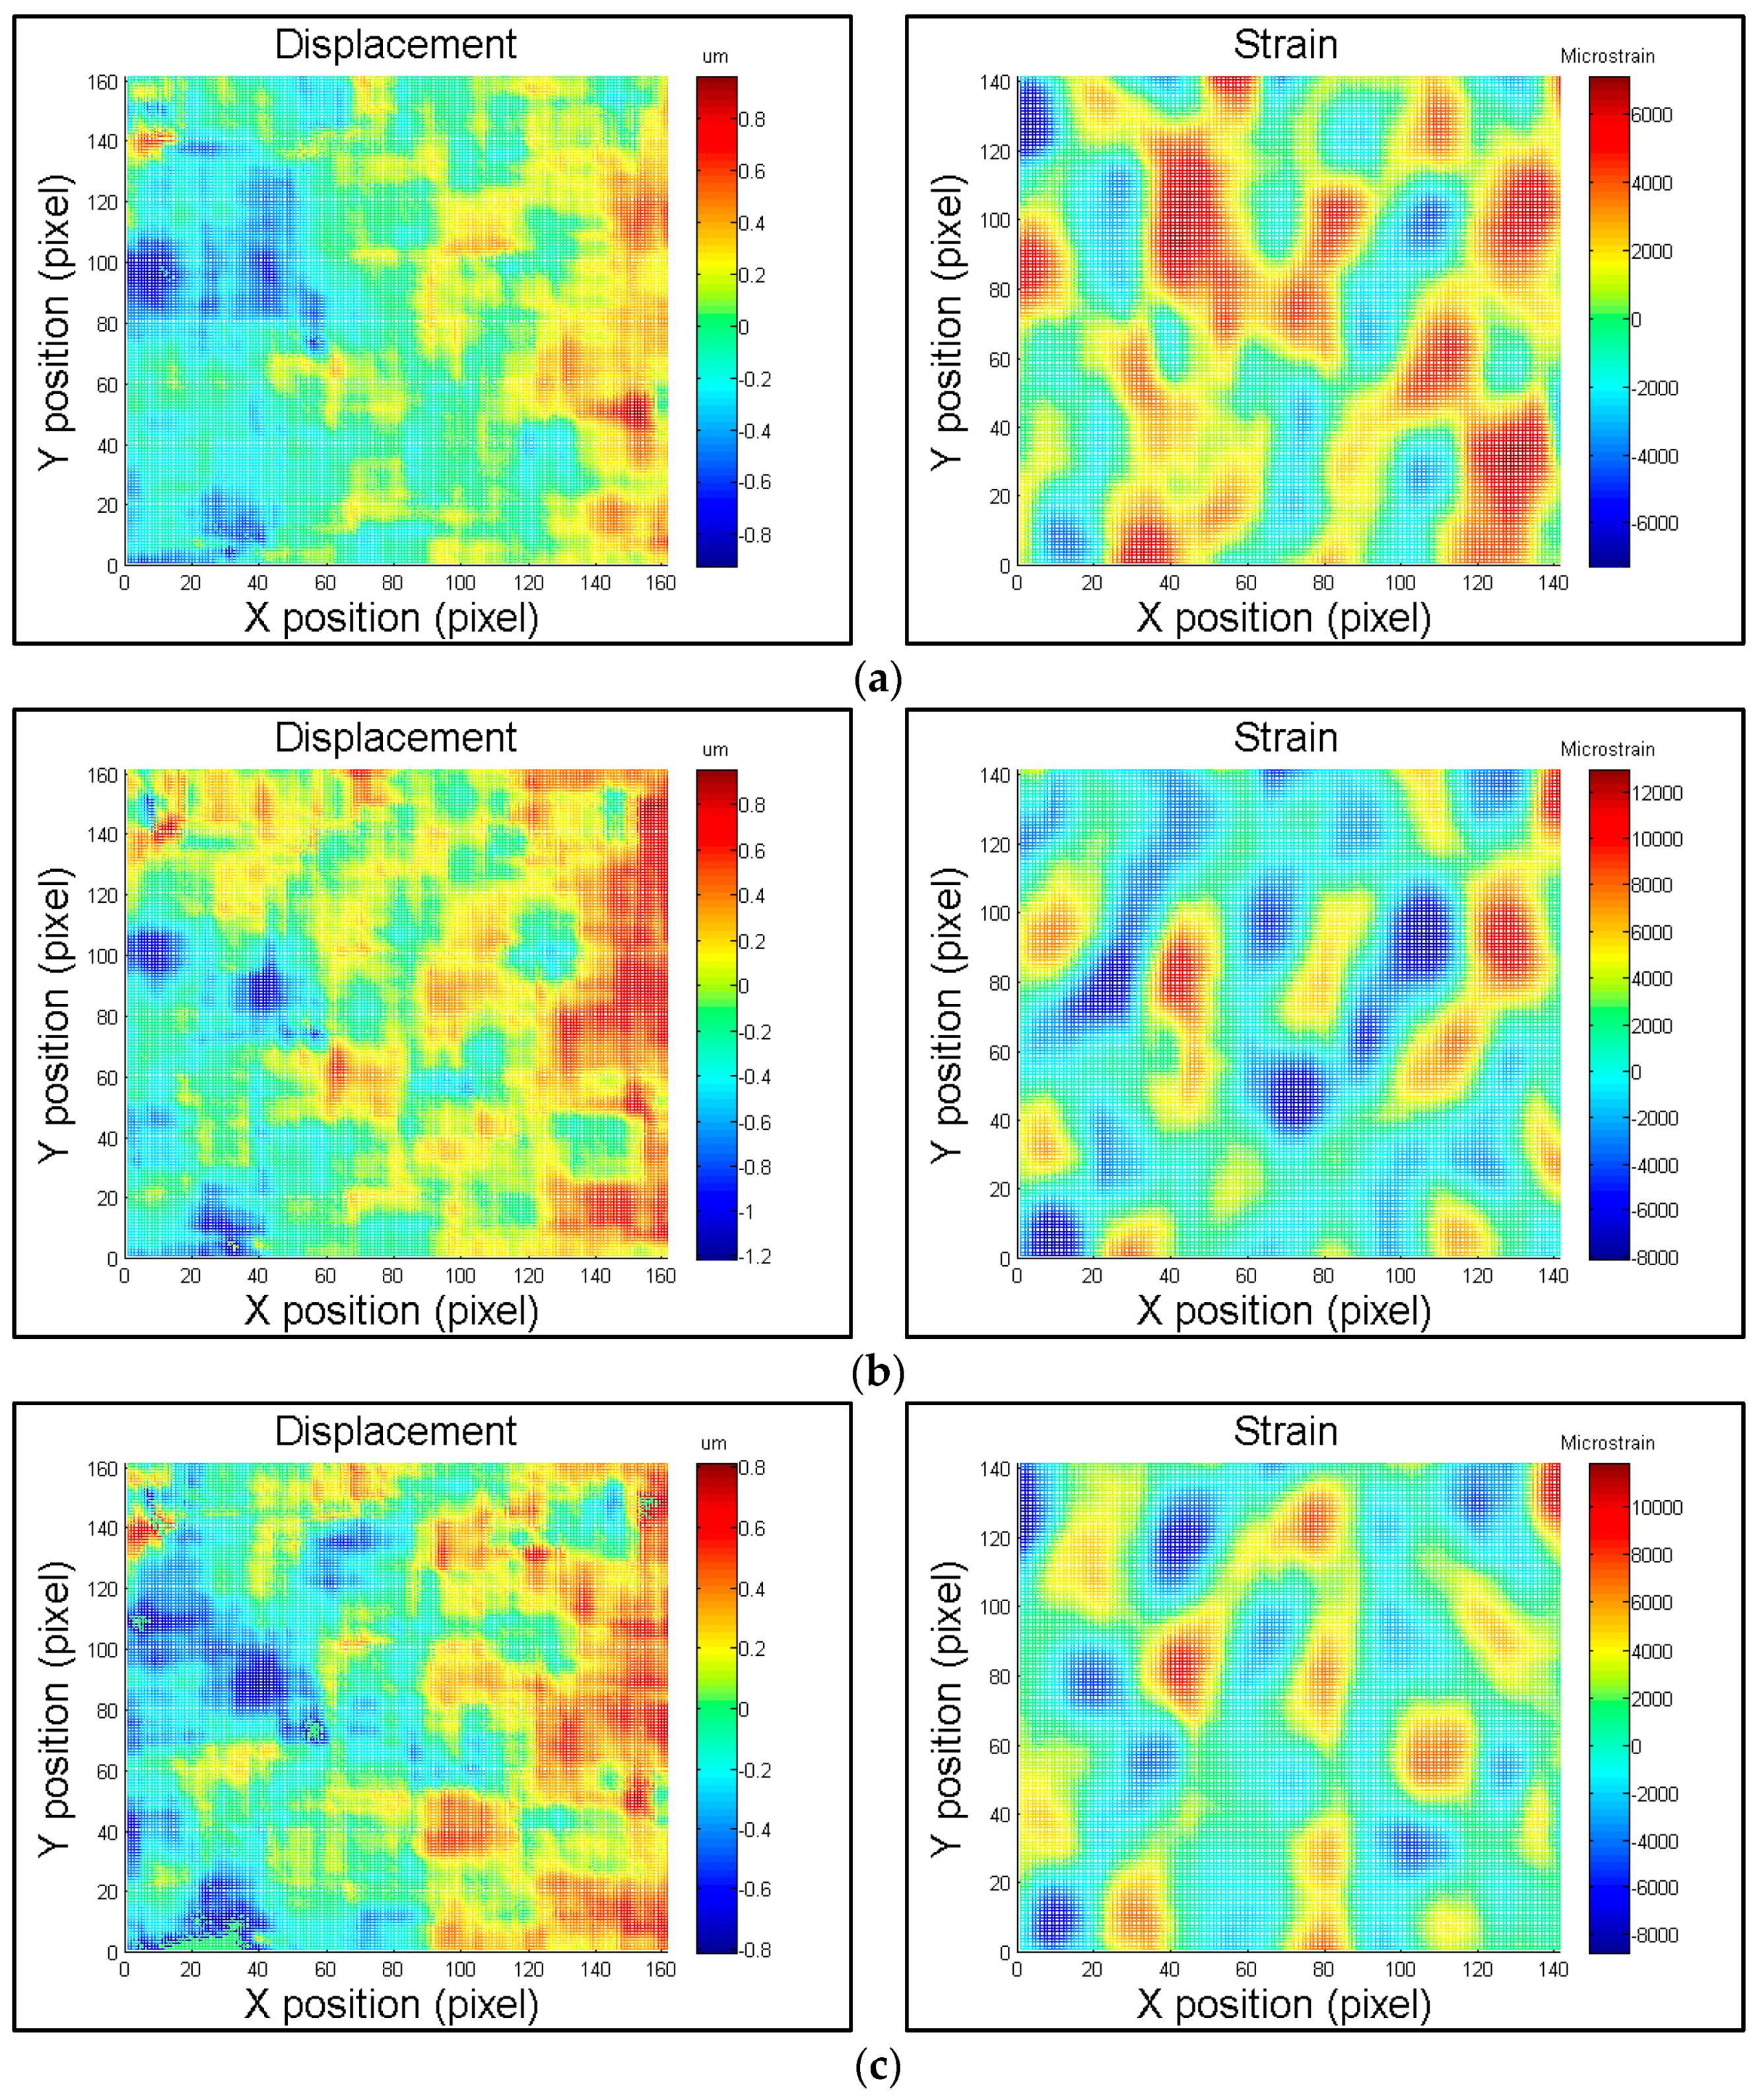
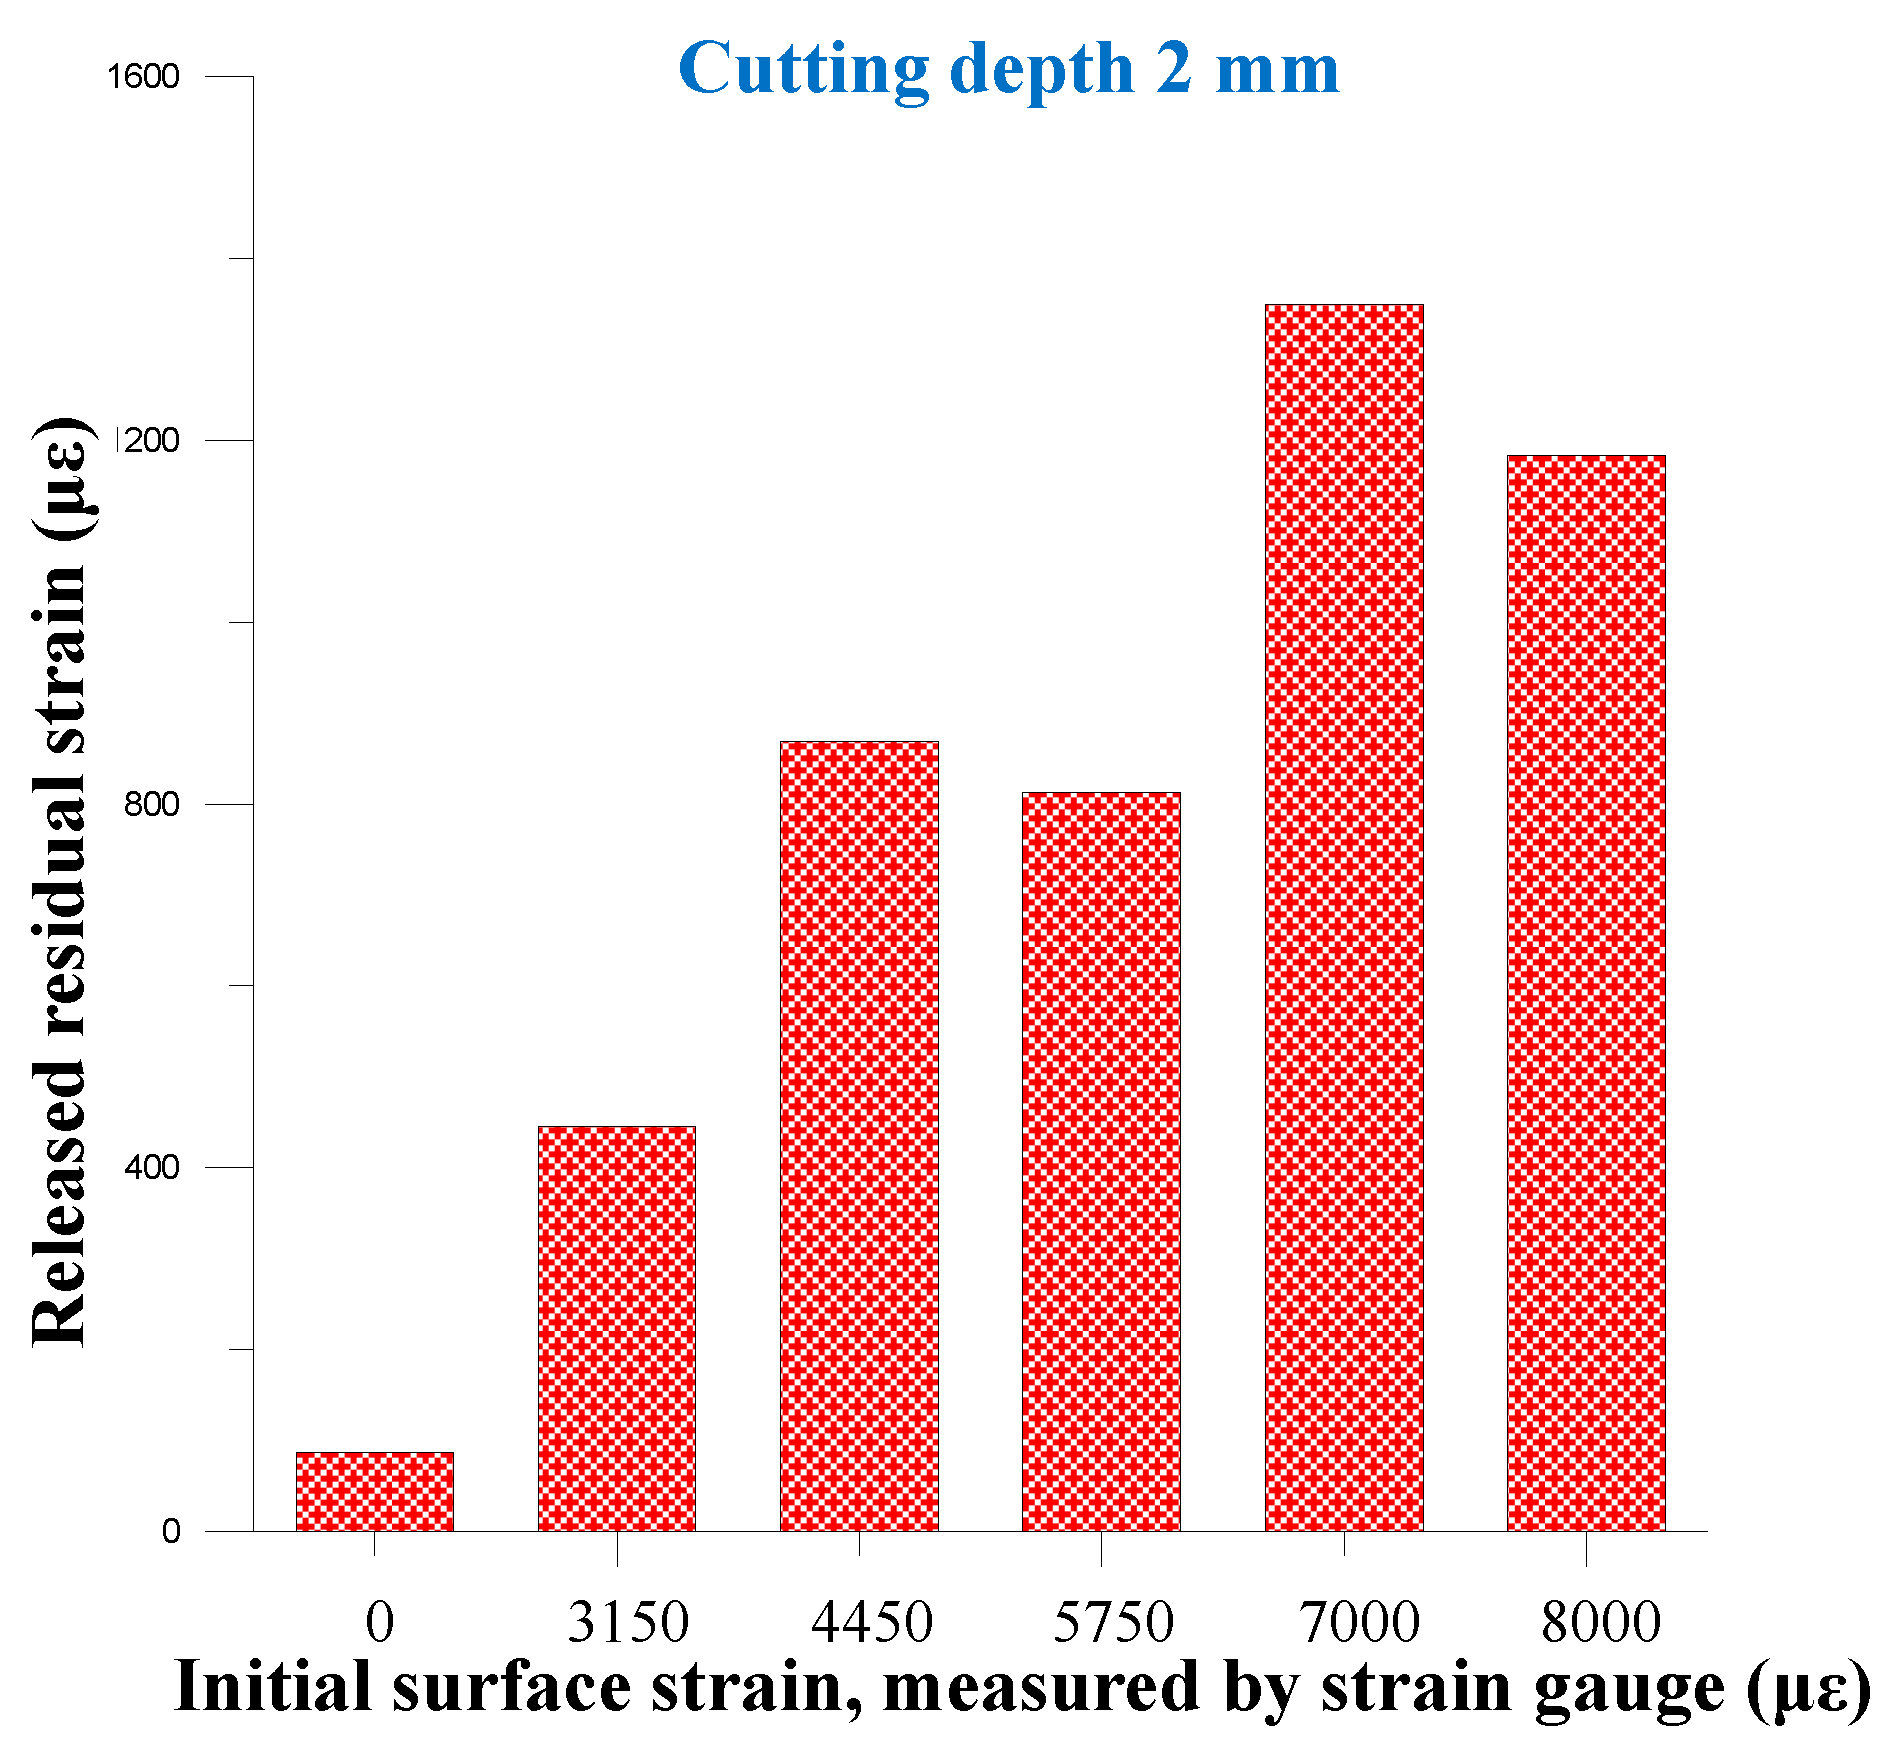
Recording images of the planar specimen surface before and after machining: first, a DIC image of the reference area to be analyzed is captured by the camera. After capturing the DIC reference image, incremental cutting depths of 1, 2 and 3 mm are applied by WEDM. The dimensions of the scanned area are determined. Then, the DIC image of the area around the cutting zone is captured and analyzed.
3)
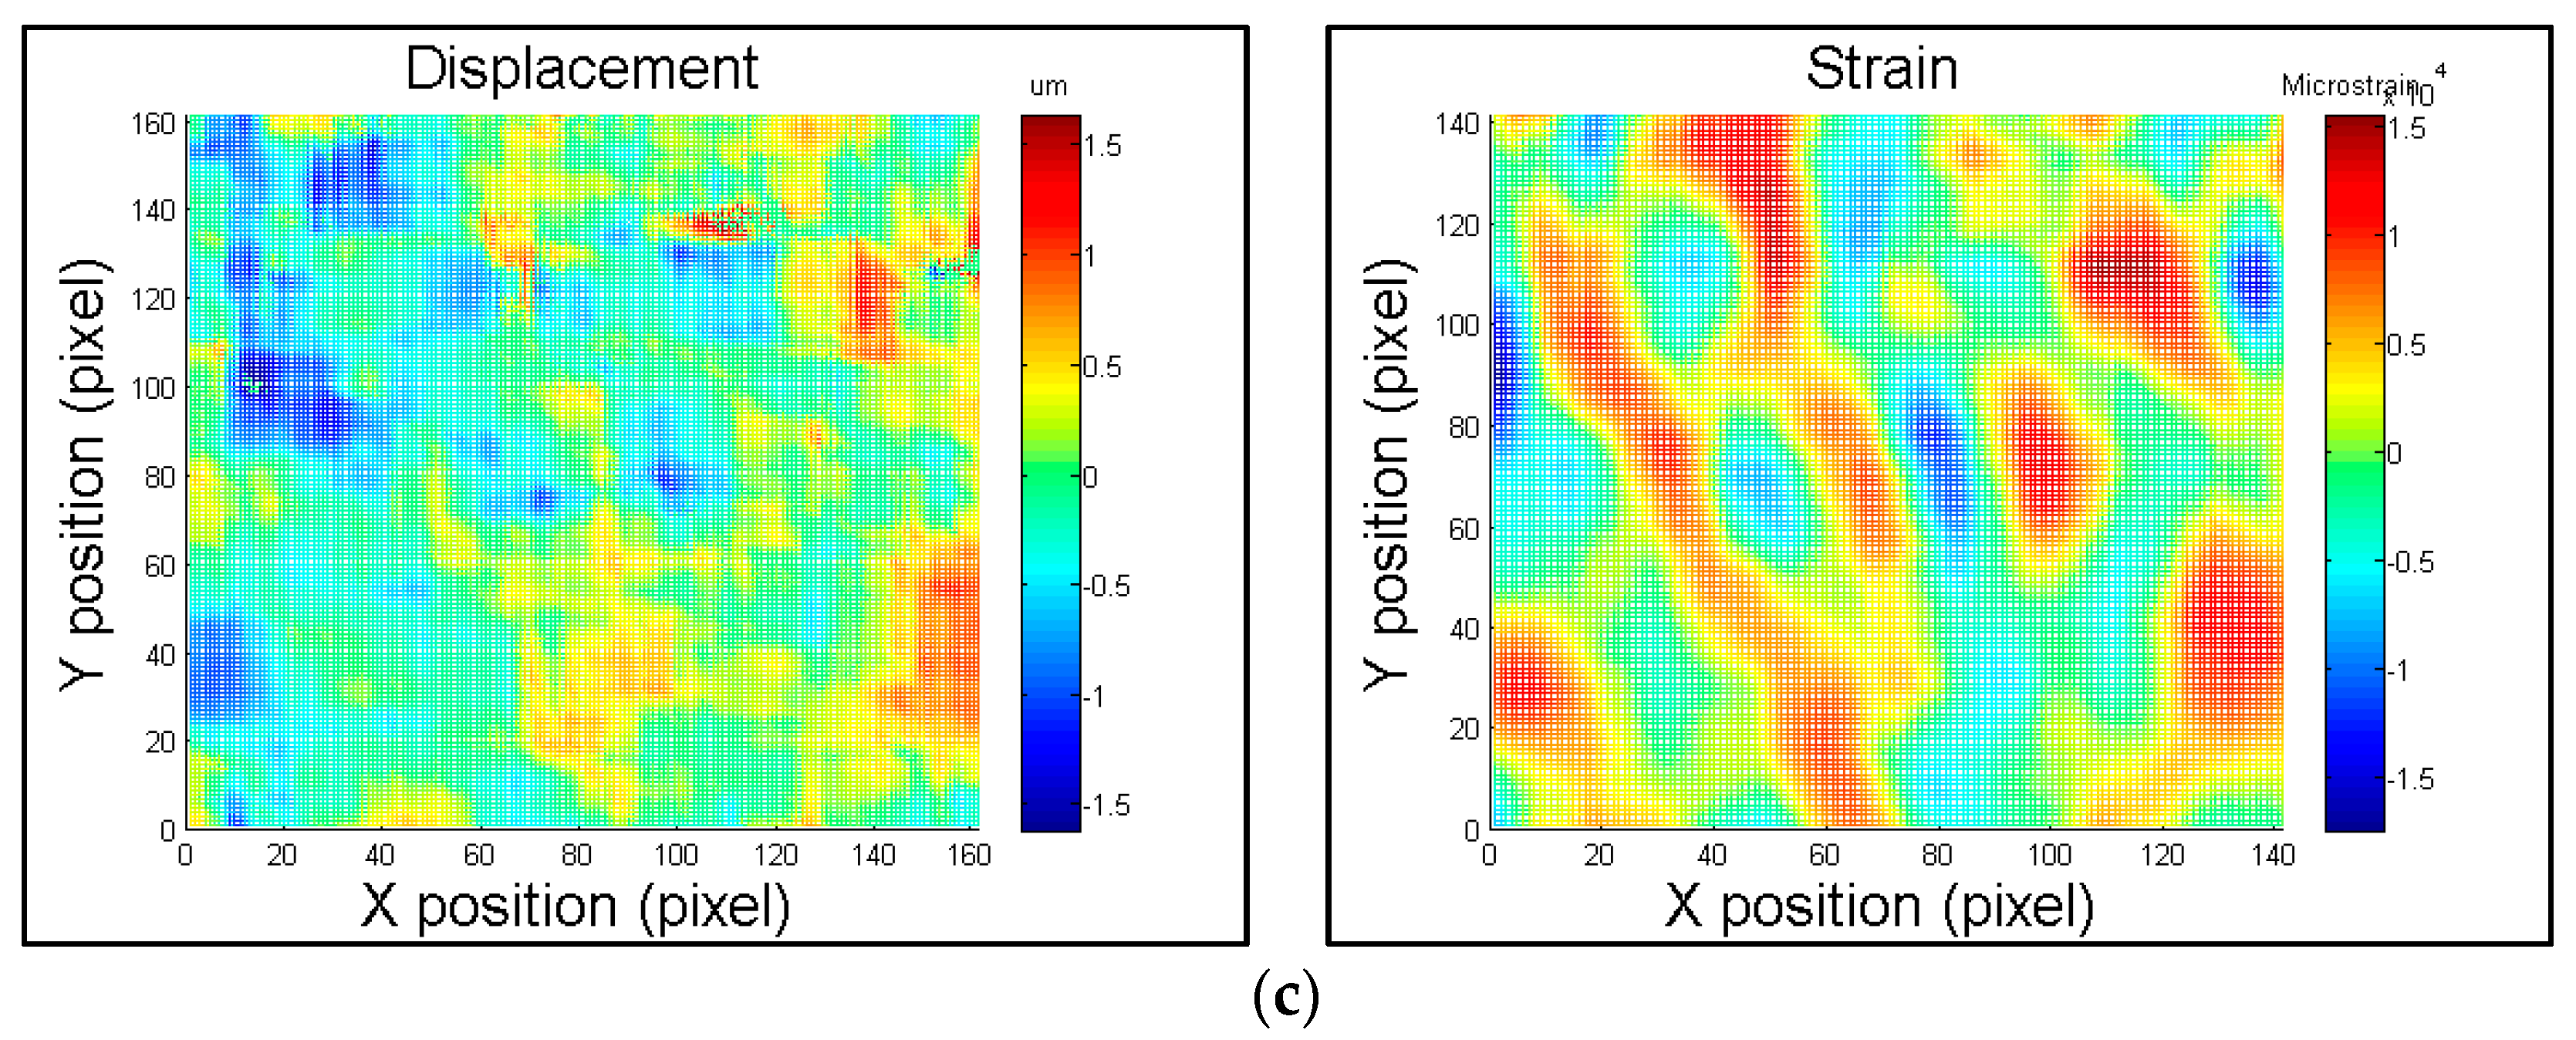
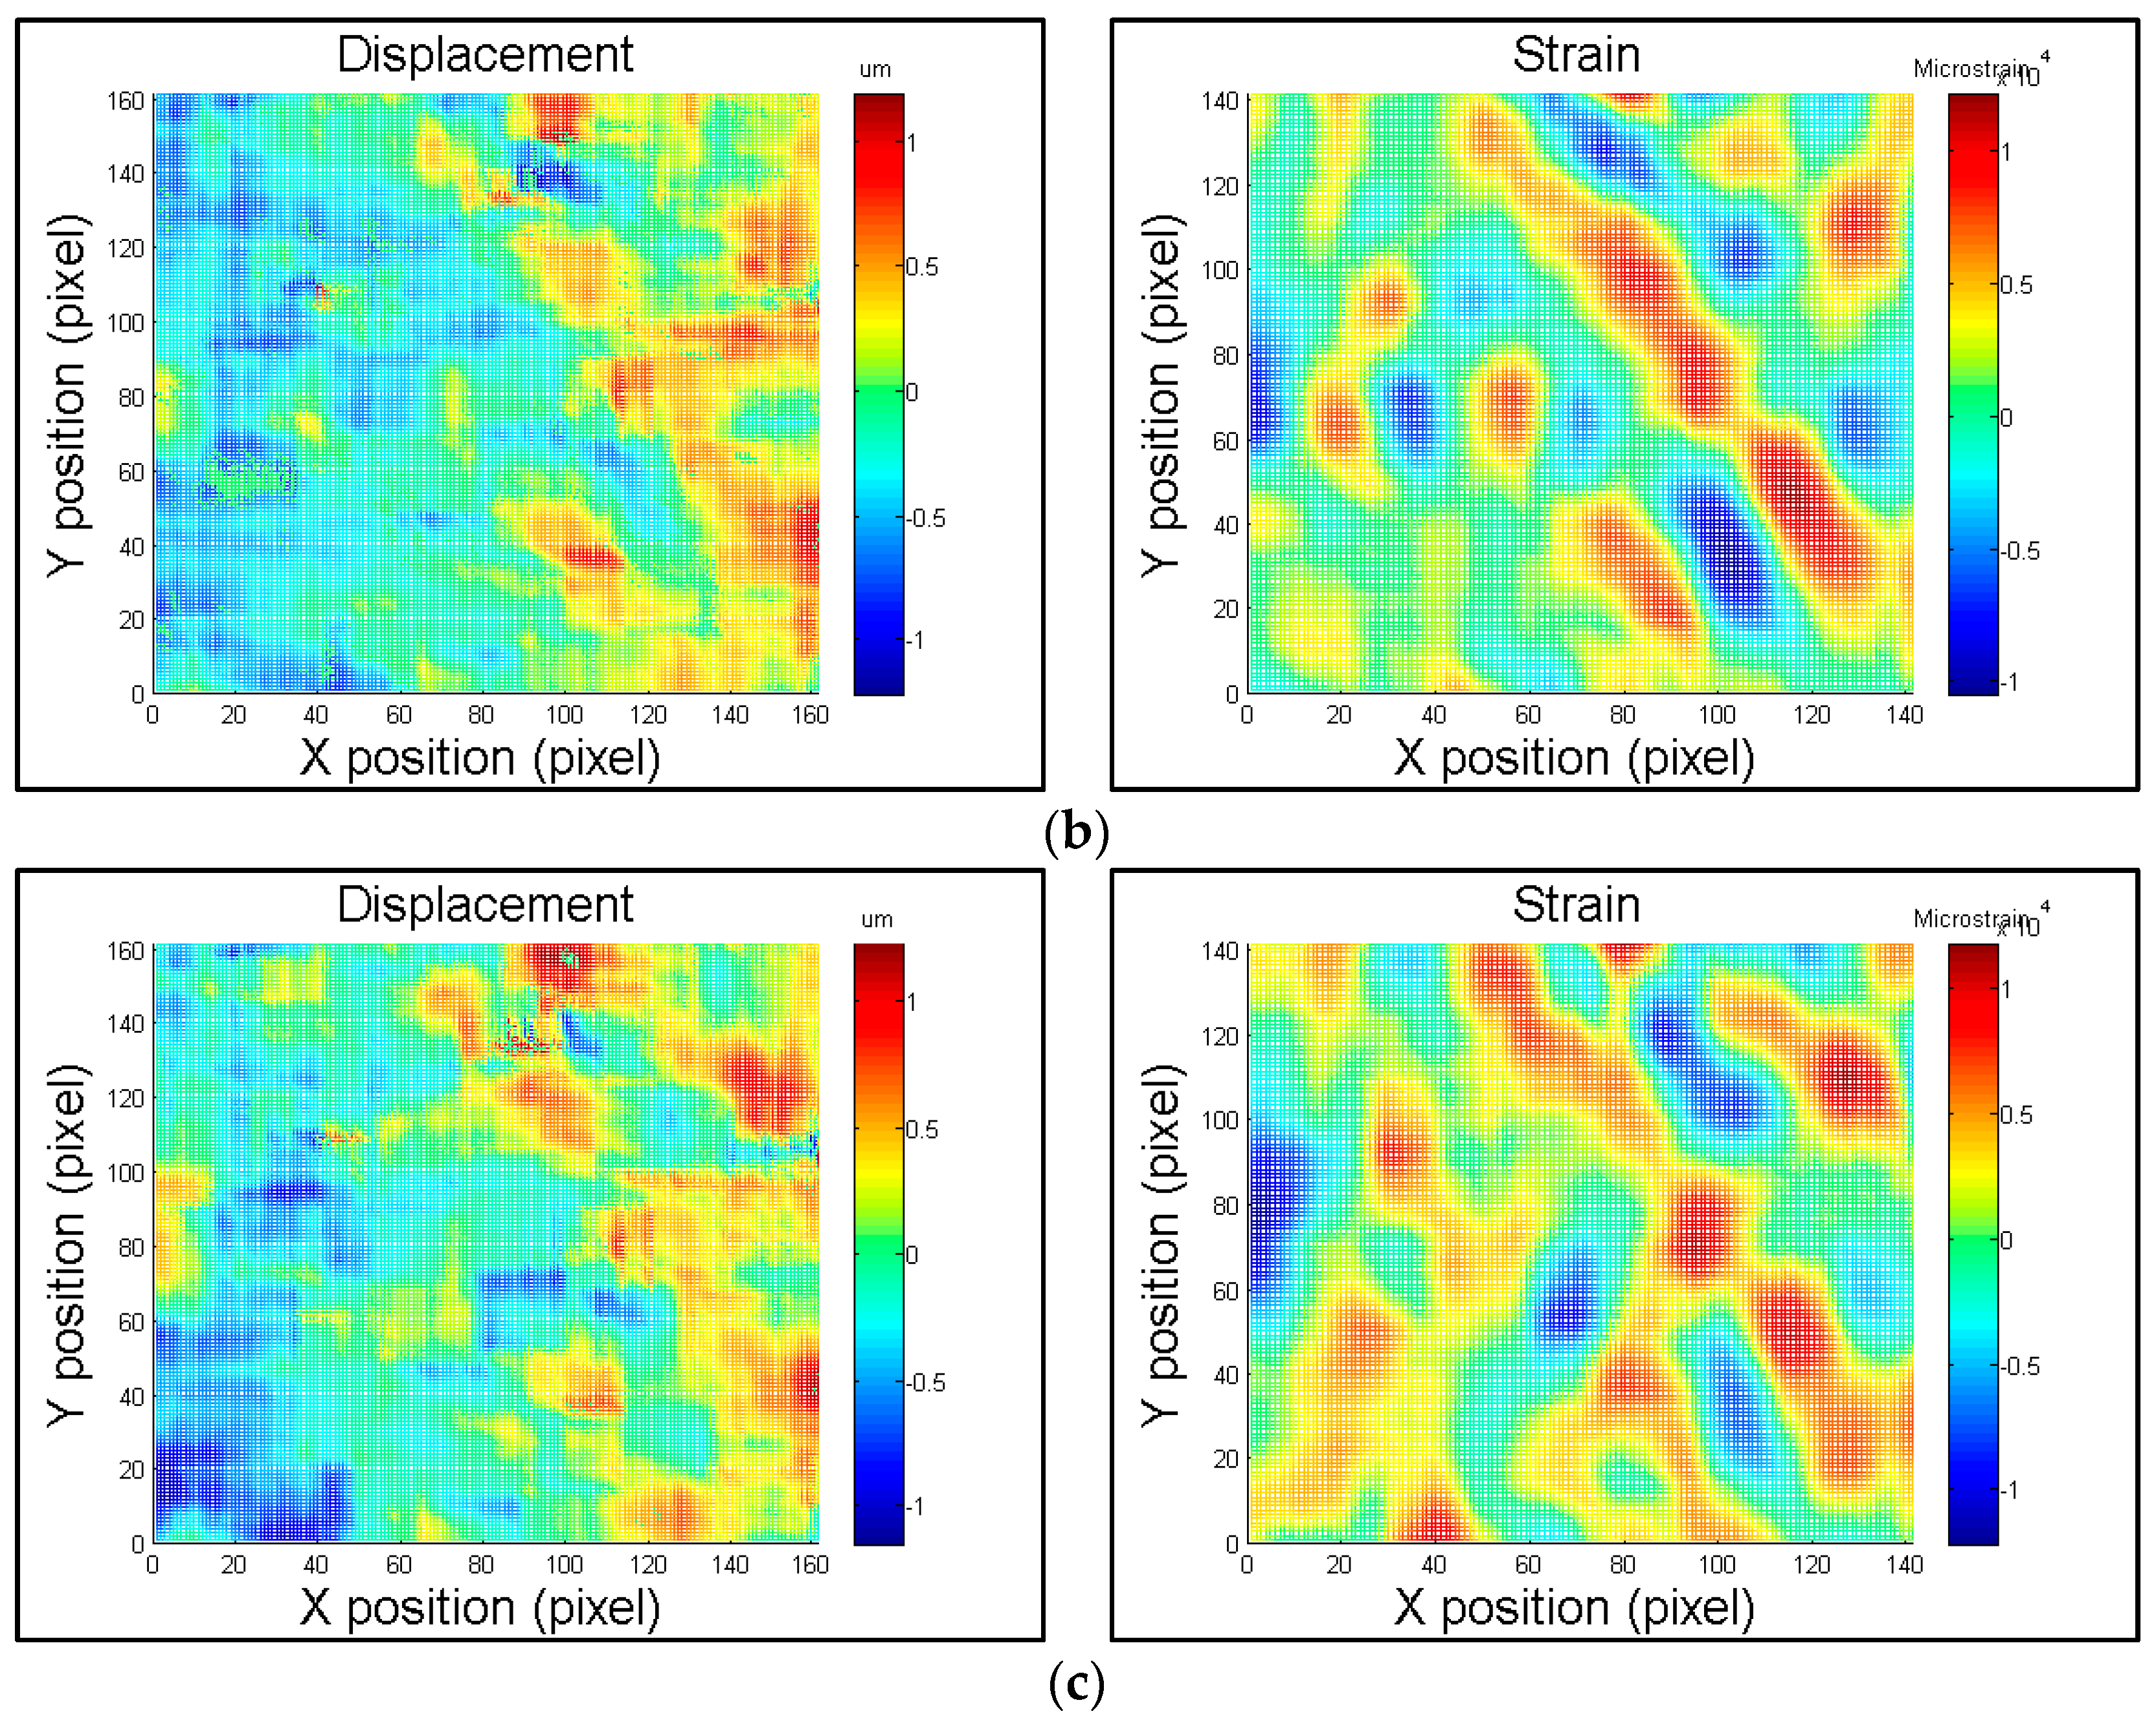
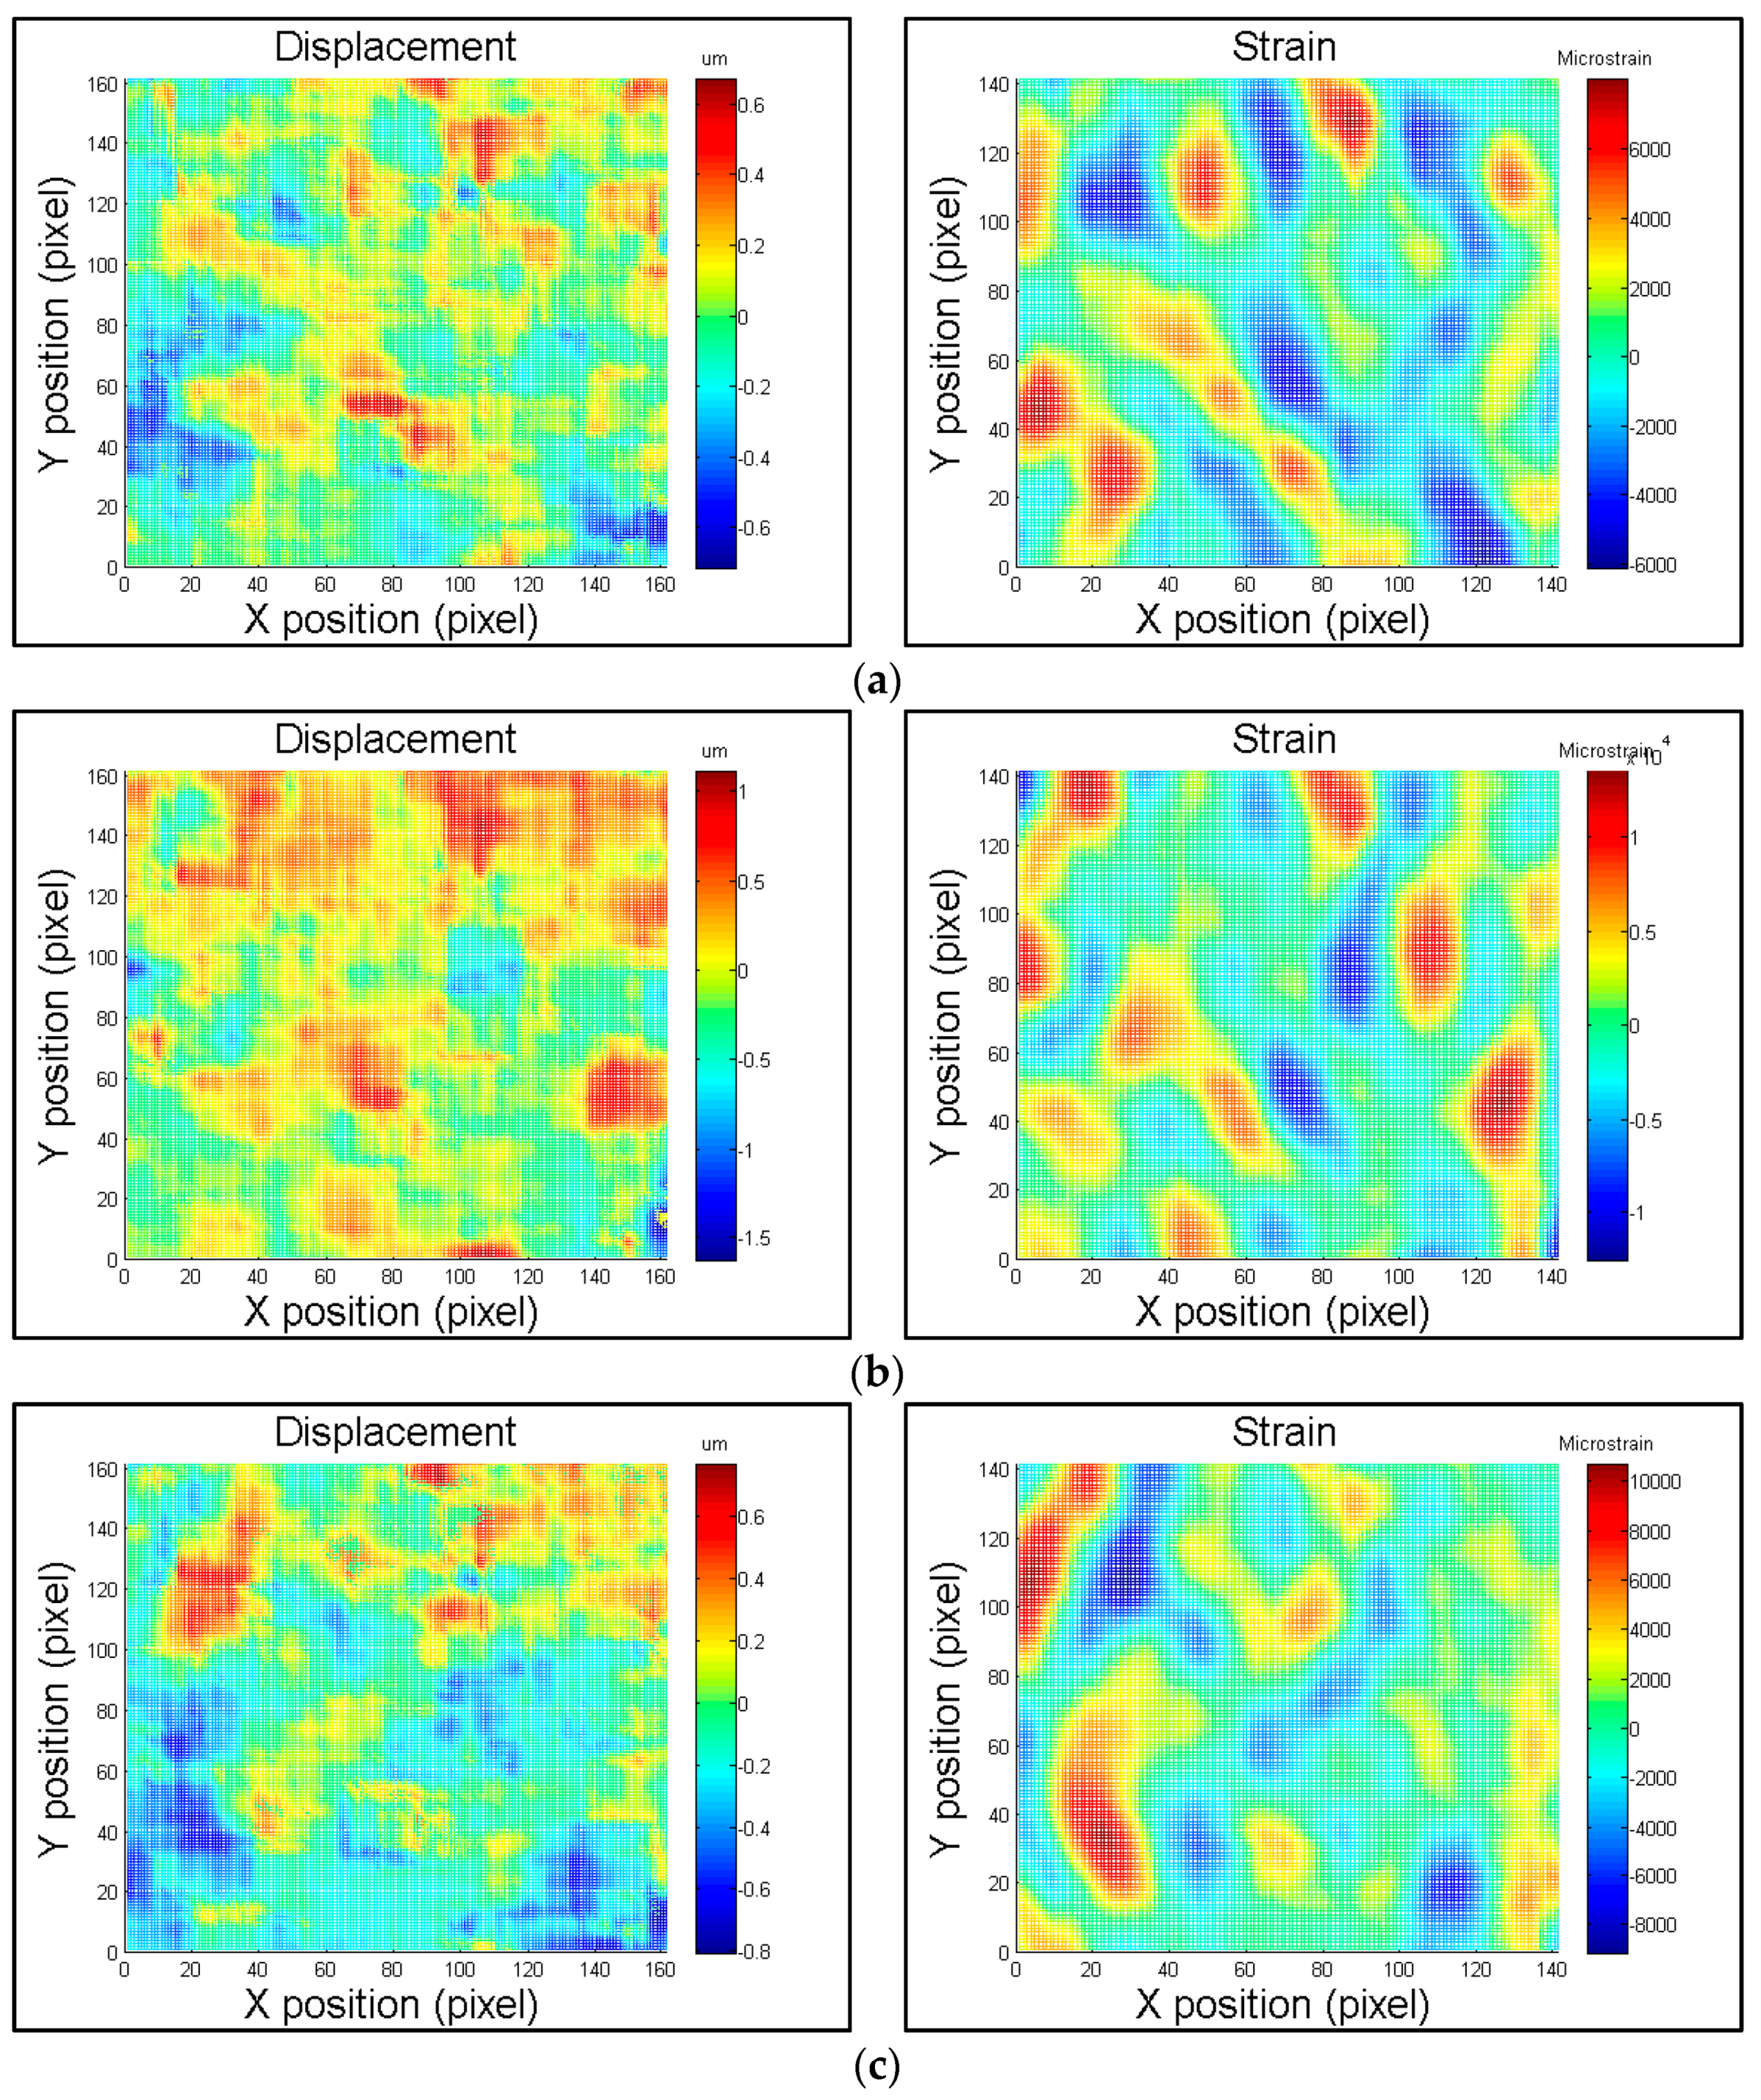
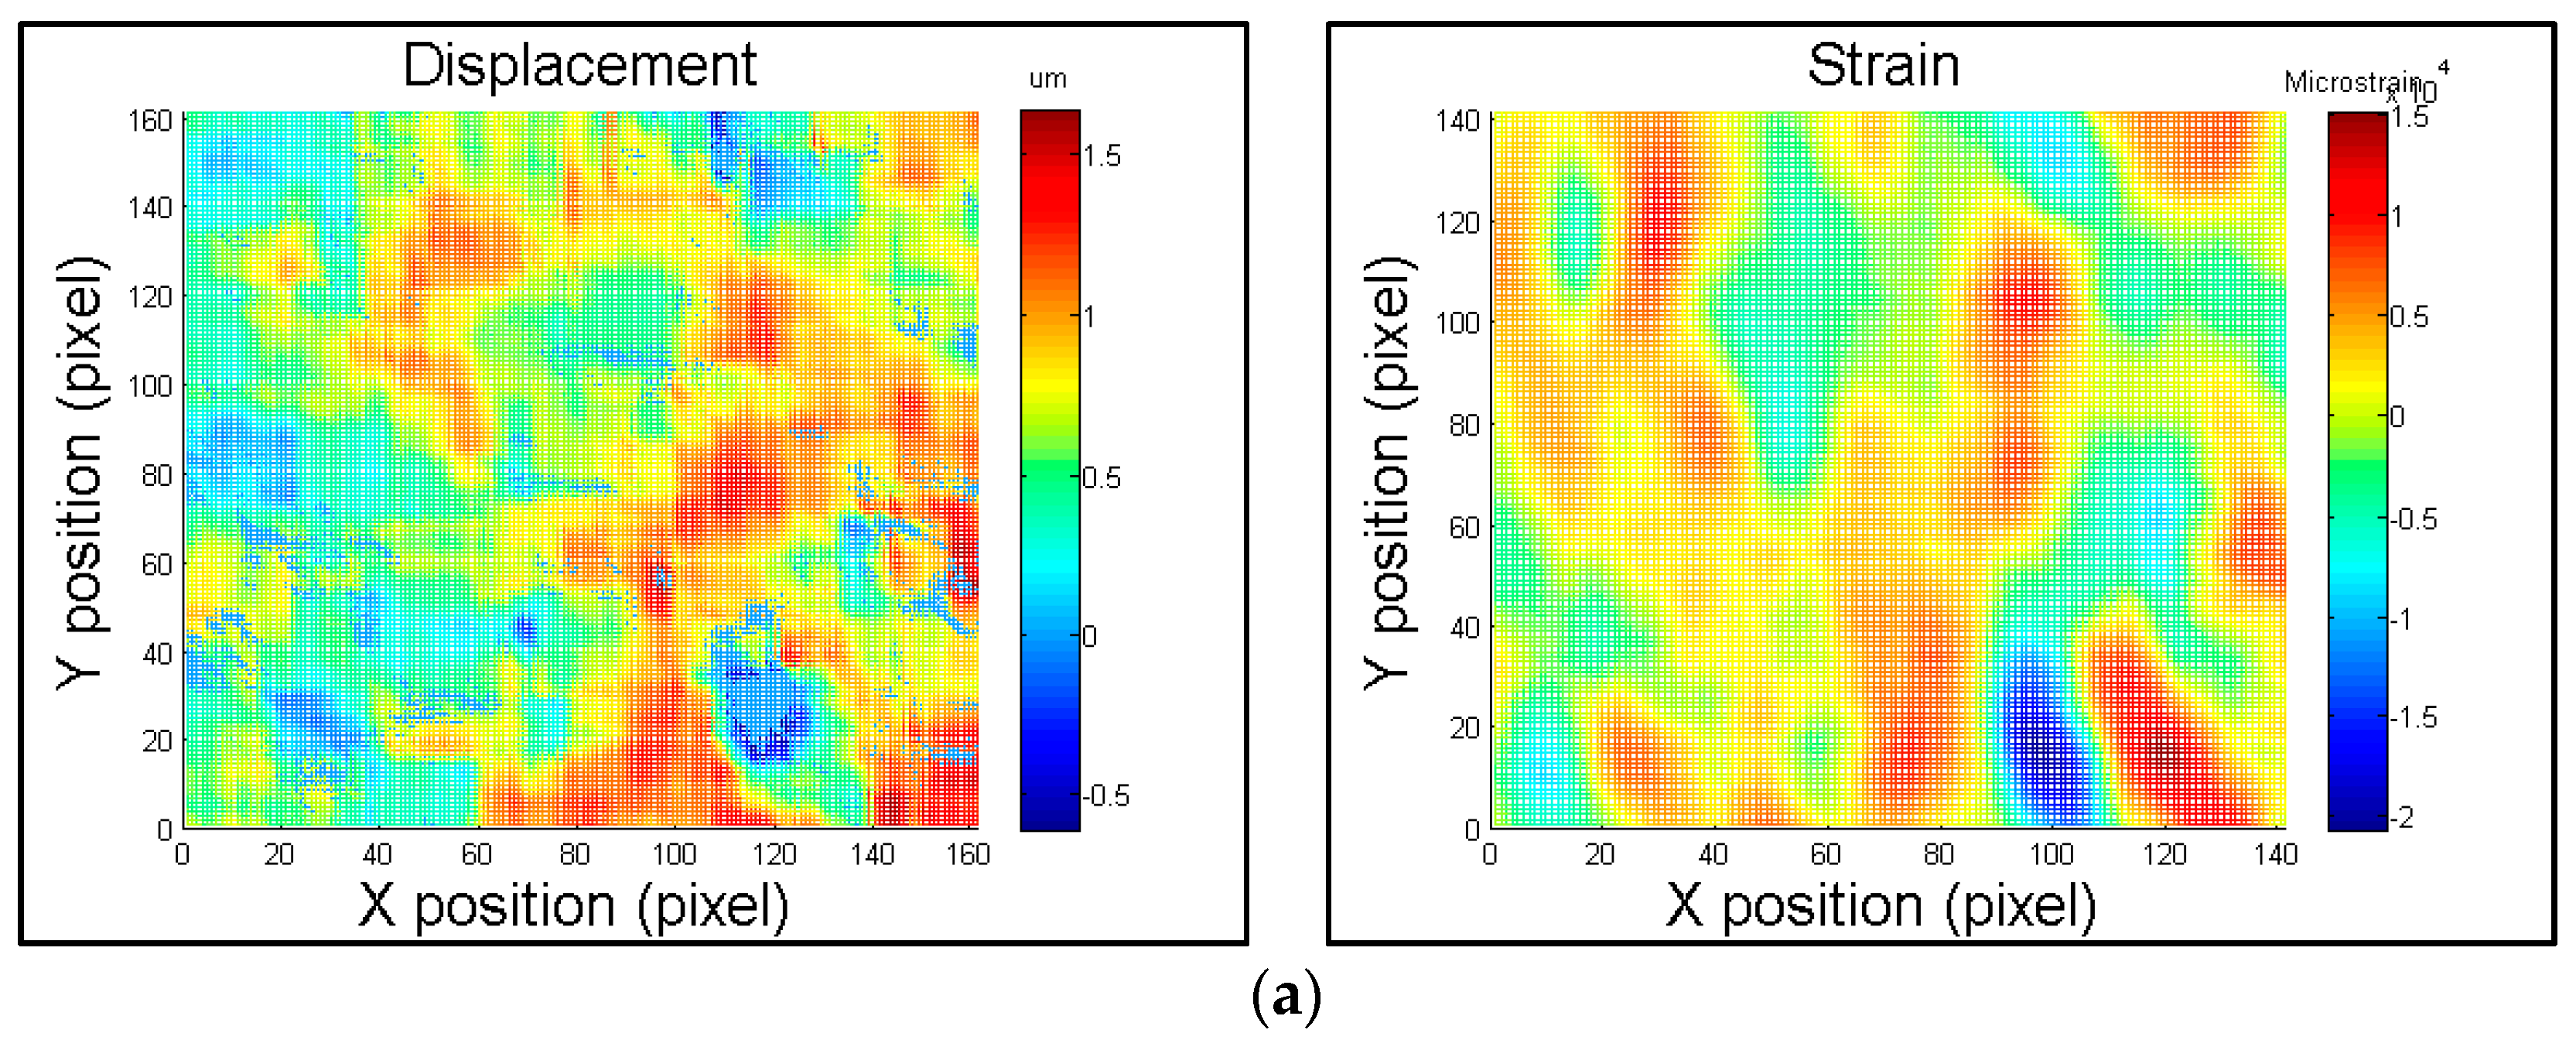
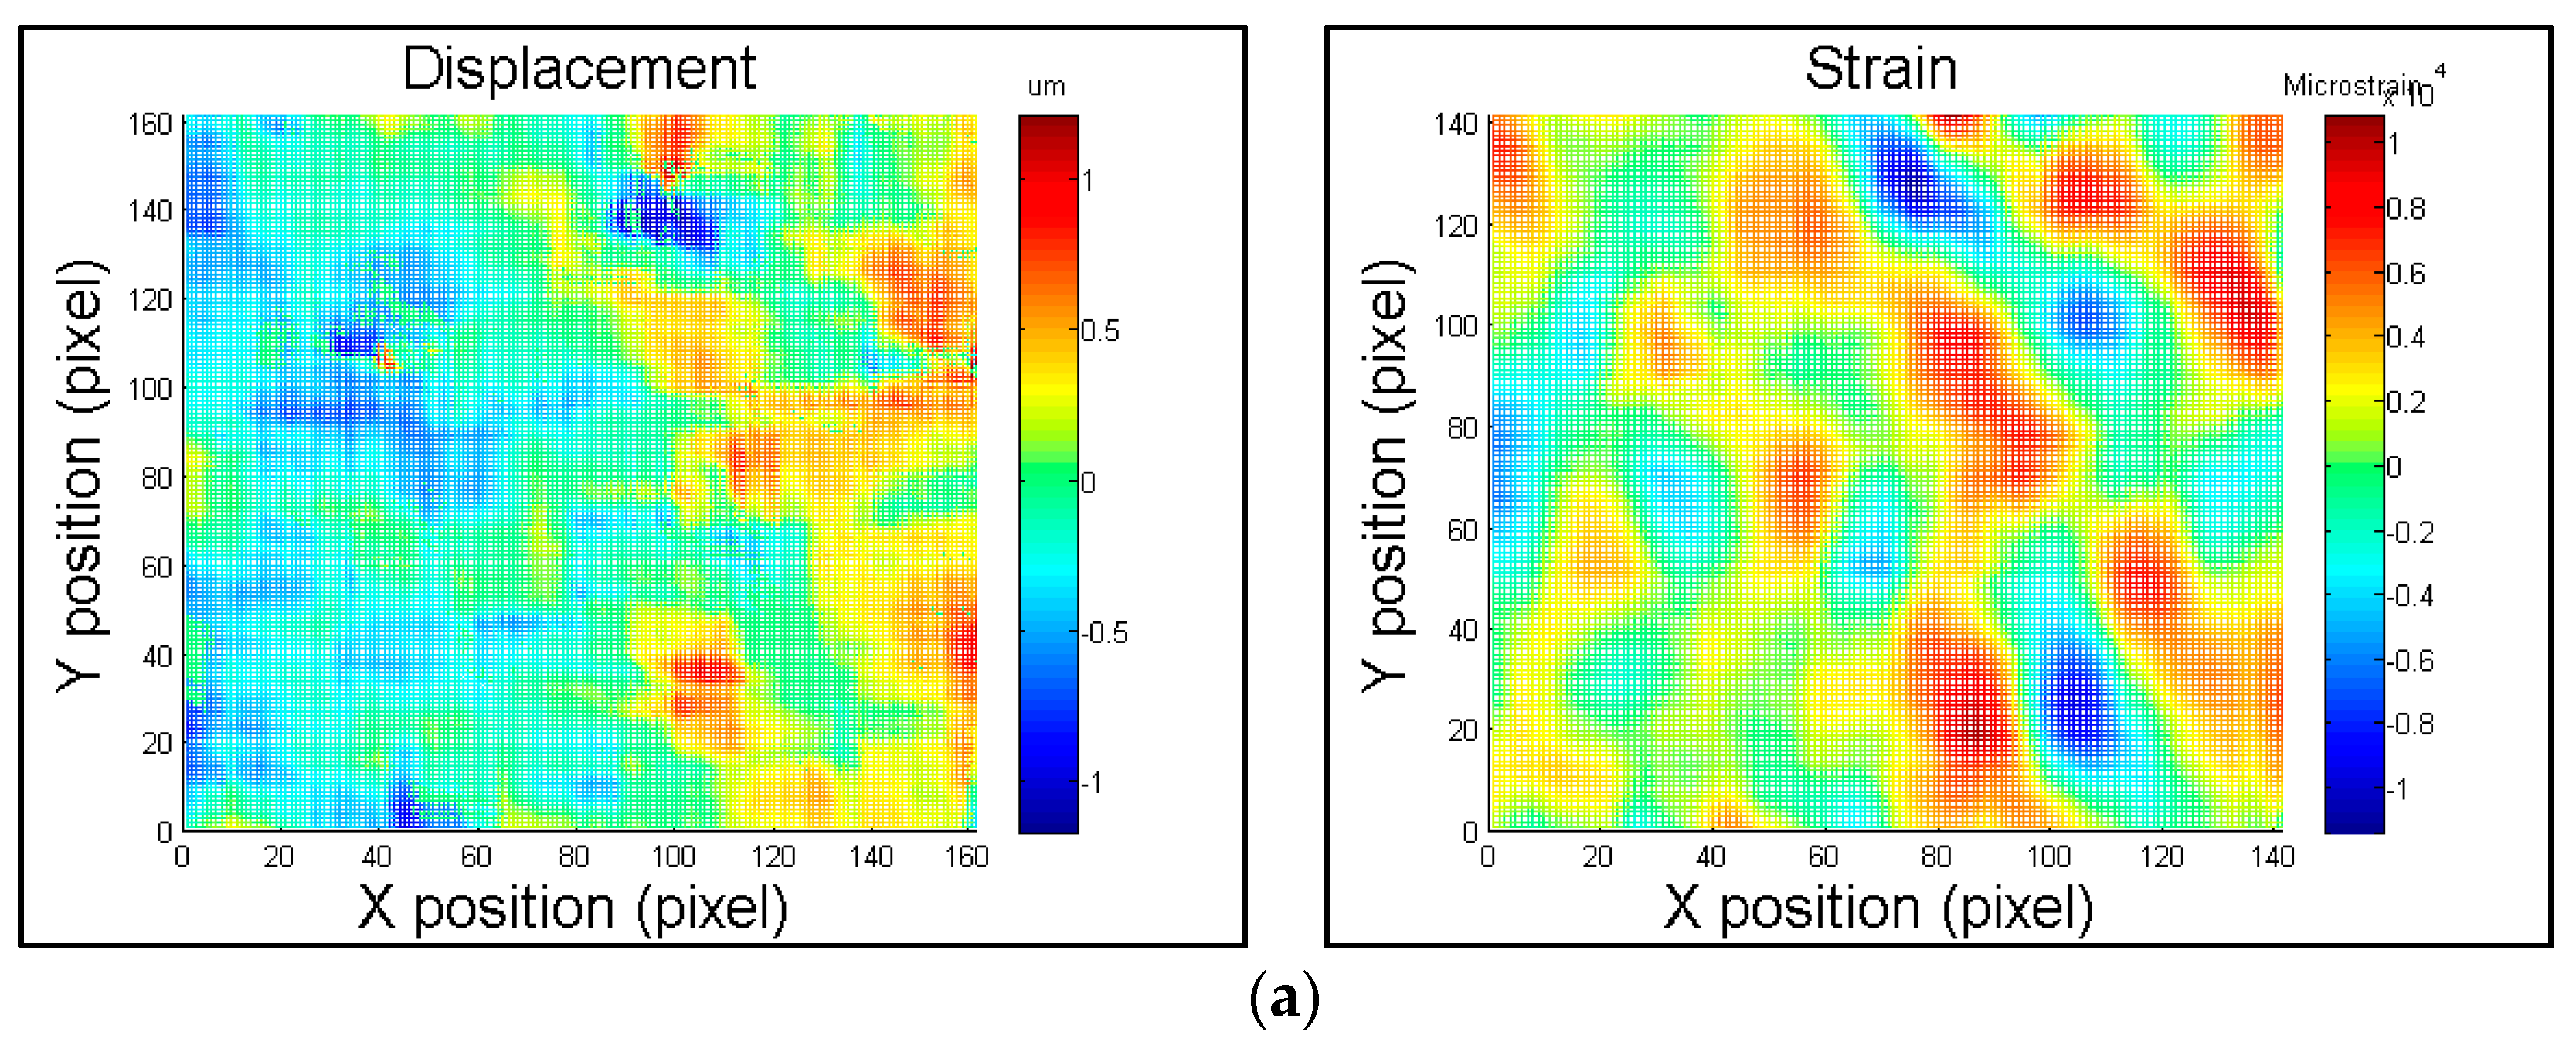
Processing the acquired images using a DIC program to obtain the desired displacement and strain information: the DIC program compares the grey-level intensity patterns of a matrix of pixels of the images before and after machining at the subpixel locations and establishes where the reference matrix has to be shifted from the first image to the second image to find the best matching pattern. Then, we implement a pointwise local least-squares method to estimate the strains from the displacement fields computed by the DIC method.
Figure 5, Figure 6, Figure 7, Figure 8, Figure 9 and Figure 10 show the displacement and strain fields in the x direction (along the side length) obtained by the correlation of two images for the residual stress of six different specimens. It is shown that the average released strain is the smallest for the specimen that was not prepared with four-point bending. Furthermore, the results for the other specimens exhibit higher average released strains owing to the induced residual stress produced by four-point bending. A higher average released strain is obtained for a specimen with a higher strain measured by the strain gauge. However, it is observed that released residual strain fields in the x direction are randomly distributed owing to the occurrence of a local out-of-plane displacement, resulting in the distortion in the reported displacements.
Figure 11, Figure 12 and Figure 13 show that the specimens with different strains have different average released strains for the same cutting depth. However, we find that the specimen with a strain of 7000 με had a higher average released strain than that of the specimen with a strain of 8000 με since the excessive stress levels in the metal may generate plastic deformation and result in less release of the elastic strain when the grooves were cut. Figure 14 shows the bending-moment–strain curve obtained by four-point bending. The loading force is very similar when the strain is between 7000 με and 8000 με. Figure 15 shows the simulated results using the ABAQUS finite element program; we conjecture that the residual stress versus the thickness of specimens during four-point bending is analogous for the strains of 7000 and 8000 με. Therefore, the outcome of the experimental investigation is in agreement with the simulation results.

4. Conclusions

This work presented a new method for identifying the residual strain in different specimens by WEDM combined with the ring-core method. The ring-core method was used to cut interior grooves for measuring the residual stresses and provided much larger surface strains. The WEDM technique has the potential to be the optimal cutting method for the grooves and was successfully applied in this work. We used four-point bending to create specimens with different residual stresses. The full-field in-plane deformation fields associated with the various residual stresses were measured by DIC. Al 5052 was employed as a reference sample to verify the feasibility and effectiveness of the proposed method. It was shown that the proposed method can be used to characterize the relieved strains after WEDM. The correlation between the residual stress and the residual strain will be investigated in the future.

Acknowledgments

The work was supported by the Ministry of Science and Technology, Taiwan, R.O.C. MOST 103-2221-E-027-135-MY2 and 103-2622-E-224-001-CC2.

Author Contributions

Chao-Ching Ho makes substantial contributions to conception and design, analysis and interpretation of data, and wrote the paper; Guan-Hong Lee performed the experiments and Shih-Kang Kuo designed simulation; Jin-Chen Hsu, Yuan-Jen Chang, Chia-Lung Kuo discussed the results and implications and commented on the manuscript at all stages.

Conflicts of Interest

The authors declare no conflict of interest.

References

  1. Stoilov, G.; Kavardzhikov, V.; Pashkouleva, D. A comparative study of random patterns for digital image correlation. J. Theor. Appl. Mech. 2012, 42, 55–66. [Google Scholar] [CrossRef]
  2. Lionello, G.; Cristofolini, L. A practical approach to optimizing the preparation of speckle patterns for digital-image correlation. Meas. Sci. Technol. 2014, 25, 107001. [Google Scholar] [CrossRef]
  3. Pan, B.; Qian, K.; Xie, H.; Asundi, A. Two-dimensional digital image correlation for in-plane displacement and strain measurement: A review. Meas. Sci. Technol. 2009, 20, 062001. [Google Scholar] [CrossRef]
  4. Keller, J.; Gollhardt, A.; Vogel, D.; Auerswald, E.; Sabate, N.; Auersperg, J.; Michel, B. FibDAC—Residual stress determination by combination of focused ion beam technique and digital image correlation. Mater. Sci. Forum 2006, 524–525, 121–126. [Google Scholar] [CrossRef]
  5. Winiarski, B.; Withers, P. Micron-scale residual stress measurement by micro-hole drilling and digital image correlation. Exp. Mech. 2012, 52, 417–428. [Google Scholar]
  6. Sabate, N.; Vogel, D.; Gollhardt, A.; Marcos, J.; Gràcia, I.; Cané1, C.; Michel, B. Digital image correlation of nanoscale deformation fields for local stress measurement in thin films. Nanotechnology 2006, 17, 5264. [Google Scholar] [CrossRef]
  7. Bing, P.; Hui-min, X.; Tao, H.; Asundi, A. Measurement of coefficient of thermal expansion of films using digital image correlation method. Polym. Test. 2009, 28, 75–83. [Google Scholar] [CrossRef]
  8. Valentini, E.; Benincasa, A.; Bertelli, L. An automatic system for measuring residual stresses by the ring-core method. In Proceedings of the 40th National Convention of the AIAS—Italian Stress Analysis Association, University of Palermo, Palermo, Italy, 7–10 September 2011.
Figure 1. Four-point bending setup and measurement using a strain gauge.
Inventions 01 00004 g001
Figure 2. (a) Schematic of the experimental setup; and (b) actual experimental setup.
Inventions 01 00004 g002
Figure 3. (a) Schematic and (b) photograph of the setup of the wire electrical discharging machine.
Inventions 01 00004 g003
Figure 4. Surface speckle images of the specimen; the area inside the blue rectangle is the calculation area.
Inventions 01 00004 g004
Figure 5. Displacement and strain fields in the x direction obtained from the specimen prepared without four-point bending. Average released strains of (a) 7.02 με for a cutting depth of 1 mm; (b) 86.64 με for a cutting depth of 2 mm; and (c) 54.05 με for a cutting depth of 3 mm.
Inventions 01 00004 g005
Figure 6. Displacement and strain fields in the x direction obtained from the specimen with a strain of 3150 με. Average released strains of (a) 457.33 με for a cutting depth of 1 mm; (b) 445.73 με for a cutting depth of 2 mm; and (c) 584.23 με for a cutting depth of 3 mm.
Inventions 01 00004 g006aInventions 01 00004 g006b
Figure 7. Displacement and strain fields in the x direction obtained from the specimen with a strain of 4450 με. Average released strains of (a) 659.35 με for a cutting depth of 1 mm; (b) 868.95 με for a cutting depth of 2 mm; and (c) 617.09 με for a cutting depth of 3 mm.
Inventions 01 00004 g007aInventions 01 00004 g007b
Figure 8. Displacement and strain fields in the x direction obtained from the specimen with a strain of 5750 με. Average released strains of (a) 731.17 με for a cutting depth of 1 mm; (b) 812.40 με for a cutting depth of 2 mm; and (c) 809.09 με for a cutting depth of 3 mm.
Inventions 01 00004 g008
Figure 9. Displacement and strain fields in the x direction obtained from the specimen with a strain of 7000 με. Average released strains of (a) 1240.0 με for a cutting depth of 1 mm; (b) 1349.0 με for a cutting depth of 2 mm; and (c) 1109.5 με for a cutting depth of 3 mm.
Inventions 01 00004 g009
Figure 10. Displacement and strain fields in the x direction obtained from the specimen with a strain of 8000 με. Average released strains of (a) 1035.7 με for a cutting depth of 1 mm; (b) 1184.3 με for a cutting depth of 2 mm; and (c) 1075.4 με for a cutting depth of 3 mm.
Inventions 01 00004 g010aInventions 01 00004 g010b
Figure 11. Specimens with different strains versus the average released strain for a cutting depth of 1 mm.
Inventions 01 00004 g011
Figure 12. Specimens with different strains versus the average released strain for a cutting depth of 2 mm.
Inventions 01 00004 g012
Figure 13. Specimens with different strains versus the average released strain for a cutting depth of 3 mm.
Inventions 01 00004 g013
Figure 14. Bending moment (in N·m) versus the strain during four-point bending.
Inventions 01 00004 g014
Figure 15. Residual stress (in MPa) versus the thickness of specimens stressed by four-point bending.
Inventions 01 00004 g015
Table 1. Parameters for wire electrical discharging machining.
ParameterValue
Discharge voltage50 V
Peak discharge current2.4 A
Pulse on Time30 µs
Pulse off Time20 µs
Dielectric liquidEDM oil

