Relevance of Reactive Fe:S Ratios for Sulfur Impacts on Arsenic Uptake by Rice


1
Stanford Synchrotron Radiation Lightsource, SLAC National Accelerator Laboratory, Menlo Park, CA 94025, USA
2
Department of Earth System Science, Stanford University, Stanford, CA 94305, USA
*
Author to whom correspondence should be addressed.
Soils 2017, 1(1), 1; https://doi.org/10.3390/soils1010001
Submission received: 12 June 2017
/
Revised: 12 July 2017
/
Accepted: 28 July 2017
/
Published: 9 August 2017
(This article belongs to the Special Issue Rhizosphere Processes)
Abstract
:Human arsenic exposure from rice consumption is a global concern. Due to the vast areas of naturally contaminated soils in rice-producing regions, the only possibility for reducing hazardous exposure is to prevent As uptake and translocation to rice grain. Sulfur inhibits As mobility both in soil and plant, indicating that soil S content may be a primary factor controlling As uptake; indeed, gypsum (CaSO4·H2O) has been proposed as a potential amendment. Here, we investigated S controls on rice As uptake within two naturally contaminated soils (15.4 and 11.0 mg As per kg soil, respectively) from Cambodia, by adding gypsum at two levels (20 and 60 mg per kg soil). We found that although gypsum initially decreased As release to soil solution, the concentrations then increased compared to the control treatment. Further, As concentrations in rice biomass were generally insignificantly affected by the gypsum treatments and trended in opposite directions between the two soils. Single and multivariate statistical tests indicated that Fe exerted stronger control on As uptake in rice than S and that the initial ratio of reactive Fe to sulfate-S had an overriding impact on As uptake in rice. However, in the soil with higher inherent sulfate content (91 mg SO42−-S per kg soil) the additional S provided by gypsum appeared to increase the ability of the rice plant to prevent As translocation to grain. We conclude that S may contribute to regulating grain As concentrations, but that the effect is highly dependent on S:Fe(As) ratios. Thus, at modest amendment rates, gypsum has limited potential for minimizing As concentration in rice when applied to naturally contaminated soil, particularly if the reactive Fe(III) content is high.
1. Introduction
Rice is the staple food for people in South and South-East Asia and may constitute over 70% of the total caloric intake in some areas [1]. Unfortunately, large portions of the most productive land in this region are also naturally contaminated with arsenic (As). Human exposure to As from drinking contaminated groundwater in these areas has been the subject of extensive research since the 1990s [2]. More recently, the attention has increasingly been drawn to the additional exposure pathway through rice consumption [3,4,5]. Rice is particularly receptive to As uptake due to the predominant paddy cultivation practice, which mobilizes As through microbially mediated reductive dissolution of As bearing Fe-oxides [6], and its dependence on silicon (Si) to build structure. Arsenic in its more reduced form, arsenite (as H3AsO3 at most soil pH values), acts as a silicic acid analogue and is taken up through the aquaporins in rice roots [7]. The more oxidized form of As, arsenate (As(V)), behaves similarly to phosphate and, therefore, is also taken up by plants through the phosphate transport channels [8,9,10,11].
Efforts have been undertaken to explain the variability in rice As uptake and grain concentration between cultivars, sites, soils, management practices, and amendments (see reviews by Zhao [12] and Sahoo [13]). Some of the variables that have been evaluated include Si [7,14,15], phosphorous (P) [8,9,10,11,16], rice genotype [17,18,19], iron (Fe) plaque formation [16,17,20,21,22], radial oxygen loss [22,23,24], and water management [15,25,26,27]. Sulfur (S) is another element that interacts strongly with As, especially under reducing conditions; the most reduced forms of S, such as sulfides and sulfhydryl groups (thiols), have a high affinity for binding As(III). In fact, it is this affinity that makes As(III) toxic, because it binds to vicinal sulfhydryl groups of proteins and destroys their structure [28]. Paradoxically, plants also utilize S in their defense against As toxicity through the formation of glutathiones and phytochelatins, which act as antioxidants and help retain As in vegetative parts by complex-formation [18,29,30,31,32,33,34,35]. Within soil, S can also mediate As solubility, and thus mobility, through precipitation with and/or adsorption onto sulfide minerals [36,37,38,39], and on sulfhydryl groups of particulate organic matter [40,41], if the redox conditions are favorable. Accordingly, sulfate-reducing conditions often favor As partitioning to the solid phase, [42,43], although the S:Fe and S:Fe:As ratios are critically important in determining whether dissolved concentrations of As are diminished [38,39].
The affinity of As for S has kindled the idea that the addition of S (e.g., as gypsum) may limit both As mobility in paddy soils and the translocation of As within rice, thereby decreasing the concentration in grain. Promising results have been obtained in hydroponic studies [34,44] and in pot/rhizobox experiments with soil/sand mixtures [45,46,47]. These studies have provided evidence for decreased uptake [47], decreased translocation [34,44,45,46], and increased Fe-plaque formation [45,46] with the addition of sulfur. However, only in one of these studies [47] was the rice grown without spiking the system with additional As, and in this case, the soil was impacted by mining and the ultimate effect on As content in rice grain was not evaluated. In fact, only one study (using soil/sand mixture) determined As content in rice grain [45].
Thus, gypsum appears to be a possible amendment with the potential to limit both the As uptake into the rice plant, by stimulating sulfate reduction, and the translocation to rice grain, by stimulating plant production of S containing compounds that help retain As in vegetative biomass. However, the impact of sulfate amendment within naturally contaminated paddy soils needs to be assessed. In particular, the effect on the final As concentrations in the rice grain need to be confirmed. To this end, we conducted a pot trial with rice grown to maturity in two naturally As-contaminated paddy soils from the Upper Mekong Delta of Cambodia. We investigated the influence of S addition on As mobility from the solid phase to solution to the roots and eventually into the above ground biomass (shoots and grain) in order to decipher regulating mechanisms.
2. Materials and Methods
2.1. Soil
Soil (~25 kg) was taken from the top 10 cm of two paddy fields in the Leuk Daek and Kien Svay districts, respectively, Kandal Province, Cambodia (SI, Table S1). The soils contained 15.4 and 11.0 mg As per kg soil, respectively, which is within the range of natural As contamination levels reported for paddy soils from this region [48,49] (also SI, Table S2). The S content of the soils (330 and 363 mg per kg soil, respectively) represents the high end of the distribution for paddy soils within this region (disregarding acid sulfate soils, see SI, Table S2) and matches that of other paddy soils used in pot trials [47,50]. We intentionally chose soils with a high (but not extreme) total S content in order to avoid an S deficiency effect in the control treatment, as the aim was to examine the effect of adding excess S. Soil was air dried and disaggregated to <4 cm aggregate size before transporting to Stanford University, where it was stored in room temperature in the dark until the start of the experiment. No further grinding or sieving of the soil was performed on soil used for rice growing. Characterization of the soil properties was done on sieved (2 mm) sub-samples following standard procedures (see SI, Table S1).
2.2. Soil and Planting Preparation
Plastic pots (2 L) were filled with 1300 g of soil each and equipped with a 10 cm Rhizon® FLEX sampler (Rhizosphere Research Products, Wageningen, Netherlands), inserted at a 45° angle across the center of the pot, to allow for sampling of soil solution during the course of the experiment. The pots were flooded with artificial pond water (pH 6.8, alkalinity 69 mg/L, conductivity 130 µS/cm, cations (mmol/L): Ca2+ (0.5), NH4+(0.02), K+ (0.05), Mg2+ (0.12), Na+ (0.25) and anions (mmol/L): NO3− (0.02), Cl− (0.029), SiO42− (0.06)), approximately matching surface water chemistry in the area as reported by Kocar et al. (2008) [51]. We prepared triplicate pots for each of the treatments: control (Ctrl, no S), G20 (20 mg S per pot or 0.48 mmol/kg soil), corresponding to recommended S fertilization [52]) and G60 (60 S mg per pot or 1.4 mmol/kg soil), S treatment used in previous studies [45]). Sulfur was added as an 8 mM gypsum (CaSO4·2H2O) solution. All pots were fertilized with N, P, and K added as 10 mL 0.214 M NH4NO3 and 10 mL 0.048 M KH2PO4 per pot at the beginning of the experiment and another 10 mL of 0.214 M NH4NO3 nine weeks into the experiment. The fertilization level matches the low-end N and P fertilizer recommendations from the International Rice Research Institute (IRRI) [52]. After flooding, the pots were left to settle over night and thereafter four rice seedlings (Oryza sativa L. ssp. japonica) were transplanted into each pot, distributed evenly and at about equidistance (2–3 cm) from the edge and the center of the pots. The rice seeds (obtained from Kitizawa Seed Co., Oakland, CA, USA) had been surface sterilized in 70% ethanol for 15 min, rinsed three times in milli-Q water and then left to sprout submerged in milli-Q water (changed daily) for one week prior to planting.
The rice plants in one pot from the G20 treatment of the Kien Svay soil died after a few weeks and this pot was removed from the experiment, leaving only 2 replicates for this treatment.
2.3. Plant-Growth and Sampling
The pots were randomly placed in a growth chamber with a 12 h day/12 h night cycle. The temperature varied between 25 °C and 28 °C between day and night. The pots were watered every 2–3 days with deionized (DI) water to maintain the water level at 3–5 cm above the soil surface at all times.
The soil solution was sampled every 2–4 weeks (in total 7 occasions). First 2–3 mL of solution was extracted by syringe and used for measuring pH. Then 5–15 mL was extracted using pre-evacuated and anaerobically sealed 25 mL serum vials, attached via a luer lock needle assembly to the rhizon sampler tube. The serum vials were immediately transferred to a glove bag (95% N2/5% H2 atmosphere), where they were opened and 6 mL of each sample was transferred and acidified with 120 µL concentrated nitric acid (trace metal grade) for analysis of total As, Fe and S concentrations by inductively coupled plasma optical emission spectroscopy (ICP-OES, iCAP6000, Thermo Scientific, Cambridge, UK).
2.4. Harvest and Post-Trial Ppreparations
The rice was grown to grain maturity, 22 weeks after planting, and then harvested by cutting the ear just above the top leaf and thereafter the straw 4–5 cm above the soil surface. The aboveground plant parts were immediately dried at 65 °C for 3–5 days. Biomass calculations for grain, straw, and roots were averaged per plant for each pot, before averaging within treatments.
Root and soil samples were obtained using the following procedure:
- The standing water was decanted
- The soil/root mass was lifted out and put into a larger tub for root cleaning
- A 10–15 g soil sample was immediately taken from the middle of the soil/root lump with a spatula and put in a 20 mL plastic scintillation vial, flash-frozen in liquid nitrogen, quickly transferred to a freeze-dryer chamber and freeze-dried under vacuum for 3–5 days. The samples were stored in the dark at room temperature in a glove bag (95% N2/5% H2 atmosphere).
- The root mass was carefully loosened from the soil and thoroughly cleaned with several liters of DI water in the tub until the rinsing water was free from soil particles.
The first 3 steps (until freeze-drying) were done within minutes of decanting to minimize changes in the redox environment from air exposure.
Iron plaque analyses were carried out on roots from one pot each of the control and G60 treatments for both soils (no plaque analysis was conducted on roots from the G20 treatment). These roots were cut into four subsamples, weighed and two subsamples were immediately dried as indicated above and used for total root content analyses. The other two subsamples were treated according to the cold DCB extraction of iron plaque described in Liu et al. (2004) [16]: 60 min incubation at 25 °C in 80 mL of dithionate-citrate-bicarbonate (DCB) solution (0.03 M sodium citrate, 0.125 M sodium bicarbonate, 2.78 g sodium dithionate), rinsed three times in DI water, blotted dry and oven-dried like the other plant parts. The DCB solution and rinsing water was collected, made up to 100 mL and analyzed for As and Fe concentrations with ICP-OES.
2.5. Analytical Procedures
The rice grain was separated from the husks manually. All plant parts were weighed to record biomass production (husks and grain were weighed together), ground in a steel mill equipped with a 2 mm mesh and digested (in duplicate) in 70% nitric acid (trace metal grade) using a CEM MarsXpress™ microwave digester (CEM, Matthews, NC, USA). The digests were diluted 1:5 with ultrapure DI water and analyzed for total As, Fe and S concentrations with ICP-OES. The differences between duplicate digests of the same sample were <3%.
The post-harvest soil samples were ground to a fine, homogeneous powder with a mortar and pestle inside the glove bag. Thereafter, 20 mg of soil was taken out from each of the samples from the pot triplicates and combined into one composite sample. For As speciation 30 mg of the composite sample was mixed with 60 mg boron nitride in a ball mill, pressed into a pellet (0.7 cm diameter) and analyzed by As K-edge X-ray absorption near-edge structure (XANES) spectroscopy at beam line 11-2 at the Stanford Synchrotron Radiation Light source (SSRL). For S speciation a thin homogeneous layer of the composite sample was spread over S free tape and analyzed with S K-edge XANES at beam line 4-3 at SSRL. For operational details on the XANES measurements, see SI. XANES data was normalized in Athena (iXAFS 2 (2.2), IFEFFIT 1.2.11c) and fit with the linear combinations of the model spectra specified in the SI (Table S3). For As, the linear combination fitting function in Athena was used. Sulfur spectra were fit by the LINEST-function in Microsoft® Excel, using internally calibrated spectra of model compounds as described in Almkvist et al. (2010) [53].
2.6. Statistical Analyses and Data Treatment
Pairwise comparisons of means by Welch’s unequal variances t-test were used to determine significant differences between treatments in R Studio, version 0.98.1103. The level of confidence was set to 0.05. Root biomass was only analyzed in one or two pots per treatment and the roots from individual plants could not be separated from each other; thus no statistical error could be calculated and no treatment differences were analyzed for root biomass. Bivariate regression analyses were used to determine correlations between pairs of variables for elemental concentrations in biomass (As, S and Fe) and in soil solution (As, S, Fe, P and Si), as well as pH in the soil solution. These regression analyses were performed in R Studio, version 0.98.1103. Multivariate Partial Least Squares (PLS) regressions were performed using SIMCA® (version 13.0.3.0, Umetrics™, MKA Data Analytics).
3. Results
3.1. Biomass and As Uptake
Biomass production for roots, shoots, and grain was similar for both soils, but did not respond consistently to the gypsum treatments (Figure 1). Although differences were not significant, except for straw biomass in the G60 treatment in the Kien Svay soil, the tendency was towards negative impact of gypsum on straw and grain biomass production in the Leuk Daek soil and positive impact in the Kien Svay soil.
Arsenic concentrations were highest in roots and declined by one order of magnitude from roots to straw and again from straw to grain and husks (Figure 2). As was the case for biomass, the soils differed in response of As concentrations in rice, with Leuk Daek tending towards lower biomass As concentrations with gypsum and Kien Svay towards higher biomass As concentrations with gypsum amendment, except for in grain from the G20 treatment. This contrasting response between the soils was also reflected in the total biomass uptake of As (SI, Figure S1).
Gypsum decreased the amount of iron plaque forming on the roots, with plaque extractions containing less Fe and As in the G60 than in the control treatment for both soils (Table 1).
3.2. Soil Solution
Arsenic concentrations in porewater declined initially, then increased and either plateaued or decreased again towards the end of the experiment (Figure 3). Iron concentrations closely followed the temporal pattern of As. However, the concentrations of Fe were higher in the Kien Svay soil than in the Leuk Daek soil, whereas for As the relationship was reversed (higher in Leuk Daek). Consistent with As and Fe, S concentrations also dropped initially, but then remained low throughout the experiment. In the Leuk Daek soil, the sulfate amendment resulted in delayed As and Fe dissolution, with lower concentrations than the control initially and then higher towards the end of the experiment (SI, Figure S2). In the Kien Svay soil, this process appeared to be faster, and as a result the As concentrations in gypsum amended pots were not as elevated and Fe concentrations were lower compared to the control pots in week 21. Pore water pH and concentrations of other elements are shown in SI, Figure S3. In general, Si concentrations dropped and remained low, with no consistent effect of gypsum treatment or apparent differences between the two soils. Phosphorous behaved similarly to As, except concentrations were higher in Kien Svay pots than in Leuk Daek pots. Concentrations of Mn were higher in the Leuk Daek soil initially, but continuously decreased and finally reached similar concentrations to those of the Kien Svay soil, which remained relatively low and stable throughout the experiment. The porewater pH of both soils increased initially and then decreased again but always remained within the range of 6.5–7.2 for all pots.
3.3. Soil As and S Speciation
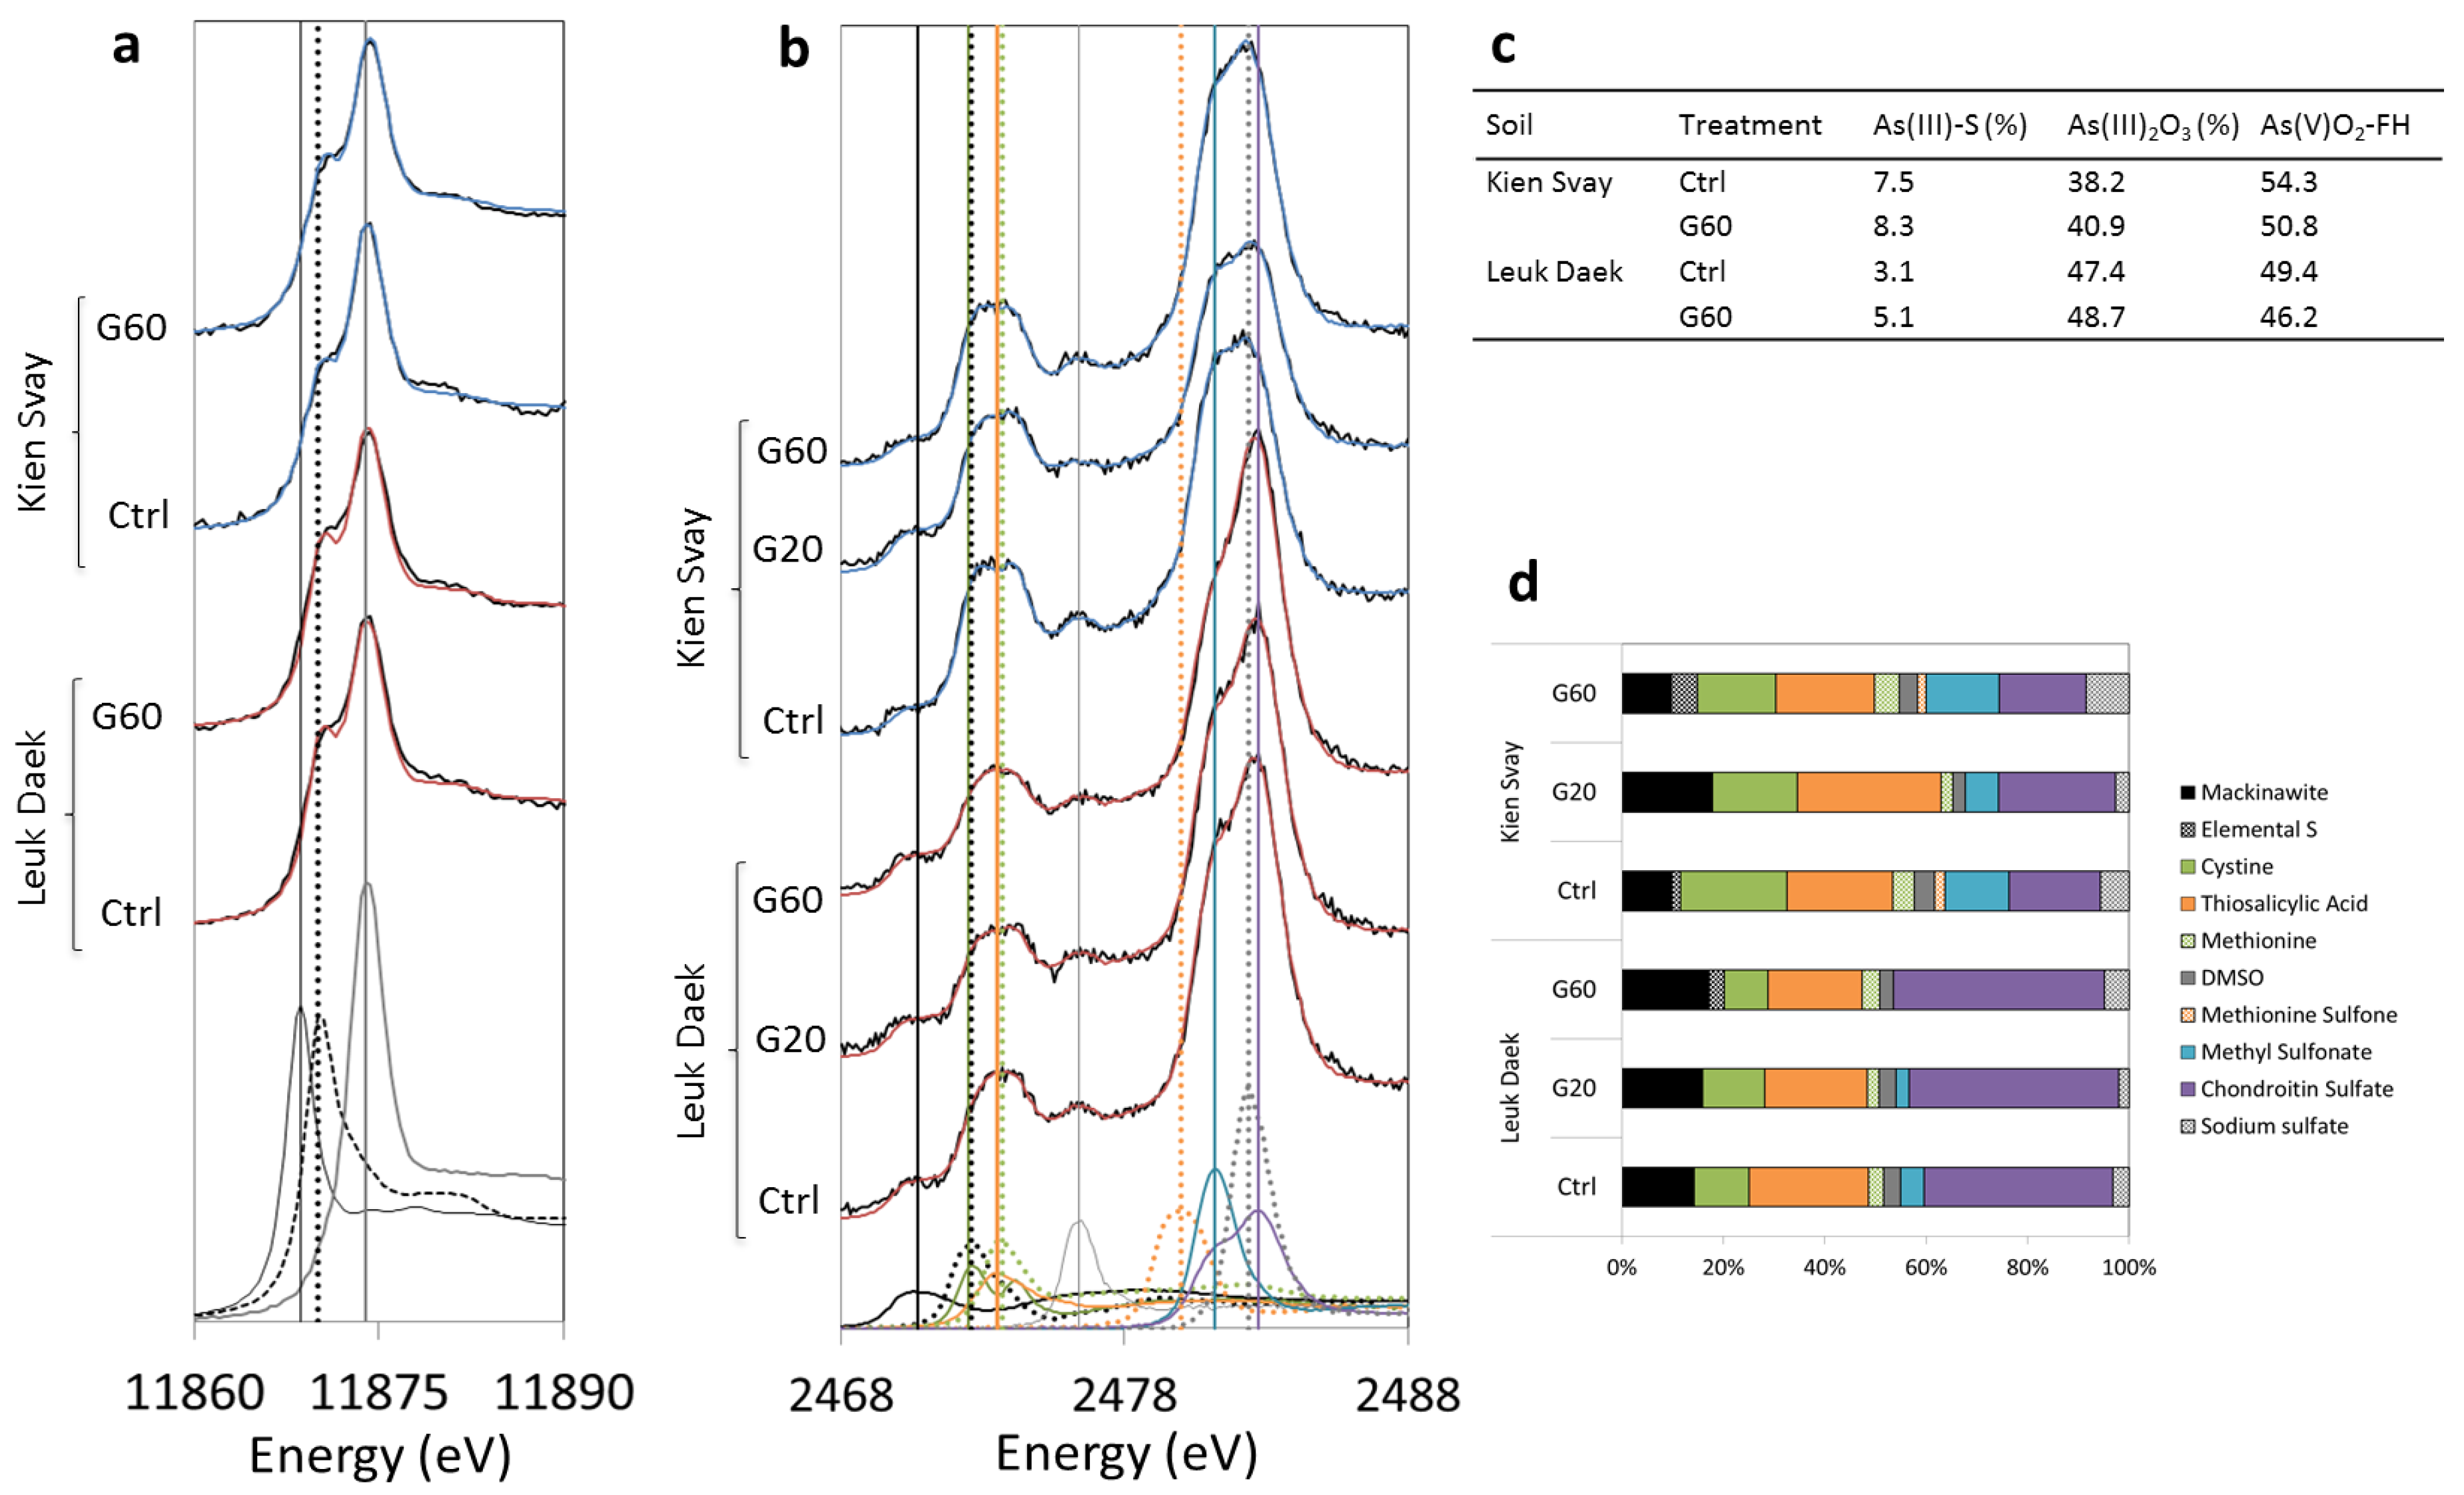
Gypsum addition did not have a strong effect on the bulk As speciation in the soil solid phase, as evidenced by XANES spectroscopic analyses of Ctrl and G60 pots (Figure 4a). In both soils, there was a subtle increase in As-S species and a slight shift towards more As(III) with gypsum, but the contribution from As-S interactions were always < 10% and the distribution between As(III) and As(V) was close to 50% (Figure 4c). Sulfur XANES analyses show that the proportion of reduced inorganic sulfur species (mackinawite (FeS) and elemental S) increased with gypsum addition in both soils, although in Kien Svay the low gypsum produced more reduced S than the high gypsum treatment (Figure 4b,d).
4. Discussion
We did not observe a substantial effect of gypsum addition on either the dissolved concentrations or rice uptake of As. Moreover, to the extent an impact was detected, it trended in opposite direction for the two soils. These results are inconsistent with previously reported effectiveness of S additions in limiting As uptake from hydroponic and As-spiked sand/soil systems [44,45,46,54]. It is possible that the sulfate levels applied in this study were insufficient to profoundly impact the As mobility from soil to grain, although in Hu et al. (2007) [46] a smaller (30 mg kg−1) sulfate addition did decrease As content in rice shoots. We intentionally selected soils that should be S sufficient for rice, in order to specifically study the effect of adding excess sulfate. Our initial sulfate concentrations without gypsum addition (91 ± 4 and 61 ± 1 mg per kg soil for Leuk Daek and Kien Svay, respectively) were well above the recommended limit for S deficiency of 9 mg sulfate/kg soil [55], but final straw S (0.05–0.13%) was close to or below the suggested deficiency limit (<0.10% in shoots) [55]. However, there was no correlation between straw S concentrations and straw or grain biomass production, and no symptoms of S deficiency were observed in any of the treatments (including the controls). Therefore, the S status within the rice plants should have been sufficient to activate the plant thiol metabolism involved in As detoxification in all treatments, and, if S status was indeed limiting this plant defense mechanism, one would expect the soil with lowest initial sulfate concentrations (Kien Svay) to respond most positively to the treatment. Instead, gypsum tended to increase rice As uptake from Kien Svay soil. Thus, the limited and divergent response in rice As concentrations to gypsum amendment within these two naturally contaminated soils must be attributed to soil processes overriding the potential for sulfate to regulate As uptake at the levels tested here. Below we discuss what underlying processes may have contributed to this.
As a first measure to unravel the processes that controlled final As concentrations in rice grain in this study, we used both bivariate correlation analyses and a multivariate statistical approach, partial least squares (PLS) regression. The power of PLS is that it takes into account the variation from all measured explanatory (X) variables in all individual pots and identifies the ones with the strongest influence on the dependent (Y) variable(s) (in this case the grain As concentration). Therefore, it provides a more complete picture of the relative contribution from different variables in complex systems than pair-wise regression analyses. Consequently, it is not surprising that only a few of the bivariate correlations were significant, but those that were support the results of the PLS analyses (SI, Table S1). The PLS model of the entire data set (SI, Figure S5) returned only one significant component, explaining 55% of the variability in grain As concentrations (R2VY = 0.55), with a predictive power of 35% (Q2VY = 0.35). In this model, it was evident that Fe was a stronger regulator of As grain concentrations than S, which was confirmed by negative bivariate correlations of As in biomass to Fe porewater concentrations (SI, Tables S4 and S5). This may seem surprising at first, especially as Fe and As dissolution co-occurred and higher As concentrations induced higher As uptake (all significant bivariate correlations between As in porewater and biomass were positive, SI Tables S4 and S5), as expected. However, Fe supplementation is known to decrease As uptake by and toxicity to rice [56]. Higher Fe concentrations in bulk solution could also increase plaque formation on the roots, which may act as a barrier for As uptake [57,58], although there is evidence for the reverse effect as well [58,59]. However, root Fe concentration correlated positively with both root (R2 = 0.58, p = 0.01) and grain (R2 = 0.43, p = 0.04) As concentrations, contradicting that Fe plaque contributed to the Fe control on As uptake in this experiment. In fact, it is possible that the gypsum treatment was ineffective partly because it decreased the formation of Fe plaque in these soils (Table 1). Previous studies have shown both increased [45,46] and decreased [60,61] plaque with S additions, possibly dependent on the amount of S added [60]. Thus, we hypothesize that the indicated importance of Fe for As concentration in rice grain, in fact, provides an explanation for the limited impact of S on As uptake in this study. Divergent outcomes of S-As interactions during redox transformations can be explained by variability in Fe:S(As) ratios [38,39]. At higher Fe:S ratios, sulfide produced by sulfate reduction may be consumed by Fe(III) reduction, resulting in HS− concentrations below the limit for As(Fe)S precipitation. The two soils used in this experiment contained large stocks of reactive Fe(III) (oxalate-extractable Fe, SI Table S1), which appears to have rendered the initial sulfate concentrations (ranging from 1.4 in Kien Svay Ctrl to 3.35 mM in the Leuk Daek G60 treatment) insufficient to generate a substantial increase in As(Fe)-sulfide solids (Figure 4c). Instead, as indicated by the S XANES data (Figure 4d), Fe reduction scavenged sulfide from the solution, both through abiotic Fe(III) reaction with sulfide generating Fe(II) and elemental S, and through precipitation of FeS after microbial reductive dissolution of Fe(III) to Fe(II). The control of Fe on S solubility, but not on As, is consistent with the Fe:S molar ratios in soil solution that reached steady-state (ranging between 15 and 23) around week 15 of the experiment in all treatments, whereas the As:S and As:Fe molar ratios continued to increase throughout the experiment (SI Figure S4).
To test the hypothesis that initial reactive Fe(III):SO42—S molar ratio was an important contributing factor for the results in this study, we examined the correlations between these ratios and total biomass uptake of Fe, S, and As (mol per pot). These tests revealed strong negative linear relationships between initial Fe:S ratios and the total S (R2 = 0.88, p = 0.0056, N = 6) and As (R2 = 0.91, p = 0.0031, N = 6) contents in biomass. However, there was no correlation of Fe:S ratios to biomass Fe or to grain As concentrations (only to total As in biomass). This strongly supports that the high reactive Fe content of these soils limited S solubility and that rice plants were taking up any soluble S that was available. It further shows that total As uptake by rice was, in fact, higher with a lower Fe:S ratio, but that the translocation to rice grain was not impacted in the same way. This supports that As solubility was not controlled by Fe or S in these soils, as discussed above, although released by the same process as Fe (microbial reductive dissolution), which is reflected in the apparent correlation to Fe:S ratio. However, once inside the plant, the As translocation to rice grain was controlled by other factors.
It is possible that the ratios of reactive Fe, S, and As also hold the explanation for the divergent behavior of the two soils. The PLS analysis showed a stronger separation of the soils than of the treatments (SI, Figure S5c), indicating that different processes controlled the As concentration in rice grain within these two soils. Fe and As dissolution patterns diverged between the soils (Figure 3, SI Figures S3 and S4), both in terms of relative concentrations and temporal patterns, and this is consistent with the oxalate extractable As being higher in Leuk Daek and Fe in Kien Svay. Thus, it is possible that Leuk Daek pots responded positively to gypsum amendment due to the higher inherent sulfate concentration of this soil, which, together with lower reactive Fe, may have decreased the Fe:S ratios sufficiently for gypsum to affect As solubility. Additionally, with sulfate concentrations remaining sufficient over a longer period of time in this soil, the rice plants may have been able to maintain a higher production of thiols and other S-containing compounds that retain As in roots. These speculations were supported by a PLS analysis of the data set for Leuk Daek pots only. This produced a model with three significant components explaining 99% of the variability in grain As concentrations and a predictive power of 81% (SI, Figure S6). Contrastingly, the PLS analysis for Kien Svay pots produced no significant components, meaning that our data could not predict or explain the variability in grain As concentrations for rice grown in this soil with any confidence. However, the PLS model for Leuk Daek (SI, Figure S6b) clearly showed that increasing biomass S and greater proportions of As-S and reduced S among the solid phase species all contributed to lower As concentrations in grain, in spite of the small variation for these variables among the treatments. Thus, the PLS models provide support for Fe:S:As ratios being important for controlling As mobility in rice paddy systems, and for S having the potential to moderate As translocation to the rice grain, if the S supply is sufficient.
5. Conclusions
In this study, limited impacts of gypsum amendment on As uptake in grain were observed, contrasting the results of previous studies in hydroponics and high As soils, thus suggesting that, in naturally contaminated soils of the Mekong Delta, gypsum may not be an efficient mitigation method. Using multivariate statistical analyses, we identify Fe as an important regulator of rice As concentrations in this experiment, and determine that the inefficiency of sulfate amendment here was likely due to the high proportions of reactive Fe(III) and As in the soils. We also find evidence of S processes contributing to the regulation of As concentrations in rice grain, suggesting that a higher gypsum addition may have been able to mitigate rice As uptake. Thus, we conclude that the relative ratios of reactive Fe:S and proportion of reactive As in soils are critical regulators of the solubility of these elements over time, which in turn affects plant uptake with implications for the toxicity and translocation of As in rice plants; both Fe and S have the potential to mitigate As concentrations in rice grain. We propose that future research should establish if there are critical threshold Fe:S:As ratios that can be established and used to predict As uptake in rice and whether manipulations of these ratios is a potential mitigation strategy for limiting As concentrations in rice grain.
Supplementary Materials
Supplementary information (Tables S1–S5, Figures S1–S6) are available online at https://www.mdpi.com/2411-5126/1/1/1/s1.
Acknowledgments
We are grateful to Michael V. Schaefer, Dina Kuy, and Nuon Phen for field sampling assistance and to Resource Development International, Cambodia for laboratory access. We also thank Guangchao Li, Douglas Turner, Shikha Avancha, and Lilia Barragan for laboratory assistance. As and S XANES analyses were performed at SSRL beam lines 11-2 and 4-3, through proposal no 3984. This work was funded in part by the Swedish Foundation for International Cooperation in Research and Higher Education. K. Boye was supported in part by the Marcus and Amalia Wallenberg Foundation, Sweden, and in part by the US Department of Energy (DOE) Office of Science, Office of Biological and Environmental Research (BER), through the SLAC National Accelerator Laboratory scientific focus area (SFA) (Contract No. DE-AC02-76SF00515). Work by S. Fendorf was supported by the US DOE BER Terrestrial Ecosystem program (Award Number DE-FG02-13ER65542).
Author Contributions
K.B. conceived, designed, and performed the experiments with support from S.F. K.B. and J.L.-P. analyzed the data. K.B. wrote the paper with input from S.F.
Conflicts of Interest
The authors declare no conflict of interest.
References
- FAOSTAT. Food and Agriculture Organization of the United Nations. Available online: http://faostat3.fao.org/home/E (accessed on 3 February 2015).
- Fendorf, S.; Michael, H.A.; van Geen, A. Spatial and Temporal Variations of Groundwater Arsenic in South and Southeast Asia. Science 2010, 328, 1123–1127. [Google Scholar] [CrossRef] [PubMed]
- Meharg, A.A.; Rahman, M.M. Arsenic Contamination of Bangladesh Paddy Field Soils: Implications for Rice Contribution to Arsenic Consumption. Environ. Sci. Technol. 2003, 37, 229–234. [Google Scholar] [CrossRef] [PubMed]
- Meharg, A.A.; Williams, P.N.; Adomako, E.; Lawgali, Y.Y.; Deacon, C.; Villada, A.; Cambell, R.C.J.; Sun, G.; Zhu, Y.-G.; Feldmann, J.; Raab, A.; Zhao, F.-J.; Islam, R.; Hossain, S.; Yanai, J. Geographical Variation in Total and Inorganic Arsenic Content of Polished (White) Rice. Environ. Sci. Technol. 2009, 43, 1612–1617. [Google Scholar] [CrossRef] [PubMed]
- Williams, P.N.; Price, A.H.; Raab, A.; Hossain, S.A.; Feldmann, J.; Meharg, A.A. Variation in Arsenic Speciation and Concentration in Paddy Rice Related to Dietary Exposure. Environ. Sci. Technol. 2005, 39, 5531–5540. [Google Scholar] [CrossRef] [PubMed]
- Takahashi, Y.; Minamikawa, R.; Hattori, K.H.; Kurishima, K.; Kihou, N.; Yuita, K. Arsenic Behavior in Paddy Fields during the Cycle of Flooded and Non-flooded Periods. Environ. Sci. Technol. 2004, 38, 1038–1044. [Google Scholar] [CrossRef] [PubMed]
- Ma, J.F.; Yamaji, N.; Mitani, N.; Xu, X.-Y.; Su, Y.-H.; McGrath, S.P.; Zhao, F.-J. Transporters of arsenite in rice and their role in arsenic accumulation in rice grain. Proc. Natl. Acad. Sci. USA 2008, 105, 9931–9935. [Google Scholar] [CrossRef] [PubMed]
- Abedin, M.J.; Feldmann, J.; Meharg, A.A. Uptake Kinetics of Arsenic Species in Rice Plants. Plant Physiol. 2002, 128, 1120–1128. [Google Scholar] [CrossRef] [PubMed]
- Wang, J.; Zhao, F.-J.; Meharg, A.A.; Raab, A.; Feldmann, J.; McGrath, S.P. Mechanisms of Arsenic Hyperaccumulation in Pteris vittata. Uptake Kinetics, Interactions with Phosphate, and Arsenic Speciation. Plant Physiol. 2002, 130, 1552–1561. [Google Scholar] [CrossRef] [PubMed]
- Vetterlein, D.; Szegedi, K.; Ackermann, J.; Mattusch, J.; Neue, H.-U.; Tanneberg, H.; Jahn, R. Competitive Mobilization of Phosphate and Arsenate Associated with Goethite by Root Activity. J. Environ. Qual. 2007, 36, 1811–1820. [Google Scholar] [CrossRef] [PubMed]
- Catarecha, P.; Segura, M.D.; Franco-Zorrilla, J.M.; García-Ponce, B.; Lanza, M.; Solano, R.; Paz-Ares, J.; Leyva, A. A mutant of the Arabidopsis phosphate transporter PHT1;1 displays enhanced arsenic accumulation. Plant Cell 2007, 19, 1123–1133. [Google Scholar] [CrossRef] [PubMed]
- Zhao, F.-J.; McGrath, S.P.; Meharg, A.A. Arsenic as a food chain contaminant: mechanisms of plant uptake and metabolism and mitigation strategies. Annu. Rev. Plant Biol. 2010, 61, 535–559. [Google Scholar] [CrossRef] [PubMed]
- Sahoo, P.K.; Kim, K. A review of the arsenic concentration in paddy rice from the perspective of geoscience. Geosci. J. 2013, 17, 107–122. [Google Scholar] [CrossRef]
- Seyfferth, A.L.; Fendorf, S. Silicate Mineral Impacts on the Uptake and Storage of Arsenic and Plant Nutrients in Rice (Oryza sativa L.). Environ. Sci. Technol. 2012, 46, 13176–13183. [Google Scholar] [CrossRef] [PubMed]
- Zia, Z.; Bakhat, H.F.; Saqib, Z.A.; Shah, G.M.; Fahad, S.; Ashraf, M.R.; Hammad, H.M.; Naseem, W.; Shahid, M. Effect of water management and silicon on germination, growth, phosphorus and arsenic uptake in rice. Ecotoxicol. Environ. Saf. 2017, 144, 11–18. [Google Scholar] [CrossRef] [PubMed]
- Liu, W.-J.; Zhu, Y.-G.; Smith, F.A.; Smith, S.E. Do phosphorus nutrition and iron plaque alter arsenate (As) uptake by rice seedlings in hydroponic culture? New Phytol. 2004, 162, 481–488. [Google Scholar] [CrossRef]
- Liu, W.-J.; Zhu, Y.-G.; Smith, F.A.; Smith, S.E. Do iron plaque and genotypes affect arsenate uptake and translocation by rice seedlings (Oryza sativa L.) grown in solution culture? J. Exp. Bot. 2004, 55, 1707–1713. [Google Scholar] [CrossRef] [PubMed]
- Rai, A.; Tripathi, P.; Dwivedi, S.; Dubey, S.; Shri, M.; Kumar, S.; Tripathi, P.K.; Dave, R.; Kumar, A.; Singh, R.; Adhikari, B.; Bag, M.; Tripathi, R.D.; Trivedi, P.K.; Chakrabarty, D.; Tuli, R. Arsenic tolerances in rice (Oryza sativa) have a predominant role in transcriptional regulation of a set of genes including sulphur assimilation pathway and antioxidant system. Chemosphere 2011, 82, 986–995. [Google Scholar] [CrossRef] [PubMed]
- Dwivedi, S.; Tripathi, R.D.; Tripathi, P.; Kumar, A.; Dave, R.; Mishra, S.; Singh, R.; Sharma, D.; Rai, U.N.; Chakrabarty, D.; Trivedi, P.K.; Adhikari, B.; Bag, M.K.; Dhankher, O.P.; Tuli, R. Arsenate exposure affects amino acids, mineral nutrient status and antioxidants in rice (Oryza sativa L.) genotypes. Environ. Sci. Technol. 2010, 44, 9542–9549. [Google Scholar] [CrossRef] [PubMed]
- Yamaguchi, N.; Ohkura, T.; Takahashi, Y.; Maejima, Y.; Arao, T. Arsenic distribution and speciation near rice roots influenced by iron plaques and redox conditions of the soil matrix. Environ. Sci. Technol. 2014, 48, 1549–1556. [Google Scholar] [CrossRef] [PubMed]
- Deng, D.; Wu, S.-C.; Wu, F.-Y.; Deng, H.; Wong, M.-H. Effects of root anatomy and Fe plaque on arsenic uptake by rice seedlings grown in solution culture. Environ. Pollut. Barking Essex 1987 2010, 158, 2589–2595. [Google Scholar] [CrossRef] [PubMed]
- Wu, C.; Ye, Z.; Li, H.; Wu, S.; Deng, D.; Zhu, Y.; Wong, M. Do radial oxygen loss and external aeration affect iron plaque formation and arsenic accumulation and speciation in rice? J. Exp. Bot. 2012, 63, 2961–2970. [Google Scholar] [CrossRef] [PubMed]
- Mei, X.Q.; Wong, M.H.; Yang, Y.; Dong, H.Y.; Qiu, R.L.; Ye, Z.H. The effects of radial oxygen loss on arsenic tolerance and uptake in rice and on its rhizosphere. Environ. Pollut. Barking Essex 1987 2012, 165, 109–117. [Google Scholar] [CrossRef] [PubMed]
- Bravin, M.N.; Travassac, F.; Floch, M.L.; Hinsinger, P.; Garnier, J.-M. Oxygen input controls the spatial and temporal dynamics of arsenic at the surface of a flooded paddy soil and in the rhizosphere of lowland rice (Oryza sativa L.): A microcosm study. Plant Soil 2008, 312, 207–218. [Google Scholar] [CrossRef]
- Li, R.Y.; Stroud, J.L.; Ma, J.F.; McGrath, S.P.; Zhao, F.J. Mitigation of arsenic accumulation in rice with water management and silicon fertilization. Environ. Sci. Technol. 2009, 43, 3778–3783. [Google Scholar] [CrossRef] [PubMed]
- Talukder, A.S.M.H.M.; Meisner, C.A.; Sarkar, M.A.R.; Islam, M.S.; Sayre, K.D.; Duxbury, J.M.; Lauren, J.G. Effect of water management, arsenic and phosphorus levels on rice in a high-arsenic soil–water system: II. Arsenic uptake. Ecotoxicol. Environ. Saf. 2012, 80, 145–151. [Google Scholar] [CrossRef] [PubMed]
- Hu, P.; Huang, J.; Ouyang, Y.; Wu, L.; Song, J.; Wang, S.; Li, Z.; Han, C.; Zhou, L.; Huang, Y.; Luo, Y.; Christie, P. Water management affects arsenic and cadmium accumulation in different rice cultivars. Environ. Geochem. Health 2013, 35, 767–778. [Google Scholar] [CrossRef] [PubMed]
- Hughes, M.F. Arsenic toxicity and potential mechanisms of action. Toxicol. Lett. 2002, 133, 1–16. [Google Scholar] [CrossRef]
- Finnegan, P.M.; Chen, W. Arsenic Toxicity: The Effects on Plant Metabolism. Front. Physiol. 2012, 3. [Google Scholar] [CrossRef] [PubMed]
- Gupta, D.K.; Srivastava, S.; Huang, H.G.; Romero-Puertas, M.C.; Sandalio, L.M. Arsenic Tolerance and Detoxification Mechanisms in Plants. In Detoxification of Heavy Metals; Sherameti, I., Varma, A., Eds.; Springer: Berlin/Heidelberg, Germany, 2011; pp. 169–179. ISBN 978-3-642-21407-3, 978-3-642-21408-0. [Google Scholar]
- Norton, G.J.; Lou-Hing, D.E.; Meharg, A.A.; Price, A.H. Rice–arsenate interactions in hydroponics: whole genome transcriptional analysis. J. Exp. Bot. 2008, 59, 2267–2276. [Google Scholar] [CrossRef] [PubMed]
- Schmöger, M.E.V.; Oven, M.; Grill, E. Detoxification of Arsenic by Phytochelatins in Plants. Plant Physiol. 2000, 122, 793–802. [Google Scholar] [CrossRef] [PubMed]
- Dave, R.; Singh, P.K.; Tripathi, P.; Shri, M.; Dixit, G.; Dwivedi, S.; Chakrabarty, D.; Trivedi, P.K.; Sharma, Y.K.; Dhankher, O.P.; Corpas, F.J.; Barroso, J.B.; Tripathi, R.D. Arsenite Tolerance is Related to Proportional Thiolic Metabolite Synthesis in Rice (Oryza sativa L.). Arch. Environ. Contam. Toxicol. 2013, 64, 235–242. [Google Scholar] [CrossRef] [PubMed]
- Dixit, G.; Singh, A.P.; Kumar, A.; Mishra, S.; Dwivedi, S.; Kumar, S.; Trivedi, P.K.; Pandey, V.; Tripathi, R.D. Reduced arsenic accumulation in rice (Oryza sativa L.) shoot involves sulfur mediated improved thiol metabolism, antioxidant system and altered arsenic transporters. Plant Physiol. Biochem. 2016, 99, 86–96. [Google Scholar] [CrossRef] [PubMed]
- Srivastava, S.; Akkarakaran, J.J.; Sounderajan, S.; Shrivastava, M.; Suprasanna, P. Arsenic toxicity in rice (Oryza sativa L.) is influenced by sulfur supply: Impact on the expression of transporters and thiol metabolism. Geoderma 2016, 270, 33–42. [Google Scholar] [CrossRef]
- Burton, E.D.; Johnston, S.G.; Kocar, B.D. Arsenic Mobility during Flooding of Contaminated Soil: The Effect of Microbial Sulfate Reduction. Environ. Sci. Technol. 2014, 48, 13660–13667. [Google Scholar] [CrossRef] [PubMed]
- Couture, R.-M.; Rose, J.; Kumar, N.; Mitchell, K.; Wallschläger, D.; Van Cappellen, P. Sorption of Arsenite, Arsenate, and Thioarsenates to Iron Oxides and Iron Sulfides: A Kinetic and Spectroscopic Investigation. Environ. Sci. Technol. 2013, 47, 5652–5659. [Google Scholar] [CrossRef] [PubMed]
- Kocar, B.D.; Borch, T.; Fendorf, S. Arsenic repartitioning during biogenic sulfidization and transformation of ferrihydrite. Geochim. Cosmochim. Acta 2010, 74, 980–994. [Google Scholar] [CrossRef]
- O’Day, P.A.; Vlassopoulos, D.; Root, R.; Rivera, N. The influence of sulfur and iron on dissolved arsenic concentrations in the shallow subsurface under changing redox conditions. Proc. Natl. Acad. Sci. USA 2004, 101, 13703–13708. [Google Scholar] [CrossRef] [PubMed]
- Hoffmann, M.; Mikutta, C.; Kretzschmar, R. Arsenite Binding to Sulfhydryl Groups in the Absence and Presence of Ferrihydrite: A Model Study. Environ. Sci. Technol. 2014, 48, 3822–3831. [Google Scholar] [CrossRef] [PubMed]
- Langner, P.; Mikutta, C.; Kretzschmar, R. Arsenic sequestration by organic sulphur in peat. Nat. Geosci. 2012, 5, 66–73. [Google Scholar] [CrossRef]
- Buschmann, J.; Berg, M. Impact of sulfate reduction on the scale of arsenic contamination in groundwater of the Mekong, Bengal and Red River deltas. Appl. Geochem. 2009, 24, 1278–1286. [Google Scholar] [CrossRef]
- Lowers, H.A.; Breit, G.N.; Foster, A.L.; Whitney, J.; Yount, J.; Uddin, M.N.; Muneem, A.A. Arsenic incorporation into authigenic pyrite, Bengal Basin sediment, Bangladesh. Geochim. Cosmochim. Acta 2007, 71, 19. [Google Scholar] [CrossRef]
- Zhang, J.; Zhao, Q.-Z.; Duan, G.-L.; Huang, Y.-C. Influence of sulphur on arsenic accumulation and metabolism in rice seedlings. Environ. Exp. Bot. 2011, 72, 34–40. [Google Scholar] [CrossRef]
- Fan, J.; Xia, X.; Hu, Z.; Ziadi, N.; Liu, C. Excessive sulfur supply reduces arsenic accumulation in brown rice. Plant Soil Environ. 2013, 59, 169–174. [Google Scholar]
- Hu, Z.-Y.; Zhu, Y.-G.; Li, M.; Zhang, L.-G.; Cao, Z.-H.; Smith, F.A. Sulfur (S)-induced enhancement of iron plaque formation in the rhizosphere reduces arsenic accumulation in rice (Oryza sativa L.) seedlings. Environ. Pollut. 2007, 147, 387–393. [Google Scholar] [CrossRef] [PubMed]
- Jia, Y.; Bao, P.; Zhu, Y.-G. Arsenic bioavailability to rice plant in paddy soil: influence of microbial sulfate reduction. J. Soils Sediments 2015, 15, 1960–1967. [Google Scholar] [CrossRef]
- Berg, M.; Stengel, C.; Pham, T.K.T.; Pham, H.V.; Sampson, M.L.; Leng, M.; Samreth, S.; Fredericks, D. Magnitude of arsenic pollution in the Mekong and Red River Deltas--Cambodia and Vietnam. Sci. Total Environ. 2007, 372, 413–425. [Google Scholar] [CrossRef] [PubMed]
- Seyfferth, A.L.; McCurdy, S.; Schaefer, M.V.; Fendorf, S. Arsenic Concentrations in Paddy Soil and Rice and Health Implications for Major Rice-Growing Regions of Cambodia. Environ. Sci. Technol. 2014, 48, 4699–4706. [Google Scholar] [CrossRef] [PubMed]
- Zhou, W.; He, P.; Li, S.; Lin, B. Mineralization of organic sulfur in paddy soils under flooded conditions and its availability to plants. Geoderma 2005, 125, 85–93. [Google Scholar] [CrossRef]
- Kocar, B.D.; Polizzotto, M.L.; Benner, S.G.; Ying, S.C.; Ung, M.; Ouch, K.; Samreth, S.; Suy, B.; Phan, K.; Sampson, M.; Fendorf, S. Integrated biogeochemical and hydrologic processes driving arsenic release from shallow sediments to groundwaters of the Mekong delta. Arsen. Groundw. South-East Asia Emphas. Cambodia Vietnam 2008, 23, 3059–3071. [Google Scholar] [CrossRef]
- IRRI International Rice Research Institute. Available online: http://irri.org (accessed on 13 May 2013).
- Almkvist, G.; Boye, K.; Persson, I. K-edge XANES analysis of sulfur compounds: an investigation of the relative intensities using internal calibration. J. Synchrotron Radiat. 2010, 17, 683–688. [Google Scholar] [CrossRef] [PubMed]
- Zhang, Z.; Moon, H.S.; Myneni, S.C.B.; Jaffé, P.R. Effect of dissimilatory iron and sulfate reduction on arsenic dynamics in the wetland rhizosphere and its bioaccumulation in wetland plants (Scirpus actus). J. Hazard. Mater. 2017, 321, 382–389. [Google Scholar] [CrossRef] [PubMed]
- Dobermann, A.; Fairhurst, T.H. Rice: Nutrient Disorders & Nutrient Management; Potash & Phosphate Institute, Potash & Phosphate Institute of Canada, International Rice Research Institute, Oxford Graphic Printers Pte Ltd.: Oxford, UK, 2000; Volume 1. [Google Scholar]
- Nath, S.; Panda, P.; Mishra, S.; Dey, M.; Choudhury, S.; Sahoo, L.; Panda, S.K. Arsenic stress in rice: Redox consequences and regulation by iron. Plant Physiol. Biochem. 2014, 80, 203–210. [Google Scholar] [CrossRef] [PubMed]
- Hossain, M.B.; Jahiruddin, M.; Loeppert, R.H.; Panaullah, G.M.; Islam, M.R.; Duxbury, J.M. The effects of iron plaque and phosphorus on yield and arsenic accumulation in rice. Plant Soil 2008, 317, 167–176. [Google Scholar] [CrossRef]
- Chen, Z.; Zhu, Y.-G.; Liu, W.-J.; Meharg, A.A. Direct evidence showing the effect of root surface iron plaque on arsenite and arsenate uptake into rice (Oryza sativa) roots. New Phytol. 2005, 165, 91–97. [Google Scholar] [CrossRef] [PubMed]
- Seyfferth, A.L.; Webb, S.M.; Andrews, J.C.; Fendorf, S. Arsenic Localization, Speciation, and Co-Occurrence with Iron on Rice (Oryza sativa L.) Roots Having Variable Fe Coatings. Environ. Sci. Technol. 2010, 44, 8108–8113. [Google Scholar] [CrossRef] [PubMed]
- Yang, J.; Liu, Z.; Wan, X.; Zheng, G.; Yang, J.; Zhang, H.; Guo, L.; Wang, X.; Zhou, X.; Guo, Q.; Xu, R.; Zhou, G.; Peters, M.; Zhu, G.; Wei, R.; Tian, L.; Han, X. Interaction between sulfur and lead in toxicity, iron plaque formation and lead accumulation in rice plant. Ecotoxicol. Environ. Saf. 2016, 128, 206–212. [Google Scholar] [CrossRef] [PubMed]
- Wu, C.Y.H.; Lu, J.; Hu, Z.Y. Influence of Sulfur Supply on the Iron Accumulation in Rice Plants. Commun. Soil Sci. Plant Anal. 2014, 45, 1149–1161. [Google Scholar] [CrossRef]
Figure 1.
Biomass production (g per plant) for the two soils. Error bars denote standard deviation from the mean (N = 3, except for Kien Svay G20: N = 2). Root values are from 1 to 2 pots per treatment and no error was calculated.
Figure 1.
Biomass production (g per plant) for the two soils. Error bars denote standard deviation from the mean (N = 3, except for Kien Svay G20: N = 2). Root values are from 1 to 2 pots per treatment and no error was calculated.
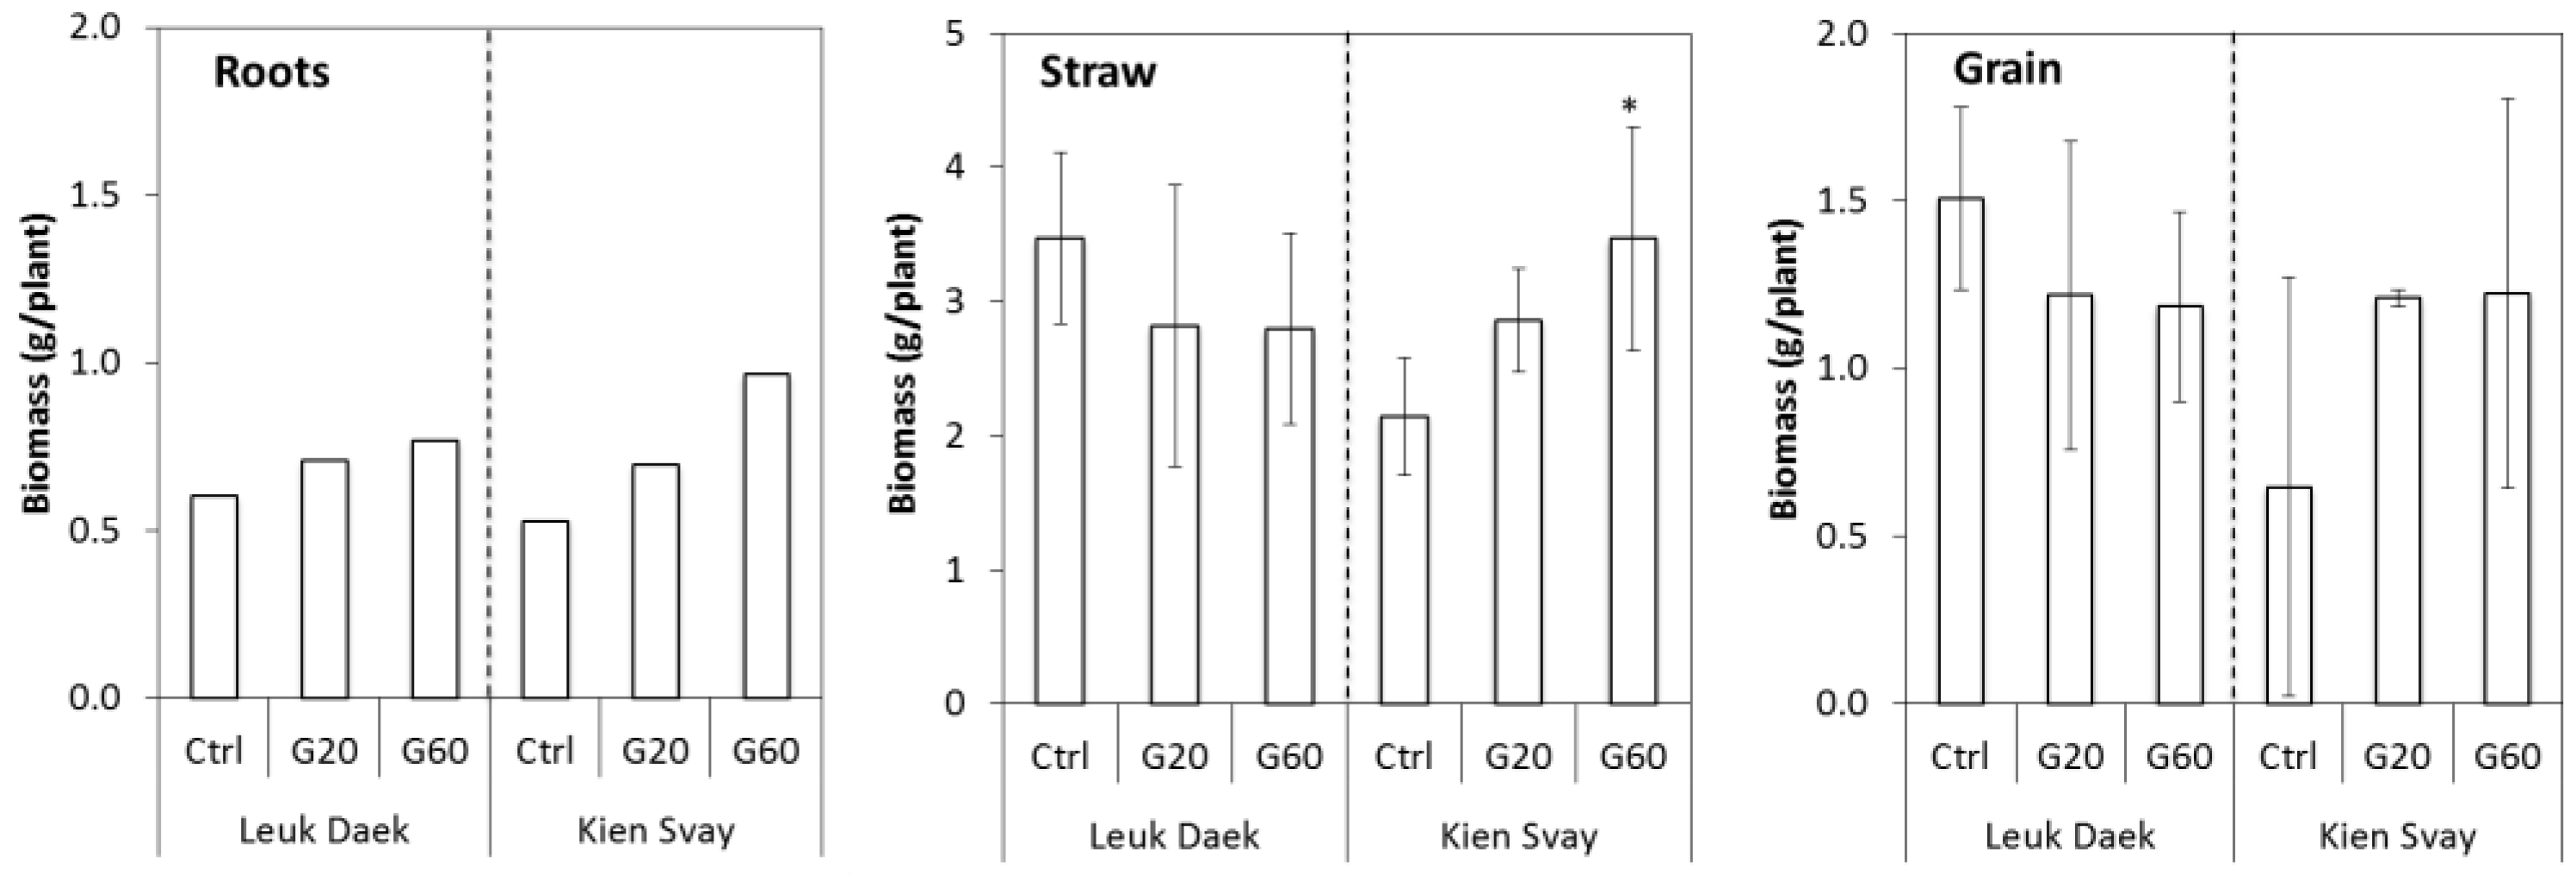
Figure 2.
Arsenic concentrations (µg per g biomass) in plant parts at harvest. Error bars denote standard deviation from the mean (N = 3, except for Kien Svay G20: N = 2). Root values are from 1 to 2 pots only per treatment and no error was calculated.
Figure 2.
Arsenic concentrations (µg per g biomass) in plant parts at harvest. Error bars denote standard deviation from the mean (N = 3, except for Kien Svay G20: N = 2). Root values are from 1 to 2 pots only per treatment and no error was calculated.
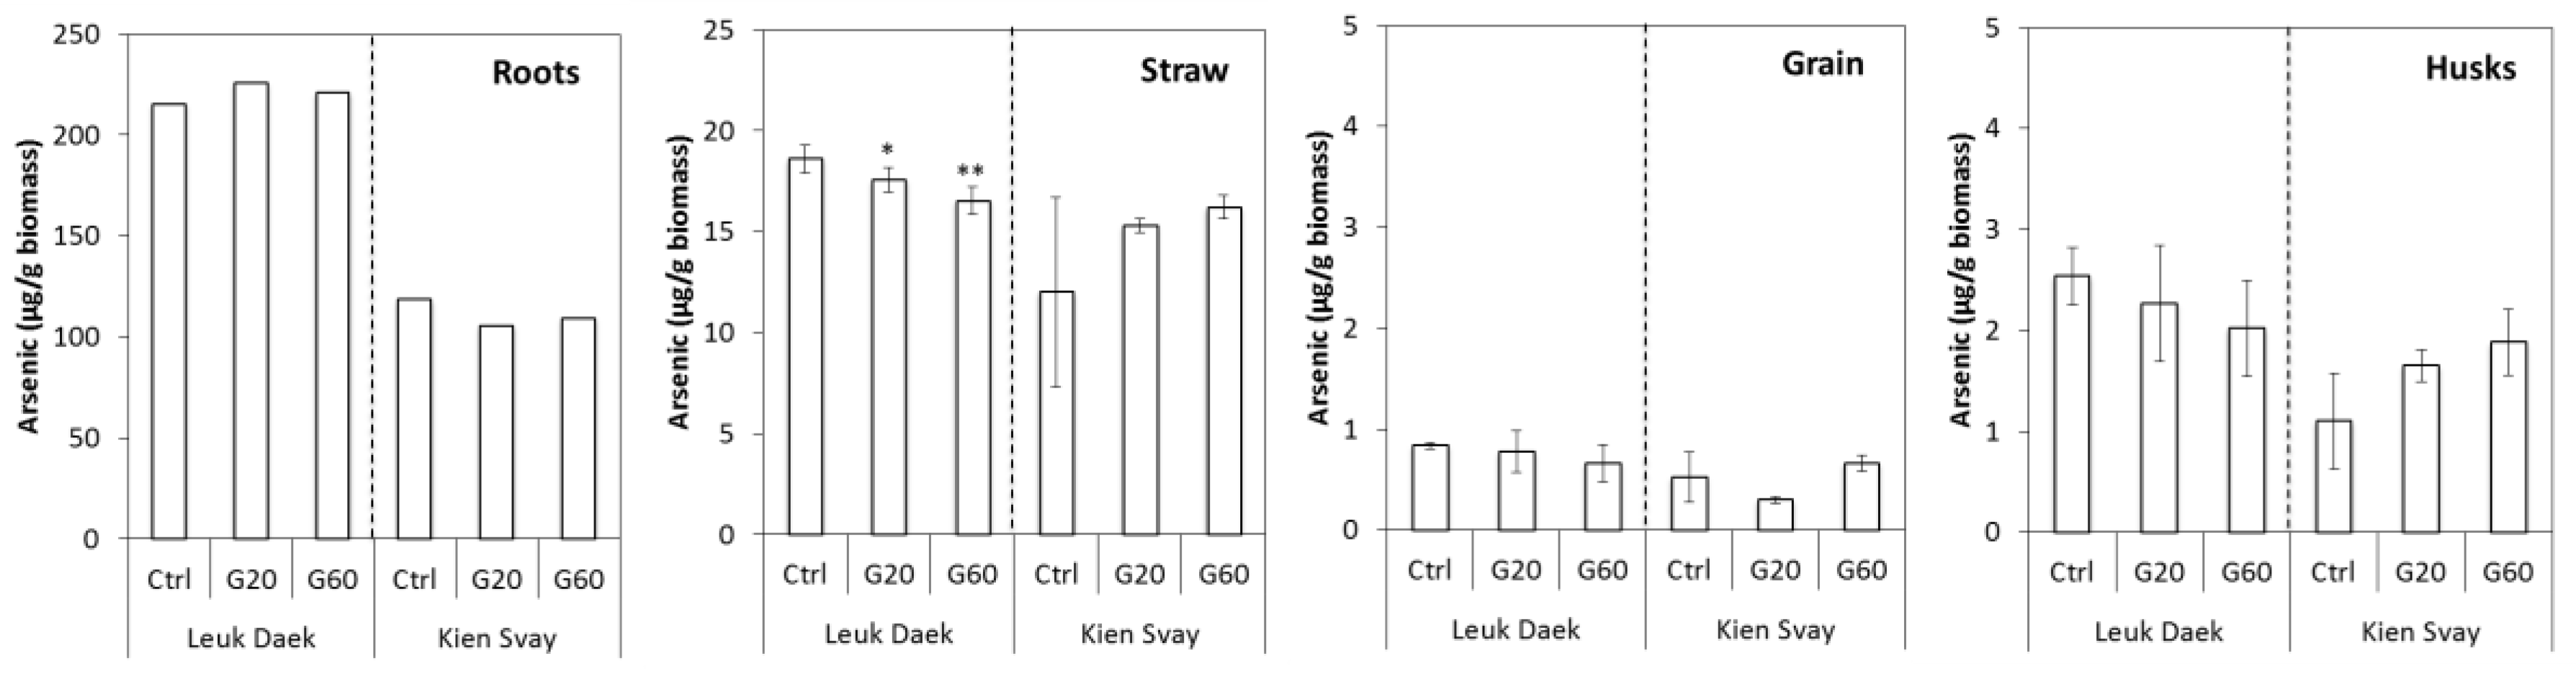
Figure 3.
Iron (mg/L), sulfur (mg/L), and arsenic (µg/L) concentrations in pot pore water as a function of time (weeks) since inundation and seedling transplantation. Error bars denote standard deviation from the mean (N = 3).
Figure 3.
Iron (mg/L), sulfur (mg/L), and arsenic (µg/L) concentrations in pot pore water as a function of time (weeks) since inundation and seedling transplantation. Error bars denote standard deviation from the mean (N = 3).
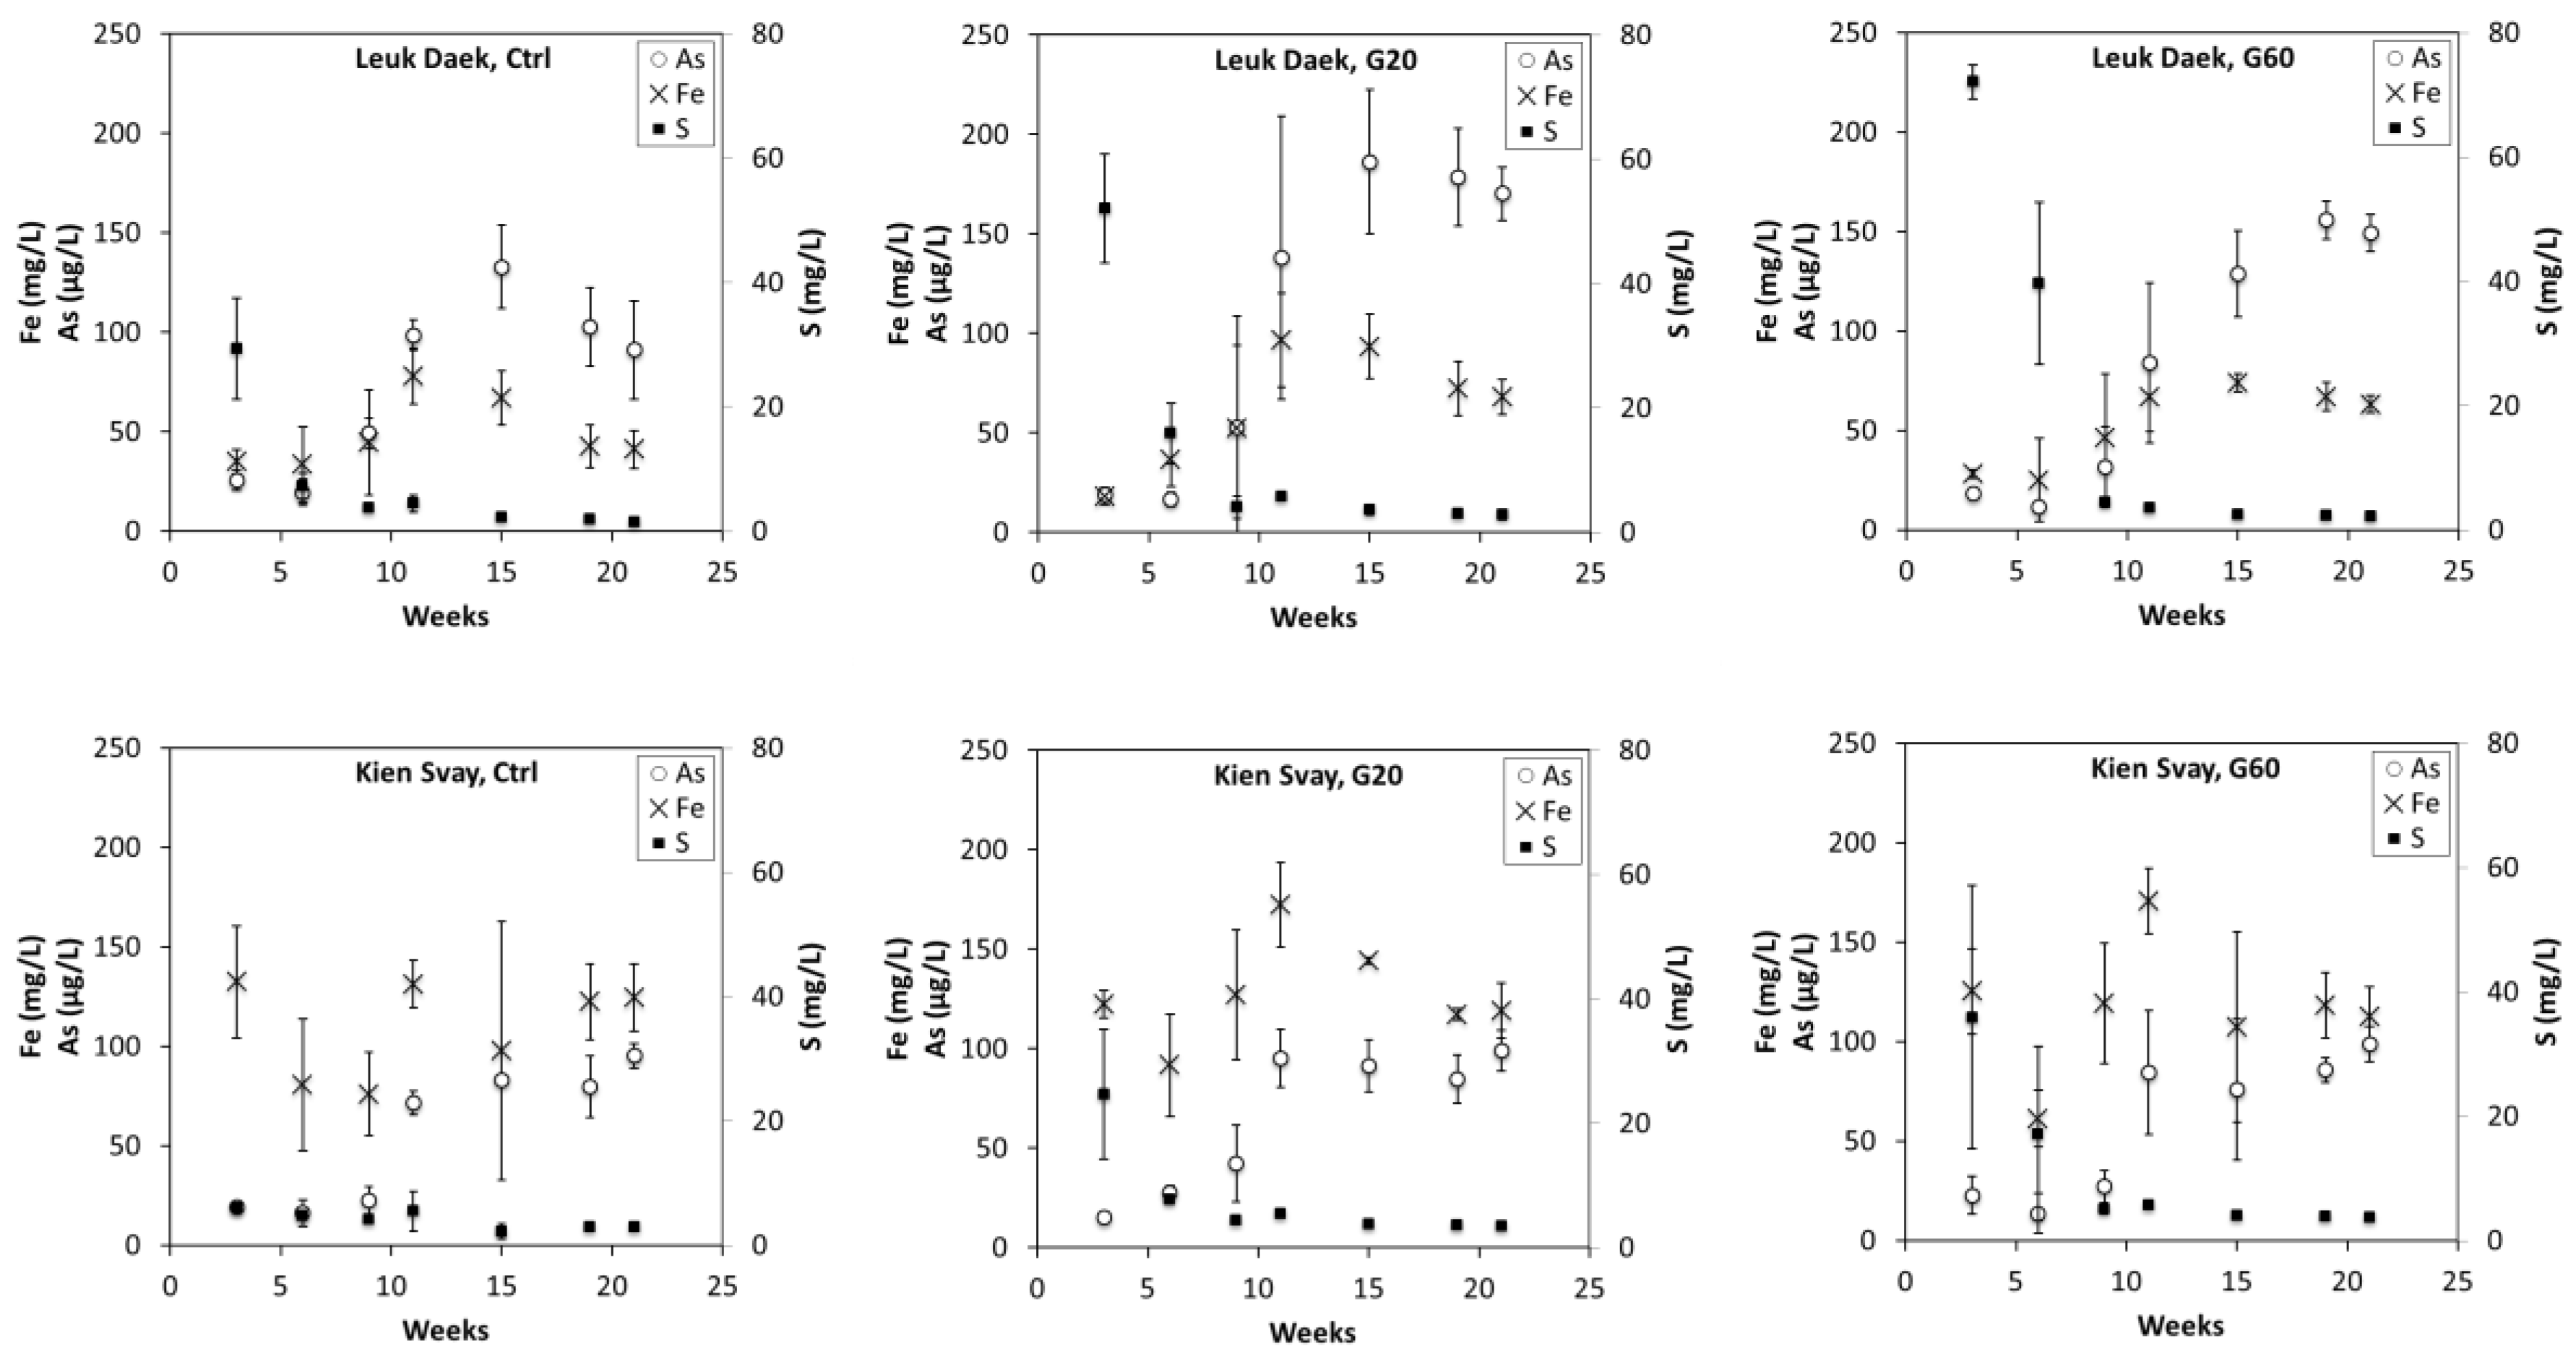
Figure 4.
As (a) and S (b) X-ray absorption near-edge structure (XANES) spectra of bulk soil after harvest. Model spectra used in the fitting are shown at the bottom of each plot and their respective peak energies (eV) are marked with vertical lines in corresponding pattern and color: (a) AsS3C18H15 (black solid line), Na3AsO3 (III) (black dotted line), AsV-FHy (grey solid line), (b) mackinawite (black solid line), elemental S (black dotted line), cystine (green solid line), thiosalicylic acid (orange solid line), methionine (green dotted line), DMSO (grey solid line), methionine sulfone (orange dotted line), methyl sulfonate (blue solid line), sodium sulfate (grey dotted line), chondroitin sulfate (purple solid line). The sample spectra are displayed as black lines and fits as blue lines for Kien Svay and red lines for Leuk Daek. In (c,d) the relative (%) contribution from fitted As and S species to total soil As and S are shown, respectively.


Table 1.
Average As and Fe concentrations (±standard error of the mean) for the duplicate samples from each pot in the DCB extracts of Fe plaque and in roots after plaque extraction.
Table 1.
Average As and Fe concentrations (±standard error of the mean) for the duplicate samples from each pot in the DCB extracts of Fe plaque and in roots after plaque extraction.
| Soil | Treatment | As in Plaque (µg g−1 Root Biomass) | As in Root (µg g−1 Root Biomass) | Fe in Plaque (mg g−1 Root Biomass) | Fe in Root (mg g−1 Root Biomass) |
|---|---|---|---|---|---|
| Kien Svay | Ctrl | 76.8 ± 6.9 | 61.8 ± 1.4 | 16.8 ± 2.5 | 6.61 ± 0.39 |
| G60 | 33.4 ± 6.5 | 52.8 ± 2.6 | 7.4 ± 1.0 | 6.9 ± 1.5 | |
| Leuk Daek | Ctrl | 92.3 ± 1.9 | 76.5 ± 1.0 | 11.1 ± 0.06 | 7.84 ± 0.30 |
| G60 | 52 ± 32 | 59.7 ± 3.2 | 9.2 ± 3.5 | 7.0 ± 0.52 |
© 2017 by the authors. Licensee MDPI, Basel, Switzerland. This article is an open access article distributed under the terms and conditions of the Creative Commons Attribution (CC BY) license (http://creativecommons.org/licenses/by/4.0/).
Share and Cite
MDPI and ACS Style
Boye, K.; Lezama-Pacheco, J.; Fendorf, S. Relevance of Reactive Fe:S Ratios for Sulfur Impacts on Arsenic Uptake by Rice. Soils 2017, 1, 1. https://doi.org/10.3390/soils1010001
AMA Style
Boye K, Lezama-Pacheco J, Fendorf S. Relevance of Reactive Fe:S Ratios for Sulfur Impacts on Arsenic Uptake by Rice. Soils. 2017; 1(1):1. https://doi.org/10.3390/soils1010001
Chicago/Turabian StyleBoye, Kristin, Juan Lezama-Pacheco, and Scott Fendorf. 2017. "Relevance of Reactive Fe:S Ratios for Sulfur Impacts on Arsenic Uptake by Rice" Soils 1, no. 1: 1. https://doi.org/10.3390/soils1010001