Formation and Oriented Aggregation of Tabular Hexagonal Silver Particles


CNR-ISM Istituto Struttura della Materia, Via Salaria km 29,300, 00015 Monterotondo Stazione, Italy
Condens. Matter 2018, 3(2), 13; https://doi.org/10.3390/condmat3020013
Submission received: 22 February 2018
/
Revised: 4 April 2018
/
Accepted: 12 April 2018
/
Published: 14 April 2018
(This article belongs to the Special Issue Complex Nanoscale Geometry and Dynamics at the Frontier between Biology and Material Science)
Abstract
:Silver tabular hexagonal particles (<diagonal> = 200 nm) were prepared at 40 °C by the reduction of silver nitrate with ascorbic acid in a solution of a polynaphthalene sulphonic dispersant agent, Daxad 19, in strong acidic conditions. By varying the reaction temperature and thus the dispersion viscosity between 10 °C and 30 °C, mesostructures of silver flat rods and flakes were obtained, the former resulting from linear aggregation of tabular hexagonal particles and the latter formed by intertwined flat rods. The results indicate an easy way to tune the aggregation of particles to obtain ordered mesostructures.
1. Introduction
Noble metal nanoparticles have attracted considerable attention in the last few decades due to their unique optical, electric, catalytic, and antibacteriostatic properties. Theoretical and experimental research has established that the intrinsic properties of a metal nanoparticle, which can have a great influence on its macroscopic behavior, are mainly determined by its size, composition, and crystallinity [1]. Many metals can now be processed into monodispersed particles with controllable composition and structure, and can be produced in large quantities at low cost through solution-phase methods [2,3,4,5,6,7]. An important role in determining new macroscopic properties is also attributed to the shape of the particle [8]. Regarding optical properties, for example, prolate silver spheroids are particularly effective in surface enhancement Raman scattering (SERS). The effect, compared to spherical particles, involves the splitting of the dipole resonance into two absorptions bands, in which the induced dipole oscillates along and transverse to the spheroidal axis. The change-over from a spherical to an ellipsoidal shape results in a shifting of the absorption into the UV-VIS range [9].
Besides particle shape, another important effect on macroscopic properties is determined by particle-particle interaction. In order to observe, identify, and study this phenomenon, as well as find new technological applications, metal particles have to be organized in ordered structures [10,11]. Linear metal particle aggregates, for example, find potential use as interconnects in fabricating nanodevices and play important roles in investigating a variety of physical phenomena [12,13]. In particular, silver has received special attention because it exhibits the highest thermal and electrical conductivity of all the metals, and the performance of silver in many applications could be enhanced by processing silver into one-dimensional nanostructures [14,15].
The challenge is therefore to find low-cost synthetic methods capable of (a) preparing particles with definite shapes different from the most common isotropic spheres and (b) assembling the particles into ordered structures. To prepare particles with definite shapes, capping agents can be used, i.e., molecules that, through selective coordination on some crystal planes, favor a preferential particle growth, therefore modifying the particle shape [16]. A beautiful example is given by monodispersed acicular haematite (α-Fe2O3) particles [17], where the particle shape is mainly determined by the capping effect of PO43− ions that, through coordination with Fe3+ ions onto preferential crystal planes, hinders the particle growth along these planes [18].
For the preparation of silver particles, a well-known chemical method involves the reduction of silver ions with ascorbic acid in the presence of a dispersant agent (which is necessary to avoid particle aggregation). Some authors pointed out the presence, besides spherical particles, of isolated particles of different shapes [3,19]. We therefore decided to investigate the preparation method, trying to understand the cause of the new particle shapes and optimize their selective formation.
Eventually, by lowering the reaction temperature from 30 to 10 °C and thereby increasing the viscosity of the dispersion, one dimensional (1D) and two dimensional (2D) mesostructures, formed by particle aggregation, were obtained.
2. Materials and Methods
2.1. Materials
Silver nitrate crystals and ascorbic acid, purchased from Aldrich (Saint Louis, MO, USA), were of the high purity grade. HNO3 69.7 wt % was purchased from Fischer. The surfactant Daxad 19 (sodium salt of poly naphthalene sulphonate formaldeyde condensate, mol wt. 8000, in the text abbreviated as Daxad) was obtained from Akrochem Company, Akron, OH, USA.
2.2. Chemical Synthesis
Tabular Hexagonal
Silver particles (Sample 1): Small sized hexagonal tabular particles (<diagonal> = 200 nm) were obtained by modifying a process described previously [3].
To 250 mL of an aqueous solution of 9.17 g AgNO3 at 40 ± 2 °C, 1.32 g Daxad was added. The orange brown solution was then acidified by the addition of 28 mL HNO3. Then, 10 g ascorbic acid dissolved in 30 mL H2O was added after 1 h. The rate of ascorbic acid solution addition was 0.5 cm3/min for the first 5 min. The color of the suspension turned from light brown to dark brown to dark green. At this point, the rate was slowed to 0.3 cm3/min. The ascorbic acid addition was completed. Mechanical stirring was continued for 1 h, until the dispersion reached room temperature. After settling of the grey precipitate, the mother liquors were siphoned. The precipitate was then washed three times with deionized water, and dispersed in water.
Silver flat rods (Sample 2): Same procedure as above but the reaction temperature was set at 30 ± 2 °C.
Silver flakes (Sample 3): Same procedure as above but the reaction temperature was set at 10 ± 2 °C.
Polydispersed particles (Sample 4): Same procedure as sample 1, but with a AgNO3 concentration that was 10 times less (see Table 1).
2.3. Characterization
The material was studied with a scanning electron microscope (SEM), a transmission electron microscope (TEM), and in the case of tabular silver particles, also with a field-emission scanning electron microscope (FE-SEM).
The crystalline structure was analyzed by X-ray powder diffraction (XRD) and electron diffraction, and the crystallite size was evaluated using Scherrer’s equation.
Electrokinetic measurements of silver particles as a function of pH in 1 × 10⁻³ mol dm−3 KCl aqueous solution were performed with a ZetaPlus instrument at 25 °C.
3. Results
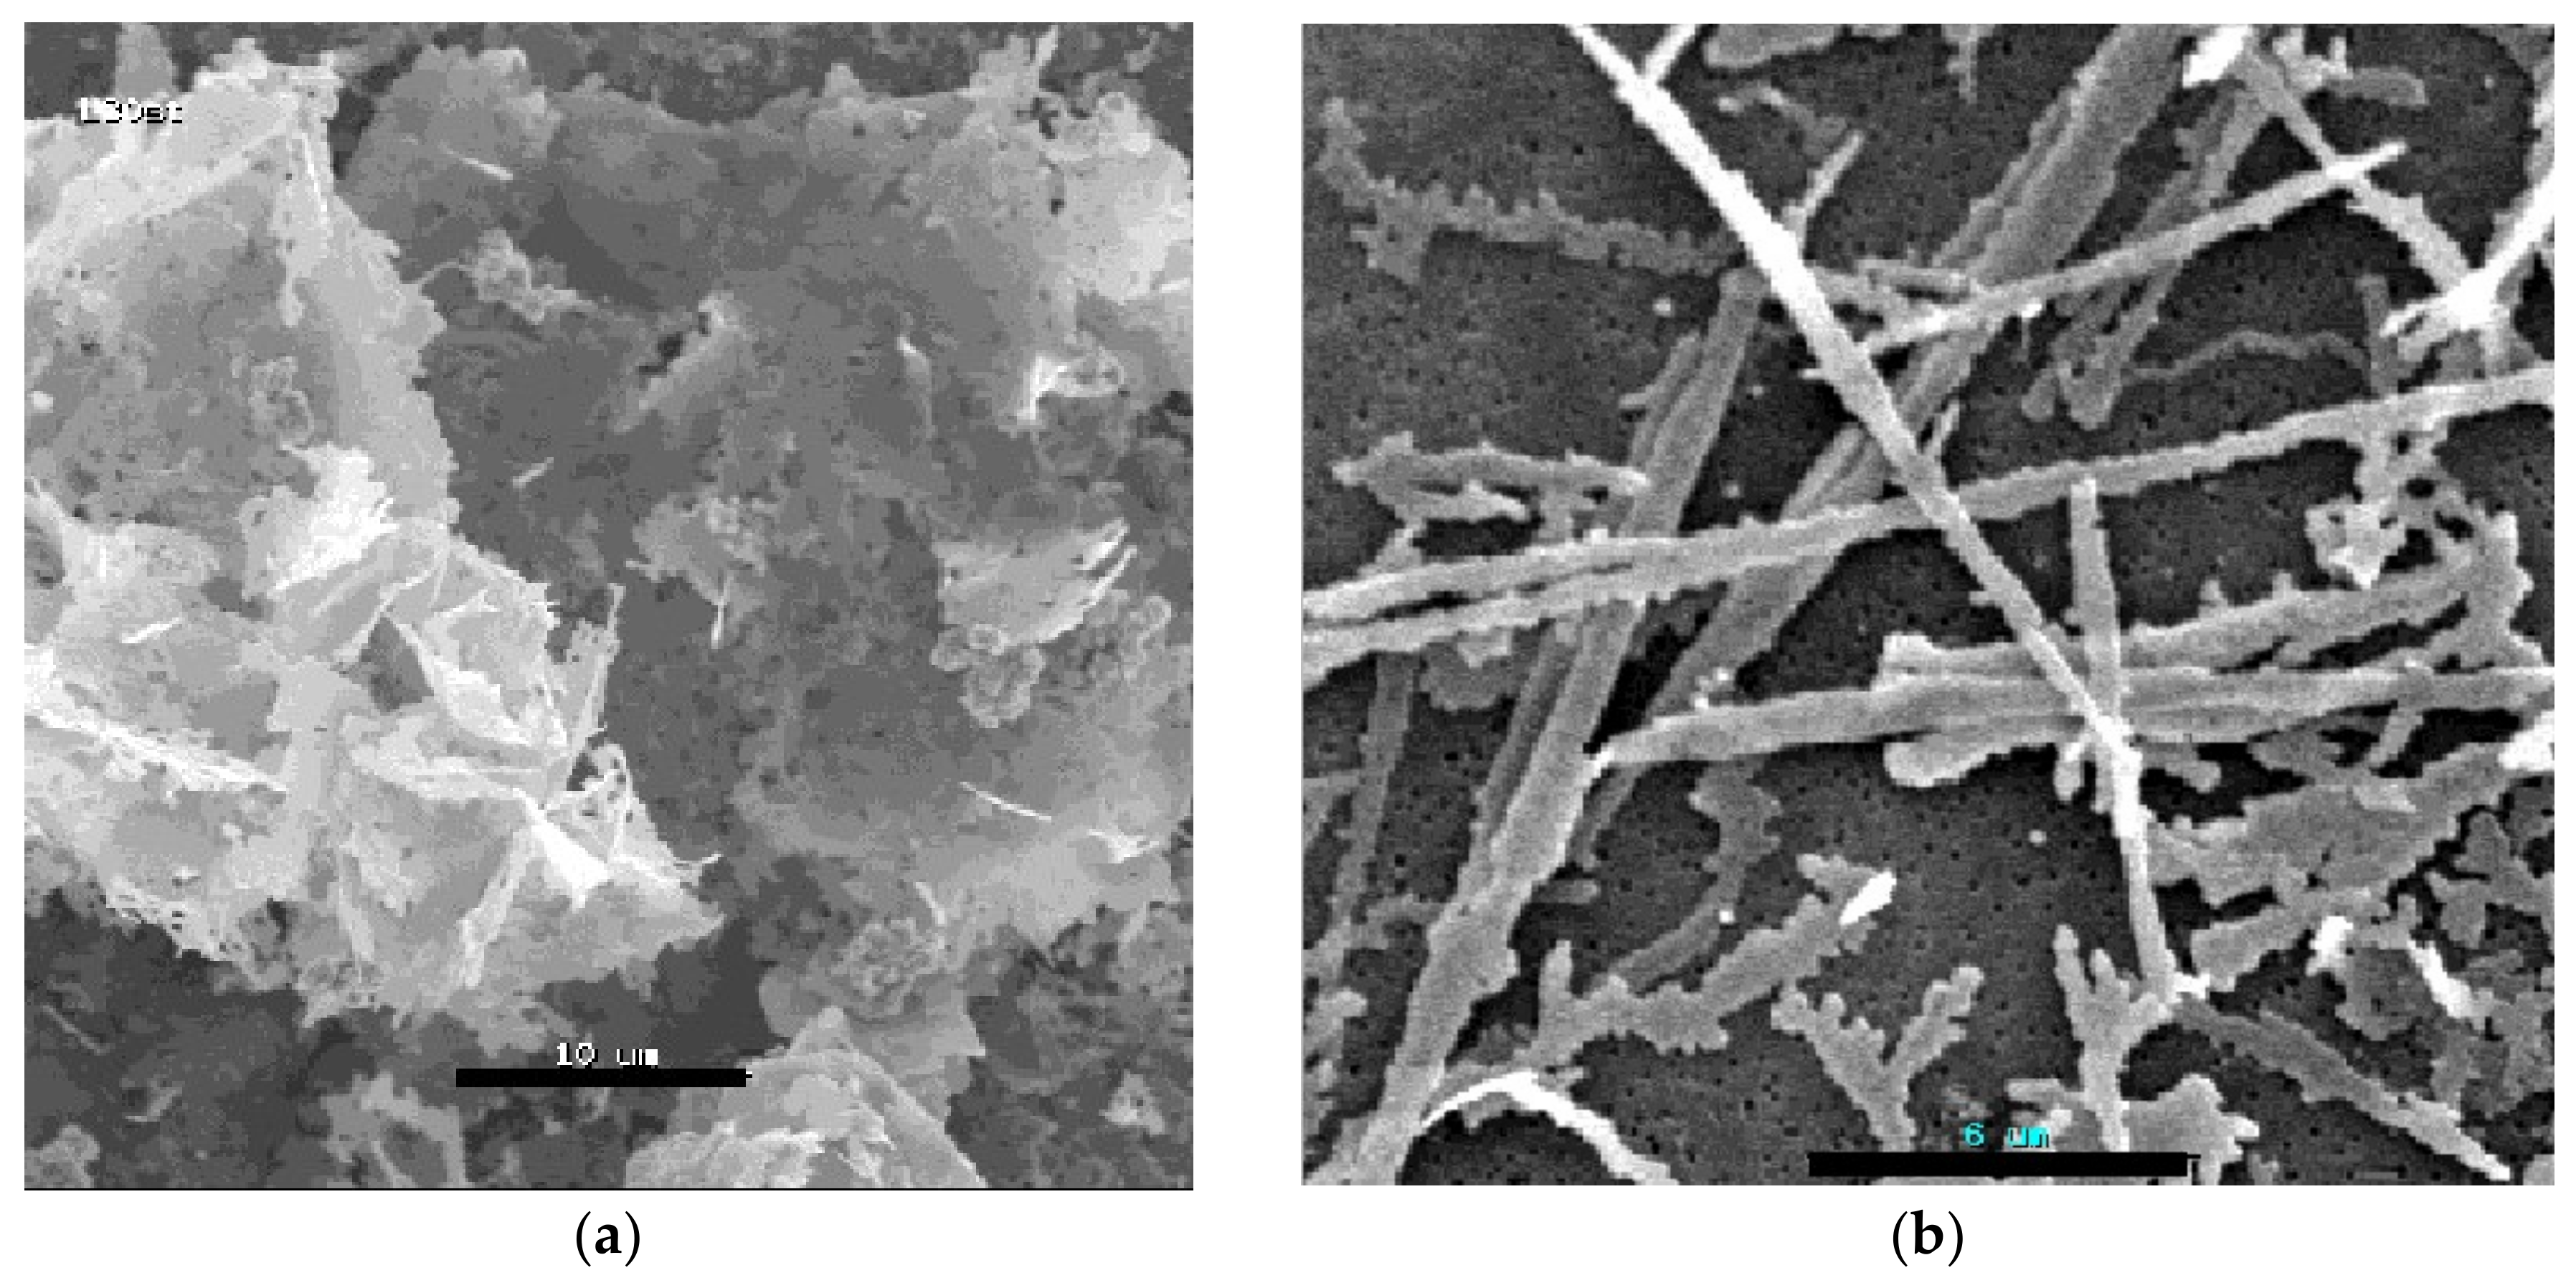
Figure 1a–d show SEM micrographs of the different silver-based materials. In Table 1, the experimental conditions in relation to the different morphologies obtained are listed.
Apparently, the temperature is the main parameter that determines the different morphologies. In fact, at low temperatures (10 °C), flakes are obtained (Figure 1a); at 30 °C, flat rods are obtained (Figure 1b); and at 40 °C, hexagonal tabular particles are obtained (Figure 1c). In the case of flakes, Figure 1d shows that they are formed by flat rods fused and/or intertwined together (inset of Figure 1d). All of the samples are composed of silver covered by a surfactant layer as shown by SEM and TEM investigations (see below) as well as zeta potential measurements (Figure 2) [20].
According to the anionic nature of the surfactant, the particles are, in fact, negatively charged over the studied pH range. An analogous result was found previously by Sondi et al. [3] where FTIR spectroscopic measurements also supported the presence of the surfactant.
SEM micrographs of tabular hexagonal silver particles show a particle thickness of 20 nm and a particle diagonal of 200 nm (Figure 3). Previous TEM investigations on the same samples showed the presence of twinning defects common in metallic particles [21,22] and in situ time-resolved small angle X-ray scattering measurements also revealed that the tabular particles result from the aggregation of primary particles with size of about 30 nm [23]. The electron diffraction SAED pattern could be indexed as a silver face-centered cubic structure (JCPDS-04-0783) [21].
It is interesting to note that, in the SEM micrographs, the tabular particles show, on their surface, smaller shining spherical particles (<diameter> = 20 nm) (inset of Figure 1c). Most probably they are gold particles coated with silver. Because the particles are covered by an insulating surfactant layer, charging phenomena can occur during SEM measurements. To avoid this, before SEM investigation, the samples were sputtered with gold. During the process, the hot gold droplets arriving on the thin silver hexagonal tabular surface induce silver, having a lower melting point than gold, to flow onto the warmer gold particle surface. As a result, silver-coated gold particles become significantly brighter than the gold particles deposited on the bare substrate (as a matter of fact, the silver enhancing effect is commonly used in electron microscopy, especially when small gold particle labels (1–5 nm) must be used) [24].
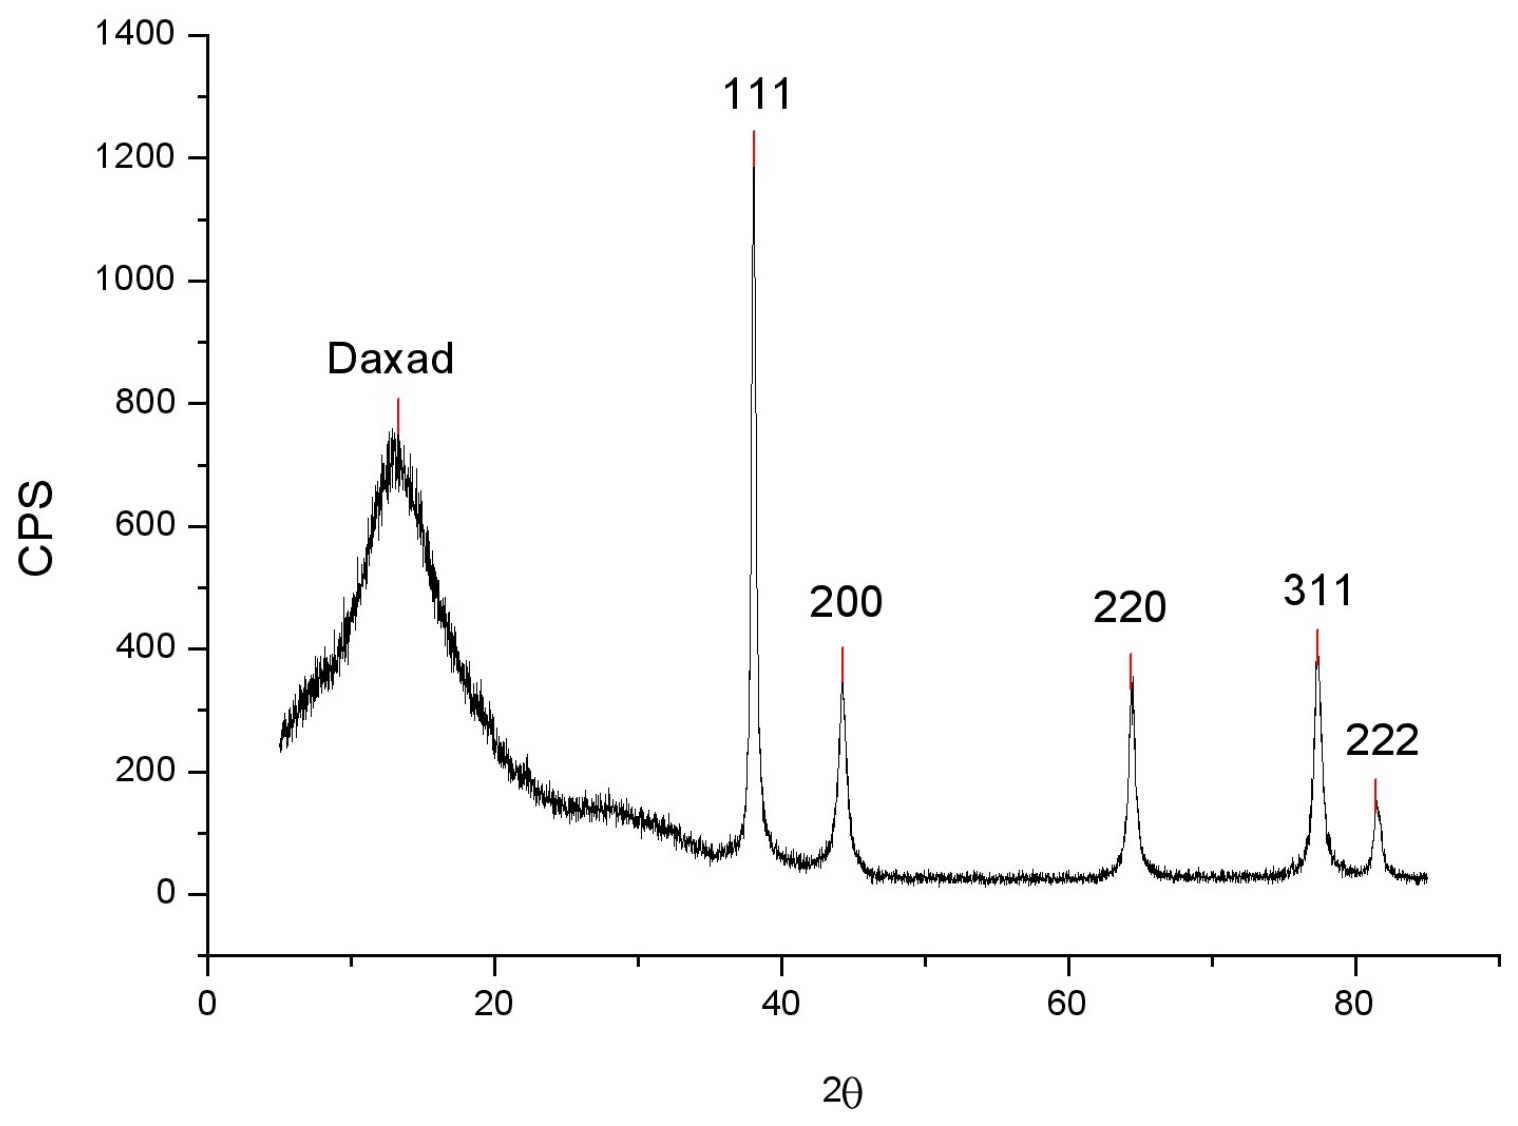
X-ray diffraction measurements performed on every sample showed, besides a large peak attributed to the amorphous Daxad, only the diffraction peaks of silver (Figure 4).
In our previous studies [21,25], we determined the crystallite size using Scherrer’s equation corrected with an external standard for instrumental error, and showed that in all cases crystalline sizes varied between 20 nm and 33 nm. In the case of single crystal hexagonal particles, the crystal size of 33 nm, found by applying Scherrer’s equation, was sensibly less than the particle size (diagonal was ca. 200 nm). This is in agreement with in situ and time-resolved small angle X-ray scattering measurements, indicating that the hexagonal particle is not a single crystal but is formed by the aggregation of primary particles with size of about 30 nm. The ratio between the intensities of 111 and 200 XRD powder diffraction peaks increased compared to the spherical particles (3.9 to 2.5), denoting the preferential particle growth in the (111) crystal plane.
It is notable that, if the rate of ascorbic acid addition is fast (more than 0.5 mL/min), capping (determining the ordering process acting during the particle growth) is depressed, yielding particles that are almost all round shaped and approximately 200 nm in diameter.
Furthermore, in order to obtain larger particles, in the case where nucleation and growth are separate processes [20], it is possible to decrease the number of silver nuclei by decreasing the concentration of silver nitrate, thus favoring the particle growth process. By decreasing the silver nitrate concentration by 10 times (from 0.2 to 0.02 M), micrometer sized particles are obtained (Table 1, sample 4). As evidenced by SEM investigations (Figure 5) the particles are not monodispersed. Probably longer digestion times would be required, in accordance with the Ostwald ripening process, to reduce the distribution size in favor of the largest ones.
4. Discussion
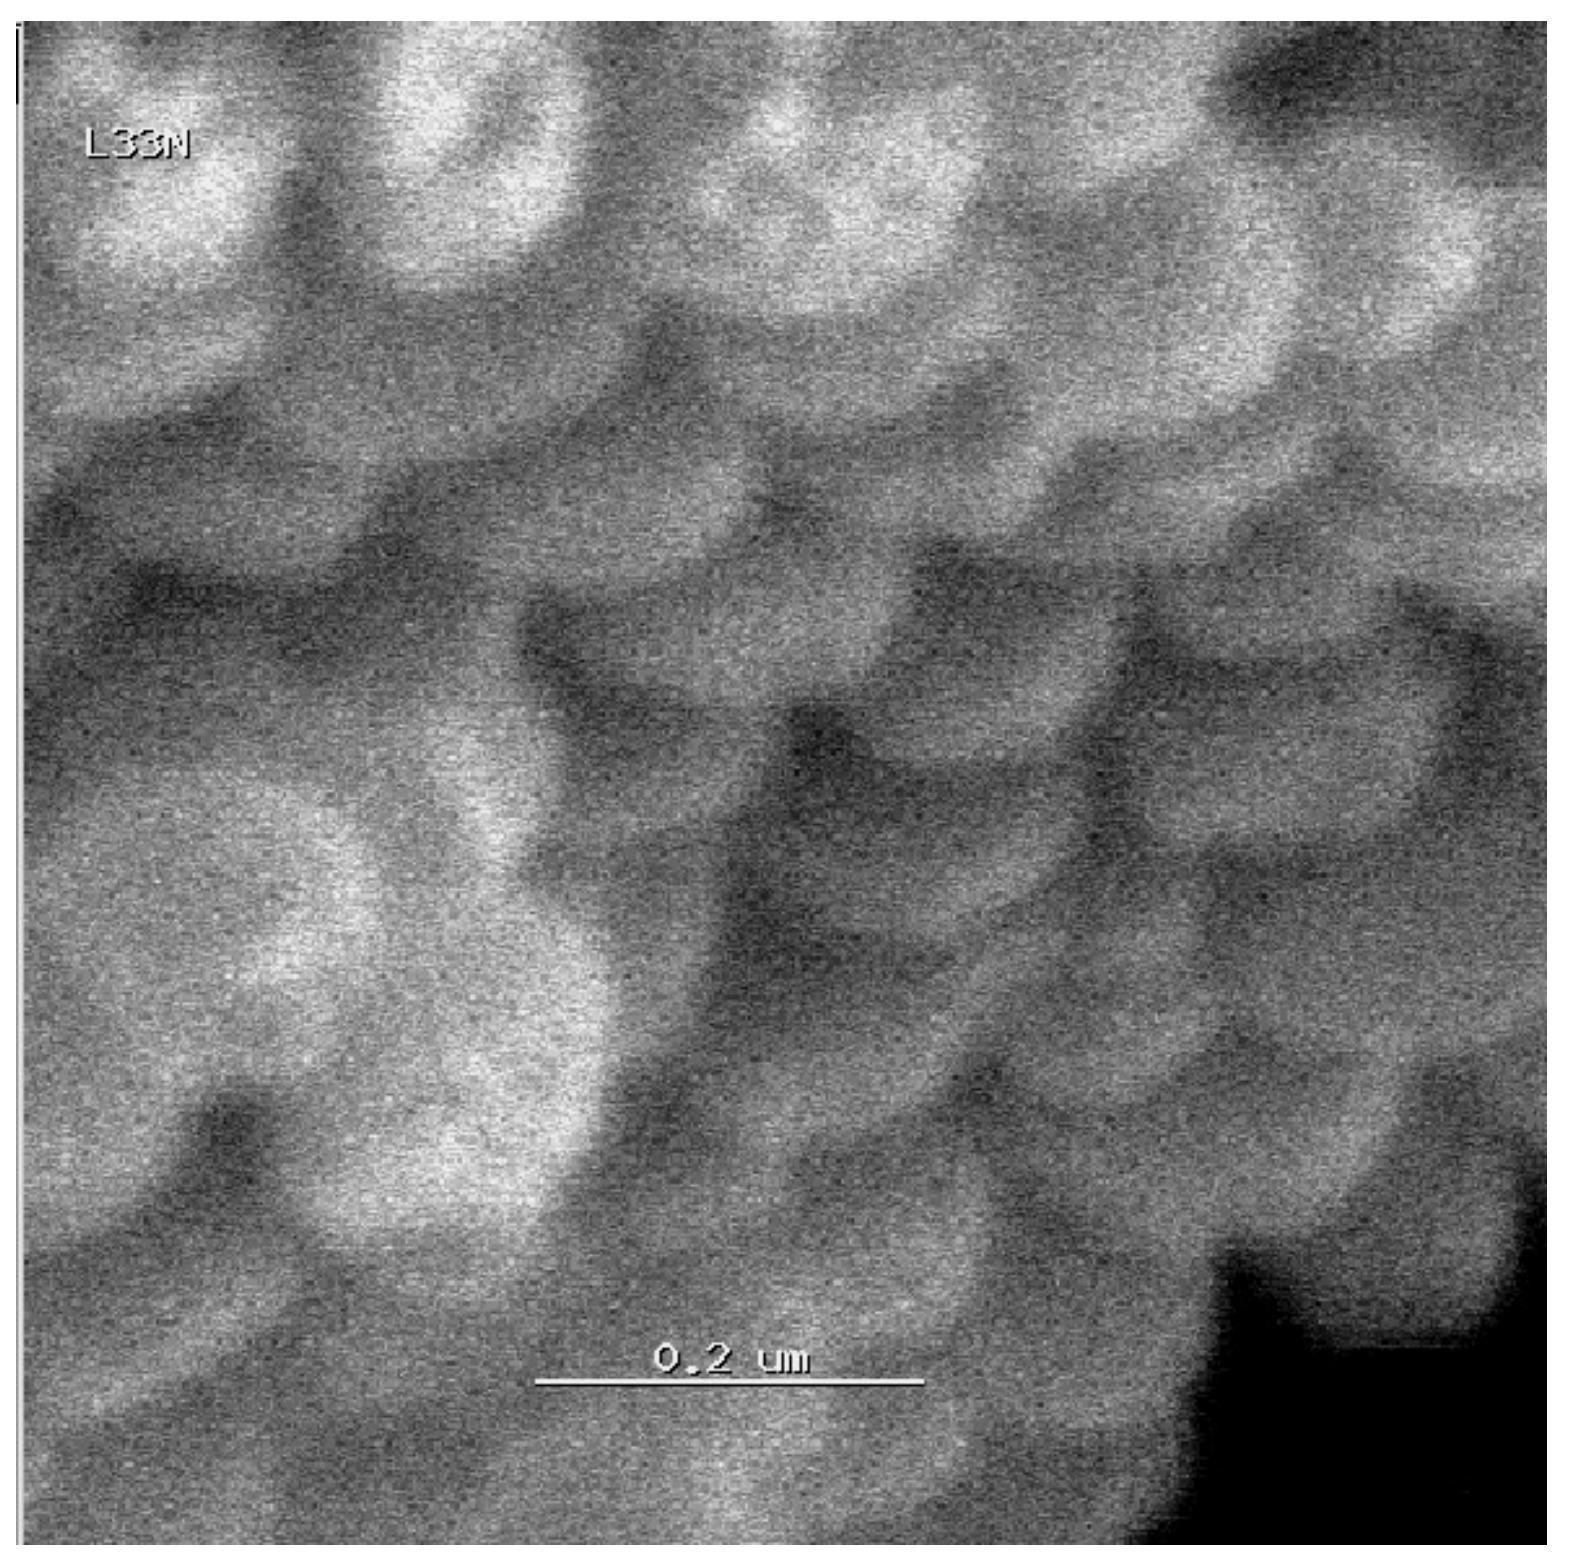
What is remarkable in this system is that, by simply varying the reaction temperature in a very small range (10–40 °C), a variety of silver forms are obtained, such as flake and flat rod mesostructures and tabular hexagonal particles. In Figure 6a,b, aggregated tabular particles are visible, building blocks of the flat rods observed in Figure 1b.
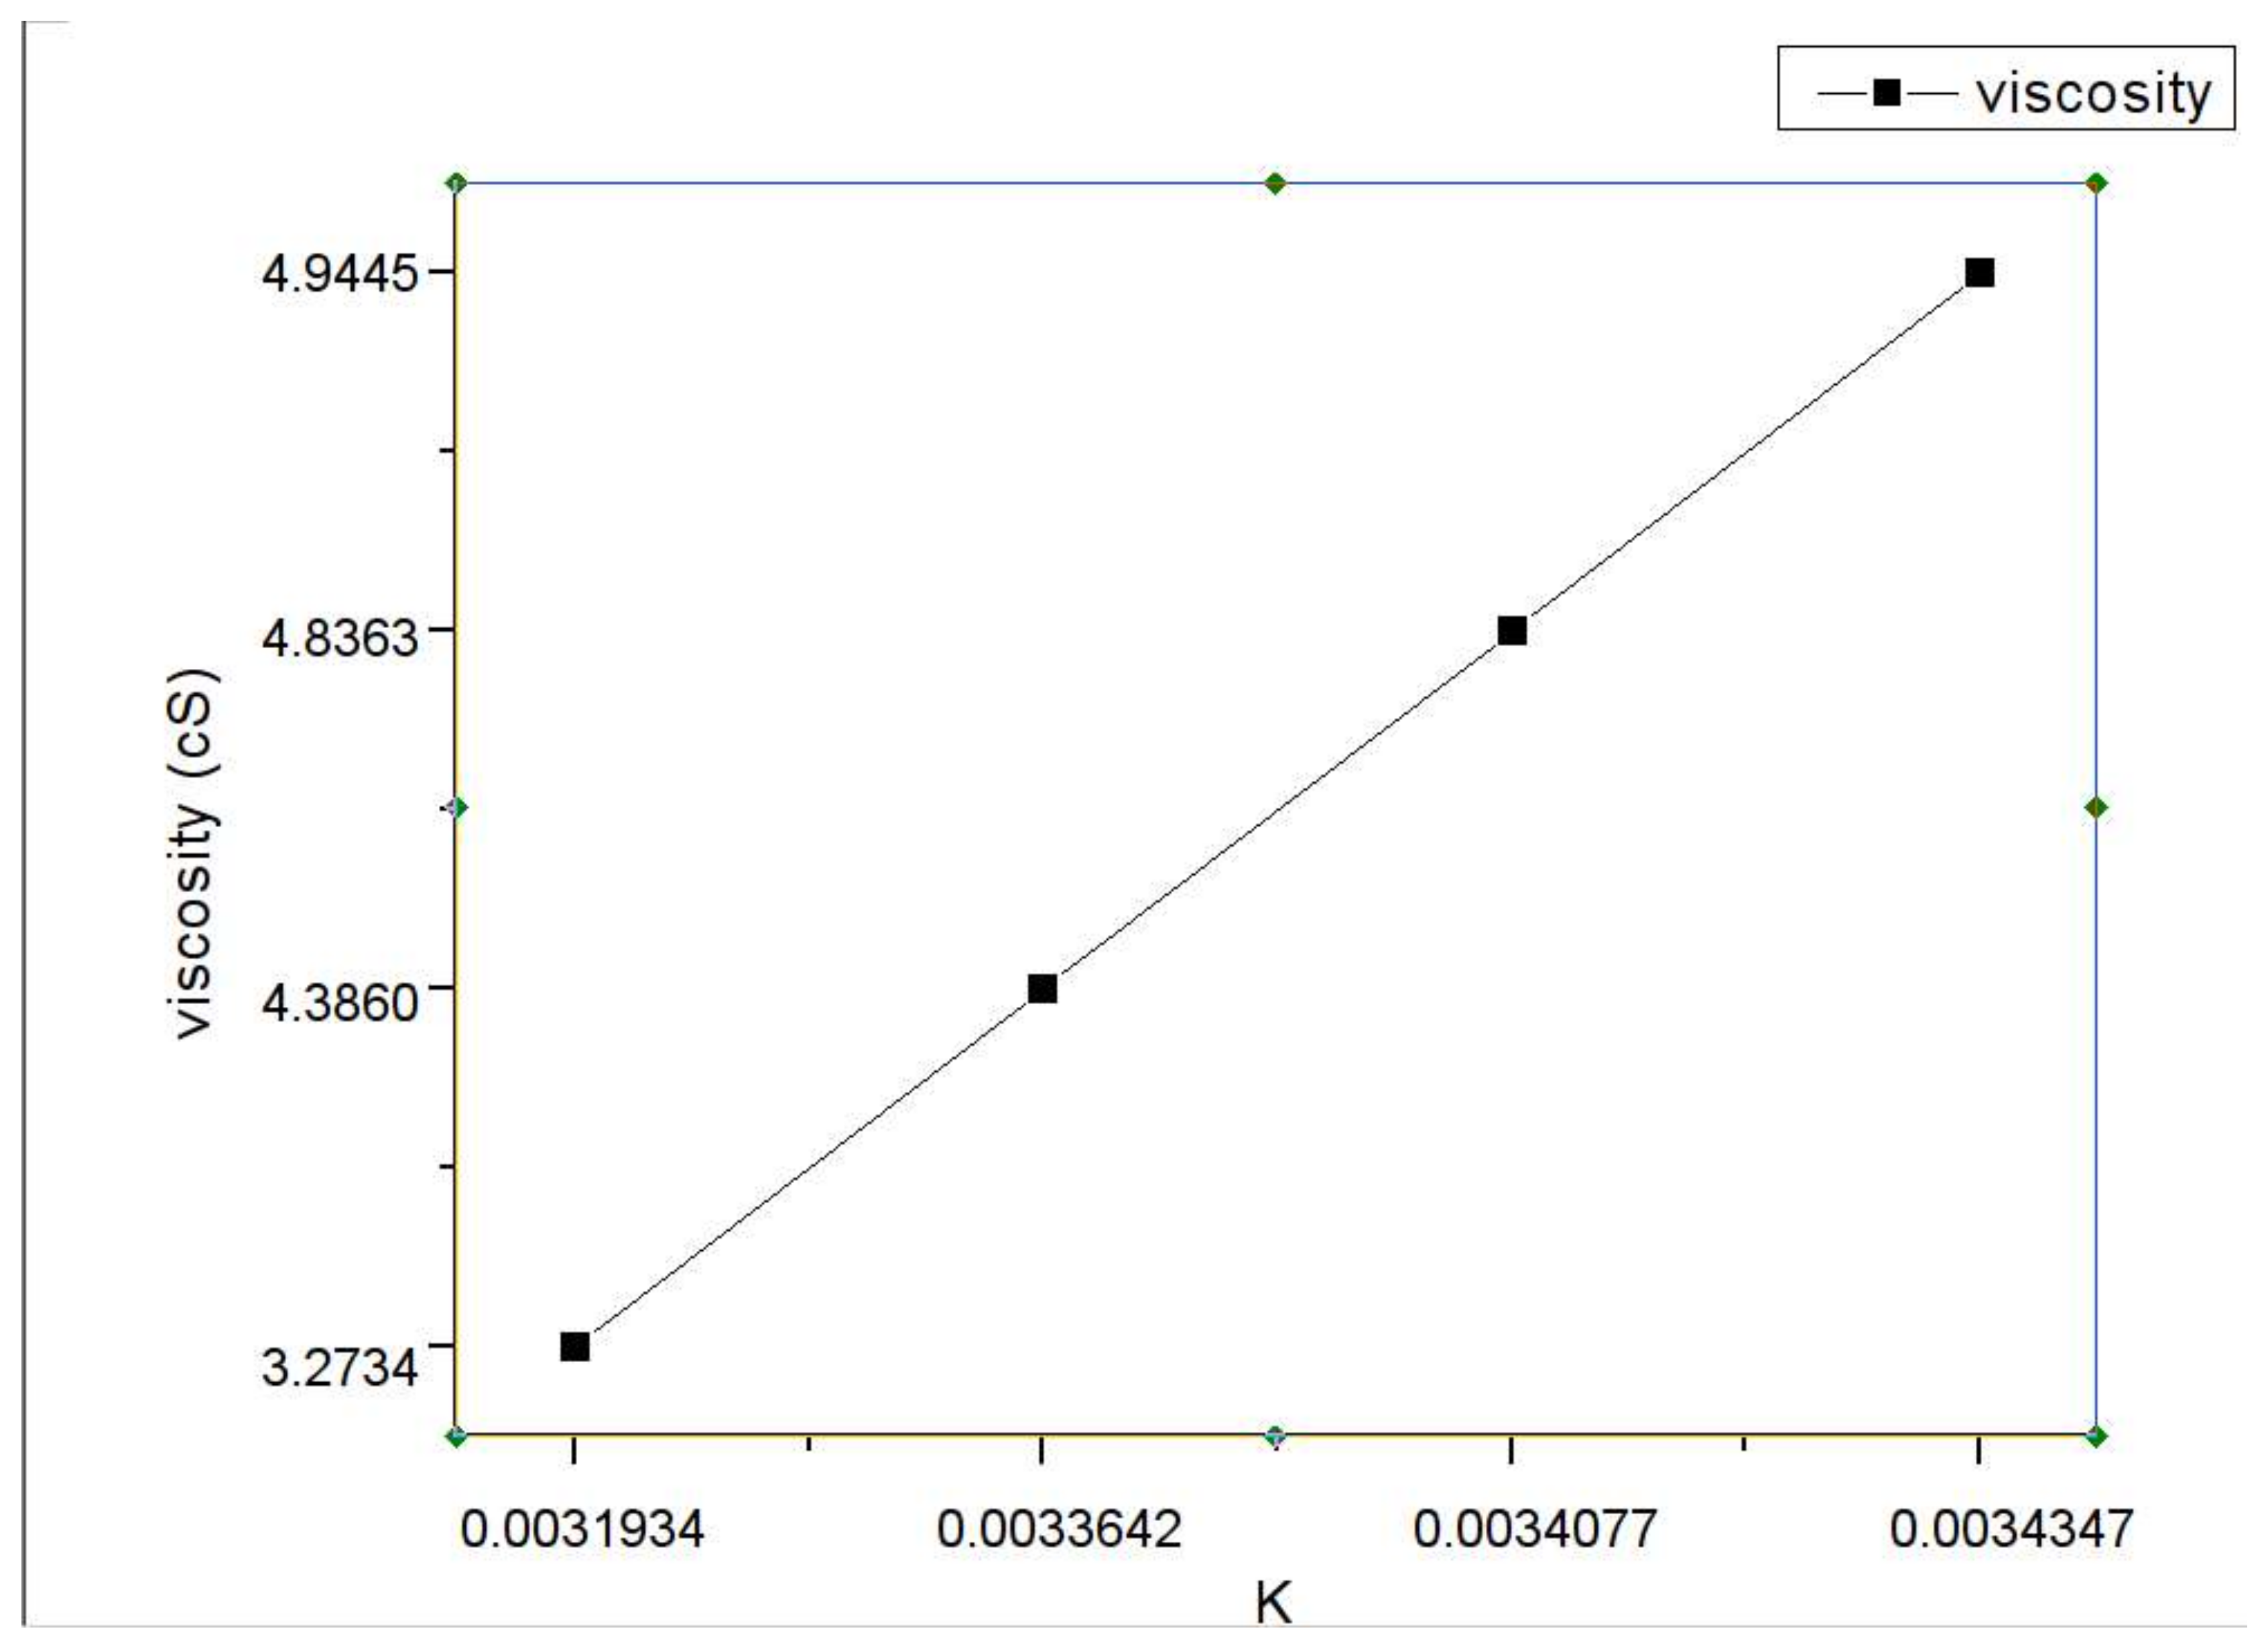
The different particle aggregation is probably due to the different viscosity of the reaction dispersion, as shown in Figure 7.
The lower dispersion viscosity measured at 40 °C allows the hexagonal tabular particles to remain well separated, whereas as the viscosity increases, at 30 °C, the tabular particles aggregate, forming flat rods, and at 10 °C, the flat rods further aggregate to form flakes (Figure 1d).
Regarding the tabular hexagonal particle shape, why does it form? To what extent is it possible to control its growth? To answer these questions, we examined in detail the reaction, i.e., the reduction by ascorbic acid (AA) of Ag+ ions dissolved in an aqueous acidic surfactant dispersion. The Ag+ reduction process is controlled by the environment in which it takes place. The surfactant, the first reagent added to the AgNO3 solution, is a polymer constituted essentially of condensed naphtalenic rings with sulphonic and formaldehyde groups. It is dispersible in water and through its sulphonic groups is able to coordinate the Ag+ ions. Dissolved in the reaction solution are NO3− anions, which are known to be powerful electron scavengers and compete in capturing electrons released by the reducing agent. Moreover, a higher concentration of NO3− ions is available in the system, due to the presence of nitric acid added to decrease the concentration of the ascorbate ions, in which AA2− is considered the main reducing agent (Equation (1)).
AA ⇔ AA2− + 2H+
In this way, it is possible to tune the reduction process by controlling the concentration of ascorbate ions, i.e., the pH [26]. As a matter of fact, evidence that the system can be very finely controlled is that the reduction process can even be prevented. In fact, if initially the addition rate of ascorbic acid is below 0.5 cm3/min and starts about 10 min after the addition of silver nitrate, no visible precipitation is observed. A possible explanation for this is that, in order to start the reaction, an increase of pH is necessary to produce a sensible amount of AA2−. This can be accomplished by tuning the addition rate of the weaker ascorbic acid; when the addition rate is slow (below 0.5 cm3/min), the pH increase is slow and the AA2− concentration is low. On the contrary, when the addition rate increases above or equal to 0.5 cm3/min, the concentration of the reducer, AA2−, increases and the reaction can start. Moreover, if a certain amount of time is elapsed before the ascorbic acid addition, as soon as the ascorbic acid addition starts, Ag0 atoms nucleate but undergo prompt dissolution by the NO3− electron scavenger [27]. As a matter of fact, it was observed that as soon as an ascorbic acid solution drop is added to the reaction solution, the formation of a grey turbidity occurs, which promptly dissolves with development of gas bubbles (probably nitrogen oxides). Then, in this case, in order to observe the precipitation of silver particles, a larger amount of ascorbic acid is needed (~twice the quantity used in our protocol). Furthermore, our protocol for ascorbic acid concentration yielded well-separated tabular particles (Figure 1c), together with a few spherical particles, while using larger amounts of ascorbic acid gave only aggregated, tabular hexagonal silver particles, similar to those obtained by Fukuyo et al. (Figure 8) [28].
Apparently, the addition of a greater amount of reducing agent helps the formation of tabular, hexagonal shaped particles. Considering the ascorbic acid molecule, a five-membered ring with the enediol group HO–C=C–OH laying planar [29], a possible explanation for this phenomenon is that this group acts as a capping agent on silver through the coordination of the two OH groups, stabilizing the primary particle growth along the preferential growing plane (111). The high ratio of {111} to {100} facets in (111)-based particles would then determine the hexagonal shape. It is notable that, if the rate of ascorbic acid addition is fast (more than 0.5 mL/min), the capping action of the enediol group HO–C=C–OH (determining the ordering process acting during the primary particle growth) is hindered, yielding particles that are almost all round shaped.
An indirect evidence of the influence of ascorbic acid in determining a preferential particle growth comes from a few silver triangular shaped particles observed by Sondi et al. [3] in samples mainly constituted of small multi-twinned spherical silver particles, also prepared by the reduction of silver nitrate with ascorbic acid. The triangular shaped particles represent a first stage in the shape evolution of (111)-based nanoparticles as the ratio of {111} to {100} facets increases [22].
5. Conclusions
One novel aspect of the reaction system is its extreme versatility that, depending upon slight changes in a small range of reaction temperatures (40–10 °C), produces tabular hexagonal silver particles and orders them in 1D (flat rods) and 2D (flakes) mesostructures.
The organic components, i.e., ascorbic acid and Daxad, play the main roles in determining the new silver particle shape—hexagonal, tabular, or mesostructural. In the first case, the tabular form might be determined by the ascorbic acid molecule that, through the coordination of its planar endiol (HO–C=C–OH) group, favors the primary particles’ growth along the preferential plane (111), followed by their oriented aggregation in hexagonal tabular shapes. In the second case, the flat rod and flake mesostructures, formed by the aggregation of the hexagonal tabular particles at 30 °C and 10 °C, respectively, are determined by the increasing viscosity of the dispersions that favors at 30 °C the 1D flat rod shaped assembling of the particles and, by further increase of the viscosity, at 10 °C, favors the further aggregation of the flat rods, building 2D flake mesostructures.
Acknowledgments
The author thanks Stefano Martelli and Patrizia Imperatori for advice and discussions on XRD results, as well as Camillo La Mesa and William R. Plunkett for viscosity and electron diffraction measurements respectively. The experimental work was performed at the Center for Materials Processing, Clarkson University, Potsdam, NY 13699-5814, USA on leave by ISM-CNR, and supported in part by the NSF Grant DMR-010244.
Conflicts of Interest
The authors declare no conflict of interest.
References
- Klabunde, K.J. Nanoscale Materials in Chemistry; Wiley: New York, NY, USA, 2001; Volume 2, ISBN 9780470222706. [Google Scholar]
- Goia, D.V.; Matijević, E. Preparation of monodispersed metal particles. New J. Chem. 1998, 22, 1203–1215. [Google Scholar] [CrossRef]
- Sondi, I.; Goia, D.V.; Matijević, E. Preparation of highly concentrated stable dispersions of uniform silver nanoparticles. J. Colloid Interface Sci. 2003, 260, 75–81. [Google Scholar] [CrossRef]
- Kamat, P.V.; Flumiani, M.; Dawson, A. Metal-metal and metal-semiconductor composite nanoclusters. Colloids Surf. A Physicochem. Eng. Asp. 2002, 202, 269–279. [Google Scholar] [CrossRef]
- Liz-Marzán, L.M.; Giersig, M.; Mulvaney, P. Synthesis of Nanosized Gold−Silica Core−Shell Particles. Langmuir 1996, 12, 4329–4335. [Google Scholar] [CrossRef]
- Lee, M.H.; Oh, S.G.; Suh, K.D.; Kim, D.G.; Sohn, D. Preparation of silver nanoparticles in hexagonal phase formed by nonionic Triton X-100 surfactant. Colloids Surfaces A Physicochem. Eng. Asp. 2002, 210, 49–60. [Google Scholar] [CrossRef]
- Velikov, K.; Zegers, G.; van Blaaderen, A. Synthesis and characterization of large colloidal silver particles. Langmuir 2003, 19, 1384–1389. [Google Scholar] [CrossRef]
- Sun, Y. Shape-Controlled Synthesis of Gold and Silver Nanoparticles. Science 2002, 298, 2176–2179. [Google Scholar] [CrossRef] [PubMed]
- Blatchford, C.G.; Campbell, J.R.; Creighton, J.A. Plasma resonance—Enhanced raman scattering by absorbates on gold colloids: The effects of aggregation. Surf. Sci. 1982, 120, 435–455. [Google Scholar] [CrossRef]
- De, S.; Pal, A.; Jana, N.R.; Pal, T. Anion effect in linear silver nanoparticle aggregation as evidenced by efficient fluorescence quenching and SERS enhancement. J. Photochem. Photobiol. A Chem. 2000, 131, 111–123. [Google Scholar] [CrossRef]
- Linnert, T.; Mulvaney, P.; Henglein, A. Surface chemistry of colloidal silver: Surface plasmon damping by chemisorbed iodide, hydrosulfide (SH-), and phenylthiolate. J. Phys. Chem. 1993, 97, 679–682. [Google Scholar] [CrossRef]
- Cui, Y.; Wei, Q.; Park, H.; Lieber, C.M. Nanowire Nanosensors for Highly Sensitive and Selective Detection of Biological and Chemical Species. Science 2001, 293, 1289–1292. [Google Scholar] [CrossRef] [PubMed]
- Cui, Y.; Lieber, C.M. Functional Nanosccale Electronic Devices Assemble Using Silicon Nanowire Building Blocks. Science 2001, 291, 851–853. [Google Scholar] [CrossRef] [PubMed]
- Sun, Y.; Xia, Y. Large-scale synthesis of uniform silver nanowires through a soft, self-seeding, polyol process. Adv. Mater. 2002, 14, 833–837. [Google Scholar] [CrossRef]
- Zhang, D.; Qi, L.; Yang, J.; Ma, J.; Cheng, H.; Huang, L. Wet Chemical Synthesis of Silver Nanowire Thin Films at Ambient Temperature. Chem. Mater. 2004, 16, 872–876. [Google Scholar] [CrossRef]
- Zeng, J.; Zheng, Y.; Rycenga, M.; Tao, J.; Li, Z.Y.; Zhang, Q.; Zhu, Y.; Xia, Y. Controlling the shapes of silver nanocrystals with different capping agents. J. Am. Chem. Soc. 2010, 132, 8552–8553. [Google Scholar] [CrossRef] [PubMed]
- Ozaki, M.; Kratohvil, S.; Matijević, E. Formation of monodispersed spindle-type hematite particles. J. Colloid Interface Sci. 1984, 102, 146–151. [Google Scholar] [CrossRef]
- Morales, M.P.; González-Carreño, T.; Serna, C.J. The formation of α-Fe2O3 monodispersed particles in solution. J. Mater. Res. 1992, 7, 2538–2545. [Google Scholar] [CrossRef]
- Johnson, C.J.; Dujardin, E.; Davis, S.A.; Murphy, C.J.; Mann, S. Growth and form of gold nanorods prepared by seed-mediated, surfactant-directed synthesis. J. Mater. Chem. 2002, 12, 1765–1770. [Google Scholar] [CrossRef]
- Suber, L.; Sondi, I.; Matijević, E.; Goia, D.V.D. Preparation and the mechanisms of formation of silver particles of different morphologies in homogeneous solutions. J. Colloid Interface Sci. 2005, 288, 489–495. [Google Scholar] [CrossRef] [PubMed]
- Campi, G.; Mari, A.; Amenitsch, H.; Pifferi, A.; Cannas, C.; Suber, L. Monitoring early stages of silver particle formation in a polymer solution by in situ and time resolved small angle X-ray scattering. Nanoscale 2010, 2, 2447–2455. [Google Scholar] [CrossRef] [PubMed]
- Wang, Z.L. Book Reprint Characterization of Nanophase Materials. Part. Part. Syst. Charact. 2001, 18, 142–165. [Google Scholar] [CrossRef]
- Campi, G.; Mari, A.; Pifferi, A.; Amenitsch, H.; Fratini, M.; Suber, L. Control of silver-polymer aggregation mechanism by primary particle spatial correlations in dynamic fractal-like geometry. Nanoscale 2011, 3, 3774–3779. [Google Scholar] [CrossRef] [PubMed]
- Liu, R.; Zhang, Y.; Zhang, S.; Qiu, W.; Gao, Y. Silver enhancement of gold nanoparticles for biosensing: From qualitative to quantitative. Appl. Spectrosc. Rev. 2014, 49, 121–138. [Google Scholar] [CrossRef]
- Suber, L.; Campi, G.; Pifferi, A.; Andreozzi, P.; La Mesa, C.L.; Amenitsch, H.; Cocco, R.; Plunkett, W.R. Polymer-assisted synthesis of two-dimensional silver meso-structures. J. Phys. Chem. C 2009, 113, 11198–11203. [Google Scholar] [CrossRef]
- Suber, L.; Plunkett, W.R. Formation mechanism of silver nanoparticle 1D microstructures and their hierarchical assembly into 3D superstructures. Nanoscale 2010, 2, 128–133. [Google Scholar] [CrossRef] [PubMed]
- Linnert, T.; Mulvaney, P.; Henglein, A. Photochemistry of Colloidal Silver Particles—The Effects of N2O and Adsorbed Cn-. Berichte Bunsenges. Phys. Chem. 1991, 95, 838–841. [Google Scholar] [CrossRef]
- Fukuyo, T.; Imai, H. Morphological evolution of silver crystals produced by reduction with ascorbic acid. J. Cryst. Growth 2002, 241, 193–199. [Google Scholar] [CrossRef]
- Hvoslef, J. The crystal structure of l-ascorbic acid, ‘vitamin C’. II. The neutron diffraction analysis. Acta Crystallogr. Sect. B Struct. Crystallogr. Cryst. Chem. 1968, 24, 1431–1440. [Google Scholar] [CrossRef]
Figure 1.
(a) SEM micrograph of silver flakes (bar size = 10 µm); (b) SEM micrograph of silver flat rods (bar size = 6 µm); (c) SEM image of tabular hexagonal silver particles deposited on a porous polycarbonate membrane. The sample is sputtered with gold. Inset: Tabular hexagonal particle showing gold nanoparticles covered with silver; (d) SEM micrograph showing the flakes formed by the flat rods (bar size = 3 µm).

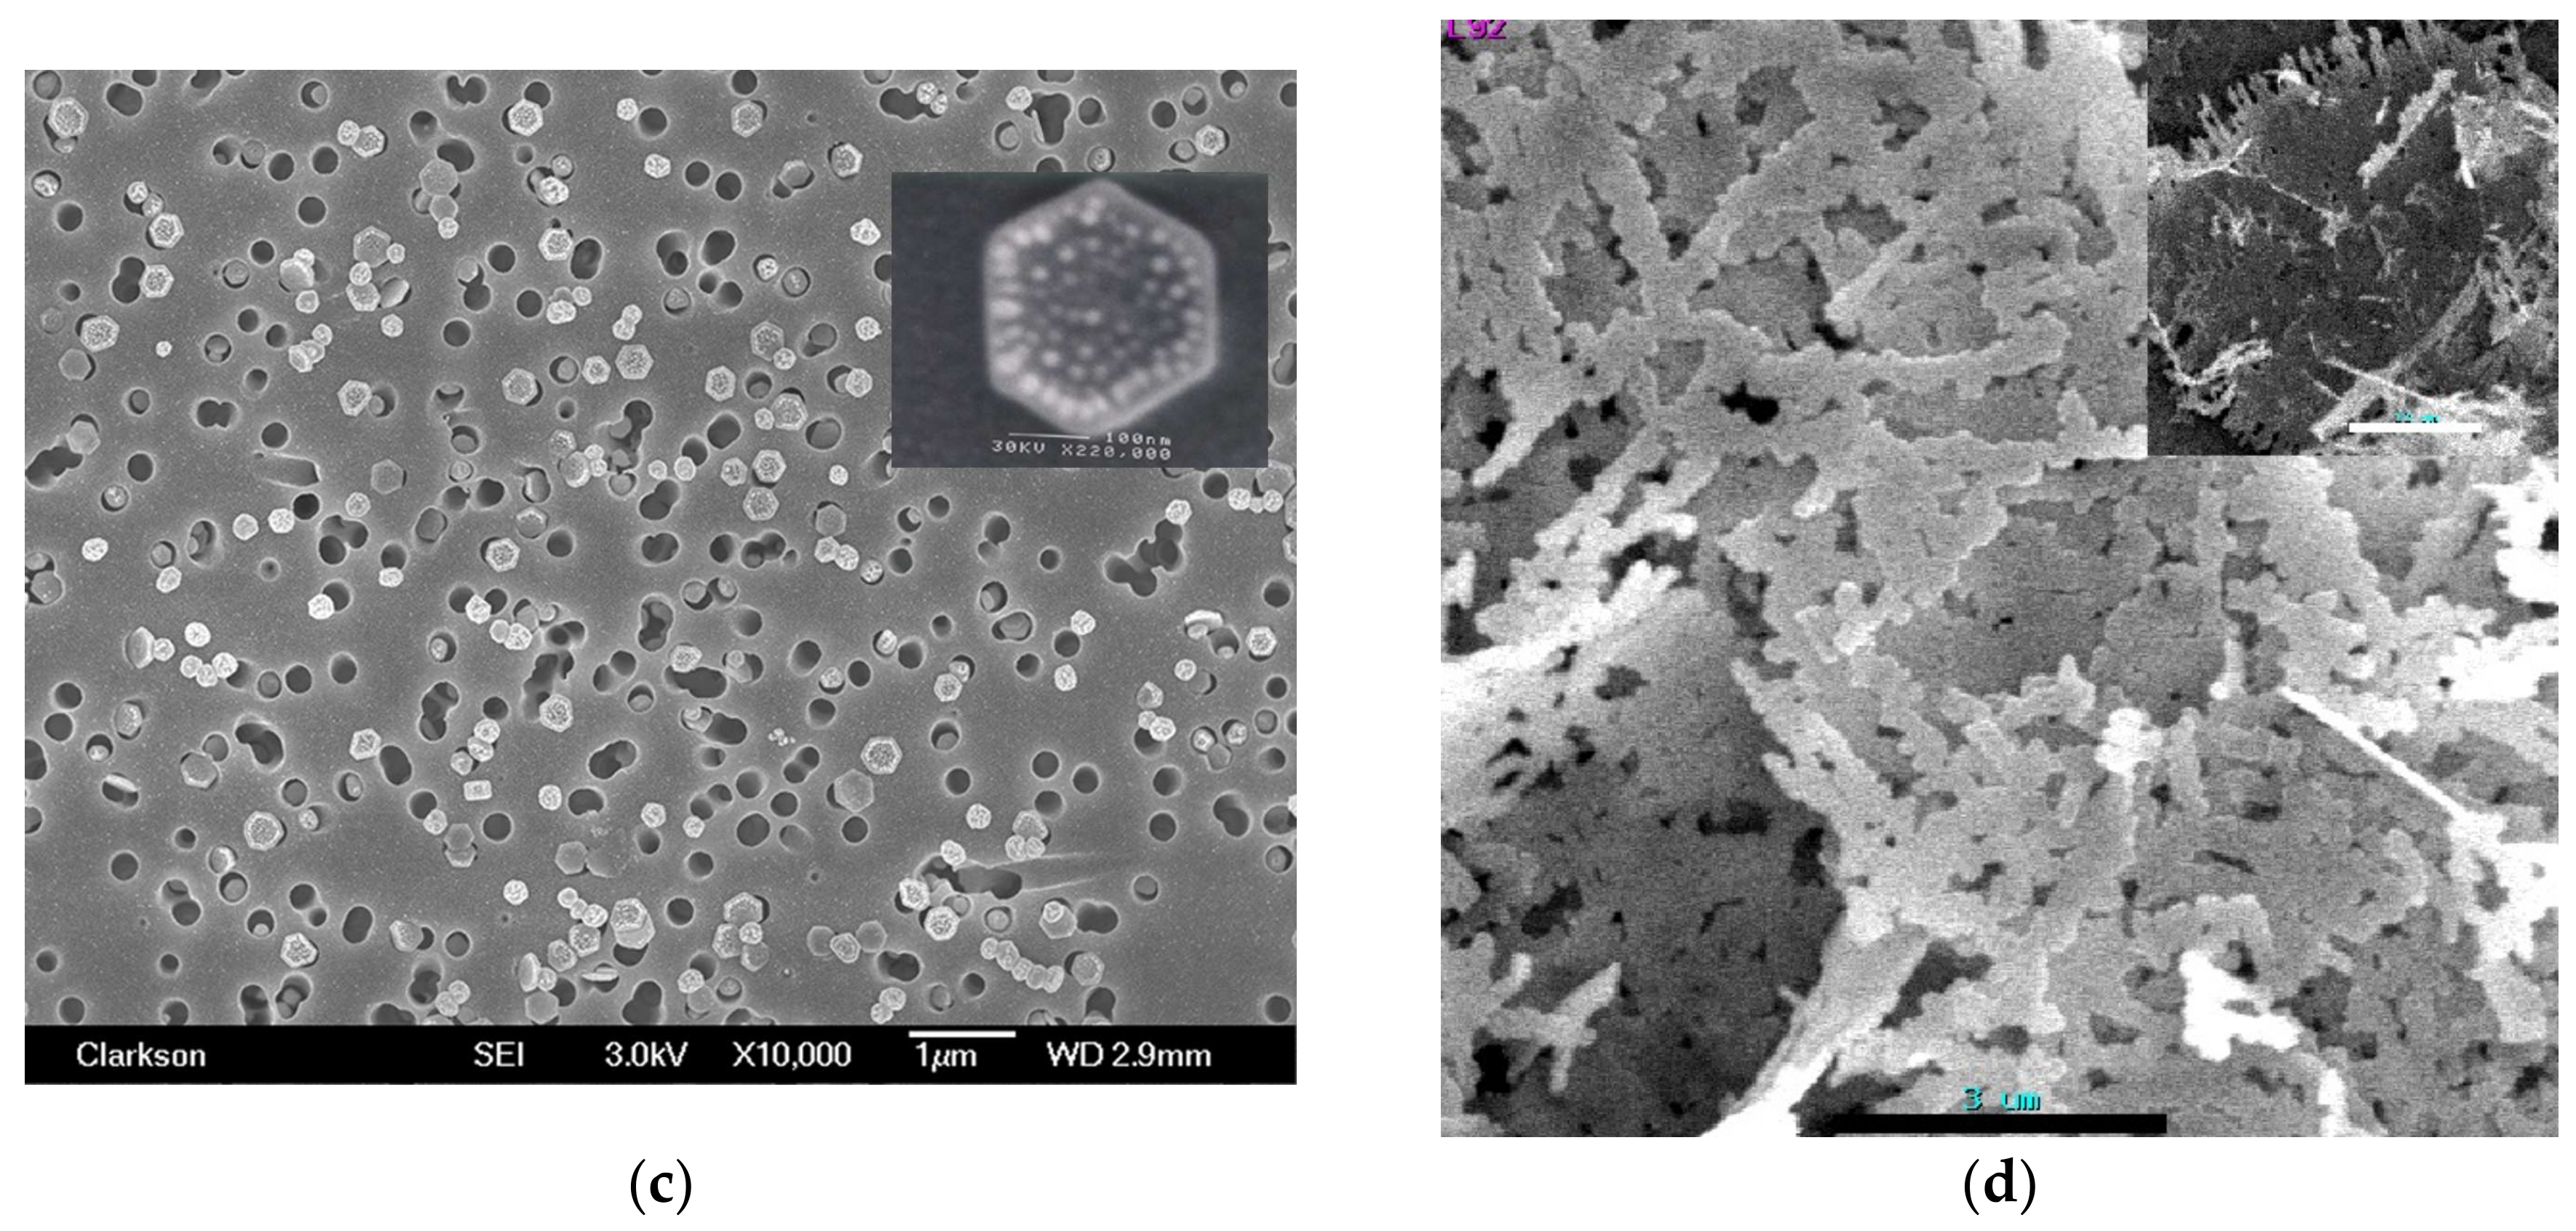
Figure 2.
ζ potential of hexagonal tabular silver particles in 10−3 mol dm−3 KCl solution as a function of pH.
Figure 2.
ζ potential of hexagonal tabular silver particles in 10−3 mol dm−3 KCl solution as a function of pH.
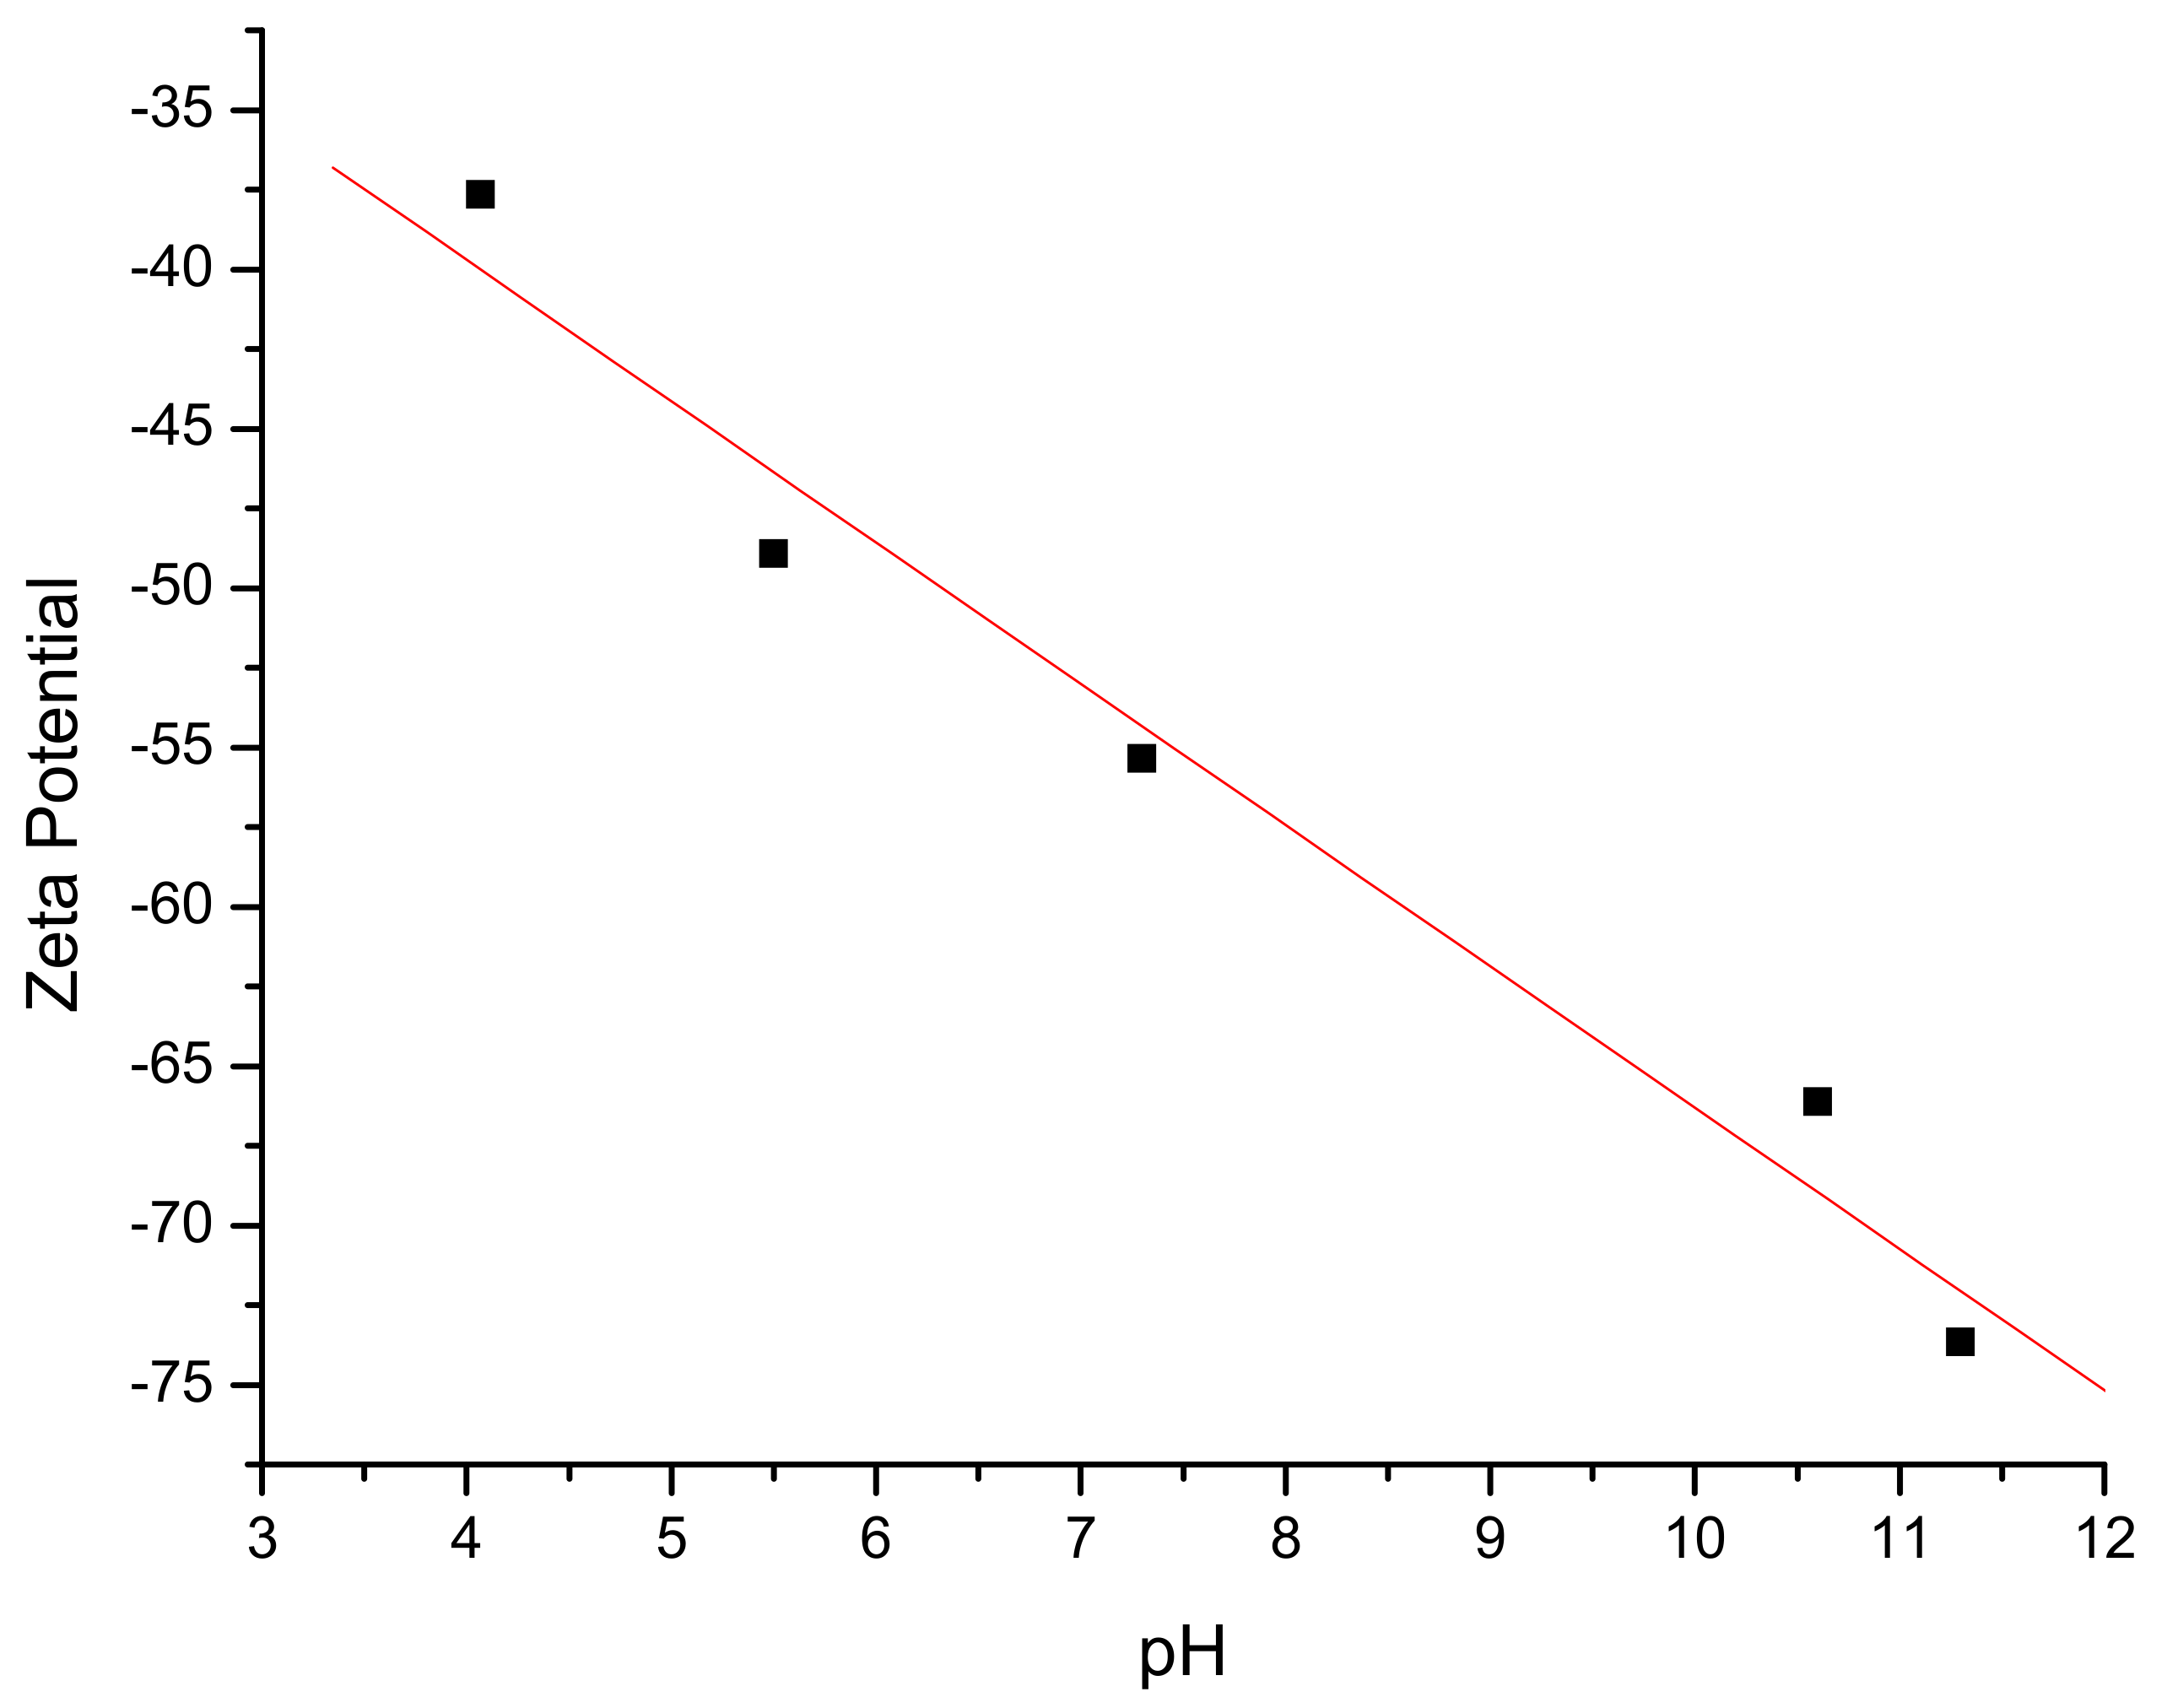
Figure 3.
FE-SEM micrograph of a hexagonal tabular silver particle with a thickness of about 20 nm. The sample was not sputtered with gold (bar size = 10 nm).
Figure 3.
FE-SEM micrograph of a hexagonal tabular silver particle with a thickness of about 20 nm. The sample was not sputtered with gold (bar size = 10 nm).
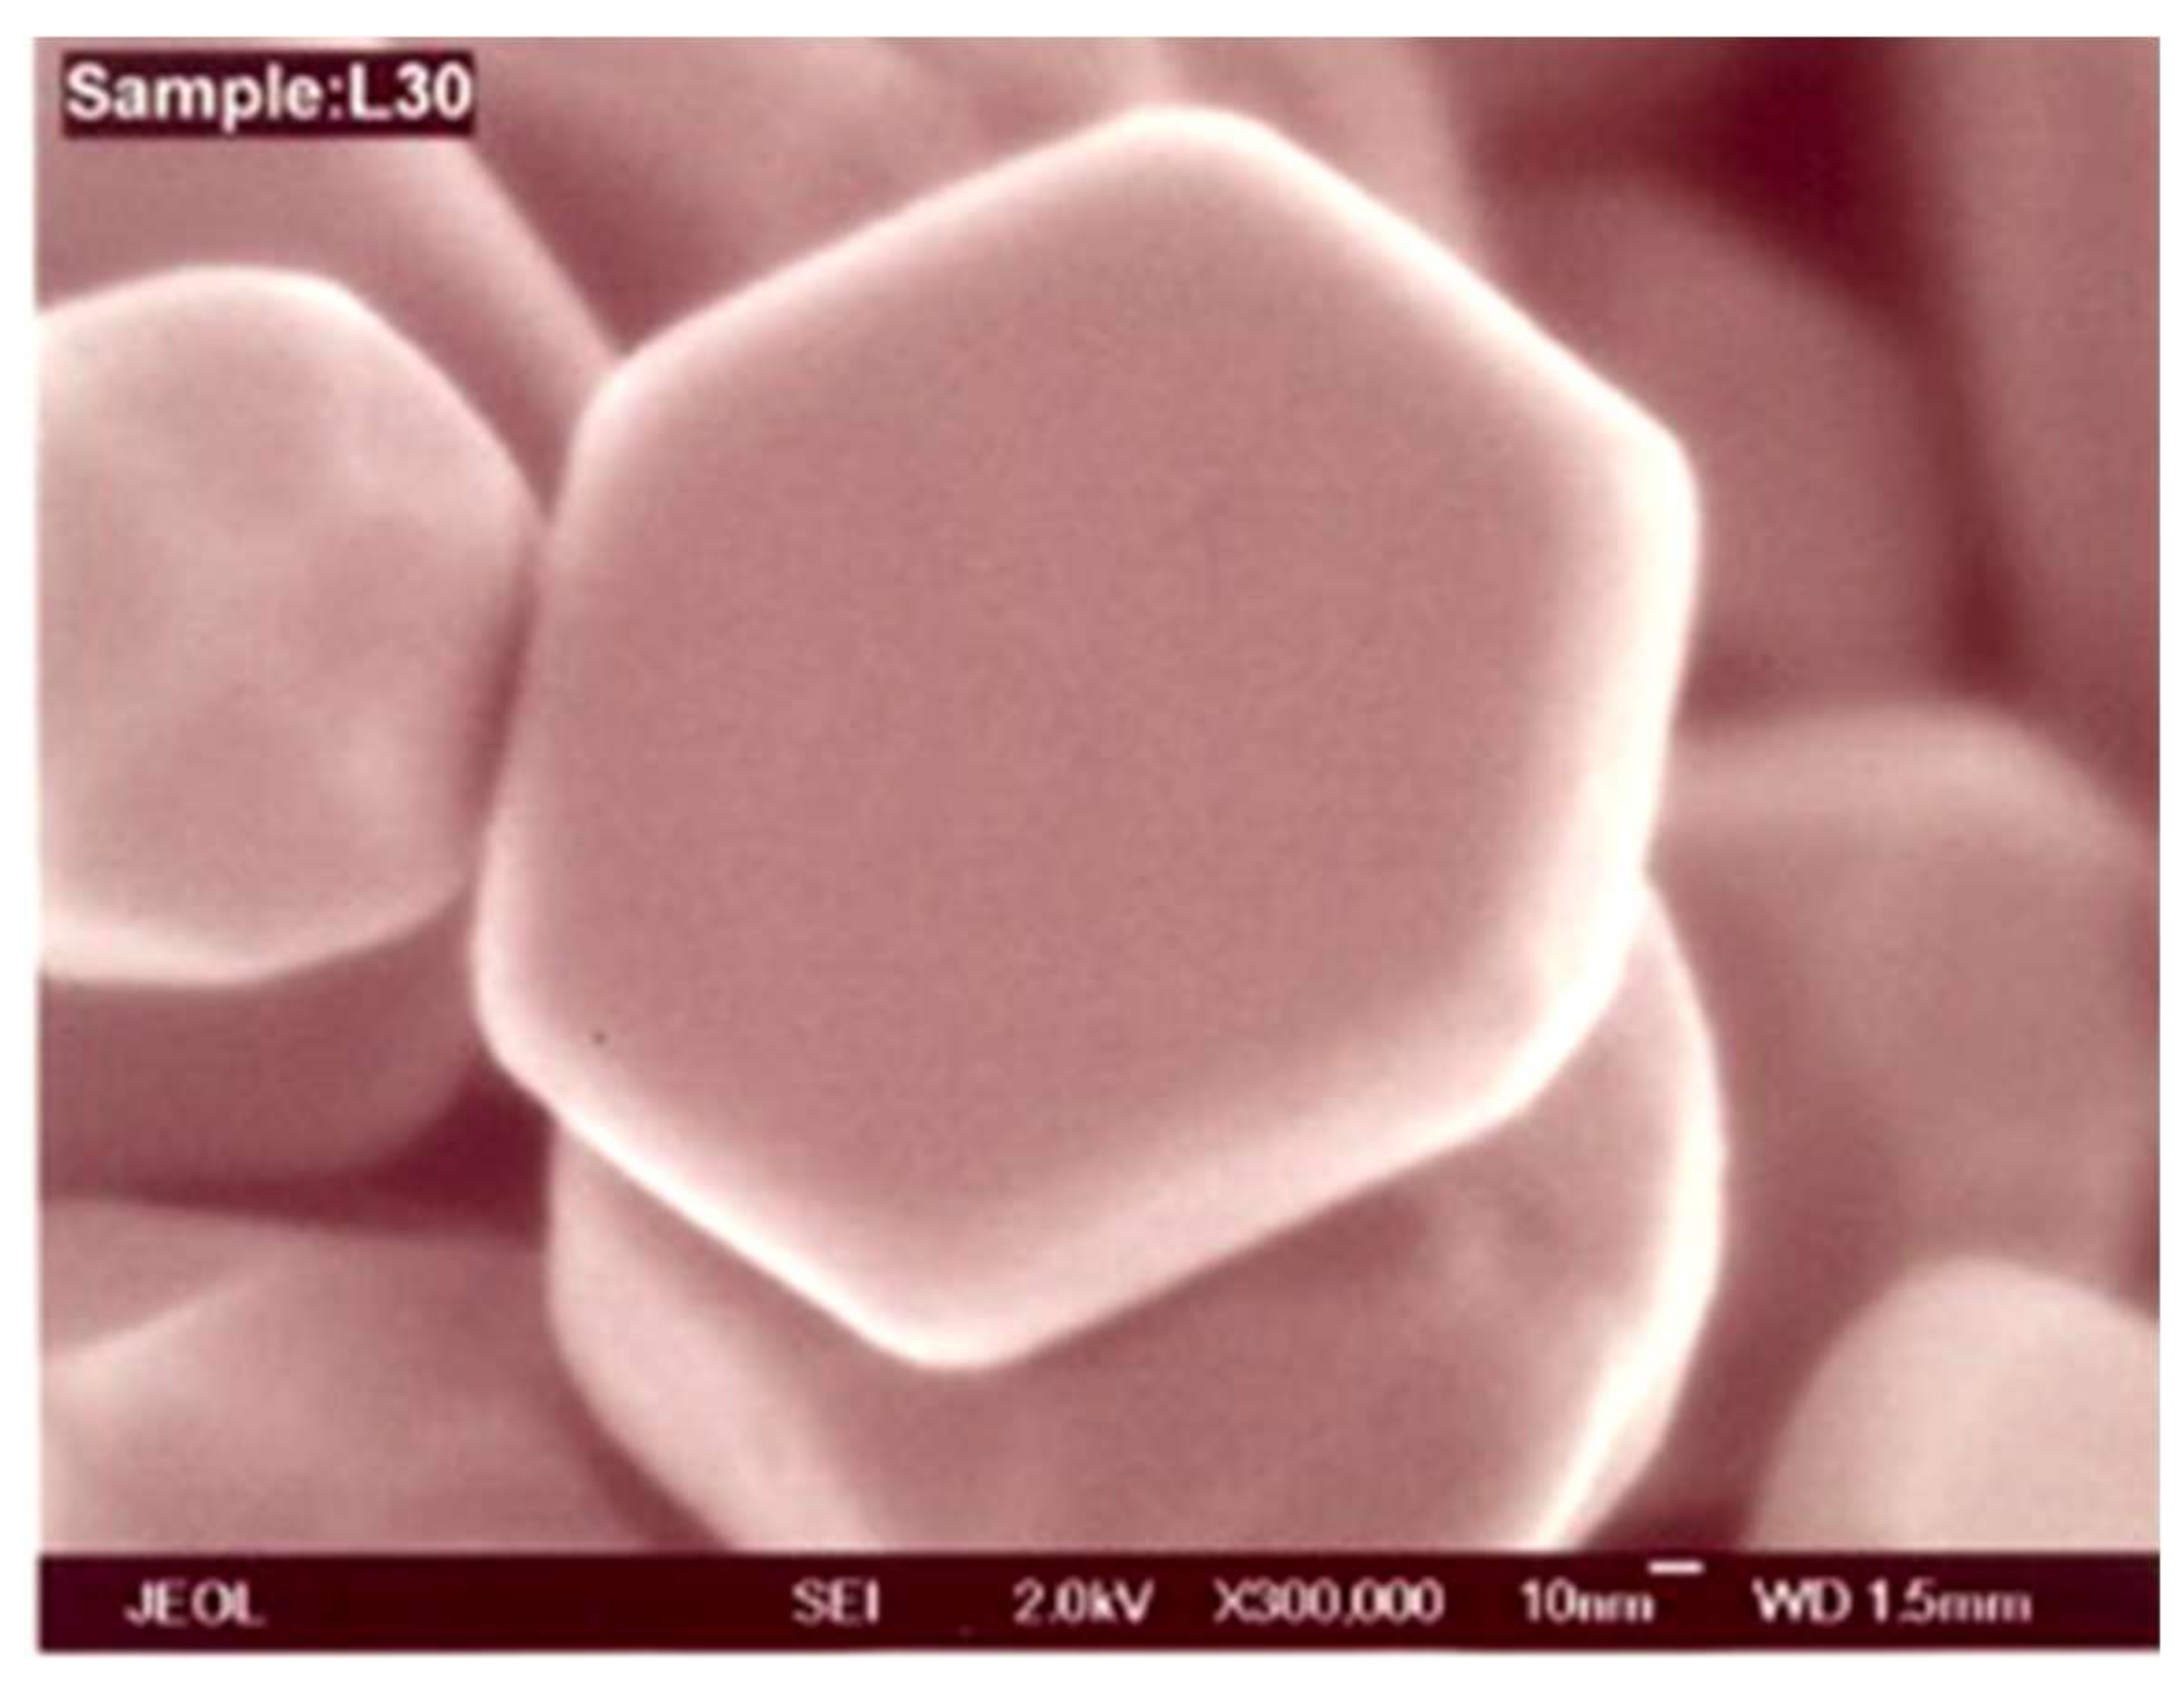
Figure 4.
X-ray diffraction (XRD) pattern of hexagonal tabular silver particles.

Figure 5.
SEM micrograph of polydispersed silver particles (bar size = 6 µm).
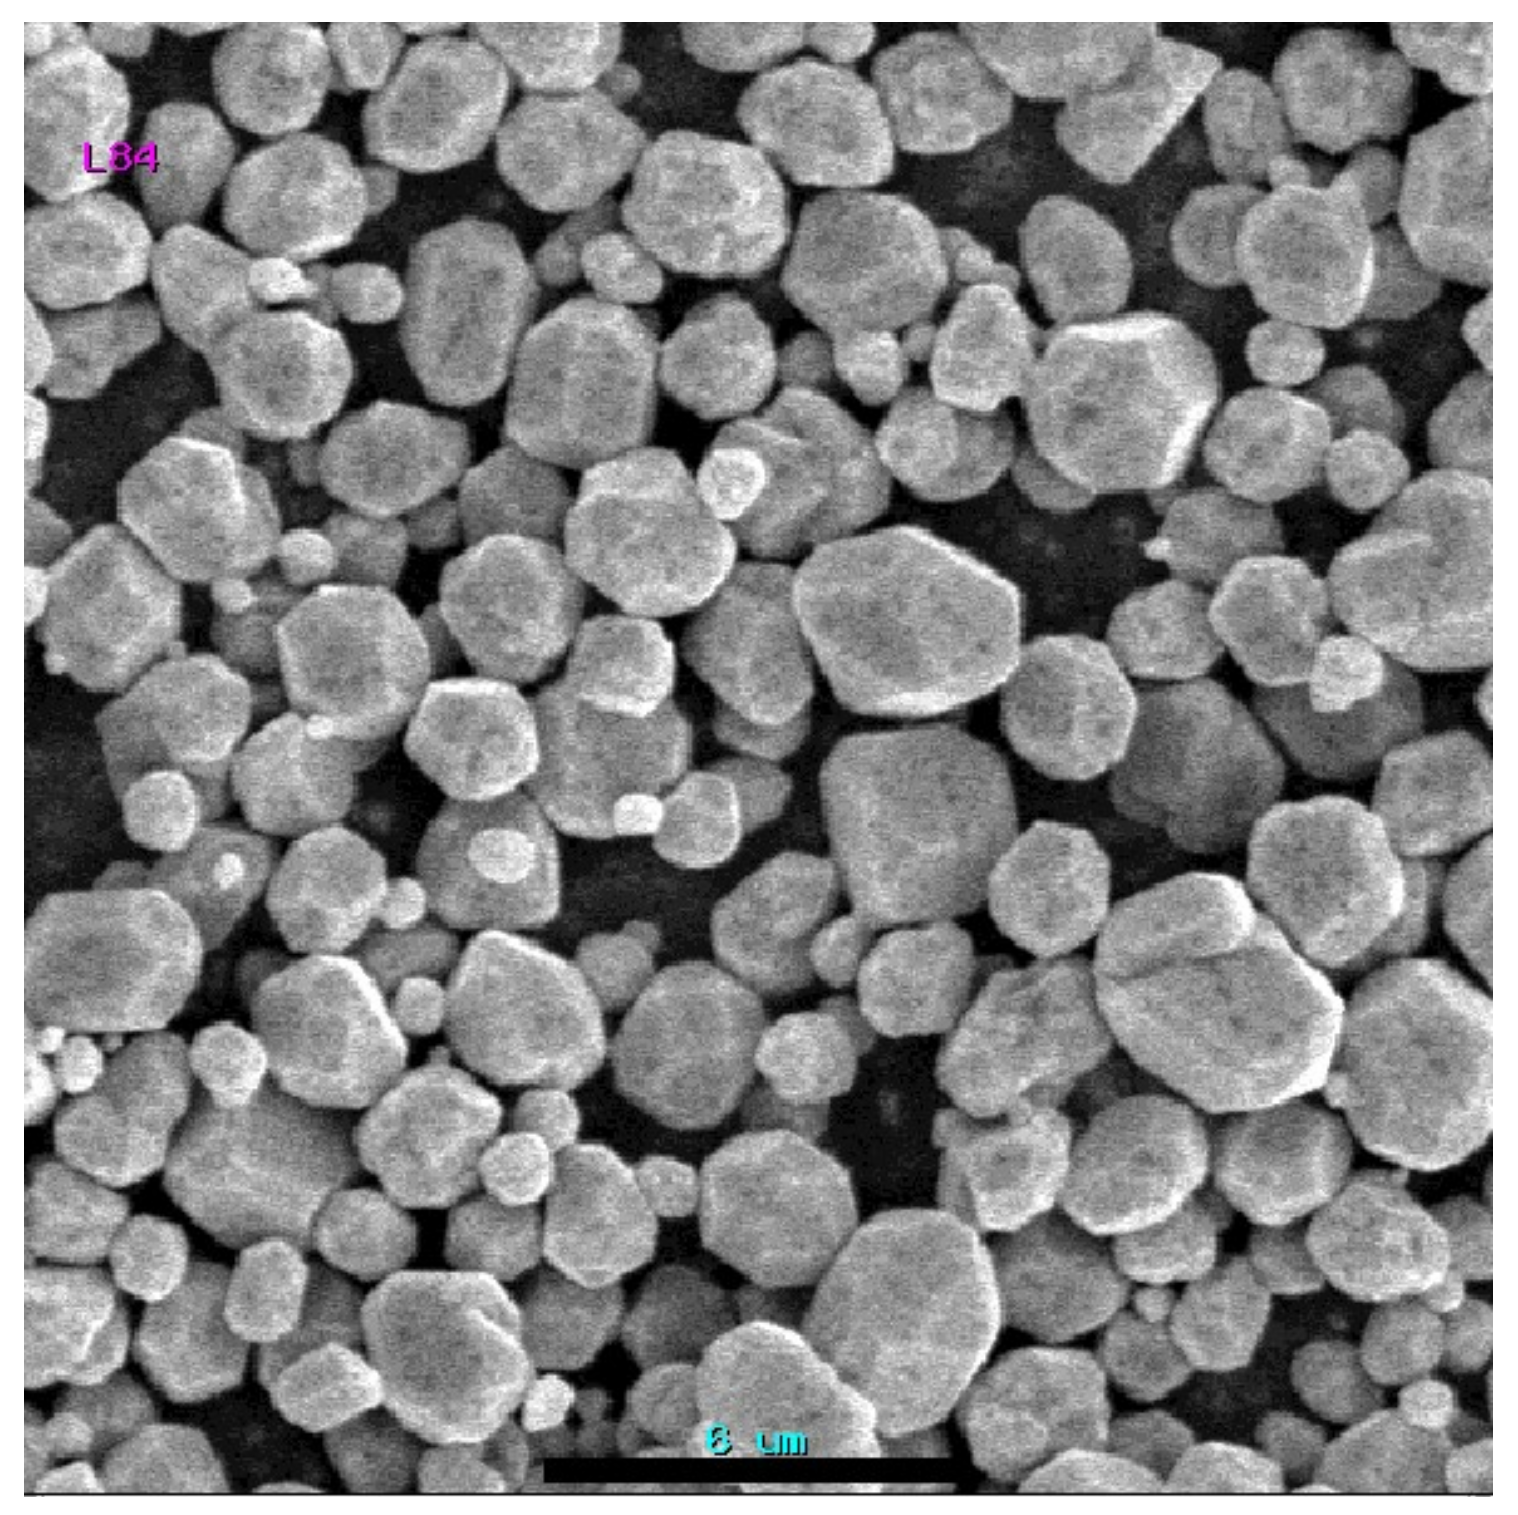
Figure 6.
(a) TEM image of tabular silver particles aggregated to form one-dimensional (1D) flat rods (bar size = 100 nm); (b) SEM image of the same process (bar size = 0.4 μm).
Figure 6.
(a) TEM image of tabular silver particles aggregated to form one-dimensional (1D) flat rods (bar size = 100 nm); (b) SEM image of the same process (bar size = 0.4 μm).
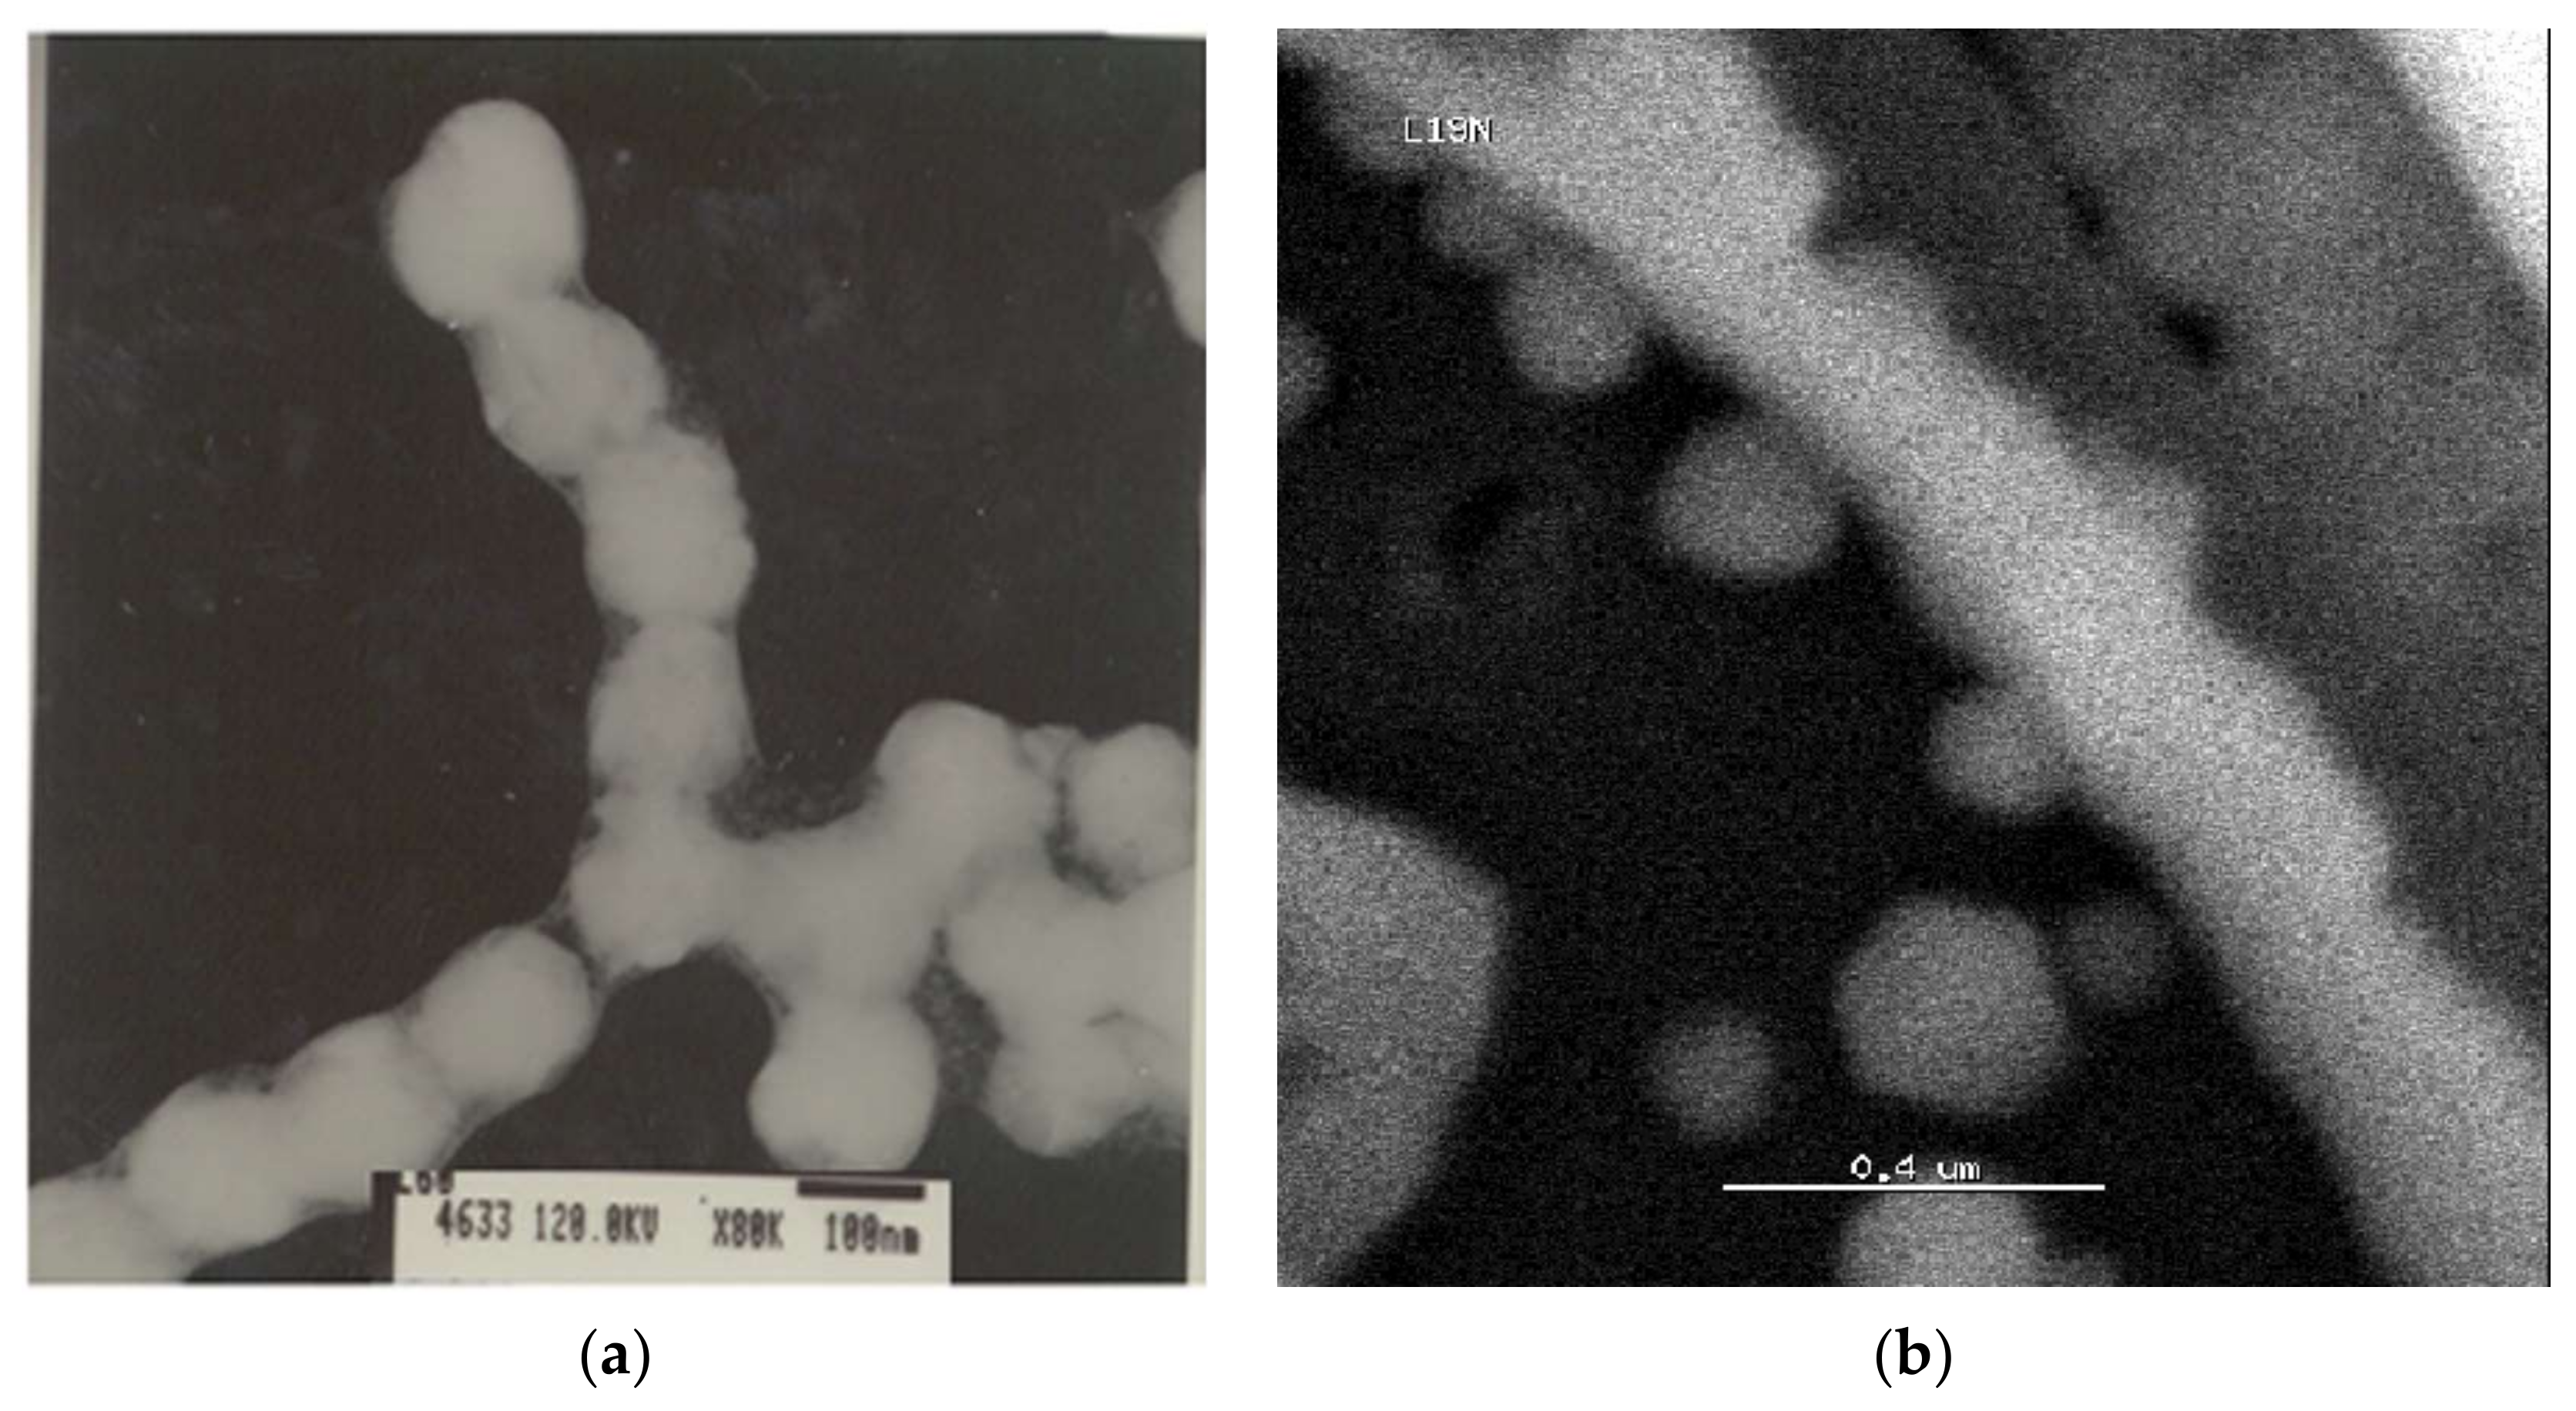
Figure 7.
Viscosity of the dispersion prior to the ascorbic acid addition (K = 1/T).

Figure 8.
SEM micrograph of aggregated hexagonal tabular silver particles obtained by increasing the ascorbic acid concentration (bar size = 0.7 μm).
Figure 8.
SEM micrograph of aggregated hexagonal tabular silver particles obtained by increasing the ascorbic acid concentration (bar size = 0.7 μm).

Table 1.
Experimental preparation conditions for samples 1–4 in relation to the different morphologies obtained.
Table 1.
Experimental preparation conditions for samples 1–4 in relation to the different morphologies obtained.
| Sample | 1 | 2 | 3 | 4 |
|---|---|---|---|---|
| T (°C) | 40 | 10 | 30 | 40 |
| t (min) | 60 | 60 | 60 | 10 |
| Ag Initial Conc. mol dm−3 | 0.2 | 0.2 | 0.2 | 0.02 |
| HNO3 mol dm−3 | 1.6 | 1.5 | 1.6 | 1.4 |
| Dispersant Initial Conc. g dm−3 | 4.9 | 4.9 | 5.4 | 5.2 |
| Dispersant/Metal Ratio | 1/4.4 | 1/4.4 | 1/3.6 | 2.4/1 |
| Asc Acid Fin. Conc. mol dm−3 | 0.18 | 0.19 | 0.19 | 0.16 |
| Vol Prior Reduction cm3 | 278 | 270 | 165 | 170 |
| Vol after Reduction cm3 | 308 | 300 | 183 | 185 |
| SEM TEM | Hexag. part 1 | Flat rods | flakesflakFl Flakes | Polydispersed particles 2 |
1 Part = Particles. 2 Largest particle size 0.6 µm (see Figure 6).
© 2018 by the author. Licensee MDPI, Basel, Switzerland. This article is an open access article distributed under the terms and conditions of the Creative Commons Attribution (CC BY) license (http://creativecommons.org/licenses/by/4.0/).
Share and Cite
MDPI and ACS Style
Suber, L. Formation and Oriented Aggregation of Tabular Hexagonal Silver Particles. Condens. Matter 2018, 3, 13. https://doi.org/10.3390/condmat3020013
AMA Style
Suber L. Formation and Oriented Aggregation of Tabular Hexagonal Silver Particles. Condensed Matter. 2018; 3(2):13. https://doi.org/10.3390/condmat3020013
Chicago/Turabian StyleSuber, Lorenza. 2018. "Formation and Oriented Aggregation of Tabular Hexagonal Silver Particles" Condensed Matter 3, no. 2: 13. https://doi.org/10.3390/condmat3020013