Optimization of Processing Conditions of Traditional Cured Tuna Loins–Muxama


1
Departamento de Engenharia Alimentar, Instituto Superior de Engenharia, Universidade do Algarve, 8005-139 Faro, Portugal
2
CCMAR, Centro de Ciências do Mar do Algarve, Universidade do Algarve, 8005-139 Faro, Portugal
3
CIMA-Centro de Investigação Marinha e Ambiental, Universidade do Algarve, 8005-139 Faro, Portugal
*
Author to whom correspondence should be addressed.
Fishes 2018, 3(1), 3; https://doi.org/10.3390/fishes3010003
Submission received: 11 November 2017
/
Revised: 3 January 2018
/
Accepted: 5 January 2018
/
Published: 9 January 2018
Abstract
:Muxama is a traditional highly-valued food product prepared from dry-cured tuna loins in southern Portugal and Spain. The production procedure has seen little change over the last centuries. The muxama’s stability is due to reduced water activity. In addition, the drying method has secondary effects on characteristics of flavor, color, and the nutritional value of the product. Our objectives were to describe the dynamics of important physicochemical parameters such as moisture content, water activity (aW), NaCl concentration (as water–phase salt, ZNaCl), pH and color, during the salting and drying stages of muxama production, and to test the effect(s) of changes in the traditional processing conditions followed in southern Portugal, aiming at optimizing the production procedure. The lowest values of moisture and aW and highest ZNaCl obtained after drying tuna loins for seven days at 20 °C exceeded the values reported for commercial products and have impact on the appearance (color) of the product. Therefore, drying tuna loins at lower temperatures (ca. 14 °C) is probably more appropriate. The results obtained in this study could be used in the design of future experiments at other conditions and to assess other quality parameters, e.g., total volatile base nitrogen (TVB-N), thiobarbituric acid reactive substances (TBA-RS), microorganism abundance and sensory attributes, and subsequent validation trials.
1. Introduction
Muxama (in Portugal), or mojama (in Spain), is a traditional, highly valued food product prepared from dry-cured tuna loins that is a delicatessen in the southern Iberian Peninsula: Algarve (Portugal) and Andalucía, Murcia, Alicante and Valencia (Spain). Its production process is slightly different among locations. These differences supported the application and recent registration of two Protected Geographical Indications (PGI), Mojama de Barbate [1] and Mojama de Isla Cristina [2], within the European Union’s quality schemes for agricultural products and foodstuffs [3] by two municipalities in Andalucia (Spain), namely Barbate and Isla Cristina. Muxama is one of numerous food products that can be obtained from a tuna at the end of the (traditional) quartering of specimens a.k.a. “ronqueamento” (or “ronqueo”) [4,5,6].
Succinctly, the tuna (mostly Thunnus obesus and T. albacares) loins are salted and dried according to a predominantly artisanal procedure that incorporates empirical knowledge passed down numerous generations since at least the tenth century [6] or even earlier. According to [4,5], native Iberians were already drying and salting fish, particularly tuna, in pre-Roman times (earlier than the second century B.C.) and during Roman rule over Hispania (until the fourth century). The practice was further developed by the Arabs during Al-Andalus (in the eighth and ninth centuries) [7,8]. The preparation of muxama involves a series of steps that are described in [4,6,7] and more recently in [9]. The production process changed little over the years but today the tuna used in the production of muxama is fished elsewhere and arrives frozen to the plants [4,10] instead of being fished using an “armação” (or “almadrava”), an off-shore maze of bottom-fixed nets to imprison, capture and hold the fish [11].
Drying is one of the earliest known means of preserving food [12,13,14], namely fish and other seafood. A preparatory dry salting or brining stage usually precedes it and the stability of the end-product derives from the reduced water activity and, in some products, lowered pH. In addition, the drying method has secondary effects on characteristics of flavor, color, and the nutritional value of the products [14,15]. A number of authors have studied and/or reviewed the salting and drying process of fish and other seafood and its effects on various quality parameters of the final products, e.g., [13,16,17,18,19,20,21,22,23,24,25]. In what concerns muxama, Barat and Grau [10] observed a clear shortening of the processing time required to obtain muxama with the simultaneous brine thawing and salting of frozen tuna loins.
Our objectives were to describe the dynamics of important physical-chemical parameters such as moisture content, water activity (aW), NaCl concentration (as water-phase salt and ratio of NaCl incorporation during drying), pH and color, during the salting and drying stages of muxama production and to test the effect(s) of changes in the traditional processing conditions followed in southern Portugal (Algarve), aiming at optimizing the production procedure.
2. Results
In Experiment I, the incorporation of salt in tuna loins was accompanied by water loss (Figure 1a–c). Notwithstanding, the patterns of these processes along the salting period were quite different for the outer, exterior (Ext.) portions when compared to the center, interior (Int.) portions. Differences were more prominent for the diffusion of NaCl that followed a sigmoidal, logistic model in the case of interior portions instead of the expected hyperbolic behavior of Fickian diffusion processes found in exterior portions of the loins (Figure 1a). Initially, salt was incorporated and water was diffused out of the loins at higher rates in the case of exterior portions (Figure 1a,b). In contrast, the distance corresponding to the outer portion is responsible for a delay in the increase of water-phase salt (ZNaCl), about 10 h (Figure 1a). These changes in ZNaCl were statistically modelled using the Zugarramurdi and Lupin [26] model for the exterior portions and the three-parameter logistic model for the interior portions (Table 1). In addition, the final NaCl concentration was higher and the moisture content and water activity were substantially lower for exterior portions than for interior portions of the loins (Figure 1a–c).
Changes in portions’ pH were readily visible and displayed a similar behavior but were slightly higher in the interior portions throughout the salting period (Figure 1). A two-compartment exponential model fitted the data for exterior and interior portions of “loins” during salting (Table 1). Generally, the pH decreased along the experiment, especially during the first hours of salting.
The physical-chemical changes related to the diffusive processes of salt intake and water loss were accompanied by changes in appearance, namely color (Figure 2), that were similar in exterior and interior portions of tuna loins in terms of plain L*, a* and b* but not in terms of composite color parameters, particularly chroma and saturation. Despite the observed variability, values of L* and a* decreased in interior portions of loins whilst they remained stable in exterior portions. In addition, the changes in chroma and saturation were more obvious in interior portions, which peaked after about 12–16 h salting time.
When studying the drying stage of the traditional process of producing muxama (Experiment II), data on moisture, aW, NaCl content (as ZNaCl and ratio of NaCl incorporation during drying, RNaCl), and color (Commission Internationale de l’Éclairage CIE L*a*b* and derived parameter) was also obtained at important milestones: fresh, raw material; just after salting; and following the drying stage.
Moisture and water activity decreased from 59.53 g·100 g−1 (±4.02 g·100 g−1) and 0.971 (±0.034), respectively, in fresh tuna loins to 48.74 g·100 g−1 (±3.04 g·100 g−1) and 0.759 (±0.007) in loins after 24 h dry salting. In contrast, the water-phase NaCl content (ZNaCl) increased from negligible value of 0.0003 to about 0.21 just after salting (i.e., 0.06 g·100 g−1 to 11.7 g·100 g−1). In terms of color, CIE L*a*b* parameters were L* = 37.8 (±0.58), a* = 5.16 (±0.66) and b* = 1.87 (±0.57) for fresh loins and L* = 36.2 (±0.71), a* = 5.01 (±0.71) and b* = −0.59 (±0.79) for salted loins. The further effects of temperature (14 and 20 °C) and time (four and seven days) of the subsequent drying stage on those parameters and other, derived parameters were studied in the context of a two-level factorial experiment. The analysis of variance (ANOVA) results are compiled in Table 2.
The ANOVA models’ goodness of fit is good, particularly for the chemical variables for which adjusted-R2 >0.80, and their predictive power is quite reasonable (the difference between adjusted- and predicted-R2 was less than approximately 0.10, except for aW) considering the simple experiment that originated the data.
Except for a* and Hue angle (Hab), all other variables were affected by the temperature and the duration of the drying stage (Figure 3 and Figure 4). The combination of high(er) temperature-long(er) time contributes to significantly decrease moisture content and aW and to increase NaCl content (in terms of ZNaCl and RNaCl). The additive effects of temperature and time were unique to moisture and ZNaCl.
The moisture content (H) and aW at the end of drying were significantly lower (28–32 g·100 g−1 and 0.70–0.73, respectively) compared to values obtained just after salting, particularly for loins dried for seven days at 20 °C (H = 26 g·100 g−1 and aW = 0.707).
Moreover, during drying there was a significantly increase the NaCl content, by 2.5–4-fold the concentration determined after 24 h salting (RNaCl), mainly in the case of samples dried for 7 days at 20 °C. The final NaCl concentration (in terms of ZNaCl) was 0.15–0.16. Temperature and time also affected other variables in a multiplicative way, i.e., there were significant interaction effects. Color changes were readily visible along the drying of loins, that were conveyed in the significant difference found in color difference (ΔE) and chroma/saturation values among treatments. At higher temperature, the loins were significantly darker after the longer period of drying (seven days) in contrast to what was found for the loins dried only four days. Unexpectedly, no significant changes were found for parameter a*, i.e., in terms of redness, with the loins remaining reddish throughout the drying stage.
3. Discussion
The incorporation of salt was accompanied, as expected [15], by water loss in Experiment I. In fact, salting is basically a sodium and chloride transport by a diffusion mechanism induced by differences in concentrations and osmotic pressures among inter-cells and salting agent [10,13]. Notwithstanding, the observed patterns of these processes were distinct for the exterior and interior portions of the loins.
On one hand, the diffusion length of water and solutes involved in mass transport are supposed to affect the osmotic concentration behavior. Moreover, the rate of salt uptake by food diminishes when equilibrium between the concentration in the salt medium and the food matrix is attained [24]. Hence, the distinct behaviors of salt uptake observed in exterior and interior portions. In addition, the higher solid gain at/near the surface and consequent formation of a solute layer was probably the cause of decreased water loss in interior portions, due to a reduction of diffusion [24]. On the other hand, the results might also reflect the fact that frozen–thawed tuna was used herein, since the resultant flesh characteristics and cell structure affect salt diffusion [16,24].
Furthermore, the pH is expected to affect salting of fish via its effect upon ions (Cl−) diffusion and water loss and ultimately osmotic equilibrium [28] due to alterations in the selective permeability of cell membranes. The pH in fresh tuna determined in this study, 5.9–6.0, is consistent with published results [29,30]. Gallart-Jornet et al. [7] reports a pH of 5.8 in muxama; close to the values found herein. In contrast, Lã and Vicente [4] found that the pH of muxama from southeastern Algarve (Portugal) was 7.10, higher than that of fresh tuna (5.72), but the authors do not provide an explanation for that result.
We modeled the changes in the abovementioned physical-chemical parameters of tuna loins during the dry-salting stage of the production process using simpler and/or general equations (Table 1) than those published (e.g., [10]). In contrast, we decided not to model the changes observed in the values of color parameters considering the observed variability but values of L* and a* decreased in interior portions of loins while remaining relatively constant in exterior portions and chroma and saturation peaked after 12–16 h of drying.
In Experiment II, we studied the drying stage of the traditional process of muxama production. The values of moisture content and aW obtained at the end of the drying stage, particularly for loins dried for 7 days at 20 °C, are lower than values of moisture of muxamas reported by Lã and Vicente [4] and Gallart-Jornet et al. [7], 47–50 g·100 g−1, and aW measured by Gómez et al. [31] in samples of muxama from Spain, 0.851, and by Lã and Vicente [4] in muxamas from Vila Real de Santo António (southeast Algarve, Portugal), 0.79. Most likely, this was due to a relatively shorter/minimal desalting stage in our experiment that contributed to prolonging salt incorporation/water loss during the following drying stage. The relatively low aW contributes to stability of the product since it is expected to inhibit the development of a number of (pathogenic) microorganisms [28].
The removal of water and the continued penetration of the remaining salt during the drying trials contributed to significantly increase the NaCl content. The final NaCl concentration (in terms of ZNaCl) was in line with values reported by Lã and Vicente [4], approximately 10% (i.e., ZNaCl of about 0.17), and by Gallart-Jornet et al. [7], 7–8 g·100 g−1 (ZNaCl of 0.13–0.14) for marketed muxamas.
In addition, color changes were readily visible during the drying of loins. The changes were expressed as significant differences found in ΔE and chroma/saturation values among treatments. The values of ΔE calculated herein are greater than 2.3, a value stated as the just noticeable difference [32]. Seemingly, these composite color parameters reflected the changes in L* but not in a*. The color changes might be the result of browning reactions taking place in association with water removal thru drying and lipid oxidation favored by NaCl. Notwithstanding, according to EU Implementation Regulations 2015/2110 and 2016/199 [1,2], muxama is expected to be dark brown on the outside and deep red on the inside. When cut, it shows varying darker shades at the edges.
4. Materials and Methods
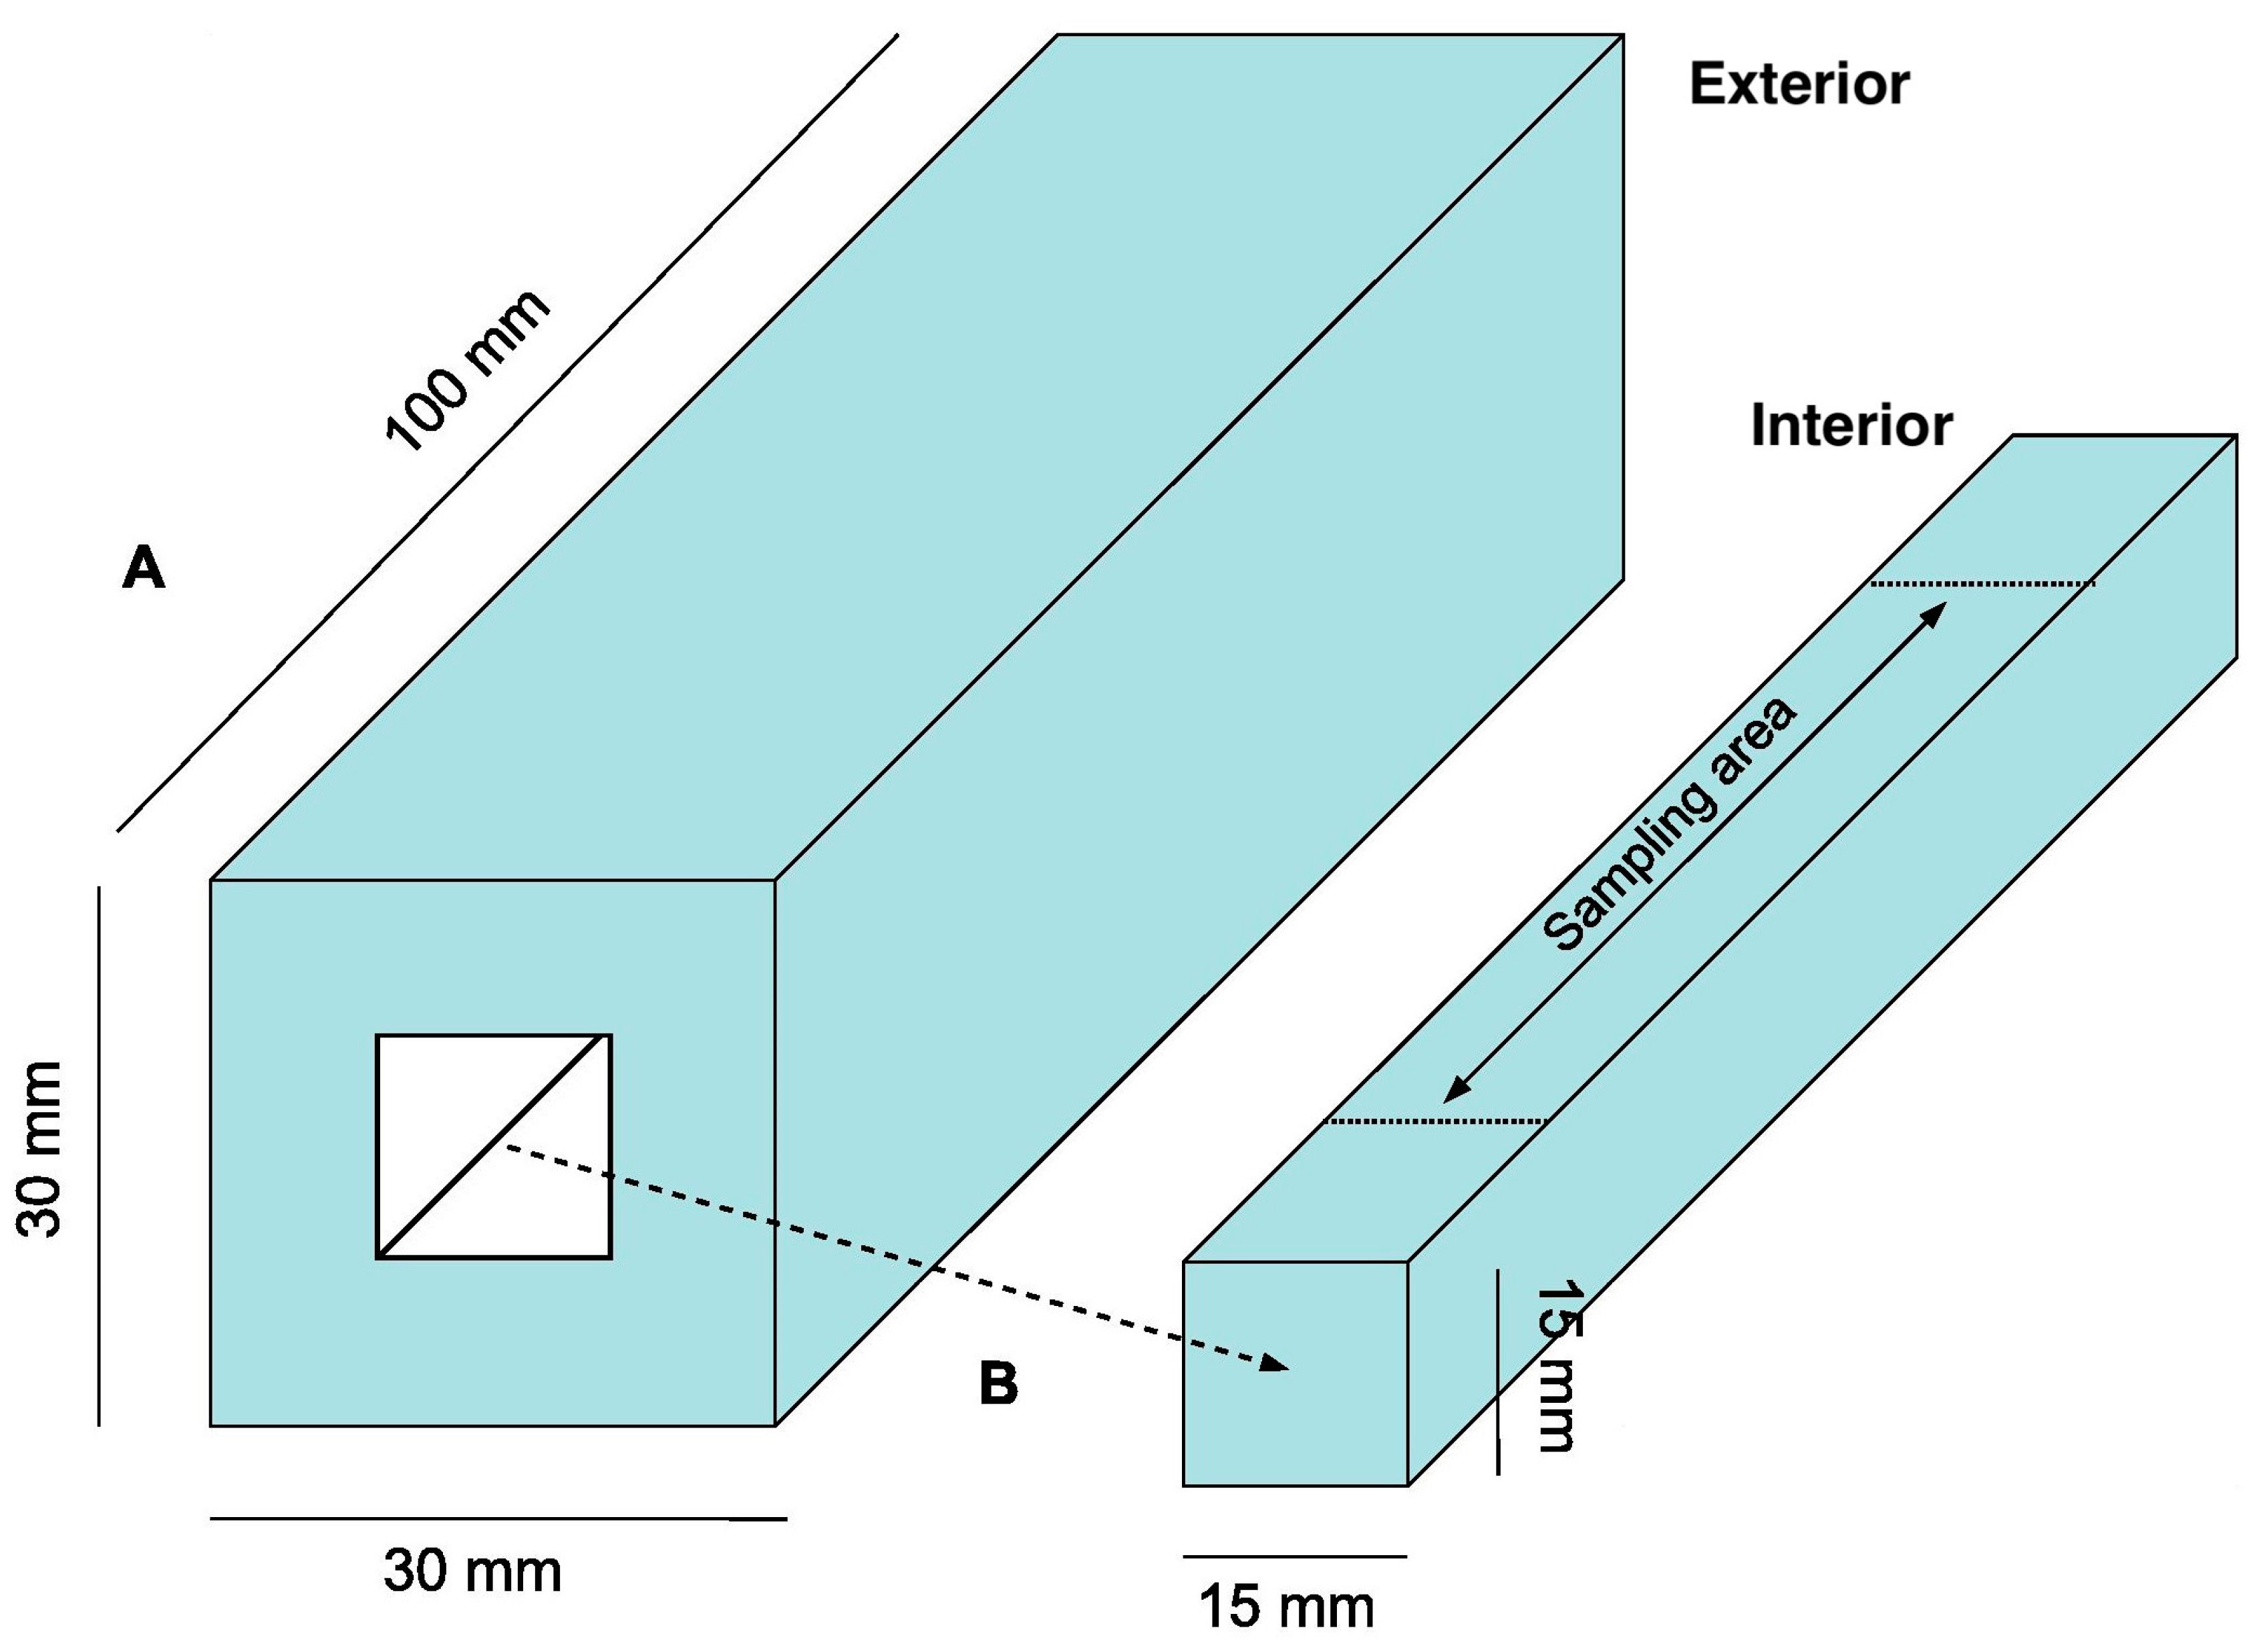
Tuna loin replicates (30 × 30 × 100 mm, Figure 5) mimicking the parallelepiped-shape and size-proportion of actual tuna loins were used herein. These loins were prepared from fresh tuna (Thunnus sp.) loins acquired at the fish market in Faro (Algarve, Portugal) and frozen using a blast and fluid bed freezer (Armfield Ltd., Ringwood, England) until core temperature reached −20 °C. Before each experiment, stored frozen loins were thawed (overnight) in air inside a walk-in cooler at 4 °C until a core temperature of 0 °C was attained.
Two distinct, successive experiments were carried out, each conducted once with n = 2 per sampling time. Experiment I: To study the dynamics of salting, ten loins were stacked in alternating layers of fish and solid salt (1:1 w/w) in a polystyrene box for up to 24 h. Two loins were sampled at the start of the experiment (0 h) and after 2.5, 5, 10 and 24 h of dry-salting. From each loin, the inner, center portion was separated from the outer, exterior section (Figure 5). The concentration of NaCl, the aW, moisture content (g·100 g−1) and pH were determined for the two portions (in duplicate) using respectively, a chlorides-selective probe (Crison, Barcelona, Spain) connected to a potentiometer (Crison), an aW-meter (Rotronic HygroLab 3, Bassersdorf, Switzerland), and a pH-meter (Crison). NaCl concentration was handled herein as water–phase salt concentration, where XNaCl is the concentration of NaCl (g·100 g−1) and XW is the moisture content (g·100 g−1), because salt content is meaningful for sensory perception and to favor (deleterious) enzymatic or bacterial reactions when in solution [16,33]. Moreover, color measurements (6 per loin) were carried out directly on the samples using a tri-stimulus colorimeter (Hach Lange Spectro-Color, Dusseldorf, Germany) and the CIE L*a*b* color scale (Commission Internationale de l’Éclairage CIE, Vienna, Austria). Composite color descriptors, color difference (ΔE), chroma (C), saturation (Sab) and Hue angle (Hab), were derived from CIE L*a*b* parameters [32,34].
Experiment II: To study the drying stage of muxama production, loins were stacked in alternating layers of fish and solid salt (1:1 w/w) in a polystyrene box for 24 h and then hanged to dry in a Fitoclima S600 chamber (aralab, Rio de Mouro, Portugal) at a relative humidity of 60% with controlled temperature (14 and 20 °C) for 4 or 7 days. Moisture content (g·100 g−1), aW, NaCl content and color were determined in two loins sampled at the start (0 h, fresh), after dry salting (24 h, salted) and at the end of the experiment (4 or 7 days) for each of the two temperatures tested (14 and 20 °C). The NaCl content was considered herein as ZNaCl and as the ratio of NaCl incorporation during drying, , where is the concentration of NaCl (g·100 g−1 dry basis) at the end of drying and is the moisture content (g·100 g−1 dry basis) after 24 h salting.
The changes in physical-chemical parameters, namely moisture, aW, pH and color parameters, along the salting process (Experiment I) were modeled using appropriate functions via standard non-linear least squares procedures [35] and goodness of fit was assessed using pseudo-R2, , where SSE is the sum of squared residuals and SST is the (corrected) total sum of squares. Randomness and normality of residuals was tested using runs and Shapiro–Wilk tests, respectively. Model selection was based upon Akaike’s Information Criterion (AIC) [36,37]. In Experiment II, the results were analyzed using ANOVA in the context of a 2-level factorial experimental design with factors temperature (14 and 20 °C) and time (4 and 7 d). Predictive, regression-like equations were derived from ANOVA and their usefulness assessed by computing adjusted- and predicted-R2. Statistical procedures were carried out at the 0.05 level of significance using package nlstools [38] in R [39] for the modeling approach and Design-Expert for Windows (Stat-Ease Inc., Minneapolis, USA) for experimental design and analysis.
5. Conclusions
We modeled the changes in physical-chemical parameters of tuna loins along the dry-salting stage (in Experiment I) using simple or general equations. Moreover, after Experiment II we were able to derive predictive equations that can be used to estimate the parameters of interest (moisture, aW, ZNaCl and color—except for a* and Hab) by plugging in values of temperature and time in the appropriate range (Table 2). The lowest values of moisture and aW and highest ZNaCl were obtained after drying tuna loins for seven days at 20 °C but they exceed the values reported for commercial products, 35–50% relative moisture, aW around 0.89 and ZNaCl of 0.12 [7], and have impact in the appearance (color) of the product. A relatively short/minimal desalting stage and longer drying period at higher temperature likely contributed to prolonging salt incorporation/water loss. Thus, lower drying temperatures (about 14 °C) are probably more appropriate. The results obtained in this study show a good chance of being successfully used in the design of future experiments at other conditions and assessing other quality parameters, e.g., total volatile base nitrogen (TVB-N), thiobarbituric acid reactive substances (TBA-RS), abundance of microorganisms and sensory attributes, as well as subsequent validation trials.
Supplementary Materials
The following are available online at www.mdpi.com/2410-3888/3/1/3/s1, muxama1.csv: dataset of experiment I, muxama2.csv: data set of experiment II.
Acknowledgments
Teresa Cavaco helped in the salting experiment. This study received national funds from FCT—Foundation for Science and Technology (Portugal) through project UID/Multi/04326/2013 (E.E.) and grant UID/MAR/00350/2013 (J.A.).
Author Contributions
E.E. and J.A. conceived, designed and carried out the experiments, analyzed the data and wrote the paper.
Conflicts of Interest
The authors declare no conflict of interest.
References
- European Commission. Commission Implementing Regulation (EU) 2015/2110 of 12 November 2015 entering a name in the register of protected designations of origin and protected geographical indications [Mojama de Barbate (PGI)]. In Official Journal of the European Union, L 306; Eur-Lex: Brussels, Belgium, 2015; pp. 1–2. [Google Scholar]
- European Commision. Commission Implementing Regulation (EU) 2016/199 of 9 February 2016 entering a name in the register of protected designations of origin and protected geographical indications (Mojama de Isla Cristina (PGI)). In Official Journal of the European Union, L 39; Eur-Lex: Brussels, Belgium, 2016; p. 1. [Google Scholar]
- The European Parliament and the Council of the European Union. Regulation (EU) No. 1151/2012 of the European Parliament and of the Council of 21 November 2012 on quality schemes for agricultural products and foodstuffs. In Official Journal of the European Union, L 343; Eur-Lex: Brussels, Belgium, 2012; pp. 1–29. [Google Scholar]
- Lã, A.; Vicente, L. O Atum Esquecido; Universidade do Algarve: Algarve, Faro, 1993. [Google Scholar]
- Yubero, I.D. Sabores de Andalucía. Distrib. Consum. 2008, 101, 116–125. [Google Scholar]
- Aníbal, J.; Esteves, E. Muxama and estupeta: Traditional food products obtained from tuna loins in South Portugal and Spain. In Traditional Food Products: General and Consumer Aspects; Kristbergsson, K., Oliveira, J., Eds.; Springer: New York, NY, USA, 2016; pp. 271–274. [Google Scholar]
- Gallart-Jornet, L.; Roberto, I.E.; Maupoei, P.F. La Salazón de Pescado, una Tradición en la Dieta Mediterránea; Editorial de la Universidad Politécnica de Valencia: Valencia, España, 2005; ISBN 8497059182. [Google Scholar]
- Godinho, M. A Muxama. Available online: http://www.projectotasa.com/2011/01/a-muxama/ (accessed on 15 January 2015).
- Esteves, E. Fish products from south Portugal: Dried litão, tuna muxama, and canned mackerel. In Mediterranean Food: Composition and Processing; Cruz, R.M.S., Vieira, M., Eds.; CRC Press Inc.: Boca Raton, FL, USA, 2016; pp. 65–101. [Google Scholar]
- Barat, J.M.; Grau, R. Thawing and salting studies of dry-cured tuna loins. J. Food Eng. 2009, 91, 455–459. [Google Scholar] [CrossRef]
- Rebelo, M.J.F. As Indústrias da Pesca e Conservas de Atum no Algarve do Século XX; Universidade de Algarve: Algarve, Faro, 2010. [Google Scholar]
- Doe, P.E. Fish Drying & Smoking: Production and Quality; Technomic Publishing Company, Inc.: Lancaster, UK, 1998; ISBN 9781566766685. [Google Scholar]
- Van Nguyen, M.; Arason, S.; Eikevik, T.M. Drying of Fish. In Seafood Processing: Technology, Quality and Safety; Boziaris, I.S., Ed.; John Wiley & Sons, Ltd.: Chichester, UK, 2014; pp. 161–175. [Google Scholar]
- Doe, P.E.; Olley, J. Drying and dried fish products. In Seafood: Resources, Nutritional Composition, and Preservation; Sikorski, Z.E., Ed.; CRC Press Inc.: Boca Raton, FL, USA, 1990; pp. 125–145. [Google Scholar]
- Graiver, N.; Pinotti, A.; Califano, A.; Zaritzky, N. Mathematical modeling of the uptake of curing salts in pork meat. J. Food Eng. 2009, 95, 533–540. [Google Scholar] [CrossRef]
- Albarracín, W.; Sánchez, I.C.; Grau, R.; Barat, J.M. Salt in food processing; usage and reduction: A review. Int. J. Food Sci. Technol. 2011, 46, 1329–1336. [Google Scholar] [CrossRef]
- Barat, J.-M.; Pérez-Esteve, E.; Aristoy, M.-C.; Toldrá, F. Partial replacement of sodium in meat and fish products by using magnesium salts. A review. Plant Soil 2013, 368, 179–188. [Google Scholar] [CrossRef]
- Bellagha, S.; Sahli, A.; Farhat, A.; Kechaou, N.; Glenza, A. Studies on salting and drying of sardine (Sardinella aurita): Experimental kinetics and modeling. J. Food Eng. 2007, 78, 947–952. [Google Scholar] [CrossRef]
- Boudhrioua, N.; Djendoubi, N.; Bellagha, S.; Kechaou, N. Study of moisture and salt transfers during salting of sardine fillets. J. Food Eng. 2009, 94, 83–89. [Google Scholar] [CrossRef]
- Jain, D.; Pathare, P.B. Study the drying kinetics of open sun drying of fish. J. Food Eng. 2007, 78, 1315–1319. [Google Scholar] [CrossRef]
- Oliveira, H.; Pedro, S.; Nunes, M.L.; Costa, R.; Vaz-Pires, P. Processing of Salted Cod (Gadus spp.): A Review. Compr. Rev. Food Sci. Food Saf. 2012, 11, 546–564. [Google Scholar] [CrossRef]
- Sobukola, O.P.; Olatunde, S.O. Effect of salting techniques on salt uptake and drying kinetics of African catfish (Clarias gariepinus). Food Bioprod. Process. 2011, 89, 170–177. [Google Scholar] [CrossRef]
- Wang, Y.; Zhang, M.; Mujumdar, A.S. Trends in Processing Technologies for Dried Aquatic Products. Dry. Technol. 2011, 29, 382–394. [Google Scholar] [CrossRef]
- Rahman, M.S. Osmotic dehydration of foods. In Handbook of Food Processing; Rahman, M.S., Ed.; CRC Press Inc.: Boca Raton, FL, USA, 2007; pp. 433–446. ISBN 9781845697587. [Google Scholar]
- Arason, S.; Van Nguyen, M.; Thorarinsdottir, K.A.; Thorkelsson, G. Preservation of Fish by Curing. In Seafood Processing: Technology, Quality and Safety; Boziaris, I.S., Ed.; John Wiley & Sons, Ltd.: Oxford, UK, 2014; pp. 129–160. [Google Scholar]
- Zugarramurdi, A.; Lupín, H. A model to explain observed behavior on fish salting. J. Food Sci. 1980, 45, 1305–1311. [Google Scholar] [CrossRef]
- Crawley, M.J. The R Book, 2nd ed.; John Wiley & Sons, Ltd.: Chichester, UK, 2013; ISBN 9780470973929. [Google Scholar]
- Hall, G.M. Fish. Processing; Wiley-Blackwell Publishing Ltd.: Chichester, UK, 2011; ISBN 9781405190473. [Google Scholar]
- Monteiro, M.L.G.; Mársico, E.T.; Vital, H.C. Avaliação físico-química dos efeitos da irradiação e da evisceração na conservação de atum (Thunnus atlanticus) refrigerado. [Physicochemical evaluations of the effects of irradiation and evisceration on the conservation of refrigerated blackfin tuna (Thunnus atlanticus)]. Rev. Port. Ciênc. Vet. 2010, 105, 45–48. [Google Scholar]
- Bernardi, D.C.; Mársico, E.T.; Freitas, M.Q. De Quality Index Method (QIM) to Assess the Freshness and Shelf Life of Fish. Braz. Arch. Biol. Technol. 2013, 56, 587–598. [Google Scholar] [CrossRef]
- Gómez, R.; Carmona, M.; Fernández-Salguero, J. Estudio de los alimentos de humedad intermedia españoles. I. Actividad del agua y pH. In II Jornadas Científicas Sobre “Alimentación Española”; RACVAO: Jaen, Spain, 1991; pp. 124–130. [Google Scholar]
- Sharma, G. Digital Imaging Handbook; CRC Press Inc.: Boca Raton, FL, USA, 2003; ISBN 978-1-4200-4148-4. [Google Scholar]
- Gallart-Jornet, L.; Barat, J.M.M.; Rustad, T.; Erikson, U.; Escriche, I.; Fito, P. A comparative study of brine salting of Atlantic cod (Gadus morhua) and Atlantic salmon (Salmo salar). J. Food Eng. 2007, 79, 261–270. [Google Scholar] [CrossRef]
- Macdougall, D.B. Colour in Food Improving Quality; CRC Press Inc.; Woodhead Publ. Limited: Cambridge, UK, 2002; ISBN 978-1-85573-590-3. [Google Scholar]
- Ritz, C.; Streibig, J.C. Nonlinear Regression with R; Springer: Berlin, Germany, 2008; ISBN 9780387096162. [Google Scholar]
- Akaike, H. A new look at the statistical model identification. IEEE Trans. Automat. Contr. 1974, 19, 716–723. [Google Scholar] [CrossRef]
- Burnham, K.K.P.; Anderson, D.R.D. Model Selection and Multimodel Inference: A Practical Information-Theoretic Approach, 2nd ed.; Springer: Berlin, Germany, 2002; Volume 172, ISBN 978-0-387-22456-5. [Google Scholar]
- Baty, F.; Ritz, C.; Charles, S.; Brutsche, M.; Flandrois, J.-P.; Delignette-Muller, M.-L. A Toolbox for Nonlinear Regression in R: The Package nlstools. J. Stat. Softw. 2015, 66, 1–21. [Google Scholar] [CrossRef]
- R Core Team. R: A Language and Environment for Statistical Computing; R Foundation for Statistical Computing: Vienna, Austria, 2017; ISBN 3-900051-07-0. [Google Scholar]
Figure 1.
Changes in (a) NaCl concentration (as water–phase salt concentration ZNaCl); (b) moisture content; (c) water activity (aW) and (d) pH in the interior (Int., empty circles ○ and dotted line ----) and exterior (Ext., filled circles ● and continuous line ―) portions of tuna loins along the 24 h period of salting. Lines depict the models described in Table 1 and shaded areas correspond to 95% confidence intervals.
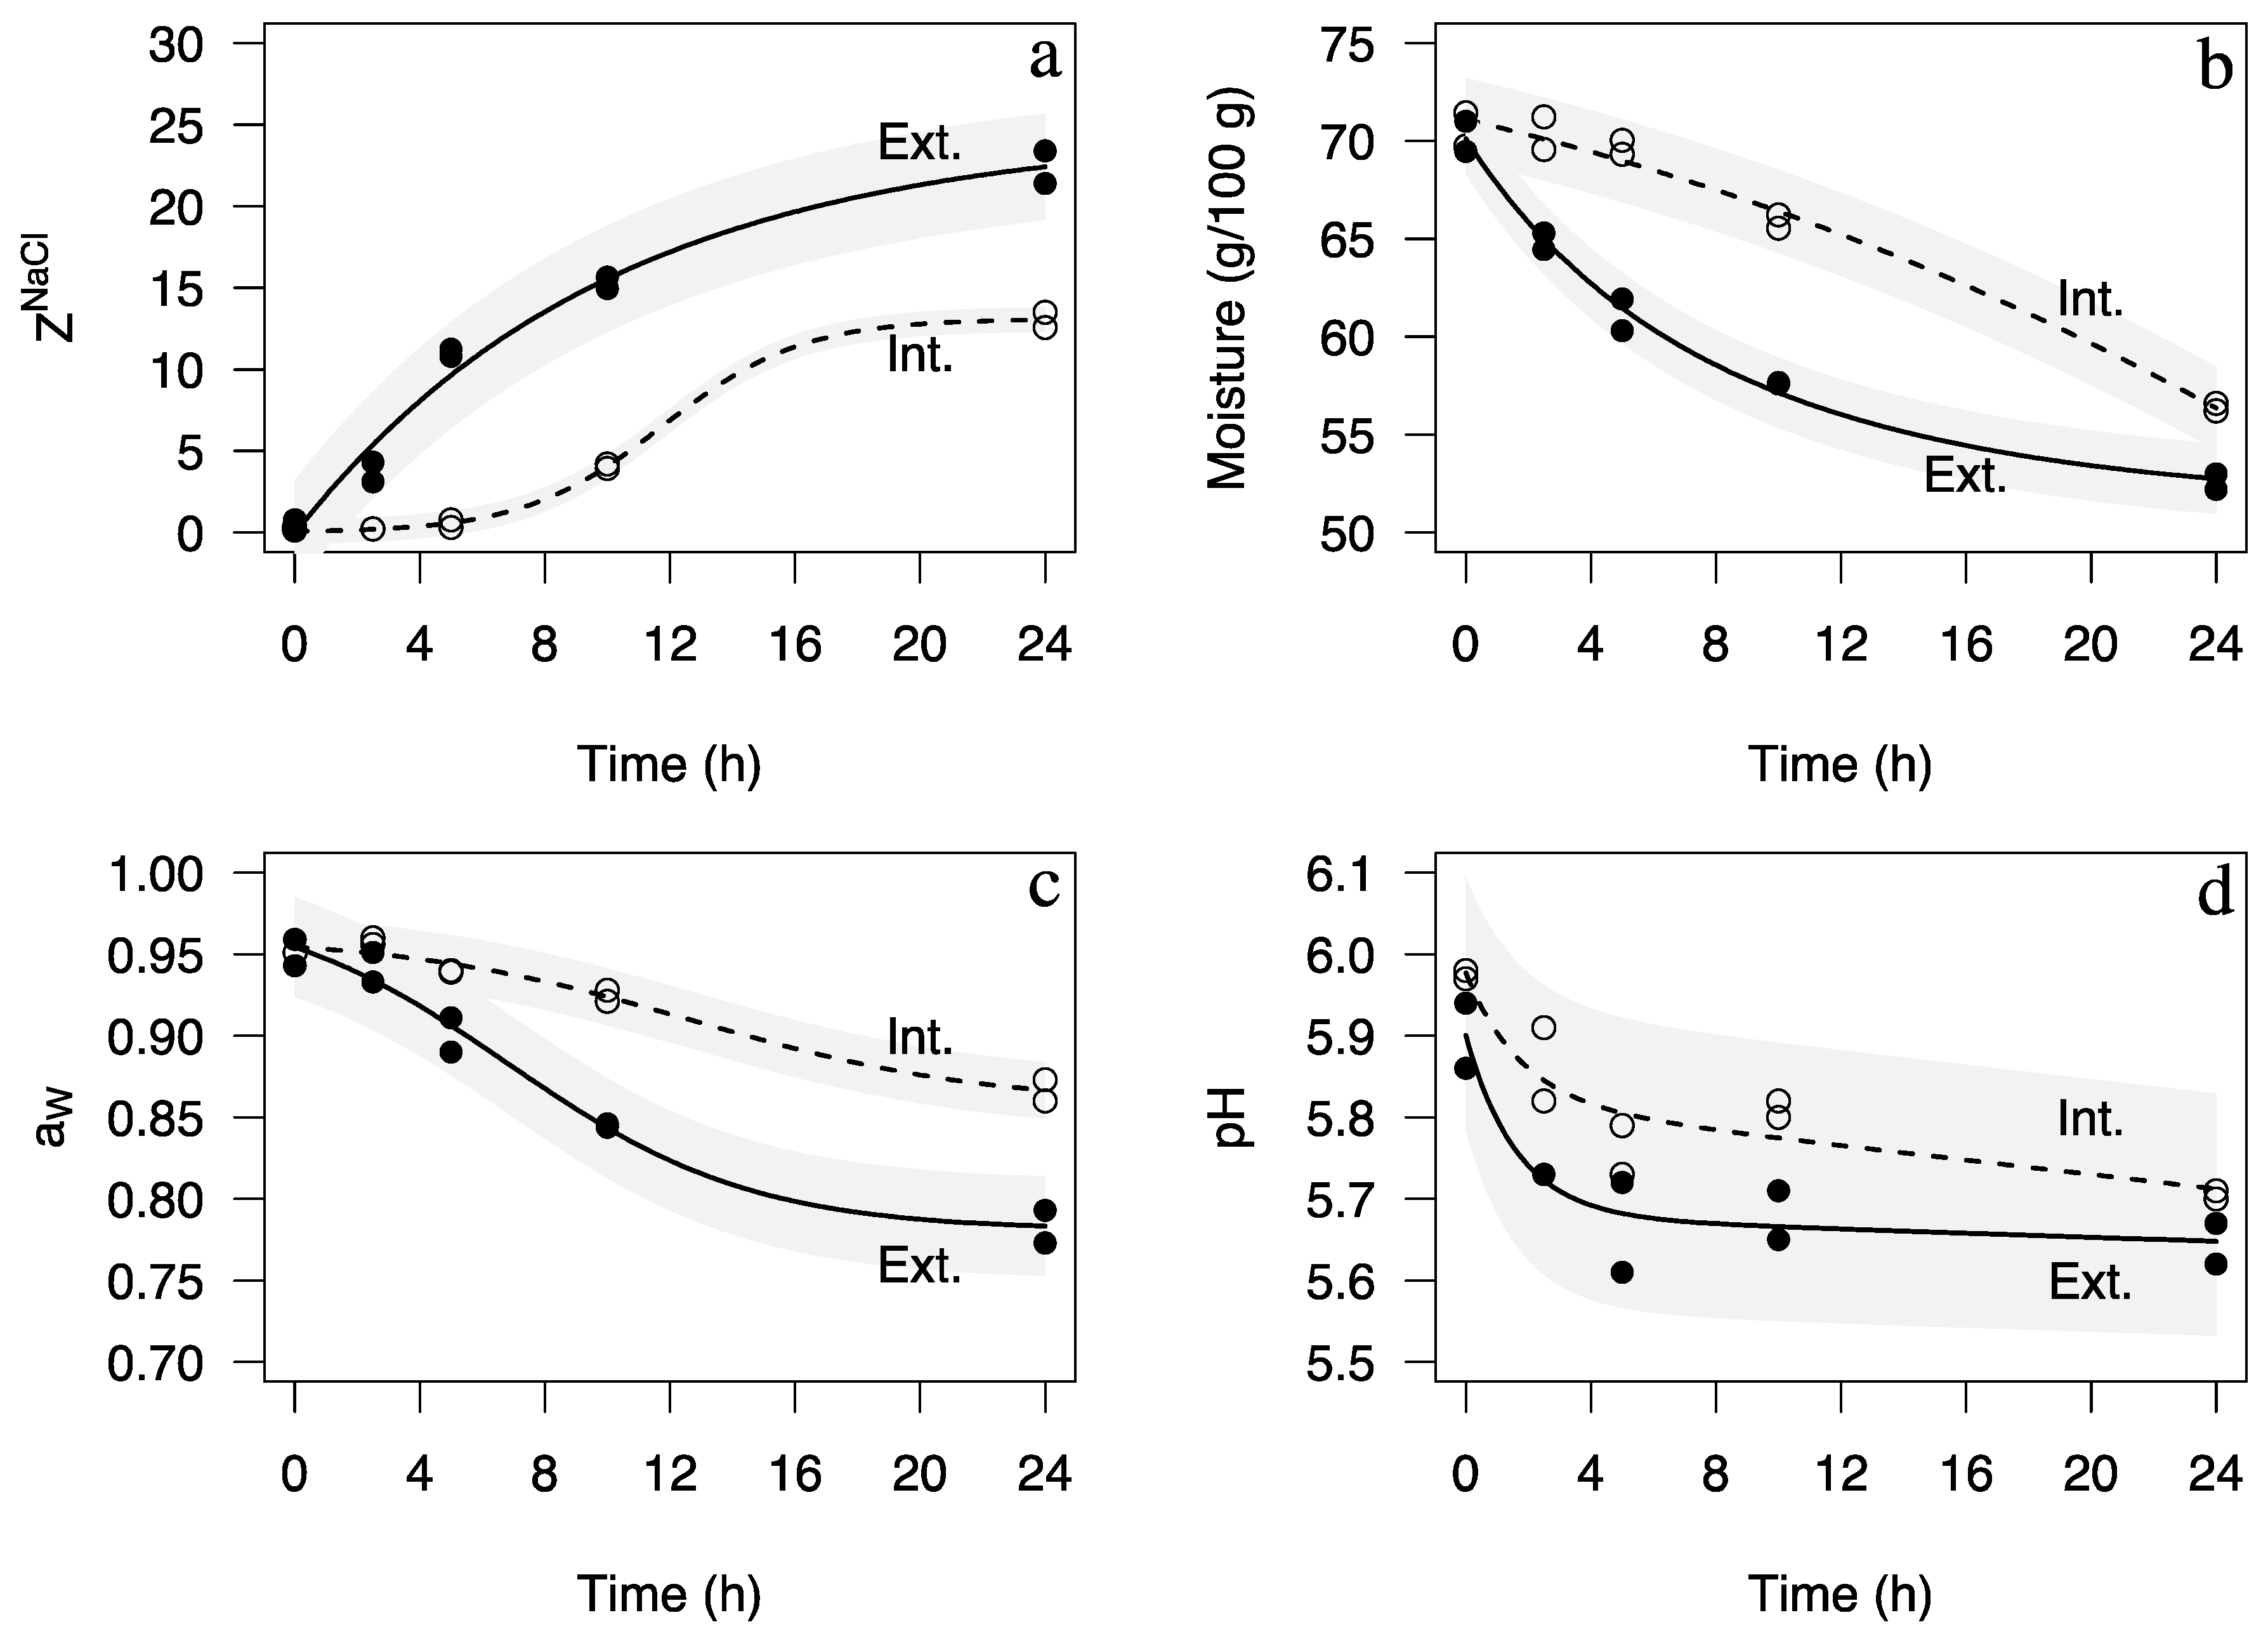
Figure 2.
Changes in color (a–c) Commission Internationale de l’Éclairage CIE L*a*b* and derived parameters: (d) Chroma; (e) Saturation; and (f) Hue angle in the interior (Int., empty circles ○ and dotted line ----) and exterior (Ext., filled circles ● and continuous line ―) portions of tuna loins along the 24 h period of salting. Non-parametric smoothing curves (splines) are shown for illustrative purposes only.
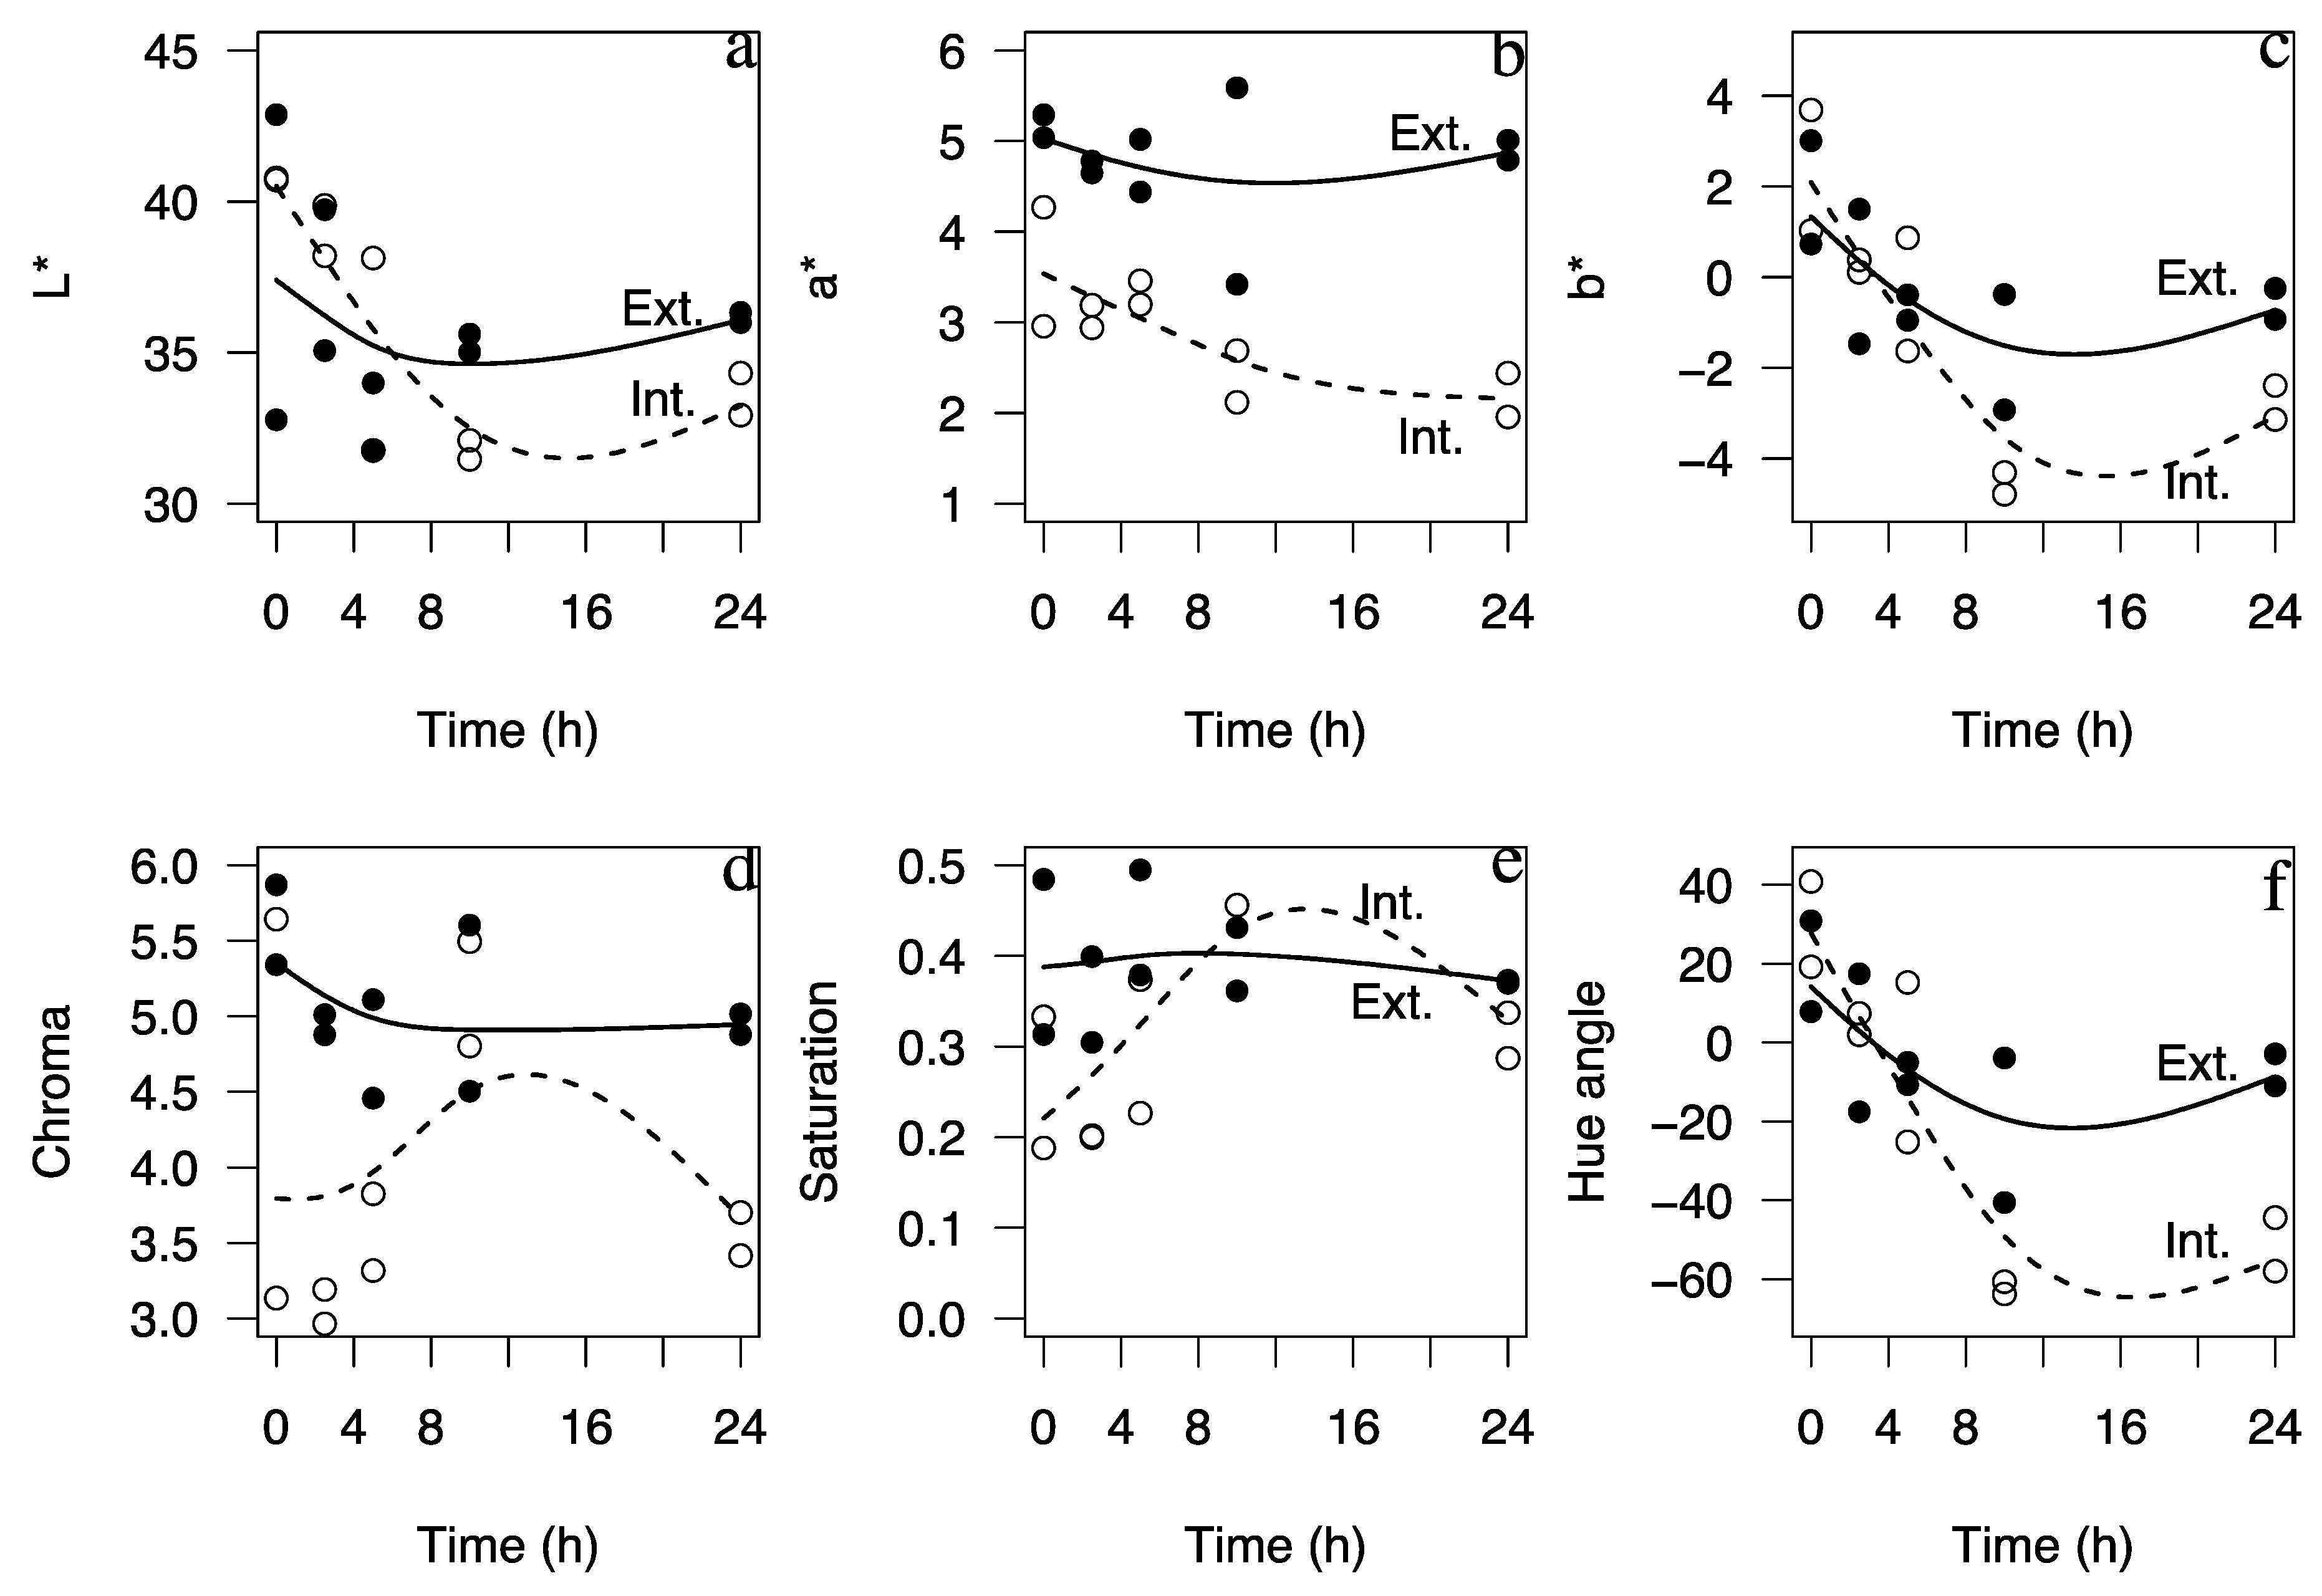
Figure 3.
Interaction plots for (a) moisture; (b) water activity (aW); (c) ratio of NaCl incorporation during drying (RNaCl); and (d) ZNaCl content of muxama obtained from portions of tuna loins previously dry-salted for 24 h and dried at 14 or 20 °C (black squares and red triangles, respectively) for four or seven days (individual data points are presented as filled circles).
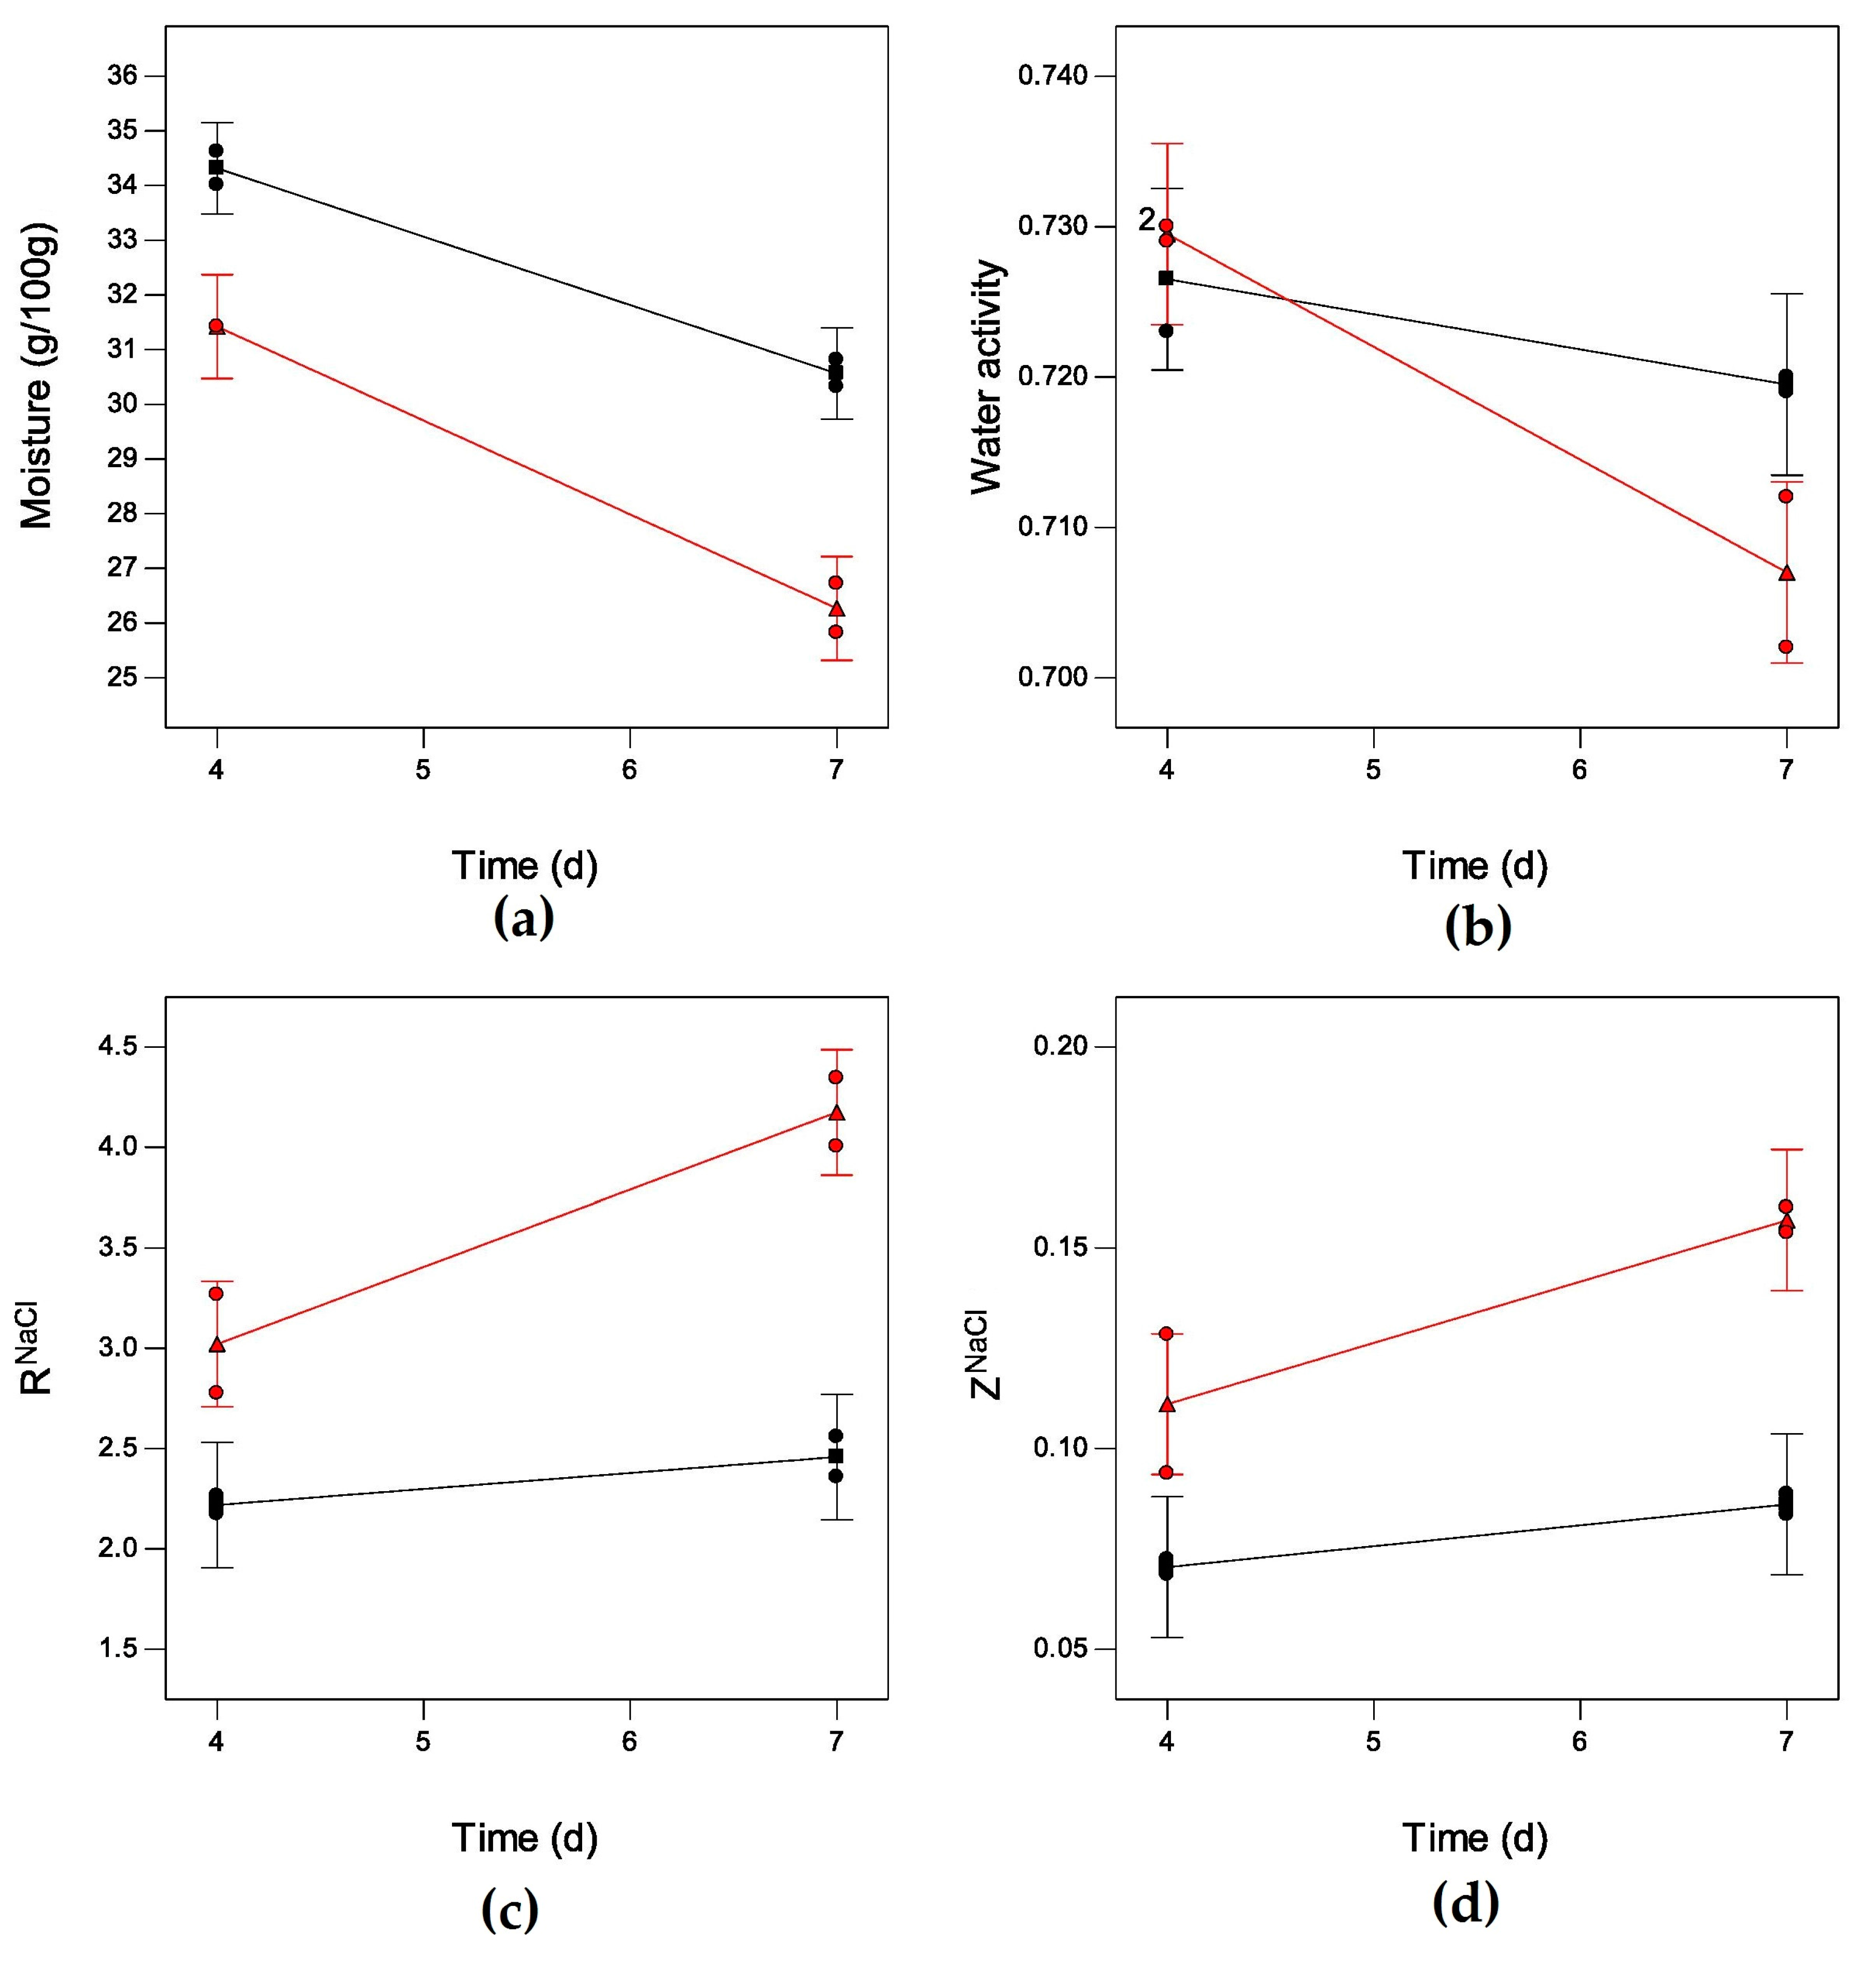
Figure 4.
Interaction plots for color (a,c) CIE L* and b* and derived parameters (b) saturation (Sab) and (d) color difference (ΔE) of muxama obtained from portions of tuna loins previously dry-salted for 24 h and dried at 14 or 20 °C (black squares and red triangles, respectively) for four or seven days (individual data points are presented as filled circles).
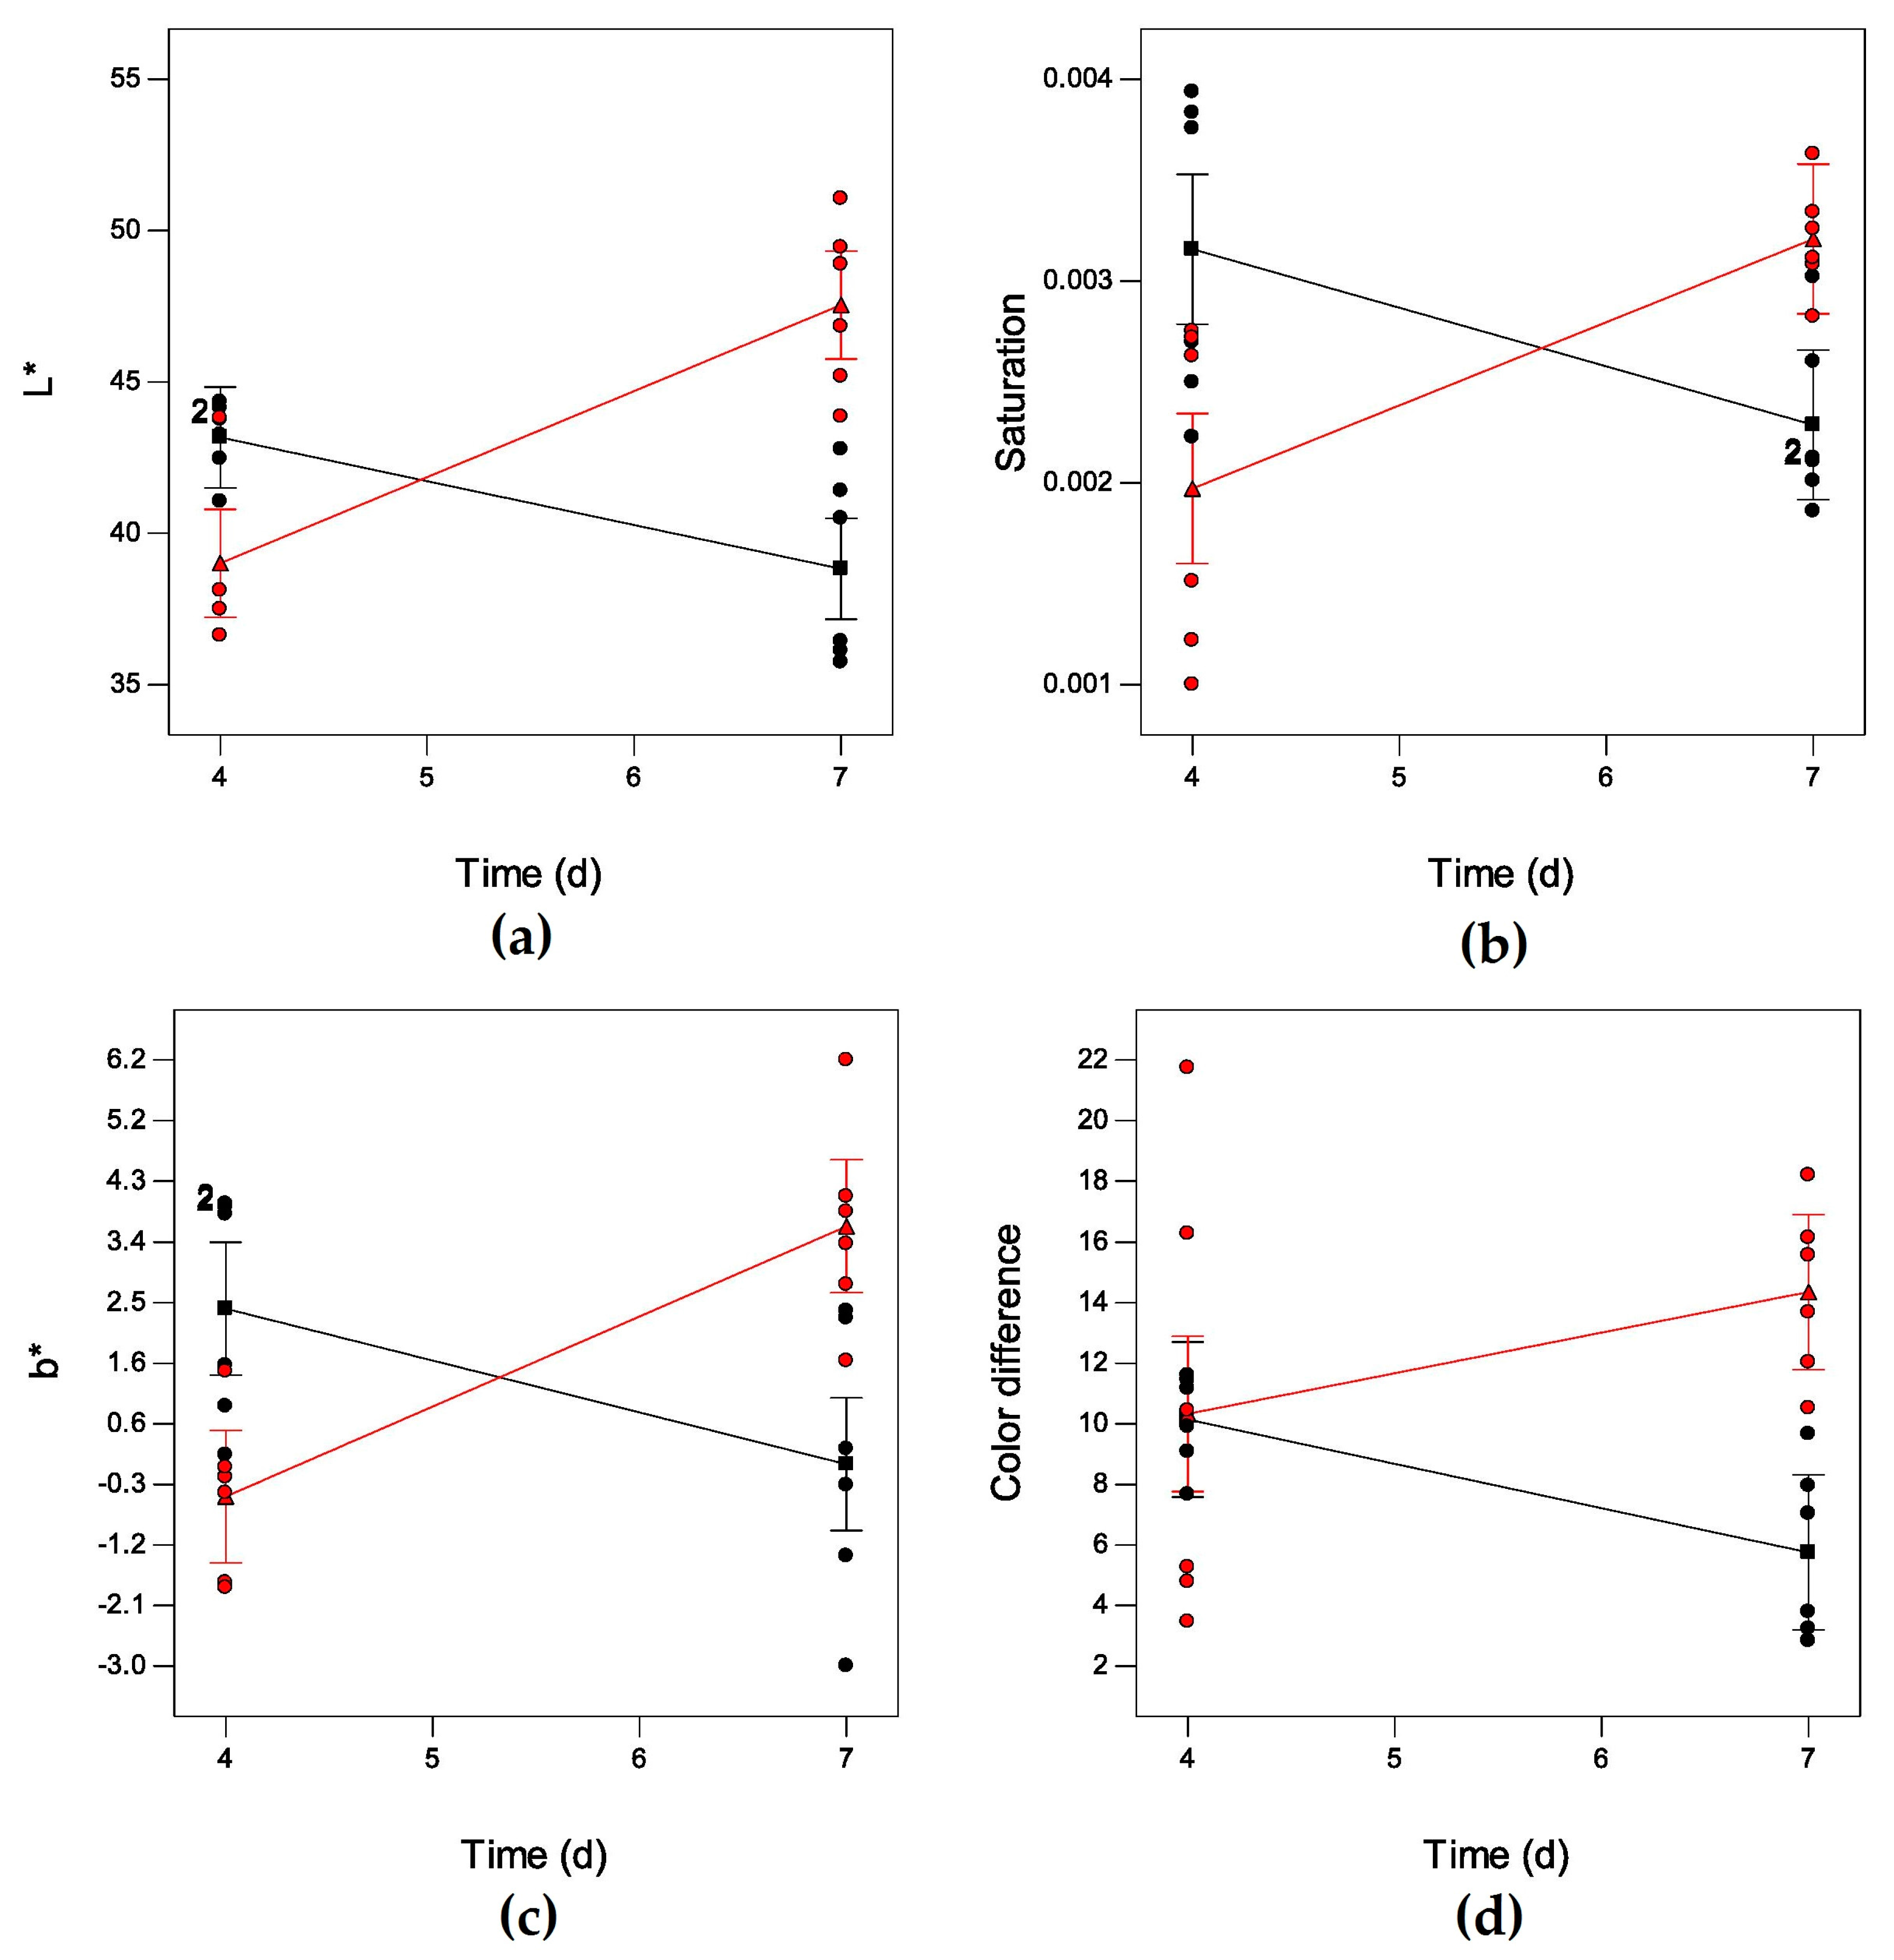
Figure 5.
Illustration of the size and shape of the tuna loins used in the salting-drying experiments carried in this study. In Experiment I, (A) exterior and (B) interior portions of the loins were sampled and analyzed whereas complete loins were used in Experiment I. See main text for further details.


Table 1.
Mathematical models fitted to the parameters (y) for exterior and interior portions of tuna loins during salting experiment.
Table 1.
Mathematical models fitted to the parameters (y) for exterior and interior portions of tuna loins during salting experiment.
| Parameter | Portion of Loin | Model Name and Equation [Reference] | Estimated Model Parameters (±SE) and Significance a | Pseudo-R2 | Assumptions b |
|---|---|---|---|---|---|
| ZNaCl | Exterior | Zugarramurdi & Lupín [26]: | = −0.009 (0.009) p = 0.9186 = 0.246 (0.019) p < 0.0001 0.100 (0.018) p = 0.0009 | 0.988 | W = 0.952, p = 0.6863 Z = 0.1405, p = 0.8883 |
| Interior | Three-parameter logistic [27]: | a = 0.131 (0.002) p < 0.0001 b = 11.778 (0.372) p < 0.0001 c = 2.229 (0.344) p = 0.0003 | 0.999 | W = 0.979, p = 0.9643 Z = −0.671, p = 0.5023 | |
| Moisture | Exterior | Three-parameter logistic [27]: | a = 51.389 (0.92) p < 0.0001 b = −0.267 (0.013) p < 0.0001 c = 0.097 (0.014) p = 0.0002 | 0.995 | W = 0.906, p = 0.2553 Z = 0.141, p = 0.8883 |
| Interior | Three-parameter logistic [27]: | a = 78.92 (5.96) p < 0.0001 b = 0.11 (0.08) p = 0.2022 c = −0.054 (0.019) p = 0.0256 | 0.993 | W = 0.9637, p = 0.8273 Z = 0, p = 0.9999 | |
| aW | Exterior | Four-parameter logistic [27]: | a = 98.41 (3.66) p < 0.0001 b = 78.09 (1.05) p < 0.0001 m = 6.856 (1.645) p = 0.0059 c = 3.884 (1.373) p = 0.0300 | 0.985 | W = 0.964, p = 0.8317 Z = 1.545, p = 0.1223 |
| Interior | Four-parameter logistic [27]: | a = 96.11 (1.90) p < 0.0001 b = 85.79 (2.68) p < 0.0001 m = 12.696 (2.988) p = 0.0054 c = 4.716 (4.482) p = 0.3333 | 0.995 | W = 0.863, p = 0.0821 Z = −0.562, p = 0.5741 | |
| pH | Exterior | Biexponential [27]: | A1 = 0.223 (0.062) p = 0.0113 lrc1 = −0.491 (0.731) p = 0.5267 A2 = 5.678 (0.053) p < 0.0001 lrc2 = −8.417 (2.407) p = 0.0129 | 0.944 | W = 0.932, p = 0.4702 Z = 0.140, p = 0.8883 |
| Interior | Biexponential [27]: | A1 = 0.158 (0.064) p = 0.0491 lrc1 = −0.554 (1.020) p = 0.6063 A2 = 5.819 (0.056) p < 0.0001 lrc2 = −7.170 (0.707) p < 0.001 | 0.943 | W = 0.958, p = 0.7608 Z = −0.562, p = 0.5741 |
a t-test (H0: θ = 0); b Shapiro-Wilk’s W normality test and Runs (randomness) Z test. SE: standard error of estimate.
Table 2.
Analysis of variance (ANOVA) results of two-level factorial experiments carried out to study the effects of time (four and seven days) and temperature (14 and 20 °C) of drying on various parameters of muxama.
Table 2.
Analysis of variance (ANOVA) results of two-level factorial experiments carried out to study the effects of time (four and seven days) and temperature (14 and 20 °C) of drying on various parameters of muxama.
| Parameter | Factor a (X) | F | p | Model b (Adjusted R2 vs. Predicted R2) |
|---|---|---|---|---|
| Moisture | Time (t) | 4.95 | 0.0901 | Moisture = 49.67 − 1.03t− 0.83T |
| (g·100 g−1) | Temperature (T) | 12.70 | 0.0235 * | (0.7296 vs. 0.5056) |
| t × T | 0.22 | 0.6608 | ||
| Water activity | t | 23.05 | 0.0086 ** | aW = 0.68 + 97 × 10−3t + 3.9 × 10⁻³T − 8.6 × 10⁻⁴t × T |
| (aw) | T | 2.39 | 0.1970 | (0.8045 vs. 0.5532) |
| t × T | 6.36 | 0.0652 | ||
| ZNaCl | t | 11.84 | 0.0263 * | ZNaCl = −0.108 − 0.010t + 9.27 × 10⁻⁵T |
| T | 38.92 | 0.0034 ** | (0.8335 vs. 0.6956) | |
| t × T | 2.85 | 0.1666 | ||
| RNaCl | t | 19.13 | 0.0119 * | RNaCl = 2.87 − 0.63t − 0.07T + 0.05t × T |
| T | 62.56 | 0.0014 ** | (0.9255 vs. 0.8296) | |
| t × T | 8.23 | 0.0455 * | ||
| L* | t | 3.38 | 0.0824 | L* = 98.71 − 11.46t − 3.55T + 0.72t × T |
| T | 4.00 | 0.0609 | (0.6450 vs. 0.5355) | |
| t × T | 31.95 | <0.0001 *** | ||
| a* | t | 0.09 | 0.7742 | a* = 4.93 |
| T | <0.01 | 0.9524 | ||
| t × T | 2.97 | 0.1001 | ||
| b* | t | 1.63 | 0.2166 | b* = 32.36 − 5.83t − 1.92T + 0.36t × T |
| T | 0.31 | 0.5842 | (0.4821 vs. 0.3515) | |
| t × T | 22.47 | <0.0001 *** | ||
| Chroma | t | 1.53 | 0.2300 | C = 25.621 − 4.30t − 1.35T + 0.26t × T |
| T | 2.01 | 0.1715 | (0.5862 vs. 0.4819)) | |
| t × T | 32.04 | <0.0001 *** | ||
| Saturation (Sab) | t | 0.53 | 0.4757 | Sab = 0.01 − 2.0 × 10⁻³t − 6.8 × 10⁻⁴T + 1.2 × 10⁻⁴t × T |
| T | 0.28 | 0.6039 | (0.4006 vs. 0.2494) | |
| t × T | 17.56 | 0.0005 *** | ||
| Hue angle (Hab) | t | 0.01 | 0.9443 | Hab = 60.36 |
| T | 0.002 | 0.9656 | ||
| t × T | 0.65 | 0.4654 | ||
| Color difference (ΔE) | t | 0.01 | 0.9170 | ΔE = 41.76 − 8.01t − 1.84T + 0.47t × T |
| T | 6.41 | 0.0199 * | (0.3807 vs. 0.2878) | |
| t × T | 5.88 | 0.0249 * |
a The multiplication/product sign × represents the interaction effect; b Regression model (in actual values) where t is time and T is temperature. Significance: * for p < 0.05, ** for p < 0.01 and *** for p < 0.001.
© 2018 by the authors. Licensee MDPI, Basel, Switzerland. This article is an open access article distributed under the terms and conditions of the Creative Commons Attribution (CC BY) license (http://creativecommons.org/licenses/by/4.0/).
Share and Cite
MDPI and ACS Style
Esteves, E.; Aníbal, J. Optimization of Processing Conditions of Traditional Cured Tuna Loins–Muxama. Fishes 2018, 3, 3. https://doi.org/10.3390/fishes3010003
AMA Style
Esteves E, Aníbal J. Optimization of Processing Conditions of Traditional Cured Tuna Loins–Muxama. Fishes. 2018; 3(1):3. https://doi.org/10.3390/fishes3010003
Chicago/Turabian StyleEsteves, Eduardo, and Jaime Aníbal. 2018. "Optimization of Processing Conditions of Traditional Cured Tuna Loins–Muxama" Fishes 3, no. 1: 3. https://doi.org/10.3390/fishes3010003