Article

Effect of Feed Protein:Lipid Ratio on Growth Parameters of African Catfish Clarias gariepinus after Fish Meal Substitution in the Diet with Bambaranut (Voandzeia subterranea) Meal and Soybean (Glycine max) Meal

1
Department of Biological and Environmental Science, University of Jyväskylä, Jyväskylä 40014, Finland
2
Finnish Environment Institute, Helsinki 00251, Finland
3
Natural Resources Institute Finland, Jyväskylä 40500, Finland
4
Presently: Department of Fisheries and Aquatic Resources Management, Michael Okpara University of Agriculture, Umudike, Umuahia Abia State, Nigeria
*
Author to whom correspondence should be addressed.
Submission received: 13 November 2016 / Revised: 22 January 2017 / Accepted: 23 January 2017 / Published: 30 January 2017
(This article belongs to the Special Issue Nutritional Requirements in New Fish Species Under Culture)

Abstract

:
Fishmeal (FM) was substituted with soybean meal (Glycine max) (SBM) and bambaranut meal (Voandzeia subterranea) (BNM) in 10 experimental African catfish, Clarias gariepinus, diets. Feed formulation was designed using mixture model. The inclusion level of the three protein ingredients varied between 0% and 60%. Remaining 40% comprised of basal ingredients kept constant for all 10 feeds. African catfish of average initial weight 35.2 ± 0.9 g were fed with one of the treatment diets for 28 days. The protein:lipid ratios of the diets (range 1.5–3.4:1) were used in evaluating the feed utilization and growth of the fish. We found that catfish performances were mainly depending on ingredients and not the ratio itself. The protein:lipid ratios in the diets made of plant ingredients were high but SGR was low. Specific growth rate (SGR) increased with the increase of feed FM content, being ca. 5% day−1 with 60% FM diet but ca. 2% day−1 at both 60% BNM and 60% SBM diets. SGR was similar (3.5% day−1) with diets of 30% BNM or SBM inclusion with 30% FM. Feed conversion ratio increased from below 0.6 of the 60% FM diet up to 1.5 (60% SBM) and 1.7 (60% BNM). Protein efficiency ratio decreased linearly with increasing FM substitution, but protein productive value (PPV) was similar for catfish fed 60% FM diet and its 50% substitution with BNM or SBM. These results suggest that protein:lipid ratio cannot be used in assessing nutritional performance if the source of feed ingredient vary widely. However, these results suggest that BNM can partly substitute FM and completely replace SBM in the diets of African catfish.

Graphical Abstract

1. Introduction

There is urgent need to make aquafeed production more cost effective. Fishmeal is the most costly feed ingredient and is very expensive as an imported item [1]. The development of adequate plant protein and oil sources as substitutes to fishmeal (FM) and fish oil will reduce aquaculture pressure on dwindling forage fisheries [1]. Substitution of FM with plant proteins is essential such that aquaculture would not be consuming more fish than it is producing [2]. Soybean (Glycine max) meal (SBM) is the major plant ingredient utilized for fish feeds [3], and it is also currently the primary plant protein in catfish diets in Africa [4]. Other plant proteins, e.g., groundnut (Arachis hypogaea) cake [5], bambaranut (Voandzeia subterranea) meal [6] and cottonseed (Gossypium sp.) cake [7], have been evaluated for replacing fish meal in diets of African catfish, Clarias gariepinus. Soybean is widely used for human food, vegetable oil production as well as for biofuel production. Multiple usages have also rendered soybean competitively scarce and expensive for sub-Saharan Africa aquaculture industry [4,8]. It would therefore be desirable to find alternative sources to SBM in aquafeed production. In addition, plant protein derivatives, such as wheat gluten and soy protein concentrate, possess desirable qualities but their usages have been limited by high price [1].
Plant proteins that could replace FM should be easily available, competitive in price, nutritionally acceptable and environmentally friendly [9]. Plant proteins should also be palatable to fish and not competing as human food [4,10]. However, utilization of plant proteins by fish can decrease due to inherent anti-nutritional factors (ANF) like raffinose, gossypol, trypsin inhibitors, phytic acid, protease inhibitors and saponins, [10,11].
Bambaranut is a neglected secondary food crop grown all over sub-Saharan Africa [12]. The crude protein content of bambaranut is about 24% [13] and it has more essential amino acids than most other legumes [14,15]. Moderate protein content and low price makes bambaranut a possible alternative to both FM and SBM in the diets of African catfish. The purpose of this experiment was to examine the growth and nutritional performances of African catfish fed with different mixes of FM, modern catfish diets.

2. Results

2.1. Effects of Protein:Lipid Ratios on Growth and Feed Utilization

Feed 3 (F3, 60% FM) with protein:lipid ratios of 2.5:1 produced best growth performance of the catfish: SGR 4.92 ± 1.01% day−1 and FCR 0.67 ± 0.06 (Table 1). The final average weight was also best for the catfish fed with diet of protein:lipid ratio 2.5:1, 122.2 ± 2.5 g (Table 1). The catfish fed with Feed 5 and Feed 6 also produced good average weight of 111.2 ± 5.30 g and 109.3 ± 1.1 g, respectively. However, the protein:lipid ratios of the diets containing vegetable proteins, F5, 2.4:1, F6, 3.0:1, and F8, 2.8:1, also seems to support nutrient utilization and growth resulting in specific growth rate of 3.77 ± 0.80% day−1, 3.74 ± 0.57% day−1 and 3.94 ± 0.82% day−1, respectively (Table 1). The dietary amino acid profile (Table 2) shows that lysine and methionine contents of the feed F3 were higher than in the other feeds, likely supporting fast growth. Feed conversion ratio was lowest for protein:lipid ratio of 2.5:1 but this does not really seem to be dependent on protein:lipid ratios considering the FCR of F5, F6, F8 and F10. The protein efficiency ratio (PER) of catfish fed with F4, 2.72 ± 0.09, F5, 2.34 ± 0.05, and F6, 2.30 ± 0.13 compared to that of F3, 2.46 ± 0.22 suggests that performances of the fish are also dependent on other factors like dietary protein and amino acid profile instead of protein:lipid ratio (Table 1, details of feed composition are shown in Table 3).

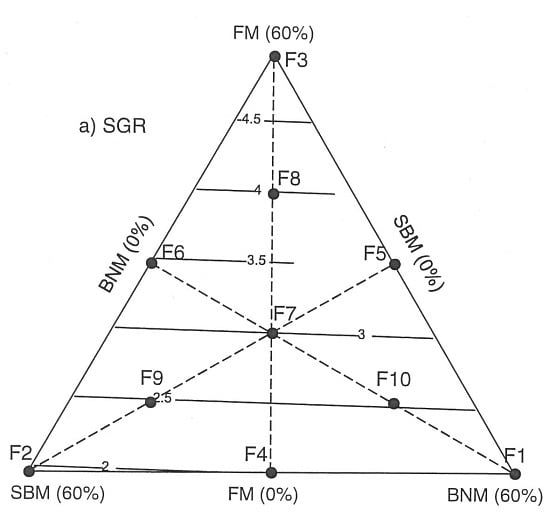
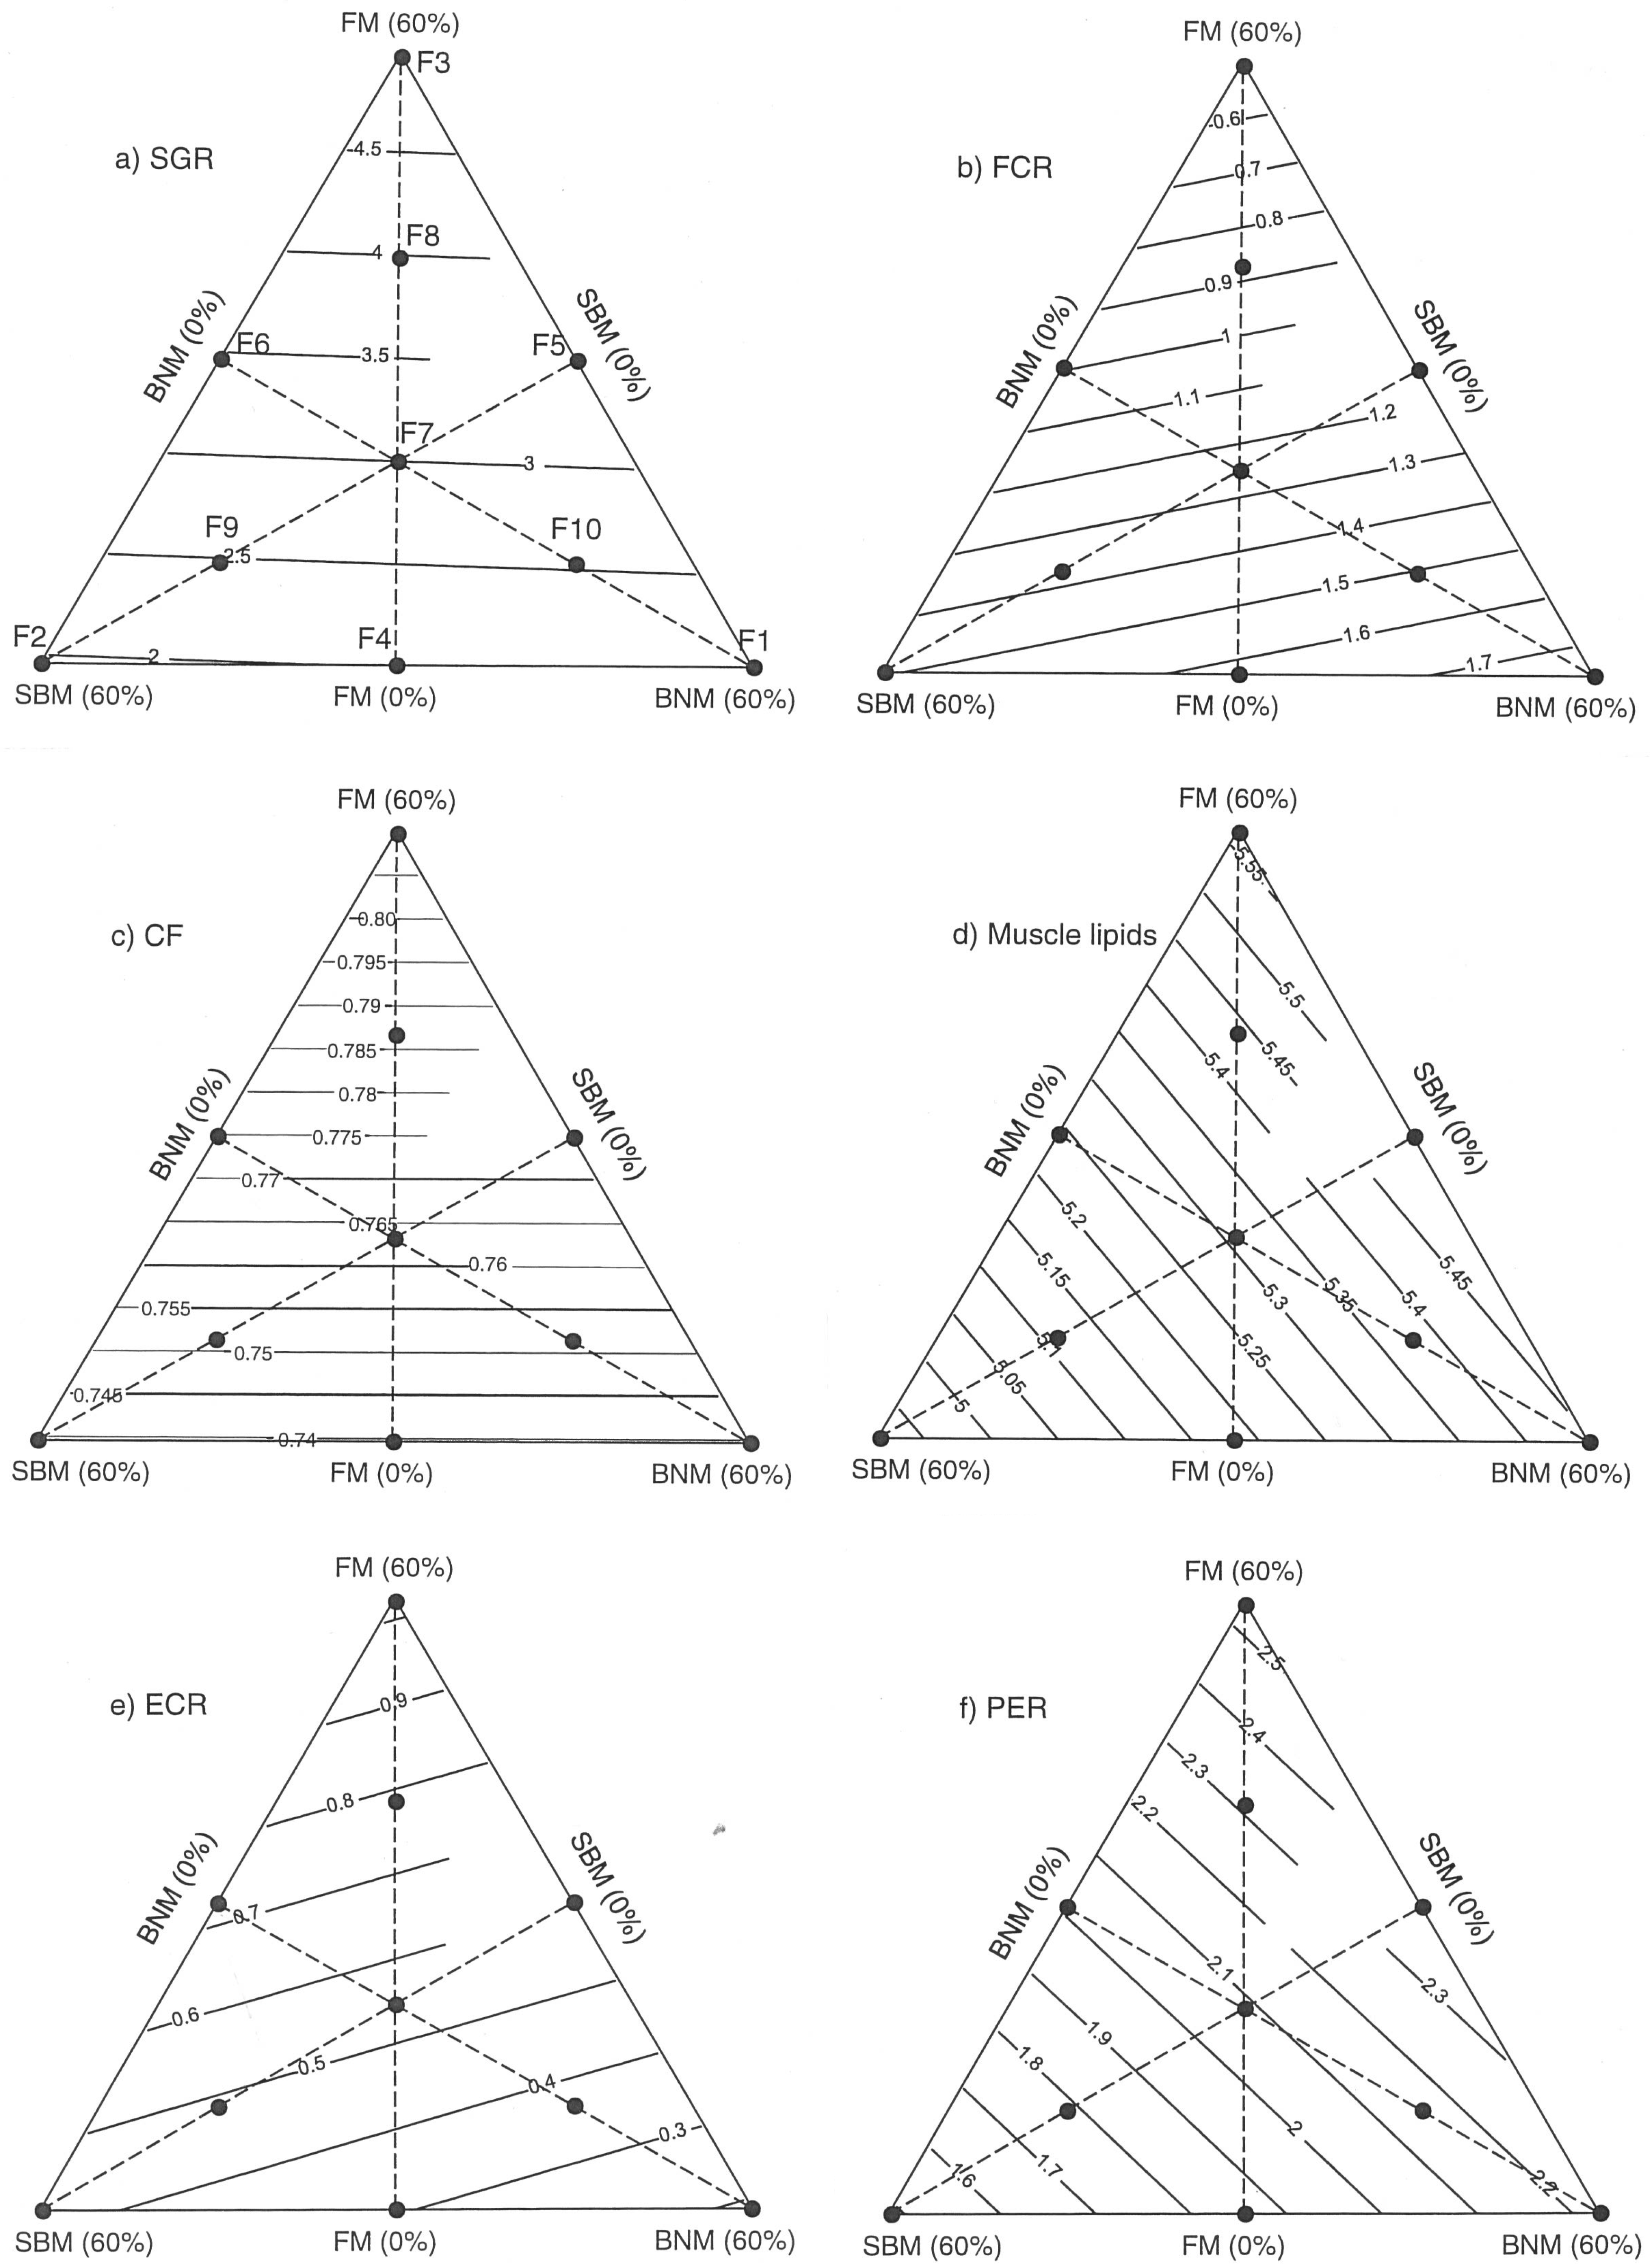
2.2. Growth and Nutritional Performance Based on Response Surfaces

Response surface showed a linear increase in growth rate as fishmeal quantity was increased along with the decrease of bambaranut and soybean meals. (Figure 1a). SGR increased from ca. 2% day−1 to ca. 5% day−1 at the 60% inclusion level of FM (Figure 1a, Table 3). There were no differences in the SGRs as the inclusion level of BNM or SBM was varied. Food conversion ratio (FCR) decreased linearly from 1.75 (at 60% BNM inclusion) and 1.5 (at 60% SBM addition) to 0.67 at 60% FM inclusion (Figure 1b, Table 3). Condition factor (CF) at the end of the experiment showed gradual linear increase from 0.74 to ca. 0.82 as the amount of fishmeal in the feed was increased (Figure 1c) but CF decreased only very slightly (from 0.77 to 0.74) when BNM or SBM were increased from 0% to 60%. Muscle lipids increased linearly from ca. 5.18% to 5.56% as FM was increased from 0% to 60% but it was stable at ca. 5.25% to 5.45% as BNM was increased from 0% to 60%. Conversely, muscle lipids decreased from 5.5% to <4.95% as SBM was increased from 0% to 60% (Figure 1d). Economic conversion ratio (ECR, the cost of different ingredients in the feed) increased linearly as FM was increased from 0% to 60%, and it decreased more with the increase of BNM than SBM inclusion (Figure 1d). ECR was highest (>1.0 USD per kg) at 60% FM inclusion, which was more than five times higher than with 60% BNM inclusion (<0.2) (Figure 1e). Protein efficiency ratio (PER) increased linearly as the amount of FM was increased (Figure 1f), while for SBM, the catfish PER was linearly reduced from 2.4 at 0% inclusion to <1.46 at 60% inclusion level. Catfish had higher PER when fed with higher BNM diets than with SBM at similar inclusion levels. PER was relatively unchanged between 2 at 0% and >2.2 at 60% BNM inclusion.
The 50% FM substitution with BNM (Feed 5; Table 3) gave the highest protein productive value (PPV). This was followed by Feeds 3, 6, 8 and 7, which were not significantly different. The PPV of 40% BNM diet, Feed 10, was significantly higher than that of Feed 9 (40% SBM). However, the catfish had similar low PPV for 60% BNM diet (Feed 1) and SBM diet (Feed 2). Feed ingredient cost increased as the amount fishmeal increased, and the cost of the 60% FM diet (Feed 3) was highest (USD 2.67 kg−1). This was followed by ingredient cost of 40% FM diet (USD 1.97 kg−1) and the 30% SBM–FM diet (Feed 5). The cheapest diet to produce was the 60% BNM diet (USD 0.45 kg−1), followed by 30% BNM–SBM diet. Diet ingredient cost was lower for BNM based diets than the SBM based diet.
The feed fish equivalence (FFE) of catfish fed with 60% BNM and SBM (100% FM substitution) and those of catfish fed with 30% BNM–30% SBM (100% FM substitution) were zero (Table 1). The catfish fed with 60% FM diet had the highest FFE, where almost 2 kg forage fish would be needed to produce 1 kg of catfish (FFE 1.99 ± 0.18). At 20% FM inclusion (Feed 7), forage fish input and catfish output are equal, whereas diets with 10% FM (Feeds 9 and 10) would be net fish producers where, 0.6–0.7 kg forage fish would be needed to produce 1 kg of catfish.

3. Discussion

The mixture principle and response surface methodologies enabled simultaneous analyses of all feed ingredients as opposed to traditional analyses of one ingredient at a time. The benefits of this design have been discussed in Vielma et al. [16] and Ruohonen et al. [17]. The mixture principle eliminates problems of confounding effects that result from parallel changes in other feed components when one item is deliberately changed. Among the advantages of using this design is elimination of fillers which might be interfering with fish responses to treatment, as described by Ruohonen et al. [18]. The mixture principle also enables investigation of interactive effects of the nutrients on growth and nutritional parameters over wide diet mixes and levels of protein. However, one disadvantage of the method chosen is that potential amino acid deficiencies are not balanced by supplementation.
The catfish nutrient utilization was affected by the protein: lipid ratios of the diets. The lower protein:lipid ratio of F1 was due to the low protein and lipid content of the BNM. There was elevated FCR and low SGR. The catfish seems to have lower protein for growth and lipid for energy. However, African catfish is known to utilize carbohydrate for energy and this may have made up for the poor protein:lipid ratio of the diet [19]. The elevation of protein:lipid ratio reduced the FCR of the catfish [20,21]. The protein efficiency ratio (PER) and the hepatosomatic index (HSI) of the catfish were all increasing with increase in the dietary protein:lipid ratio except in F6 and F8 (Table 3). The SGR of the catfish increased with increase in protein:lipid ratio when the source is not majorly plant protein. However, it increased with higher protein:lipid ratio in F5, F6 and F8. The increase in protein:lipid ratio alone did not seem to determine fish nutritional performances. Catfish did not grow better in F4 which had high protein:lipid ratio (Table 3) but source was from SBM and BNM (Table 3 and Table 4). Similarly catfish did not grow very well when fed with F2, that had high protein:lipid ratio but source was from SBM. We noticed that there seems to be interaction with ingredients despite the protein:lipid ratio status. This seems to apply with the protein:lipid ratio in almost all the diets. The effects of the ratio on the PER seem to be because the catfish may be protein sparing when there is enough lipid for energy utilization. Higher nitrogen retention has been noted in fish fed with higher lipid content regardless of the dietary protein level [22].
The main factor driving feed intake, responses and metabolic use of the diets in this experiment is the total availability of energy and the amino acids and protein and not the specific quality of one of the ingredient. This is because the proximate proteins were not balanced. Feed 1 (F1) contained BNM as major protein source, while F2 and F3 had SBM and FM, respectively. We chose a direct raw material replacement without adjusting for known nutritional differences in the diets. Another option to compare fishmeal replacement with bambara or soy would have been the one used by Forster et al. [23] and Minjarez-Osorio [24] who prepared mixtures of plant proteins, which were balanced for protein contents and also fortified with amino acids. The method we chose has a drawback that we cannot differentiate between the influence of the raw material nutrient availability and possible ANF effects, with those of possible nutritional deficiencies. However, other benefits of the mixture experiment principle over one-variable-at-time designs are still apparent in our experiment [25]. Other caveats to our result are related to lack of balancing protein and energy of the diets. We noted that our results are confounded with changes of diet protein and lipid levels, prompting the discussion in this light. The response surfaces analyses however are shown to highlight the concept of the three-dimensional mixture design, which has notable advantages in multiple diet mixes and effects analysis.
African catfish effectively utilized treatment diets with maximum SGR of 5.0% day−1 for 60% FM diet (Feed 3) and 3.5% day−1 for diets substituting 50% of the FM with BNM /SBM (Feeds 5 and 6). Similar growth responses with fish fed high SBM and BNM suggests that catfishes were able to utilize the BNM protein, carbohydrates and lipids as efficiently as SBM, despite lower protein contents of BNM. High growth rate of fish fed with 60% FM (Feed 3) is likely attributed to the high amount of protein, essential amino acids and lipids (Table 2). The protein:lipid ratio of F9 which has 40% SBM (29.36) was close to that of FD10 that has 40% BNM, this suggest that with FM inclusion diets containing BNM and SBM at equal inclusion of FM would be similarly utilized and have same protein:lipid ratio. The quantity of lysine in other feeds was 27%–80% of that contained in Feed 3 and respective values for methionine were 18%–75%. Complete substitution of FM with either BNM or SBM (Feeds 1 and 2) resulted in decrease in the amount of essential amino acids (Table 2), when compared to AA requirements of another catfish species, channel catfish Ictalurus punctatus [20]. This must have contributed in the poorer performance of catfish fed with Feeds 1 and 2. Feeds F1 and F2 are made up of bambaranut meal and soybean meal respectively as main protein ingredient, their amino acid profile can be seen in Table 4. The substitution or total replacement of FM with vegetable proteins is limited by low level of lysine in most plants [20,26]. SBM substitution of FM above 50% has been noted to cause growth retardation in African catfish due to essential AA deficiency [27]. Similarly Imorou-Toko et al. [7] also noted retarded growth rate of African catfish fed 60% SBM. The results of the present experiment suggest that sufficient quantities of essential amino acids, lack of ANFs and absence of available carbohydrates are attributes that make FM biologically superior ingredient for catfish feeds from the nutritional point of view, in comparison to SBM and BNM.
The SGRs of catfish fed diets with >50% FM substitution with SBM and BNM were higher than previously reported by Fagbenro and Davies [27]. These authors noted that methionine supplementation was needed at such inclusion levels of plant proteins. In the present experiment the diets with over 50% FM replacement had lower methionine concentration less than lower substitutions due to the ingredients essential amino acid profile (Table 4), this gives methionine content lower than what is recommended for channel catfish [20]. Along with lysine, also methionine has been identified as another major limiting essential amino acid in plant protein substituted diets [27,28]. Nevertheless, the catfish in our experiment still grew relatively fast even with the diets containing plant proteins, and no other signs of AA deficiencies than retarded growth were observed. This could as well be due to other factors related to feed quality like the fish oil inclusion and its utilization by the catfish. The growth of the catfish could also be attributed to our feed production using extruder which gelatinized the starch and consequently enhanced feed utilization.
The decrease of FCR along with the increase of FM inclusion suggests the negative influence of carbohydrates on feed utilization in African catfish. The decrease in FCR has also been noted to be due to high protein:lipid ratio of the diet (Table 3). Increase in FCR in diets with plant proteins also points at the effects of reduced amino acids and protein level on FCR. Increasing the percentage of plant proteins in the diets reduced the quantity of most AAs considerably, in most cases below the levels which are recommended for channel catfish [20], and this must have contributed to the elevation of FCR. For example, lysine supplementation of plant based diets has been noted to reduce FCR in rainbow trout, Oncorhynchus mykiss [29], and in grass carp [30]. Consequently, AA supplements of the diets with over 50% of plant proteins would likely reduce FCR and improve growth rate.
Diet lipid levels varied between 13.3% and 18.4% (Table 4). The positive relationship between lipid contents of the feed and muscle has been reported for African catfish [31], bagrid catfish, Pseudobagrus fulvidraco [19], and channel catfish [32]. In the present trial, muscle lipid levels reflected dietary lipid content 5% to 5.5% lipid on wet weight basis (Figure 1d). Based on our results, protein:lipid ratio of 2.5:1 of feed F3 seems to be appropriate for African catfish C. gariepinus. However, catfish growth performance depends also on the sources of the dietary nutrients rather than protein:lipid ratio only. This suggests the effects of ingredients’ essential amino acids (Table 4) and fatty acids in the determination of nutrient utilization and fish performances. This also highlights the usefulness of mixture design in elucidating fish utilization of multiple ingredients.
To our knowledge, potential effects of ANFs in BNM based diets have not been reported. However, Enyidi and Mgbenka [6] reported phytic acid content of BNM to be 0.84 g 100 g−1. The amount of phytic acid in BNM is very low when compared to e.g., the level in SBM (1.3–1.9 g/100 g, [33]. Despite the lower protein contents in BNM-diets in comparison to SBM-diets, equally good growth and better feed utilization of BNM fed fish could thus at least partly be explained by low phytic acid contents of BNM.
The 50% substitution of FM reduced the ingredient cost of the feed by >1 USD·kg−1. The ECR was reduced from >1.0 to <0.2 USD·kg−1 along with the increase of plant proteins (Figure 1e). This certainly has economic implications in catfish production systems. FFE of the fish fed with Feed 3 (60% FM) was significantly higher than in any other group. FFE value of 1.0 had been advocated by environmentalist as necessary for the environmental protection of forage fisheries [34]. When the non-FM diets (Feeds 1, 2 and 4) are not taken into account, the lowest FFEs were obtained in groups with the least amount of FM inclusion (groups fed with Feeds 9 and 10). The catfish fed Feed 7 (20% FM, SBM and BNM) had the FFE at 1.0, the recommended maximum by the environmentalists.
Based on our results bambaranut meal appears to be a cost-effective substitute for soybean meal and fishmeal in the diets of African catfish. Bambaranut meal can substitute 100% of soybean meal in the diets of African catfish, and the non-significant reduction in growth rate is compensated by cheaper production cost.

4. Materials and Methods

4.1. Preparation of Feeds

Experimental dry feeds were produced using mixture methodology principle [25,17]. The use of mixture principles enhances simultaneous investigation of growth and nutritional effects of the three major dietary components (BNM, SBM and FM). Protein supplements were 60%, comprising of different mixes of Nordic fishmeal, Nigerian bambaranut meal and defatted soybean meal (Table 3). Essentially, crude protein of the treatment feeds was not balanced since we used FM, SBM and BNM alone. Consequently, main factor that could stimulate feed intake would be the total availability of energy and the amino acids and protein and not the specific quality of one of the ingredient.
A constant level of 40% basal ingredients comprising of wheat meal, blood meal, vitamin and mineral premixes, and fish oil, was maintained in all feeds. Ground ingredients were mixed with warm water totaling 30% moisture in feed mash. The mixed ingredients were extruded with a twin-screw Creusot-Loire cooking extruder using a 4 mm die with barrel temperature of 120–125 °C. Extruded feeds were dried overnight in a warm air drying chamber at 30–35 °C and then coated with fish oil in a Dinnissen vacuum coater, and stored in air tight bags until used. Diets were produced at Laukaa Fish Farm of the Natural Resources Institute Finland.

4.2. Experimental Setup

Ten African catfish juveniles, average weight 35.2 ± 0.9 g, were stocked in each of the 15 L replicated aquaria, 20 aquaria in total. The aquaria were aerated, supplied a constant flow (c. 0.6 L·min−1) of aerated well water (30.0 ± 1.5 °C) and about 40% of the outflow was filtered with trickling filter, passed through a zeolite chamber and recirculated.
Average dissolved oxygen was 8.2 ± 0.2 mg·L−1, measured with YSI oxygen meter model 550A (YSI Inc., Yellow Springs, OH, USA) and total gas pressure was (101.5% ± 1.0%), measured with P4 Tracker total gas pressure meter (Point Four Systems Inc., Richmond, BC, Canada). Ammonia (0.25 ± 0.07 mg·L−1) was measured fortnightly with an ammonia test kit (Tetra Merke, Melle, Germany). Water pH was 6.9 ± 0.1 and alkalinity 1.13 ± 0.01 mmol·L−1. The tanks were subjected to photoperiod of L12:D12 and light intensity was ca. 8 lux (HD 9221 lux meter, Delta OHM, Padua, Italy). The tanks were cleaned every morning prior to feeding of the fish, and the recirculation system was cleaned every two days. Fish were hand fed at 09:00 h and at 17:00 h. The fish were fed to apparent satiation in the morning and restricted feeding (3% of estimated tank biomass) was given in the evening. The restriction rations of feed were adjusted based on calculated increase in their body weight. The fish were weighed by measuring tank biomass on Days 0, 14 and 28, and they were not fed for 18 h before weighing. At the end of the experiment, five fish were removed from each replicate tank, killed by a sharp blow on the head and their length (to 0.1 cm) and weight (to 0.1 g) were recorded individually. Whole fish samples and muscles were blended with electric mixer. Muscle samples were taken from below the dorsal fin and between the pectoral and caudal fins, excluding the skin. Samples were frozen at −20 °C and freeze dried before being stored at −80 °C.

4.3. Chemical Analyses

Crude protein was analyzed by Kjeldahl method from freeze dried feed and body samples, and then calculated as percent N (NH3-N/ NH4+-N) × 6.25%. The total lipids of feeds and whole fish body were measured by chloroform: methanol-extraction at ratio of 2:1. Total lipid was calculated as the weight difference in non-extracted and extracted samples [35]. Amino acid (AA) contents of the ingredients (Table 4) and feeds (Table 2) were measured using methods of the European Commission [36]. Total peptides (bound and free) were analyzed with a Waters Finland Mass Trak Ultraperformance® Liquid Chromatography (UPLC) (Water Corporation Milford, MA, USA) and the application was UPLC Amino Acid Analysis Solution®.

4.4. Calculations and Statistical Analyses

Specific growth rate (SGR, % day−1) was calculated as 100 × (ln W2 – ln W1) × t−1, where W1 and W2 were average weights (g) at the start and the end of the experiment and t was the length of the experiment in days (28). Food conversion ratio (FCR) was calculated as feed fed (g) × gain (g)−1. Condition factor (CF) was calculated as 100 × W × L−3, where W is weight of fish (g) and L their length (cm). Economic conversion ratio (ECR) was calculated as the price of the variable part in the diet (USD) × FCR. Price of the variable diet fraction was based on the price of the ingredients as given in Enyidi [13] and Onyimonyi and Ugwu [37]: SBM was estimated at 0.42 USD·kg−1, bambaranut meal 0.07 USD·kg−1 and fishmeal 2.23 USD·kg−1. Feed fish equivalence (FFE) was calculated as FCR × (% fish meal in feed × 100)−1 × 4.5, where 4.5 is the ratio of forage fish required to produce 1 kg fishmeal [34]. Protein:lipid ratio was calculated as protein (%) × lipid (%)−1 in diet. Protein efficiency ratio (PER) was calculated as FCR × % feed protein × % protein in catfish−1. Protein productive value (PPV) was calculated as 100 × (final body protein − initial body protein) × (protein consumed)−1. Anova was used for testing possible differences between treatments in final weight, PPV, DFI and FFE, and the least significance difference (LSD) test was used for post-hoc comparisons (p < 0.05), and aquaria were used as observational units.

4.5. Mixture Design Principle

Mixture designs [38] were used to model the effects of fishmeal, bambaranut meal and soybean meal on response variables. Explanatory variables were converted into pseudocomponents and responses to these components were modeled by using lm-procedure of R language (R Development Core Team [39]. The responses were linear as follows:
Y = p1x1 + p2x2 + p3x3 + ε
where Y is response variable, x1 represents FM pseudocomponent, x2 stands for BNM pseudocomponent and x3 represents SBM pseudocomponent, (pseudocomponents are mixtures). The sign ε is residual error and the p values 1, 2 and 3 are the estimated parameters [17]. The use of mixture principles design and response surface analysis enabled simultaneous analyses of the effects of FM, BNM and SBM, instead of one item at a time [17,16]. Mixture principles also eliminated the problem of confounding effects, which results from parallel changes in other feed components when one item is deliberately changed.

5. Conclusions

Protein:lipid ratio is a useful tool in investigating nutrient utilization but with special reference to sources of the nutrients. African catfish Clarias gariepinus performed well when fed diets with protein:lipid ratio of 2.4 to 3 but this was best with fishmeal based diets. Nevertheless, bambaranut meal and soybean meal favourably could replace over 60% of FM in diets of African catfish C. gariepinus with better economic conversion ratio than 60% FM diets. This can be of immense economic benefit especially in sub-Saharan Africa where FM is entirely imported and catfish farming is booming. Essential amino acids balance of the diet is pivotal to feed suitability and utilization by the catfish.

Acknowledgments

The study was partly supported by Ellen ja Artturi Nyysönen foundation grant for Uchechukwu Enyidi. Tuula. Sinisalo and Nina. Honkanen are thanked for their help during laboratory analyses and L. Poutamo for help in during the experiment.

Author Contributions

Jouni Vielma designed the research and provided some of the ingredients. He also took part in the feed production. Juhani Pirhonen took part in research design and supervised the research daily. Enyidi Uchechukwu carried out the day to day research work, did the statistical analysis and wrote the article. Juhani Kettunen carried out the triangular simplex analysis and was also part of the ingredient provision. Enyidi Uchechukwu, Juhani Pirhonnen, Jouni Vielma and Juhani Kettunen went through the work and made corrections accordingly.

Conflicts of Interest

The authors declare no conflict of interest.

References

  1. Naylor, R.L.; Hardy, R.W.; Bureau, D.P.; Chiu, A.; Elliott, M.; Farrell, A.P.; Forster, I.; Gatlin, D.M.; Goldburg, R.J.; Hua, K.; et al. Feeding aquaculture in an era of finite resources. Proc. Natl. Acad. Sci. USA 2009, 106, 15103–15110. [Google Scholar] [CrossRef] [PubMed]
  2. Hardy, R.W. Utilization of plant protein in fish diets: Effects of global demand and supplies of fishmeal. Aquac. Res. 2010, 41, 770–776. [Google Scholar] [CrossRef]
  3. Drew, M.D.; Borgeson, T.L.; Thiessen, D.L. A review of processing of feed ingredients to enhance diet digestibility in finfish. Anim. Feed Sci. Technol. 2007, 138, 118–136. [Google Scholar] [CrossRef]
  4. Shipton, T.; Hecht, T. A Synthesis of the Formulated Animal and Aquafeed Industry in Sub-Saharan African. Available online: http://www.fao.org/docrep/008/a0042e/a0042e03.htm (accessed on 27 December 2016).
  5. Davies, O.A.; Ezenwa, N.C. Groundnut cake as alternative protein source in the diet of Clarias gariepinus fry. Int. J. Sci. Nat. 2010, 1, 73–76. [Google Scholar]
  6. Enyidi, U.D.; Mgbenka, B.O. Replacement of fish meal with bambaranut waste meal in the diets of larval African catfish Clarias gariepinus Burchell (1822). Br. J. Appl. Sci. Technol. 2015, 5, 526–537. [Google Scholar] [CrossRef]
  7. Imorou Toko, I.; Fiogbe, E.M.; Kestermont, P. Mineral status of African catfish (Clarias gariepinus) fed diets containing graded levels of soybean or cottonseed meals. Aquaculture 2008, 275, 298–305. [Google Scholar] [CrossRef]
  8. Azaza, M.S.; Wassim, K.; Mensi, F.; Abdelmouleh, A.; Brini, B.; Karaiem, M.M. Evaluation of faba beans (Vicia faba L. var. minuta) as a replacement for soybean meal in practical diets of juvenile Nile tilapia Oreochromis niloticus. Aquaculture 2009, 287, 174–179. [Google Scholar]
  9. Gatlin, D.M., III; Barrows, F.T.; Brown, P.; Dabrowski, K.; Gaylord, G.T.; Hardy, R.W.; Herman, E.; Hu, G.; Krogdahl, Å.; Nelson, R.; et al. Expanding the utilization of sustainable plant products in aquafeeds: A review. Aquac. Res. 2007, 38, 551–579. [Google Scholar] [CrossRef]
  10. Francis, G.; Makkar, P.S.H.; Becker, K. Antinutritional factors present in plant-derived alternate fish feed ingredients and their effects in fish. Aquaculture 2001, 199, 197–227. [Google Scholar] [CrossRef]
  11. Torstensen, B.E.; Espe, M.; Sanden, M.; Stubhaug, I.; Waagbo, R.; Hemre, G.-I.; Fontanillas, R.; Nordgarden, U.; Hevroy, E.M.; Olsvik, P.; et al. Novel production of Atlantic salmon (Salmo salar) protein based on combined replacement of fish meal and fish oil with plant meal and vegetable oil blends. Aquaculture 2008, 285, 193–200. [Google Scholar] [CrossRef]
  12. Karunaratne, A.; Azam-Ali, S.; Sasey, A.; Adu-dapaah, H.; Crout, N. Modelling the effect of temperature, soil moisture and photoperiod on growth and development of bambara groundnut (Vigna subterranean (L.) Verdc.): BAMGRO model. Global issues. Paddock action. In Proceedings of the 14th Australian Agronomy Conference, Adelaide, Australia, September 2008; Unkovich, M.J., Ed.; Australian Society of Agronomy: Adelaide, Australia, 2008; p. 4. [Google Scholar]
  13. Enyidi, U.D. Production of feeds for African catfish Clarias gariepinus using plant proteins. Jyvask. Stud. Biol. Sci. 2012, 251. [Google Scholar]
  14. Dakora, F.D.; Muofhe, L.M. Nitrogen fixation and nitrogen nutrition in symbiotic bambara groundnut (Vigna subterranea (L.) Verdc.) and Kersting’s bean (Macrotyloma geocarpum (Harms) Marech. et Baud.). In Proceedings of the Workshop on Conservation and Improvement of Bambara Groundnut (Vigna subterranea (L.) Verdc.), Harare, Zimbabwe, 14–16 November 1995; Hekler, J., Begemann, F., Mushonga, J., Eds.; Biodiversity International: Harare, Zimbabwe, 1995; pp. 72–78. [Google Scholar]
  15. Basu, S.; Roberts, J.A.; Azam-Ali, S.N.; Mayes, S. Bambara groundnut. In Pulses, Sugar and Tuber Crops. Genome Mapping and Molecular Breeding in Plants; Kole, C., Ed.; Springer: Berlin, Germany, 2007; pp. 159–171. [Google Scholar]
  16. Vielma, J.; Koskela, J.; Ruohonen, K.; Jokininen, I.; Kettunen, J. Optimal diet composition for European whitefish (Coregonous lavaretus): Carbohydrate stress and immune parameters responses. Aquaculture 2003, 225, 3–16. [Google Scholar] [CrossRef]
  17. Ruohonen, K.; Koskela, J.; Vielma, J.; Kettunen, J. Optimal diet composition for European whitefish (Coregonus lavaretus): Analysis of growth and nutrient utilization in mixture model trials. Aquaculture 2003, 225, 27–39. [Google Scholar] [CrossRef]
  18. Ruohonen, K.; Simpson, S.J.; Raubeheimer, D. A new approach to diet optimization: A re-analysis using European whitefish (Coregonus lavaretus). Aquaculture 2007, 267, 147–156. [Google Scholar] [CrossRef]
  19. Kim, L.O.; Lee, S. Effects of the dietary protein and lipids levels on growth and body composition of bagrid catfish, Pseudobagrus fulvidraco. Aquaculture 2005, 243, 323–329. [Google Scholar] [CrossRef]
  20. NRC. Nutrient Requirements of Fish and Shrimp; National Research Council of the National Academies: Washington, DC, USA, 2011; p. 363. [Google Scholar]
  21. Kim, K.-D.; Lim, S.G.; Kang, Y.J.; Kim, K.-W.; Son, M.H. Effects of dietary protein and lipid levels on growth and body composition of juvenile far eastern catfish Silurus asotus. Asian-Australas. J. Anim. Sci. 2012, 25, 369–374. [Google Scholar] [CrossRef] [PubMed]
  22. Santinha, P.J.M.; Medale, F.; Corraze, G.; Gomes, E.F.S. Effects of the dietary protein:lipid ratio on growth and nutrient utilization in gilthead seabream (Sparus aurata L.). Aquac. Nutr. 1995, 5, 147–156. [Google Scholar] [CrossRef]
  23. Forster, I.P.; Dominy, W.G.; Lawrence, A.L.; Castille, F.L.; Patnaik, S. Optimization of a research diet for the Pacific white shrimp, Litopenaeus vannamei, using mixture model methodology. Aquaculture 2010, 298, 260–266. [Google Scholar] [CrossRef]
  24. Minjarez-Osorio, C.; Castillo-Alvarado, S.; Gatlin III, D.M.; González-Félix, M.L.; Perez-Velazquez, M.; Rossi, W., Jr. Plant protein sources in the diets of the sciaenids red drum (Sciaenops ocellatus) and shortfin corvina (Cynoscion parvipinnis): A comparative study. Aquaculture 2016, 453, 122–129. [Google Scholar] [CrossRef]
  25. Ruohonen, K.; Kettunen, J. Effective experimental designs for optimizing fish feeds. Aquac. Nutr. 2004, 10, 145–151. [Google Scholar] [CrossRef]
  26. Khan, M.; Abidi, S.F. Optimum histidine requirement of fry African catfish Clarias gariepinus (Burchell). Aquac. Res. 2010, 40, 1000–1010. [Google Scholar] [CrossRef]
  27. Fagbenro, O.A.; Davies, S.J. Use of soybean flour (dehulled, solvent-extracted soybean) as a fish meal substitute in practical diets for African catfish, Clarias gariepinus (Burchell 1822). J. Appl. Ichthyol. 2001, 17, 64–69. [Google Scholar] [CrossRef]
  28. Hu, M.; Wang, Y.; Wang, Q.; Zhao, M.; Xiong, B.; Qian, X.; Zhao, Y.; Luo, Z. Replacement of fish meal by rendered animal protein ingredients with lysine and methionine supplementation to practical diets for gibel carp, Carassius auratus gibelio. Aquaculture 2008, 275, 260–265. [Google Scholar] [CrossRef]
  29. Cheng, Z.J.; Hardy, W.R.; Usry, J.L. Effects of lysine supplementation in plant protein-based diets on the performance of rainbow trout (Oncorhynchus mykiss) and apparent digestibility coefficients of nutrients. Aquaculture 2003, 215, 255–265. [Google Scholar] [CrossRef]
  30. Yang, H.J.; Liu, Y.J.; Tian, X.L.; Liang, Y.G.; Hao, R.L. Effects of supplemental lysine and methionine on growth performance and body composition for grass carp (Ctenopharyngodon idella). Am. J. Agric. Biol. Sci. 2010, 5, 222–227. [Google Scholar] [CrossRef]
  31. Ng, W.-K.; Lim, P.-K.; Boey, P.-L. Dietary and palm oil source affects growth, fatty acid composition and muscle α-tocopherol concentration of African catfish, (Clarias gariepinus). Aquaculture 2003, 215, 229–243. [Google Scholar] [CrossRef]
  32. Manning, B.B.; Li, M.H.; Robinson, E.D.; Peterson, B.C. Enrichment of channel catfish (Ictalurus punctatus) fillets with conjugated linoleic acid and ω-3 fatty acids by dietary manipulation. Aquaculture 2006, 261, 337–342. [Google Scholar] [CrossRef]
  33. Storebakken, T.; Refstie, S.; Ruyter, B. Soy products as fat and protein sources in fish feeds for intensive aquaculture. In Soy in Animal Nutrition; Drackley, J.K., Ed.; Federation of Animal Science Societies: Champaign, IN, USA, 2000; pp. 127–170. [Google Scholar]
  34. Boyd, C.E.; Tucker, C.; Mc Nevin, A.; Bostick, K.; Clay, J. Indicators of resource use efficiency and environmental performance in fish and crustacean aquaculture. Rev. Fish. Sci. 2007, 15, 327–360. [Google Scholar] [CrossRef]
  35. Parrish, C.C. Determination of total lipid classes and fatty acids in aquatic samples. In Lipids in Freshwater Ecosystems; Wetzel, R.G., Art, M.T., Wainmann, B.C., Eds.; Springer: New York, NY, USA, 1999; pp. 4–20. [Google Scholar]
  36. Directive, C. Establishing community methods for the determination of amino acids, crude oils and fats, and olaquindox in feeding stuffs and amending directive 71/393/EEC, annex part a. Determination of amino acids. Off. J. Eur. Commun. L 1998, 257, 14–23. [Google Scholar]
  37. Onyimonyi, A.E.; Ugwu, S.O.C. Performance of laying hens fed varying dietary levels of bambara (Voandzeia subterrenea Thouars) offals. Int. J. Poult. Sci. 2007, 6, 223–226. [Google Scholar] [CrossRef]
  38. Cornell, J. Experiments with Mixtures: Designs, Models, and the Analysis of Mixture Data; John Wiley & Sons, Inc.: New York, NY, USA, 2002. [Google Scholar]
  39. R Development Core Team. R: A Language and Environment for Statistical Computing. Available online: http://www.R-project.org/ (accessed on 20 January 2017).
Figure 1. Surface responses of African catfish Clarias gariepinus as (a) specific growth rate (SGR); (b) feed conversion ratio (FCR); (c) final condition factor (CF); (d) final muscle lipid content (%); (e) economic conversion ratio (ECR) and (f) protein efficiency ratio (PER), to experimental feeds mixing Bam (BNM) with Soy (SBM) and/or fish meal (FM) for 28 days. The scale and flow of component axes are represented by numbers in parentheses and dashed lines. The grid lines represent response lines as per experimental region. The dots are experimental feeds (F1–F10) and they are shown in a) to ease the interpretation of the results.
Fishes 02 00001 g001
Table 1. The initial weight, final weight, specific growth rate (SGR), food conversion ratio (FCR), productive protein value (PPV), daily feed intake (DFI) feed fish efficiency (FFE) and protein efficiency ratio (PER) of African catfish fed 10 experimental diets (F1–F10, details in Table 4) during the 28-days experiment. Numbers represent mean ± SD of two replicated tanks.
DietInitial wt. (g)Final wt. (g)SGRFCRPPVFFEPER
Feed 133.9 ± 0.0049.2 ± 5.20 f1.83 ± 0.14 d1.65 ± 0.47 c16.8 ± 0.00 e01.64 ± 00 b
Feed 235.8 ± 1.3055.2 ± 5.9 f1.94 ± 0.64 d1.49 ± 0.23 c15.3 ± 0.01 e01.16 ± 0.59 b
Feed 335.1 ± 3.50122.2 ± 2.5 a4.92 ± 1.01 a0.67 ± 0.06 a32.9 ± 0.08 b1.99 ± 0.18 d2.46 ± 0.22 a
Feed 435.5 ± 1.4063.6 ± 1.30 e2.08 ± 0.80 c1.69 ± 0.27 c19.2 ± 0.03 d02.72 ± 0.09 a
Feed 535.6 ± 2.83111.2 ± 5.30 b3.77 ± 0.80 b0.98 ± 0.04 b37.8 ± 0.03 a1.30 ± 2.03 c2.34 ± 0.05 a
Feed 634.6 ± 1.90109.3 ± 1.1 b3.74 ± 0.57 b0.84 ± 0.04 b31.1 ± 0.01 b1.12 ± 0.06 b2.30 ± 0.13 a
Feed 734.9 ± 6.4085.8 ± 5.90 c3.22 ± 0.35 b1.11 ± 0.11 e28.7 ± 0.01 b1.00 ± 0.02 b2.07 ± 0.03 a,b
Feed 835.4 ± 4.24106.9 ± 6.70 b3.94 ± 0.82 b0.82 ± 0.06 b30.0 ± 0.01 b1.46 ± 0.04 c2.37 ± 0.06 a
Feed 934.7 ± 3.5058.1 ± 5.90 e,f1.84 ± 0.63 d1.62 ± 0.60 c15.1 ± 0.02 e0.72 ± 0.02 a1.41 ± 0.09 b
Feed 1036.2 ± 1.2076.4 ± 2.80 d2.67 ± 0.29 c1.31± 0.1 d25.7 ± 0.03 c0.58 ± 0.01 a2.06 ± 0.03 a,b
Values within a column sharing the same superscript are not significantly different (p < 0.05).
Table 2. Amino acid contents (g·kg−1 as fed basis) of the 10 experimental feeds (details in Table 3) fed to African catfish fingerlings during the 28-day experiment.
Amino AcidF1F2F3F4F5F6F7F8F9F10
Arginine11.4923.3328.5517.4120.0225.9421.1324.8422.2316.31
Histidine4.637.9310.516.287.579.227.699.107.816.16
Isoleucine7.4713.8819.8210.2813.2616.8613.4716.6513.6810.08
Leucine12.1723.6032.9617.8822.5728.2822.9127.9423.2617.54
Lysine9.0719.2134.1514.1421.6226.6920.8227.4920.0214.95
Methionine2.304.5112.913.407.608.716.579.745.544.43
Cysteine1.775.054.993.413.385.023.934.464.492.85
Phenylalanine8.6115.9317.5512.277.1716.7414.0315.7914.9811.32
Tyrosine7.1711.4414.089.3010.6312.7610.9012.4911.179.03
Threonine5.1212.1018.158.6111.6415.1311.7914.9811.958.45
Valine7.5516.5127.0012.0317.2821.7617.0222.0216.7712.90
Table 3. Formulation (g·kg−1) and proximate composition (percent as fed basis) of the 10 experimental feeds used in the 28-day feeding experiment for African catfish. The variable part (60%) of the feed consisted of bambaranut meal (BNM), soybean meal (SBM) and/or fish meal (FM).
IngredientF1F2F3F4F5F6F7F8F9F10
BNM600003003000200100100400
SBM060003000300200100400100
FM006000300300200400100100
Bloodmeal100100100100100100100100100100
Wheat205205205205205205205205205205
Premix a25252525252525252525
Fish oil70707070707070707070
Total1000100010001000100010001000100010001000
Proximate composition (%)
Protein27.347.055.439.743.952.443.952.146.837.5
Fat18.413.821.913.718.117.217.818.215.413.3
Moisture5.56.56.76.36.96.16.16.36.46.2
Protein:Lipid1.5:13.4:12.5:12.9:12.4:13.0:12.4:12.8:12.9:12.8:1
Ash0.20.75.93.04.22.23.75.41.50.7
a Vitamin premix, supplied per kg−1 diet: cholecalciferol, 1300 IU; all-race-α-tocopheryl acetate 140 IU, menadione sodium bisulfite 12 mg, thiamin HCL 8 mg, riboflavin 16 mg, calcium d-pantothenate 17 mg, biotin 0.2 mg, folic acid 5 mg, vitamin B12, 0.02, niacin, 40 mg; pyridoxine HCl, 16 mg; ascorbic acid (Stay C) 80 mg, magnesium phosphate 5000 mg, potassium carbonate 400 mg, manganous sulfate 10, ferrous sulfate 5 mg, zinc sulfate 80 mg.
Table 4. Amino acid contents of ingredients (g·kg−1) used in formulating diets for African catfish, substituting fishmeal (FM) with bambaranut meal (BNM) and soybean meal (SBM).
Amino AcidFMBNMSBM
Arginine45.417.036.7
Histidine16.56.712.2
Isoleucine31.39.421.4
Leucine51.917.236.3
Lysine55.713.930.8
Methionine20.83.16.8
Cysteine7.42.07.5
Phenylalanine27.112.224.4
Tyrosine22.010.517.6
Threonine29.07.318.9
Valine43.010.625.5

