A Novel Method for the Combined Photocatalytic Activity Determination and Bandgap Estimation


Department Materials, Environmental Sciences and Urban Planning (SIMAU), Università Politecnica delle Marche, 60131 Ancona, Italy
*
Author to whom correspondence should be addressed.
Methods Protoc. 2018, 1(2), 22; https://doi.org/10.3390/mps1020022
Submission received: 10 May 2018
/
Revised: 30 May 2018
/
Accepted: 8 June 2018
/
Published: 11 June 2018
Abstract
:The ability of a photocatalyst to degrade a target pollutant is a commonly used method to assess its effectiveness for environmental applications, while ultraviolet-visible (UV-vis) spectroscopy and spectroscopic ellipsometry are conventional techniques for the estimation of a semiconductor band gap. In this work, an array of six light-emitting diodes (LEDs), characterized by different emission peaks between 470–370 nm and absorbed power of 3 W, was implemented into an existing standard testing apparatus for the testing of nitrogen oxides degradation in air. The abatement indexes, obtained under different LEDs irradiation, were firstly compared to the ones determined according the standard and, secondly, correlated with the measured LED emission spectrum, in order to estimate the photocatalyst band gap. Results suggest that this expeditious technique can be easily implemented into existing testing apparatus for the estimation of the band gap and for the appraisal of photocatalytic materials under realistic conditions.
1. Introduction
The exponential growth in the number of publications on titanium dioxide photocatalysis, driven mainly by the multidisciplinary nature of the matter, is due to the variety of applications in the environmental and energy fields, including air and water purification systems, self-cleaning surfaces, sterilization, hydrogen evolution, and synthesis of high-added value products.
Ultraviolet (UV)-visible absorption spectra are generally used to estimate the excitation wavelengths, in order to accurately calculate the semiconductor band gap energy, while degradation of methylene blue, nitrogen oxides (NOx), volatile organic compounds (VOCs), among many others (Table 1), under UV or visible irradiation, are the most effective methods to investigate the photocatalytic activity and efficiency.
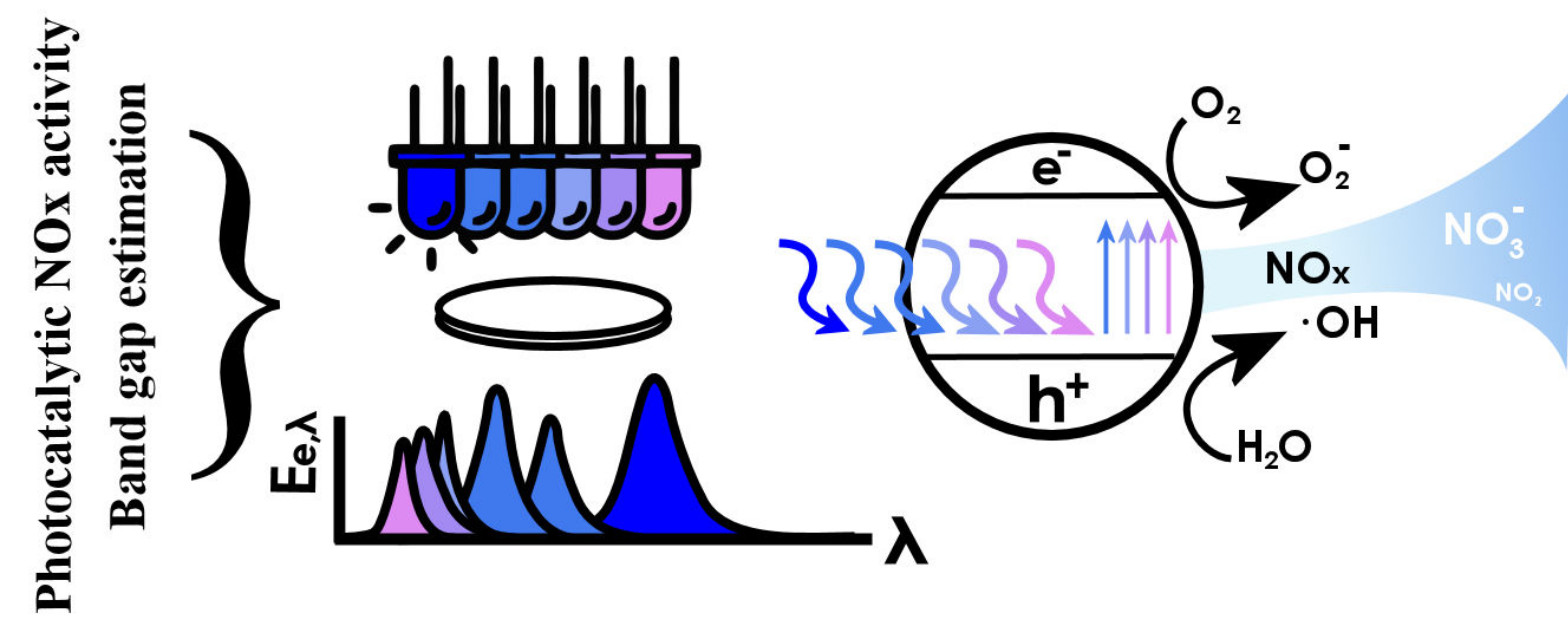
Our original motivation was to develop a new method to come to terms with both requests: by using a multi-LED (light-emitting diode) reactor, characterized by different selectable emission peaks, we have studied if it is possible to obtain both a good estimation of the photocatalytic activity and the sample bandgap appraisal.
Although titanium dioxide (TiO2) is one of the most studied photocatalysts because of the highest efficient photoactivity and stability, the lowest cost and the non-toxicity to humans, its use in environmental applications is limited due the low light energy density and the small amount of solar UV radiation that the TiO2 can utilize [1].
Scientific interest is currently mainly addressed in investigating new strategies for enhancing the photocatalytic activity, by increasing surface area and porosity or by incorporation of additional components into the TiO2 lattice. Among those, chemical modification is needed to obtain an active photocatalyst in the visible electromagnetic spectrum region.
In this study, four different TiO2-based materials have been tested to assess the goodness of the reported method:
- Degussa (Evonik, Essen, Germany) P25 (from now P25) is considered a de facto standard in TiO2-photocatalysis because of its relatively high activity. It is well known that the P25 composition is made of anatase and rutile in a variable ratio, typically between 70:30 or 80:20 [1].
- KRONOClean7000 (KRONOS, Dallas, TX, USA) is a carbon-modified commercial anatase mainly addressed for indoor applications, due its visible-light response.
- A silica/titania composite (hSiO2/TiO2) was prepared, with a hydrothermal method, in our laboratory, with the aim of increasing the surface area of the photocatalyst. The titania content is 7% (w/w), in the anatase form (Section 3.1).
- The titania-only (hTiO2), synthesized under the same conditions, is tested as well for comparison.
Nitrogen oxides (NOx) refer to the couple nitric oxide (NO) and nitrogen dioxide (NO2), which is a major criteria in air pollution control, as it is responsible for tropospheric ozone and secondary particulate, and, together with SOx, is the largest contribution for acid rain.
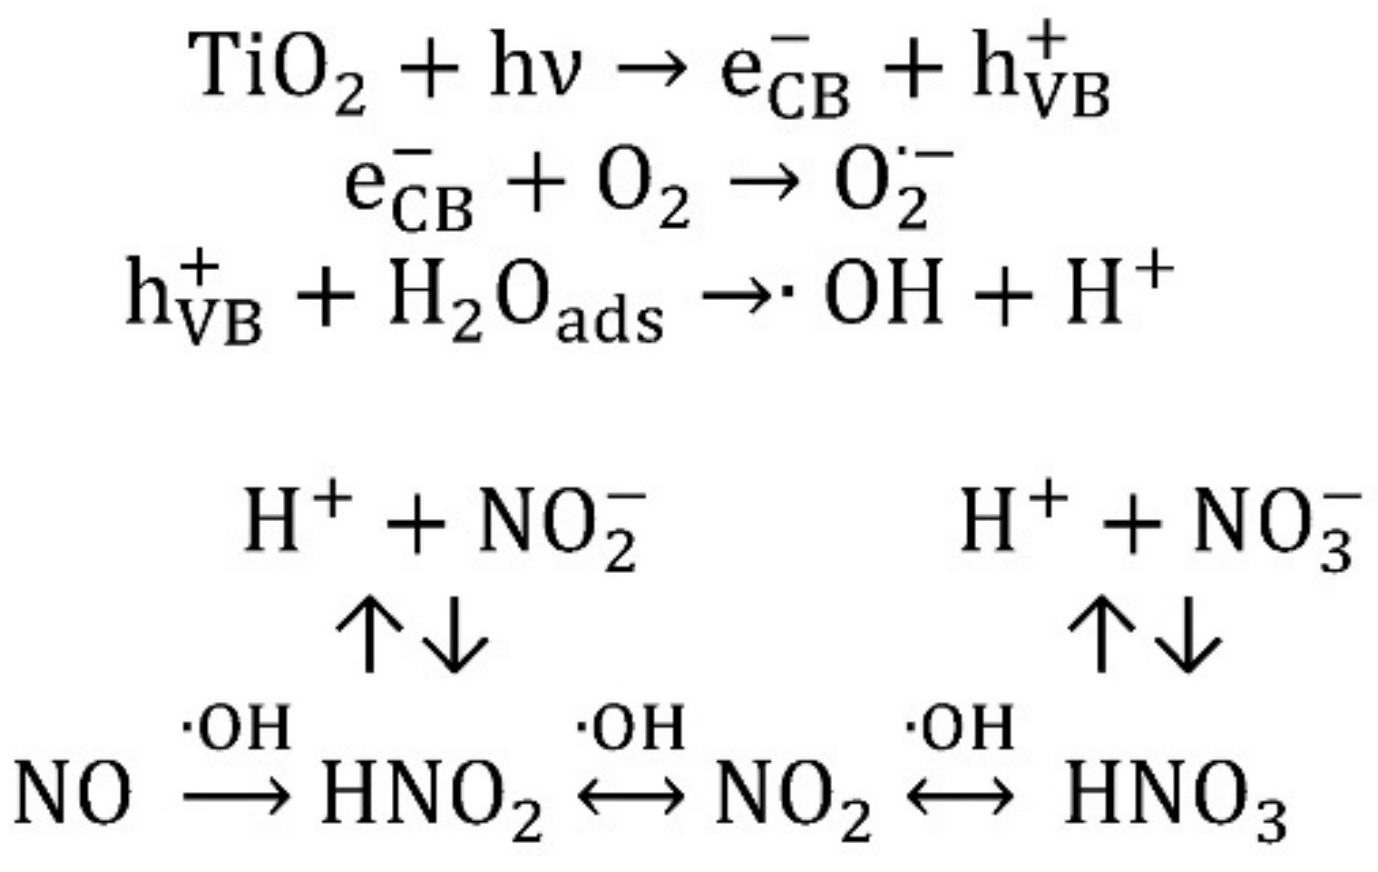
Nitrogen oxides degradation is an effective and widely used method to evaluate the photocatalytic activity, as it is possible to evince from Table 1, both because the adsorbability of NO is generally low, both because the oxidative pathway is well reported in literature [2,3,4]. As heterogeneous photocatalysis is a surface phenomenon, the adsorption of NOx over the catalyst is the first step of NOx degradation. Subsequently, when the photocatalyst is irradiated with photons having energy (hν) equal or higher than the bandgap of the semiconductor, it generates an electron–hole pair, which implies the oxidation of NO and the water reduction. A simplified reaction mechanism, proposed by Devahasdin et al. [3], under short space steady state times, is reported in Figure 1.
It is possible to observe that the hydroxyl radical plays a primary role in the overall reaction pathway. Nitrates (NO3−) produced and accumulated on the surface of the catalyst might act as a physical barrier, inhibiting the photocatalytic process and moving the equilibrium toward the NO2.
The most common sources of UV are low, medium, and high-pressure mercury arc lamps, which show the disadvantages associated with their fragility and hazardous mercury content, which relates also to their disposal. The low efficiency, due the high heat generated, and their relatively short working lifespan (500−2000 h) make them unsuitable for full-scale applications. On the other way, LEDs have already been used for many photocatalytic applications, due to their low cost, longer lifespan than conventional light sources, low energy consumption and to their well-defined emission peak, which makes unnecessary the use of a cutoff filter [5].
Levine et al. [6] demonstrated that the UV-A LED is a viable alternative to the Hg-vapor lamps if the design of the LED arrays is improved to increase the lighting uniformity and the results proved that LEDs are a viable photon source both in terms of reaction quantum efficiency and wall plug efficiency. For this reason, modeling and computation fluid dynamic became important studies [7].
Wang et al. [8] used four different LED strips emitting blue, green, yellow and white lights to activate a C–N co-doped TiO2, and they found a decreasing bisphenol A removal efficiency by increasing the wavelength of the LED.
An interesting application of LED was made by Korovin et al. [9], in which was found that the usage of controlled periodic illumination increases quantum efficiency as duty cycle approaches small values. Moreover, such experiment is a powerful tool for direct evaluation of lifetimes of reactive intermediates.
A few authors have already implemented LEDs as a luminous source to activate the photocatalysts, in order to study of the photocatalytic activity of such materials towards the degradation of gaseous pollutants [6,7,9,10], water pollutants [8,11,12,13], dyes [14] and bacteria inactivation [15,16]. As the choice of a suitable light source is a fundamental choice, the use of an array of LEDs, characterized by different emitted wavelengths, can provide more information on the photocatalysts under examination. For these reasons, six LEDs, characterized by different emission peaks, were used in this work to activate the photocatalysts and to provide a rough estimation of the photocatalyst bandgap. According to the current knowledge of the authors, this is the first attempt to estimate the bandgap of different photocatalysts, through the direct measurement of a target pollutant degradation under different lighting conditions.
2. Materials and Methods
2.1. Characterization of TiO2-Based Materials
Ultraviolet–visible (UV-Vis) diffuse reflectance spectroscopy is one of the most employed method for the determination of the band gap energy of semiconductors and amorphous solid material.
Through the absorption spectra, estimated by the Kubelka-Munk method, UV-Vis spectroscopy provides information about the electronic transitions of the different orbitals of a solid. In this study, a Jasco V-670 spectrometer (JASCO Germany GmbH, Pfungstadt, Germany), equipped with a Jasco ILN-725 integrating sphere (JASCO Germany GmbH, Pfungstadt, Germany), has been used to measure the diffuse reflectance of the samples, in the range of 200–800 nm (data interval = 0.5 nm, UV-vis bandwidth = 1.0, scan speed = 200 nm/min). Bandgap energy has been estimated by performing the Kubelka-Munch transformation.
The powder X-ray diffraction (XRD) patterns were recorded on was performed with a Philips PW 1730 diffractometer (Philips, Eindhoven, Netherlands) (CuK radiation and 0.02 2θ s−1 scanning rate) operating between 3 and 50 2θ and equipped with software for the spectra evaluation.
2.2. Nitrogen Oxides Apparatus
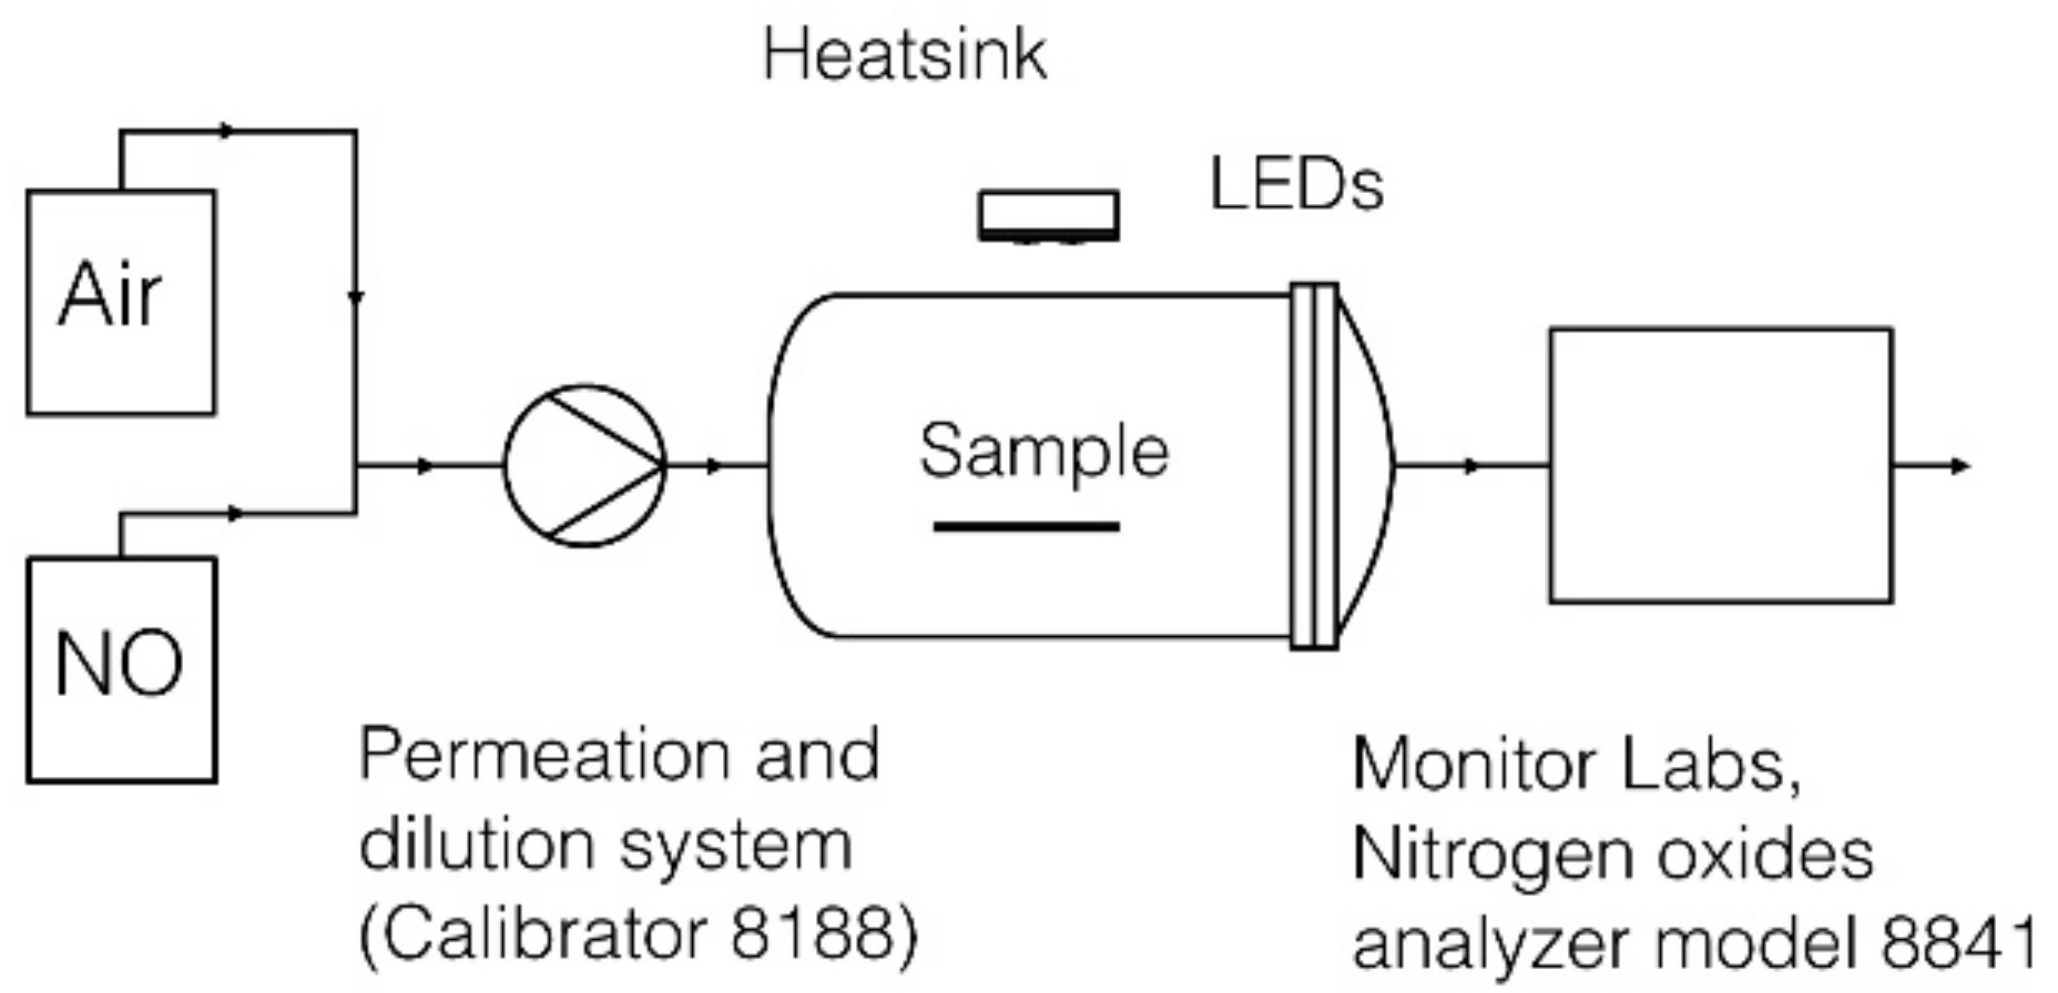
The apparatus, the test conditions and the reactor were adopted by the Italian standard UNI 11247, where a continuous flow test method is used for the determination of the degradation of nitrogen oxides in the air by inorganic photocatalytic materials. Figure 2 shows the experimental apparatus.
The NOx flux inside the reactor is provided by a NOx tank (499 ppb NO) (SAPIO S.r.l., Monza, Italy) and it is kept constant with a dilution system (Calibrator 8188, Rancon Instruments s.p.a., Milan, Italy). Dilution is obtained by mixing with atmospheric air at room temperature (27 ± 2 °C) and relative humidity between 40–50%. Outlet gaseous NO and NO2 concentrations were continuously monitored by a chemiluminescence NOx analyzer (Nitrogen oxides analyzer model 8841, Monitor Labs, Englewood, CO, USA).
The photoreactor consists of a 3 L Pyrex glass cylinder, LEDs are located at the center of the reactor, over the sample, outside the reactor. The samples examinations are positioned inside at the center of the reactor.
Colloidal samples of various TiO2-based powders were prepared by sonication of an aqueous slurry for one hour, followed by concentration on a glass surface by slow evaporation under an infrared (IR) lamp. The dried samples were stored in a sealed chamber and exposed one hour to laboratory environments, prior the test.
2.3. LED Characterization
Light-emitting diodes were purchased from Shenzhen Chundaxin Photoelectric Co. (Shenzhen, China) and they were chosen for their different emission peak; their characteristics are reported in Table 2.
Light-emitting diode spectrums were measured in the 200–800 nm range by using a spectrometer (model CAS 120, Instrument Systems, Munich, Germany). The CAS 120 is equipped with a crossed Czerny-Turner spectrograph and an array detector. The spectral resolution is 2.7 nm, the data point interval is 0.35 nm, the wavelength accuracy is ±0.3 nm, and the integration time is 60–870 ms. Spectral irradiance () was measured at three distances (d) and it was found the following inverse-squared relation:
Spectrum peaks and widths were calculated by approximating spectra to normal distributions:
where is the wavelength at which the spectrum is centered (nm) and is the variance.
Data fitting was performed with MATLAB data fit tool. For sake of simplicity, Table 2 reports only one set of measurements, at a given distance, with the corresponding data fitting results and goodness.
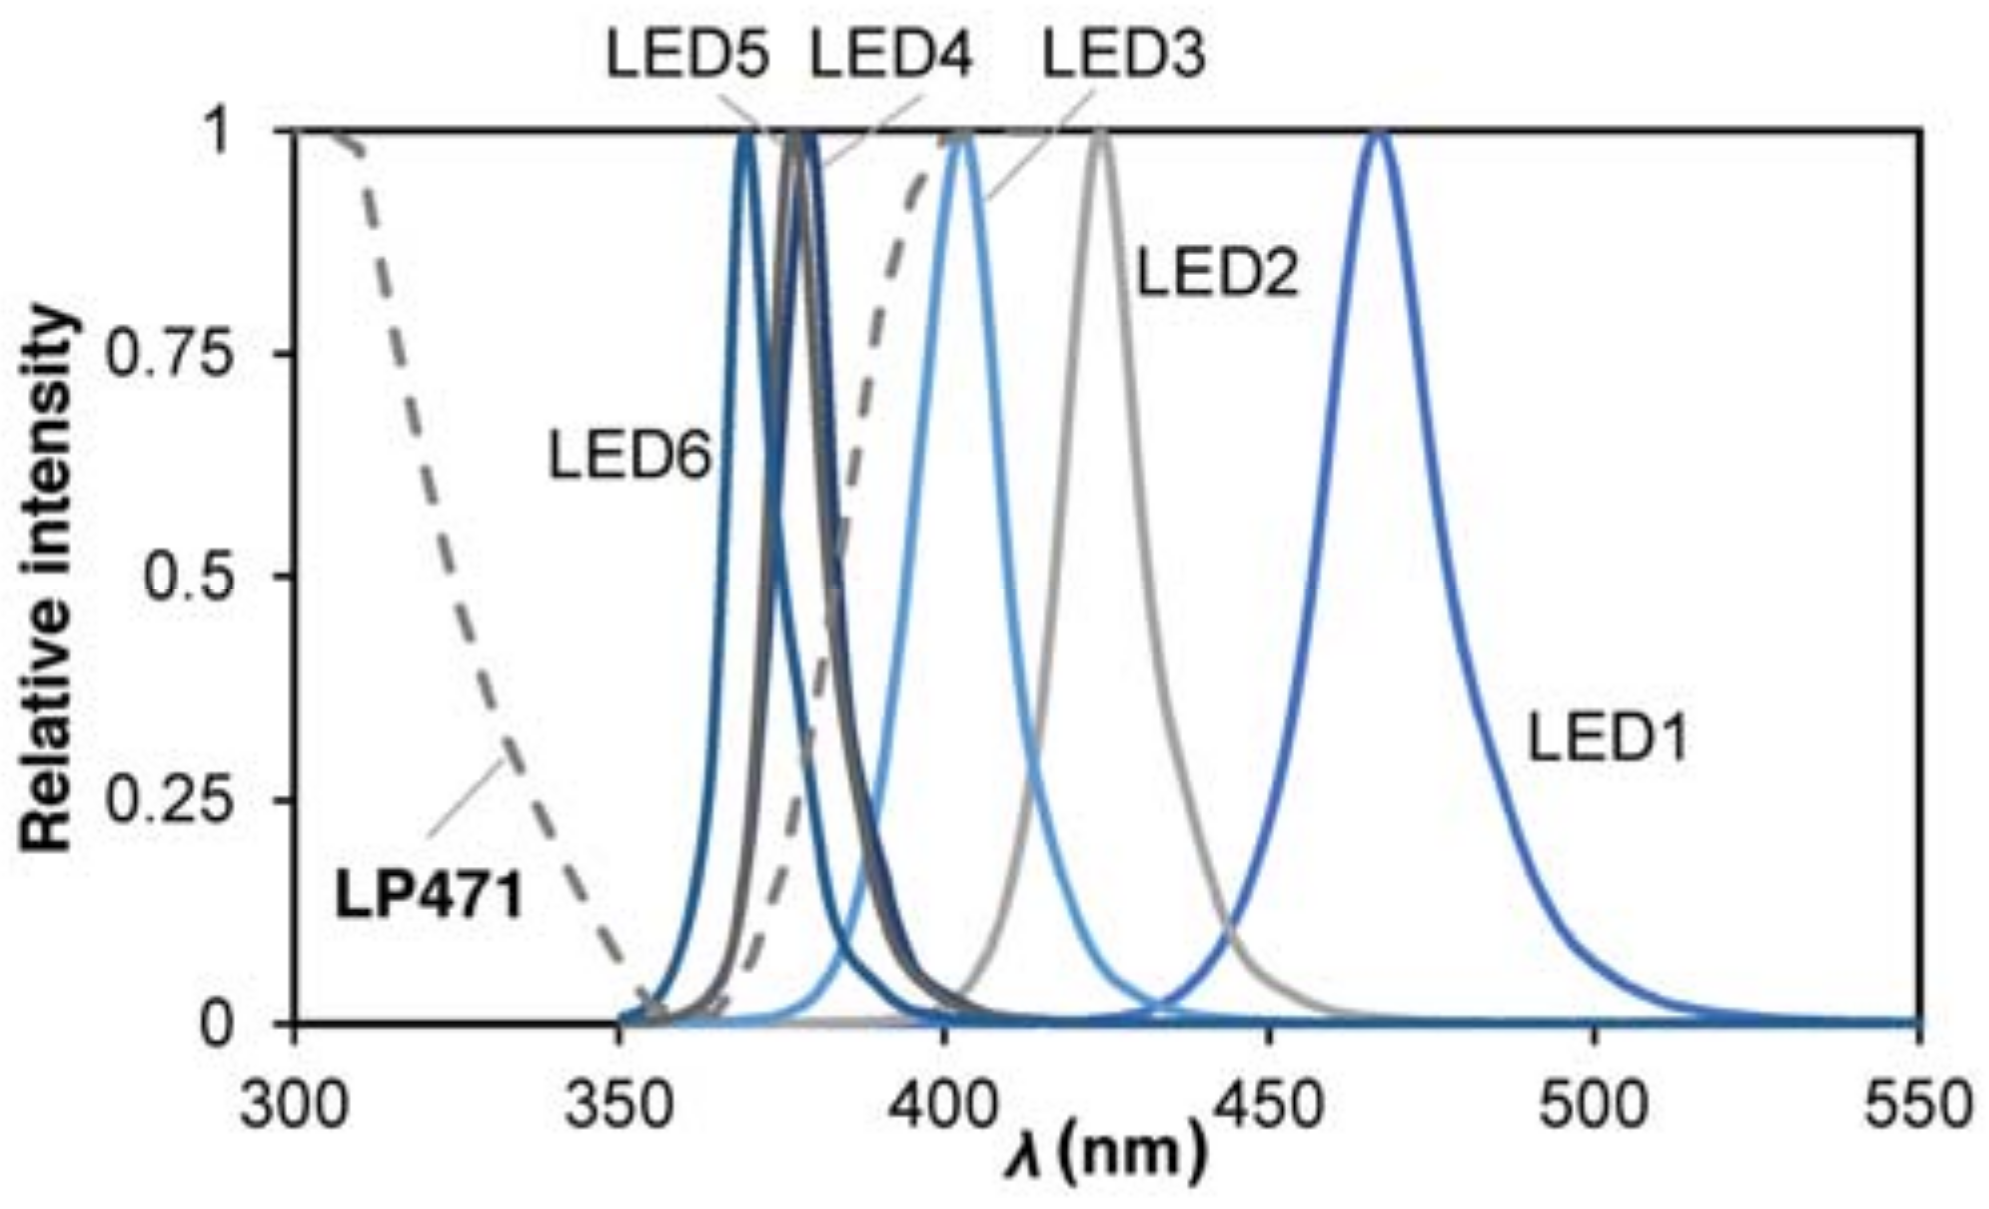
Measured LEDs relative intensity of emission spectra are reported in Figure 3.
This combination of LEDs was chosen to point to the study in the 420–365 nm region, as showed by the overlapping region of the different spectra. It can be noticed how the emission peaks differs from the central value of the declared interval. Irradiance was also measured with a photoradiometer (Delta Ohm, HD2102.2, Padua, Italy) with a probe centered in the field of the UV-A with a resolution of 0.001 W·m−2 (LP471), inside the reactor, for keeping into account the effect of the borosilicate glass reactor. This optical window is reported in Figure 3 by the dotted line.
The intensity of the photon energy () provided by the different LEDs lights was calculated from the inverse relationship:
where h is Planck’s constant and c is the speed of light. The values of the used constants are = 6.626 × 10⁻³⁴ J·s and = 2.998 × 10⁸ m/s.
2.4. Test Procedure Description
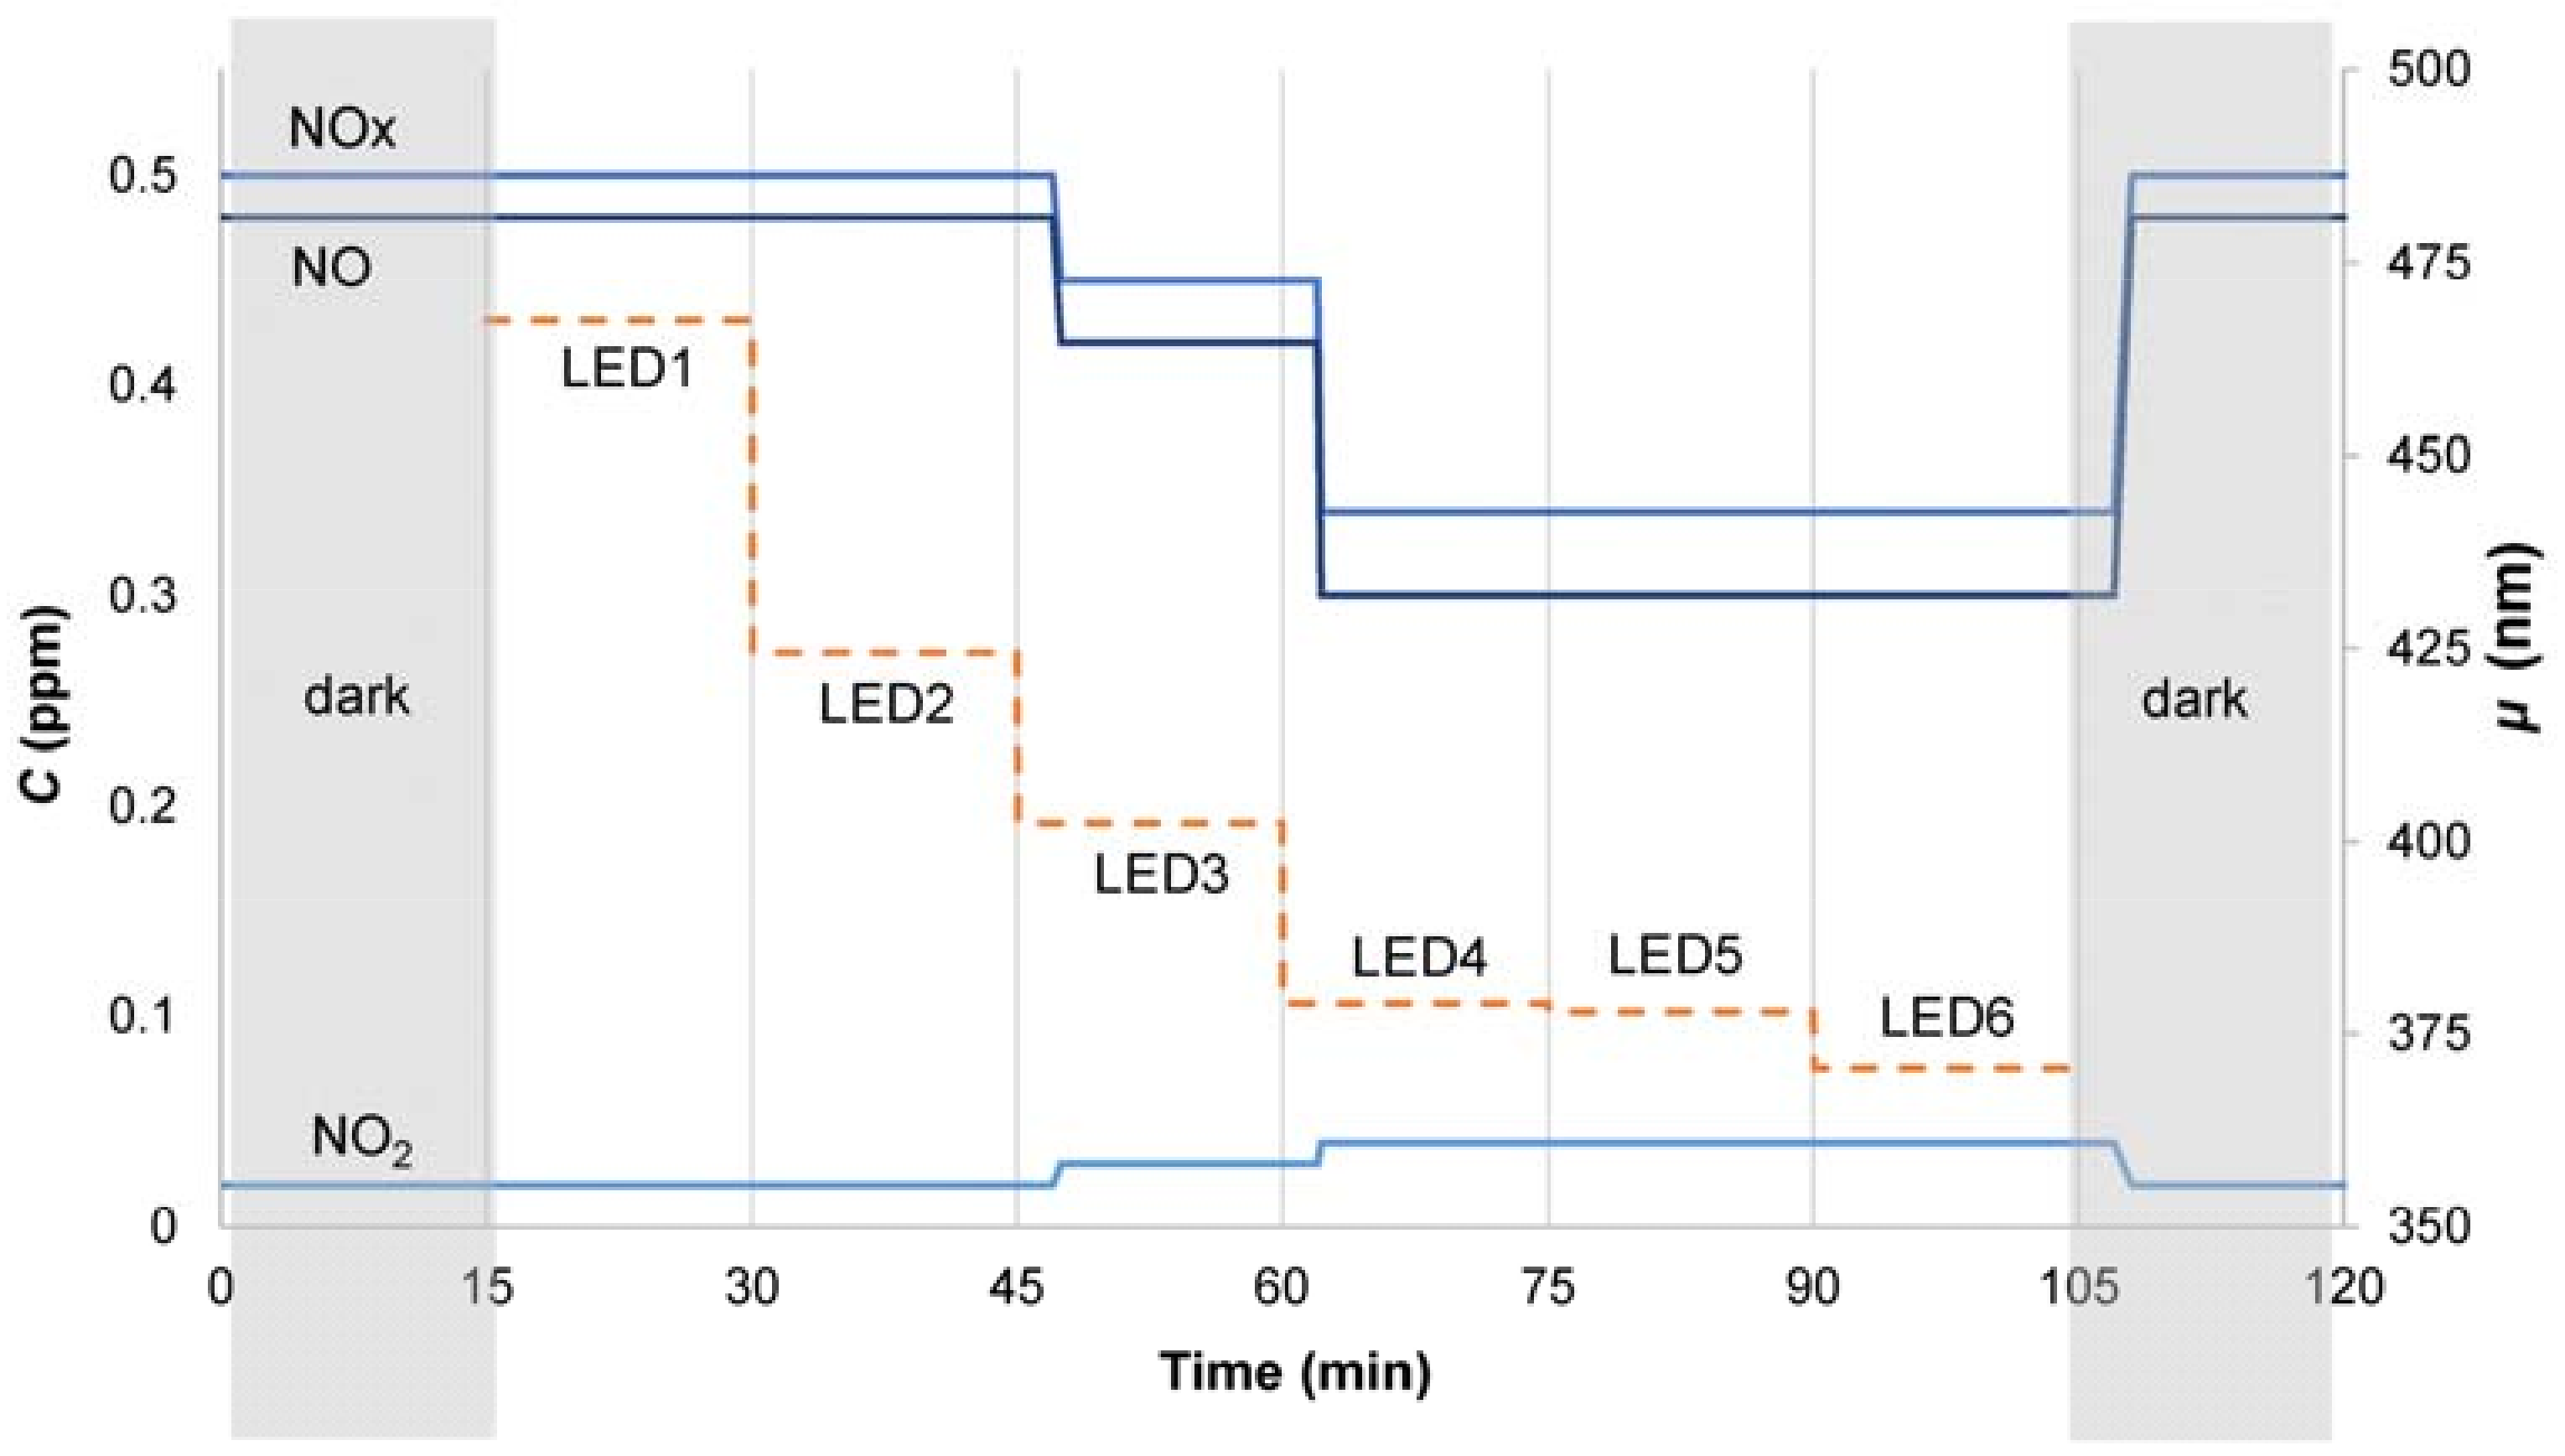
Once the sample is placed inside the reactor, and the inlet NOx gas concentration is stationary, the first LED, characterized by the highest μ, is turned on. After 15 min, it is turned off and the second LED is turned on for other 15 min. This procedure is repeated until all the six LEDs are exposed; the NOx and NO concentrations are monitored during the whole test. A generic schematic of the test is shown in Figure 4.
It is possible to observe in Figure 4 the time shift between the moment at which the LED is turned on and the beginning of the decrease of the NOx concentration, a lag time that indicates the hydraulic residence time of the photocatalytic reactor.
NO activity () is an index to describe the photocatalytic activity toward the degradation of NO, in which and are respectively the averaged concentrations of NO during dark and UV conditions, for each LED:
Similarly, the difference between the NO2 concentration under light and dark conditions, normalized on the NO concentration, can be considered as an index related to the unwanted NO2 selectivity. As is greater than , the minus in front of the equation is to maintain positive sign to the index:
2.5. Data Elaboration
By comparing the index, it was possible to individuate the wavelength at which the photocatalyst activates, so to estimate the bandgap. Two methods are reported:
A first more intuitive approach is based on a simply observation at which LED interval the photocatalyst activation occurs. An activity () greater than 0.05 is assumed as a threshold between the minimal observable activity and the background noise; this method however only provides an interval of reference, which strictly depends on the chosen LEDs.
The second method proposed provides a more accurate estimate of the activation energy. A detailed explanations of the method adopted is described in the following.
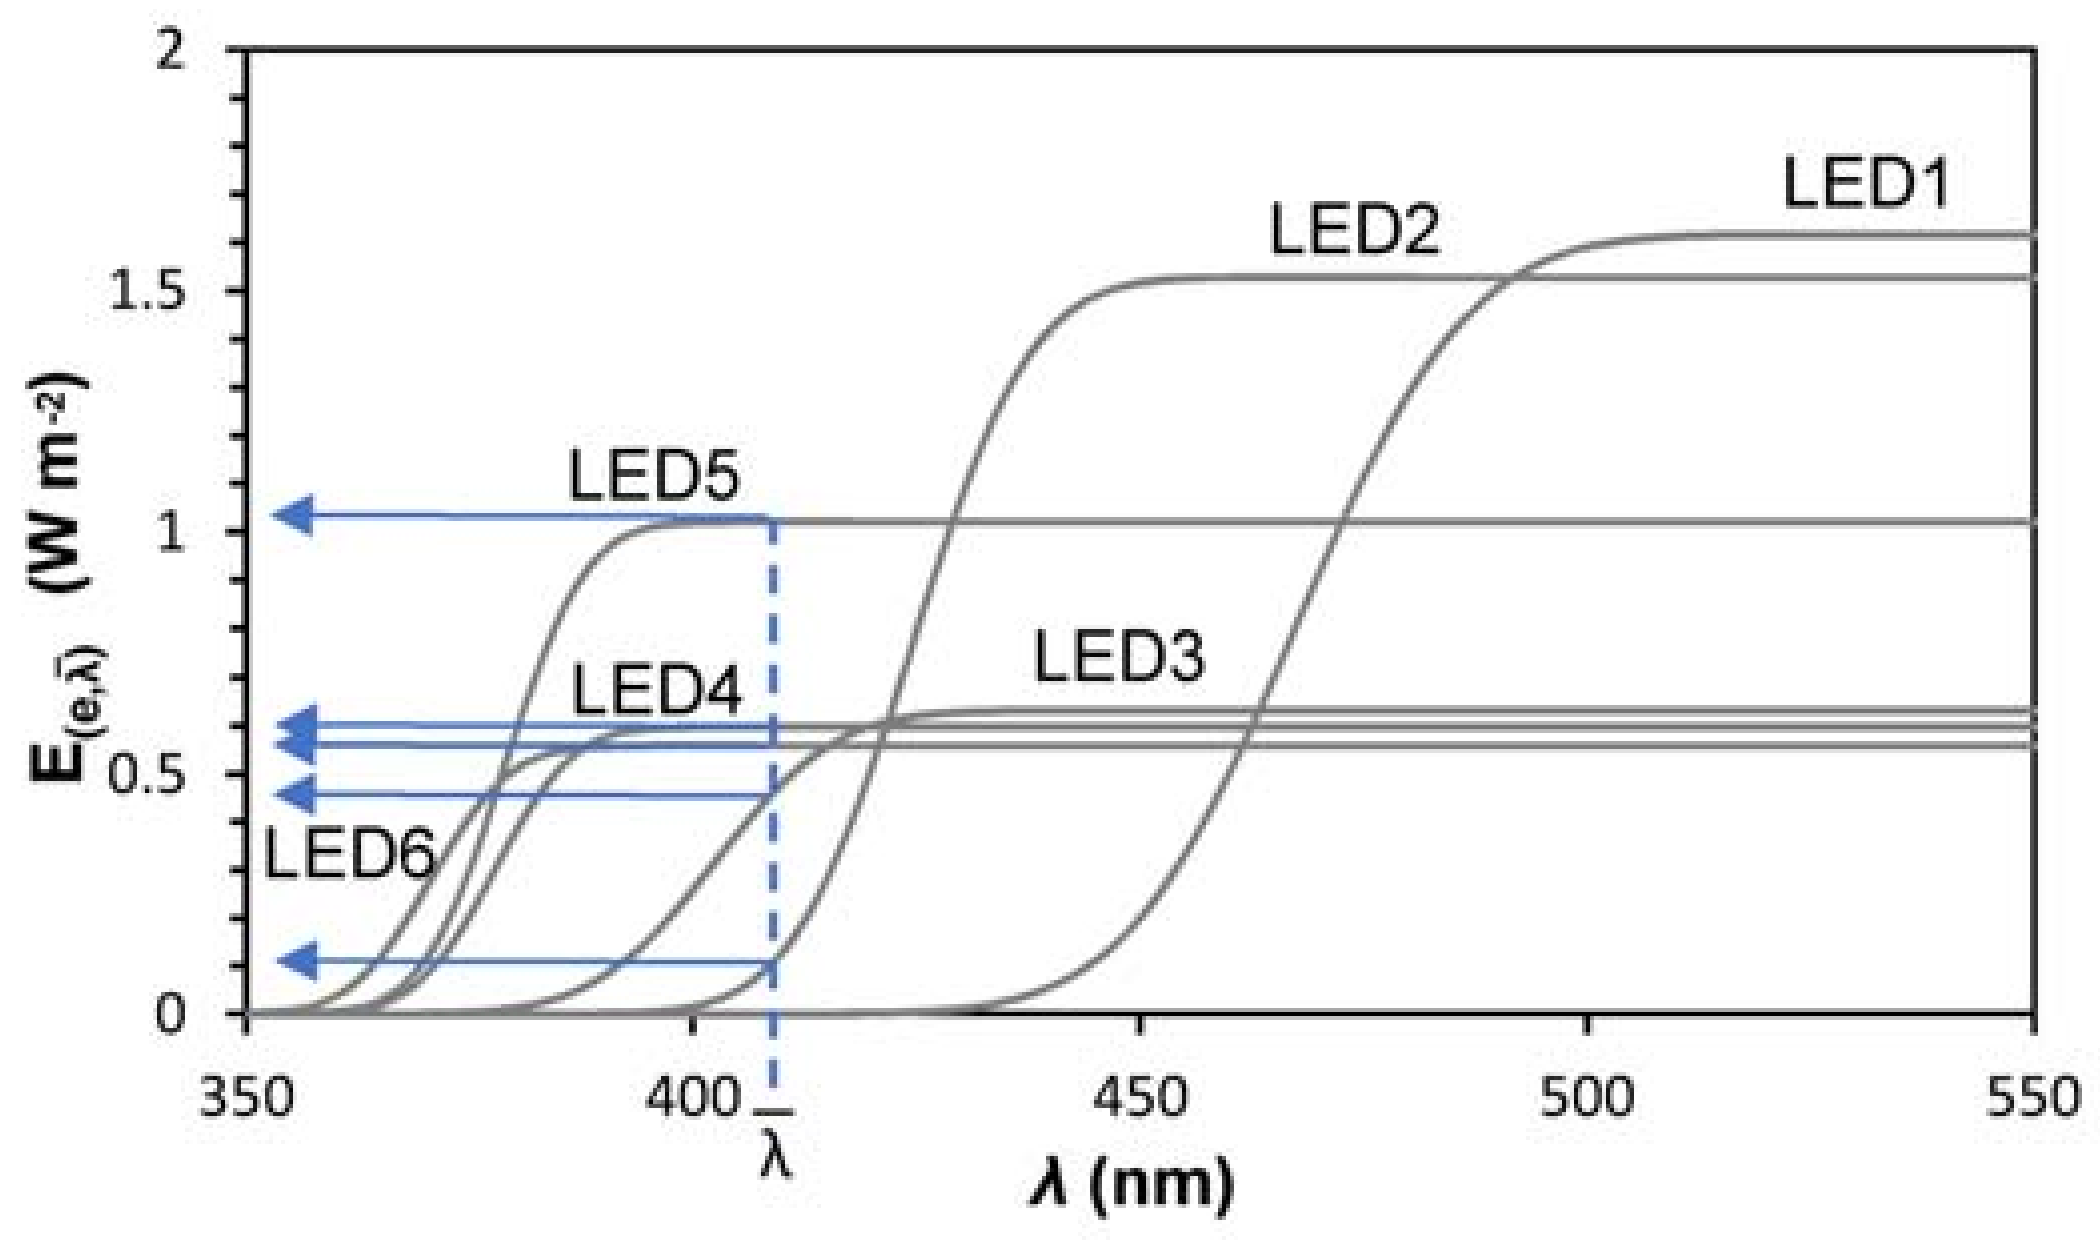
Since the LED emission spectrum is well represented by a normal distribution, the cumulative distribution function is given by the equation:
represents the total irradiance for < , in which is the highest wavelength, at which corresponds the minimum energy necessary to activate the photocatalyst. For ease of interpretation, these functions are plotted in Figure 5.
Assuming that a generic photocatalyst, having a band gap of E0, is activated by an electromagnetic radiation having a wavelength at , it will exhibit photocatalytic activity ANO, only when radiated by LEDs 2, 3, 4, 5 and 6. Moreover, the relation between photon flow (light irradiance) and photocatalytic activity, for < 1 Wm−2, expressed as NO oxidation rate, can be considered linearly dependent [16,17].
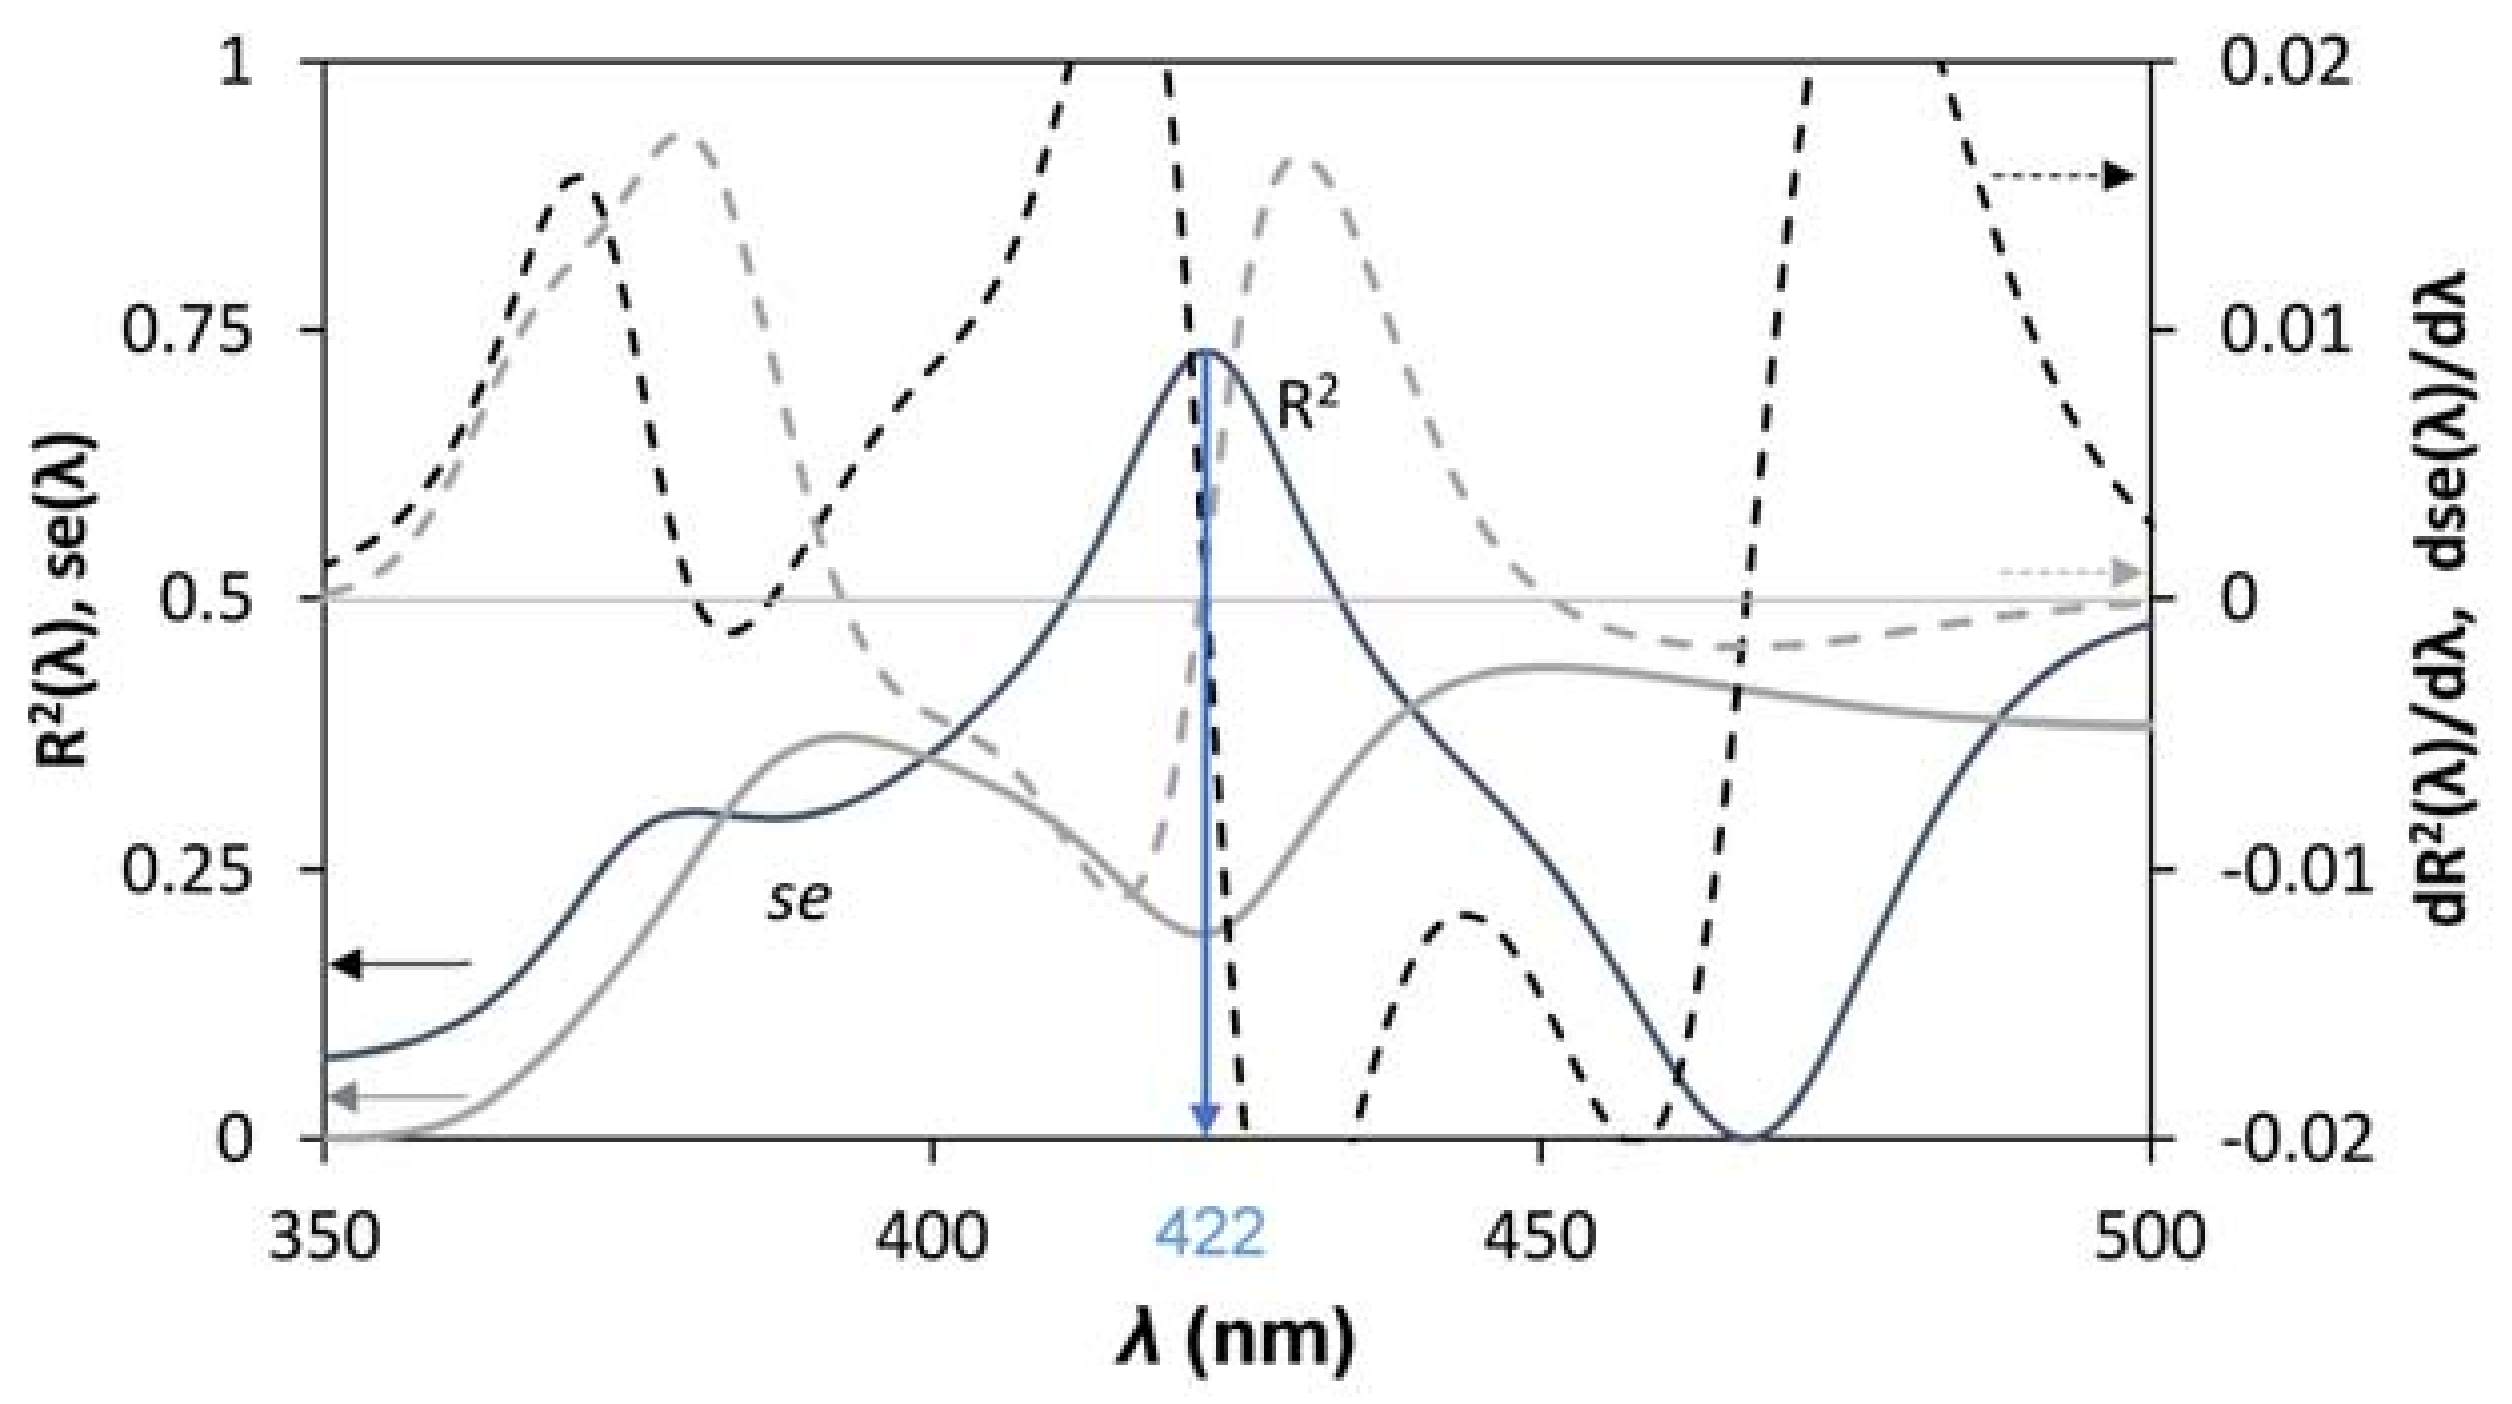
By computing the goodness of the linear fit between and ANO, for ANO > 0, in the interval (nm), it is possible to estimate the value of . The goodness of the fit was evaluated by mean of maximizing the coefficient of determination, R2, and minimizing standard error, se. To highlight the maximum and minimum of the functions, the first derivative was computed. An example is reported in Figure 6.
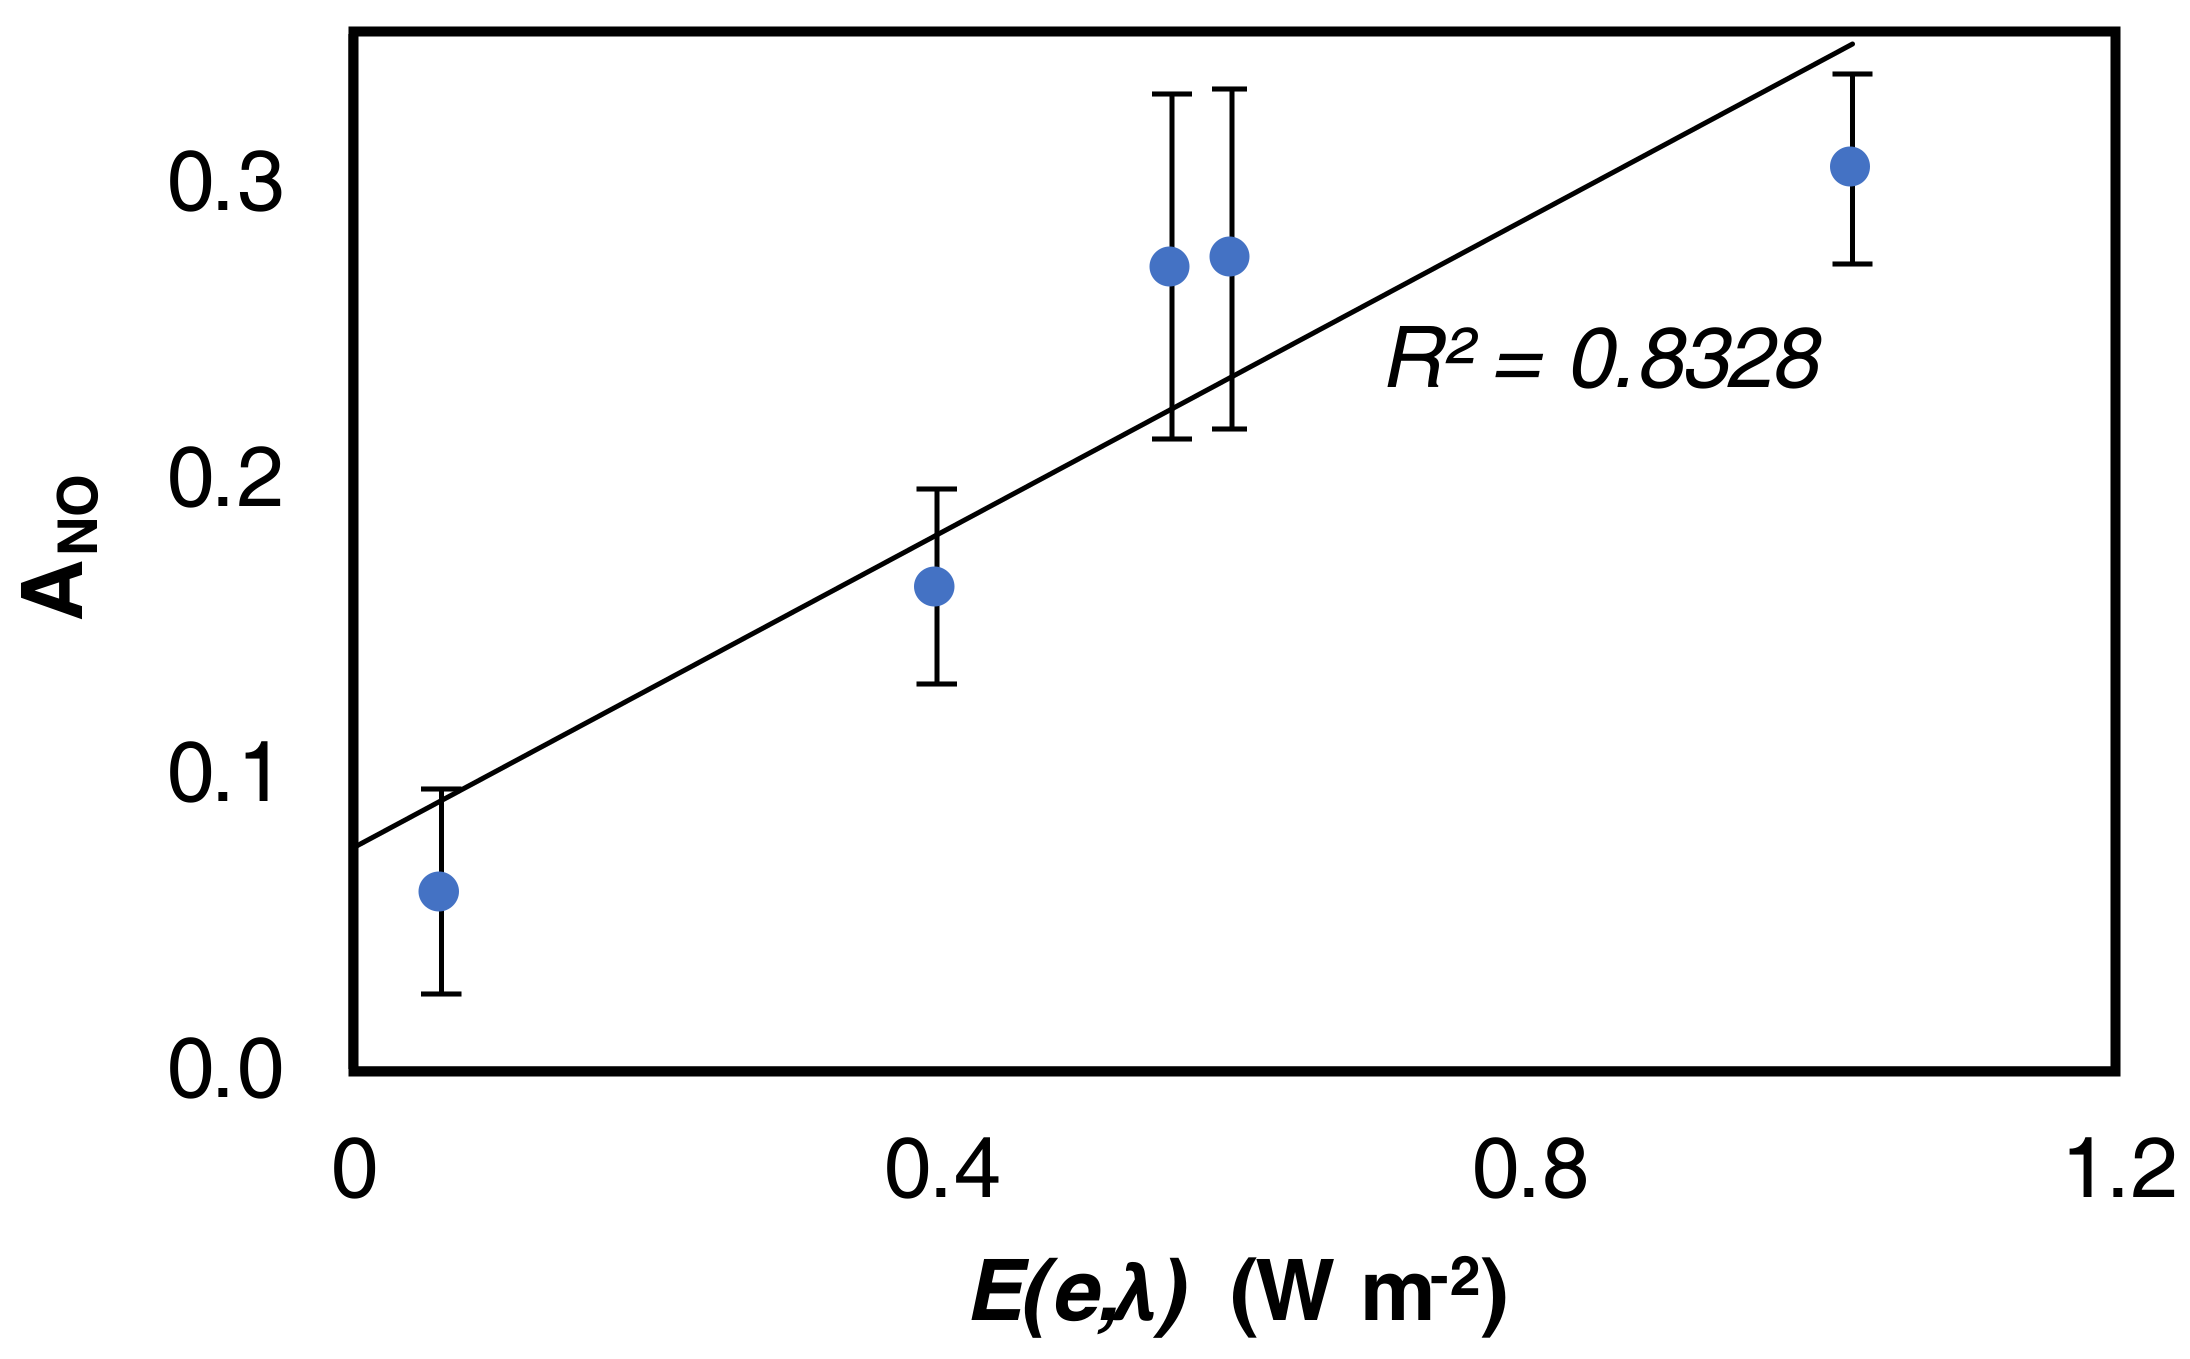
Once has been estimated, it is possible to plot the relation between the two variables in order to evaluate the fit (Figure 7).
3. Results
3.1. Characterization of TiO2-Based Materials
The band gaps optically obtained by plotting (Khν)1/2 versus the energy of absorbed light are approximately 3.05 and 3.25 eV, respectively for the P25 and the two titania synthesized by the hydrothermal method. The KRONOClean shows a bandgap of 2.32 eV.
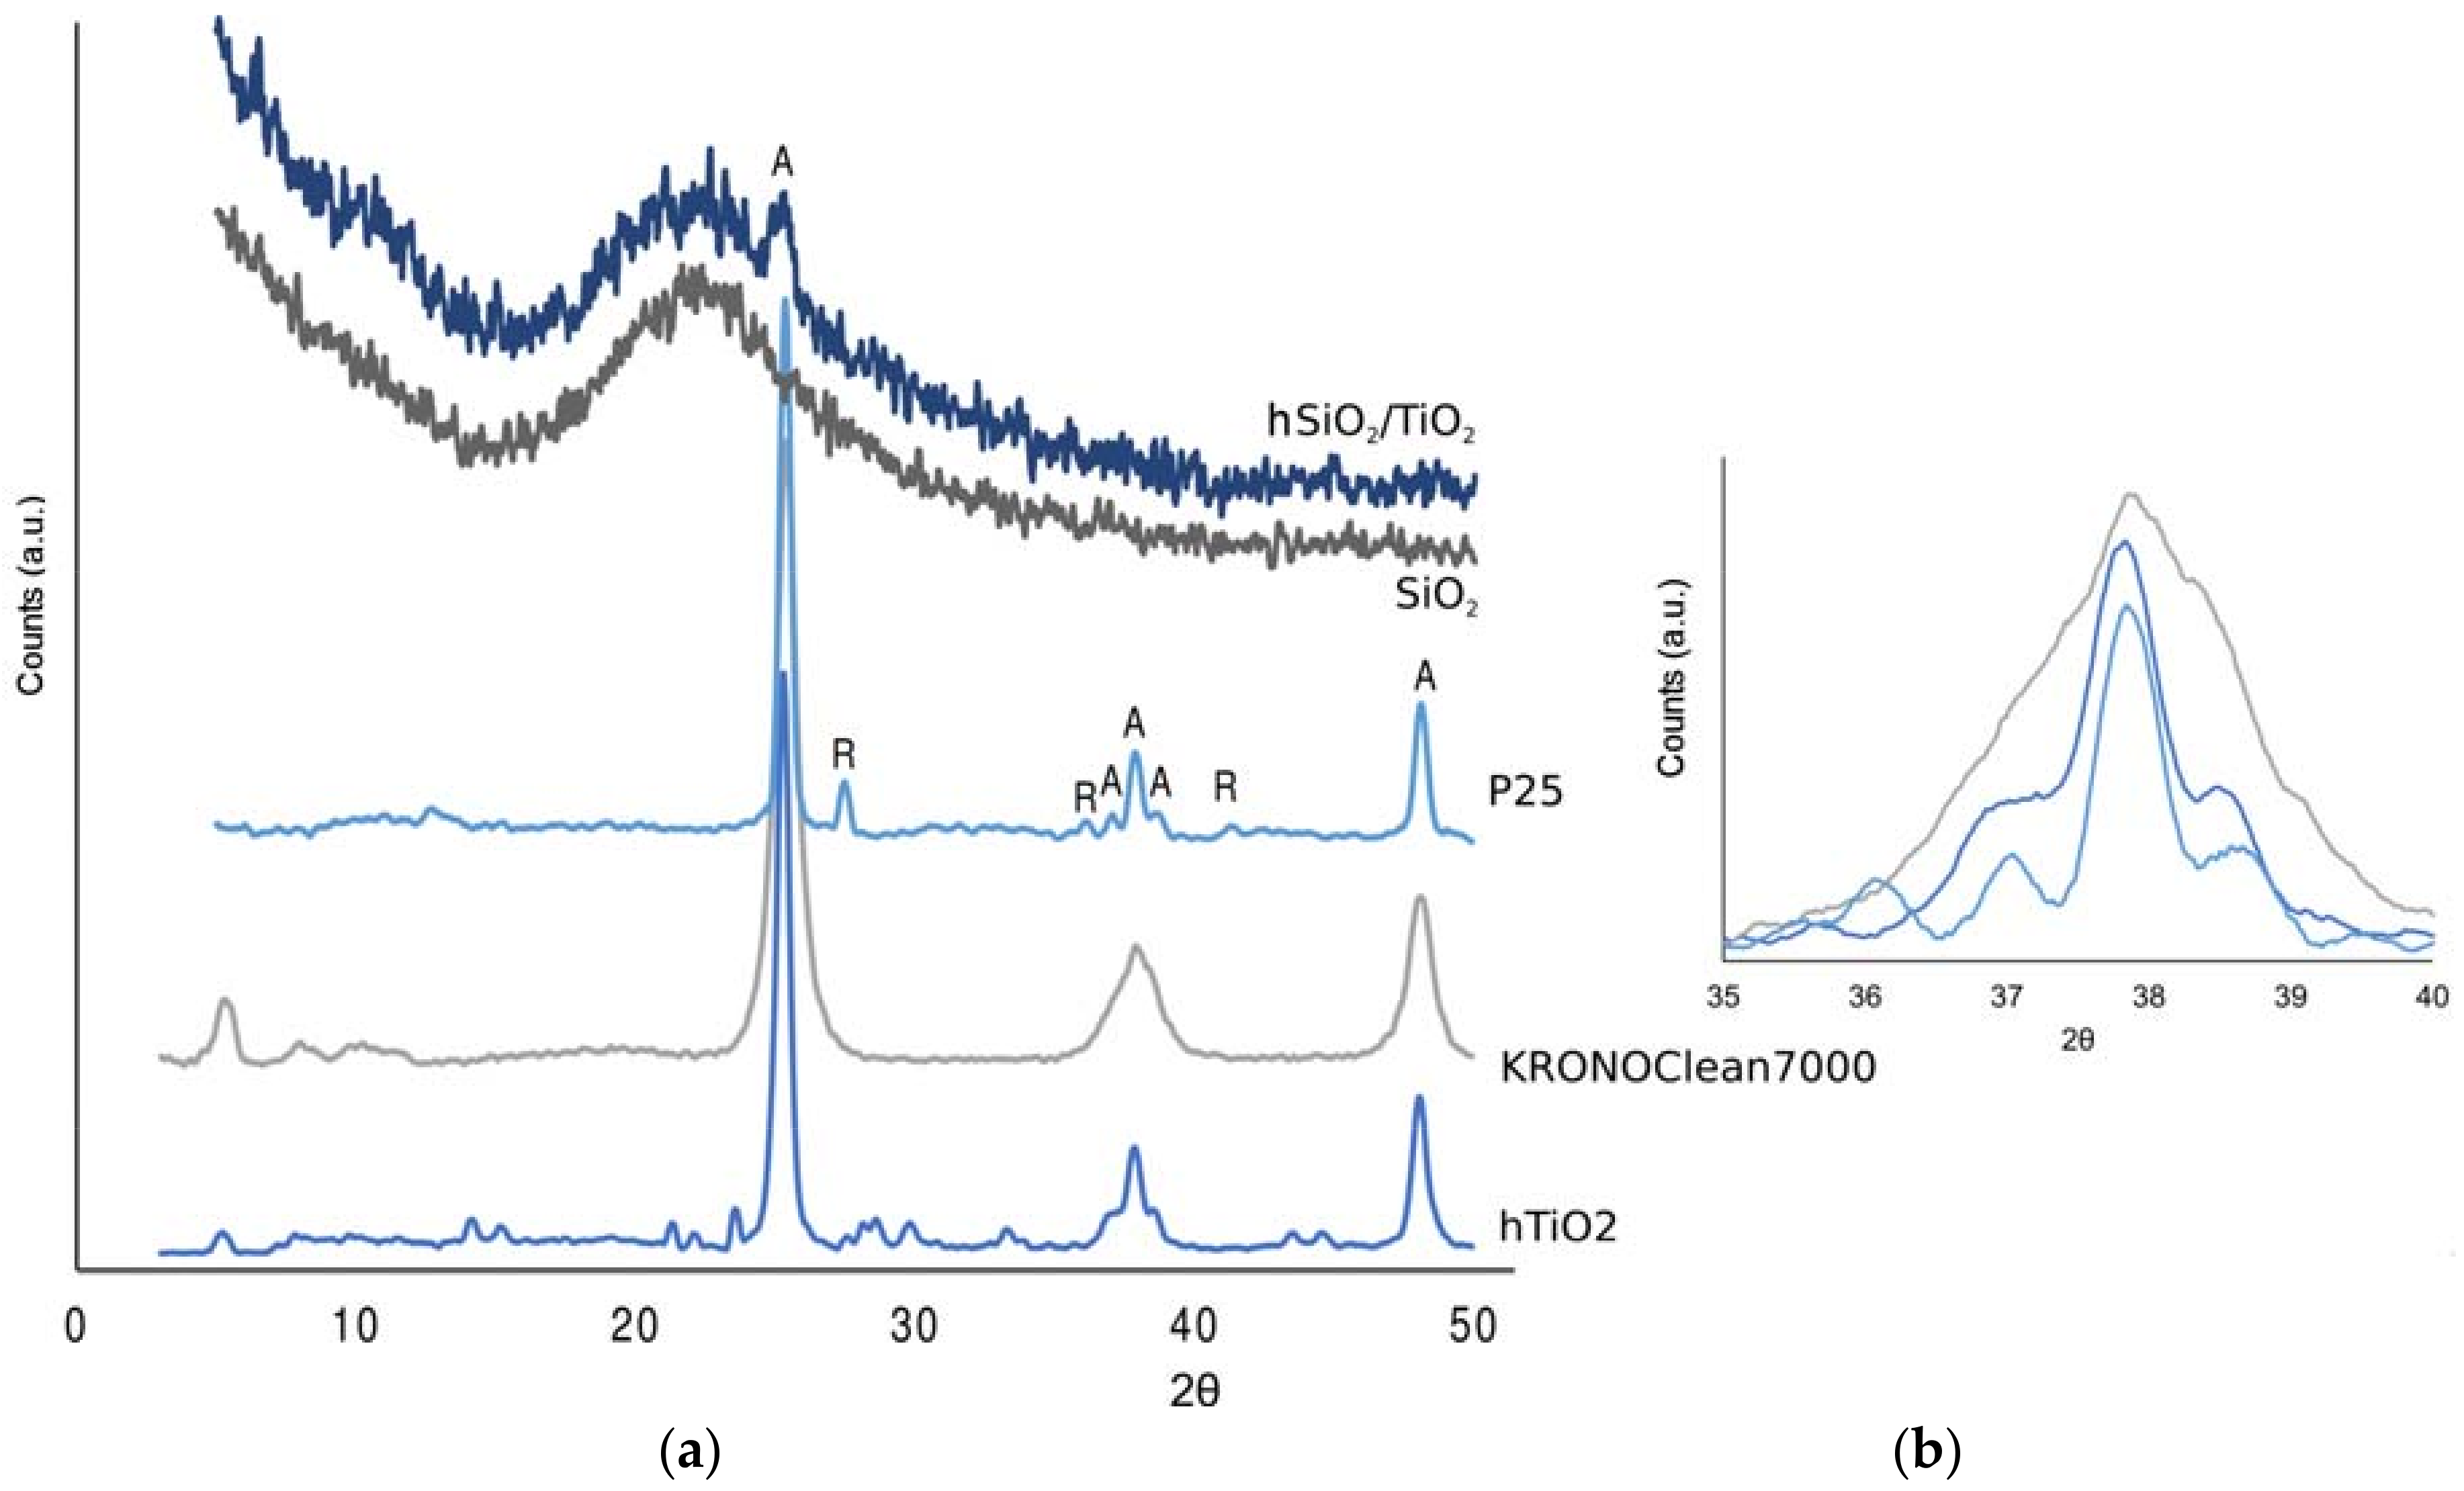
The X-ray diffraction pattern of the different titania samples is shown in Figure 8.
In all sample, TiO2 is present in the anatase form, as indicated by the A-peaks, while only the P25 shows also traces of rutile. In-lab prepared hTiO2 shows some impurities, but no rutile as no peaks are reported at 2θ equal to 35.97 and 41.11.
The possibility of distinguishing the three distinct peaks (2θ = 36.95, 37.79, 38.57) can be related to the crystallinity and the calcination temperature of the material [18]. This is in agreement with the KRONOClean7000 wide peak, which can indicate a lower calcination temperature.
3.2. Nitrogen Oxides Abatement
Nitrogen oxides removal indexes, obtained according to the Italian standard UNI11247, have been determined equals to 36%, 41%, 43%, 46%, respectively for hTiO2, hSiO2/TiO2, P25, KRONOClean7000® samples.
Nitrogen oxides removal indexes, obtained according to the procedure described in Section 2.4, are reported in Table 3. It is found that:
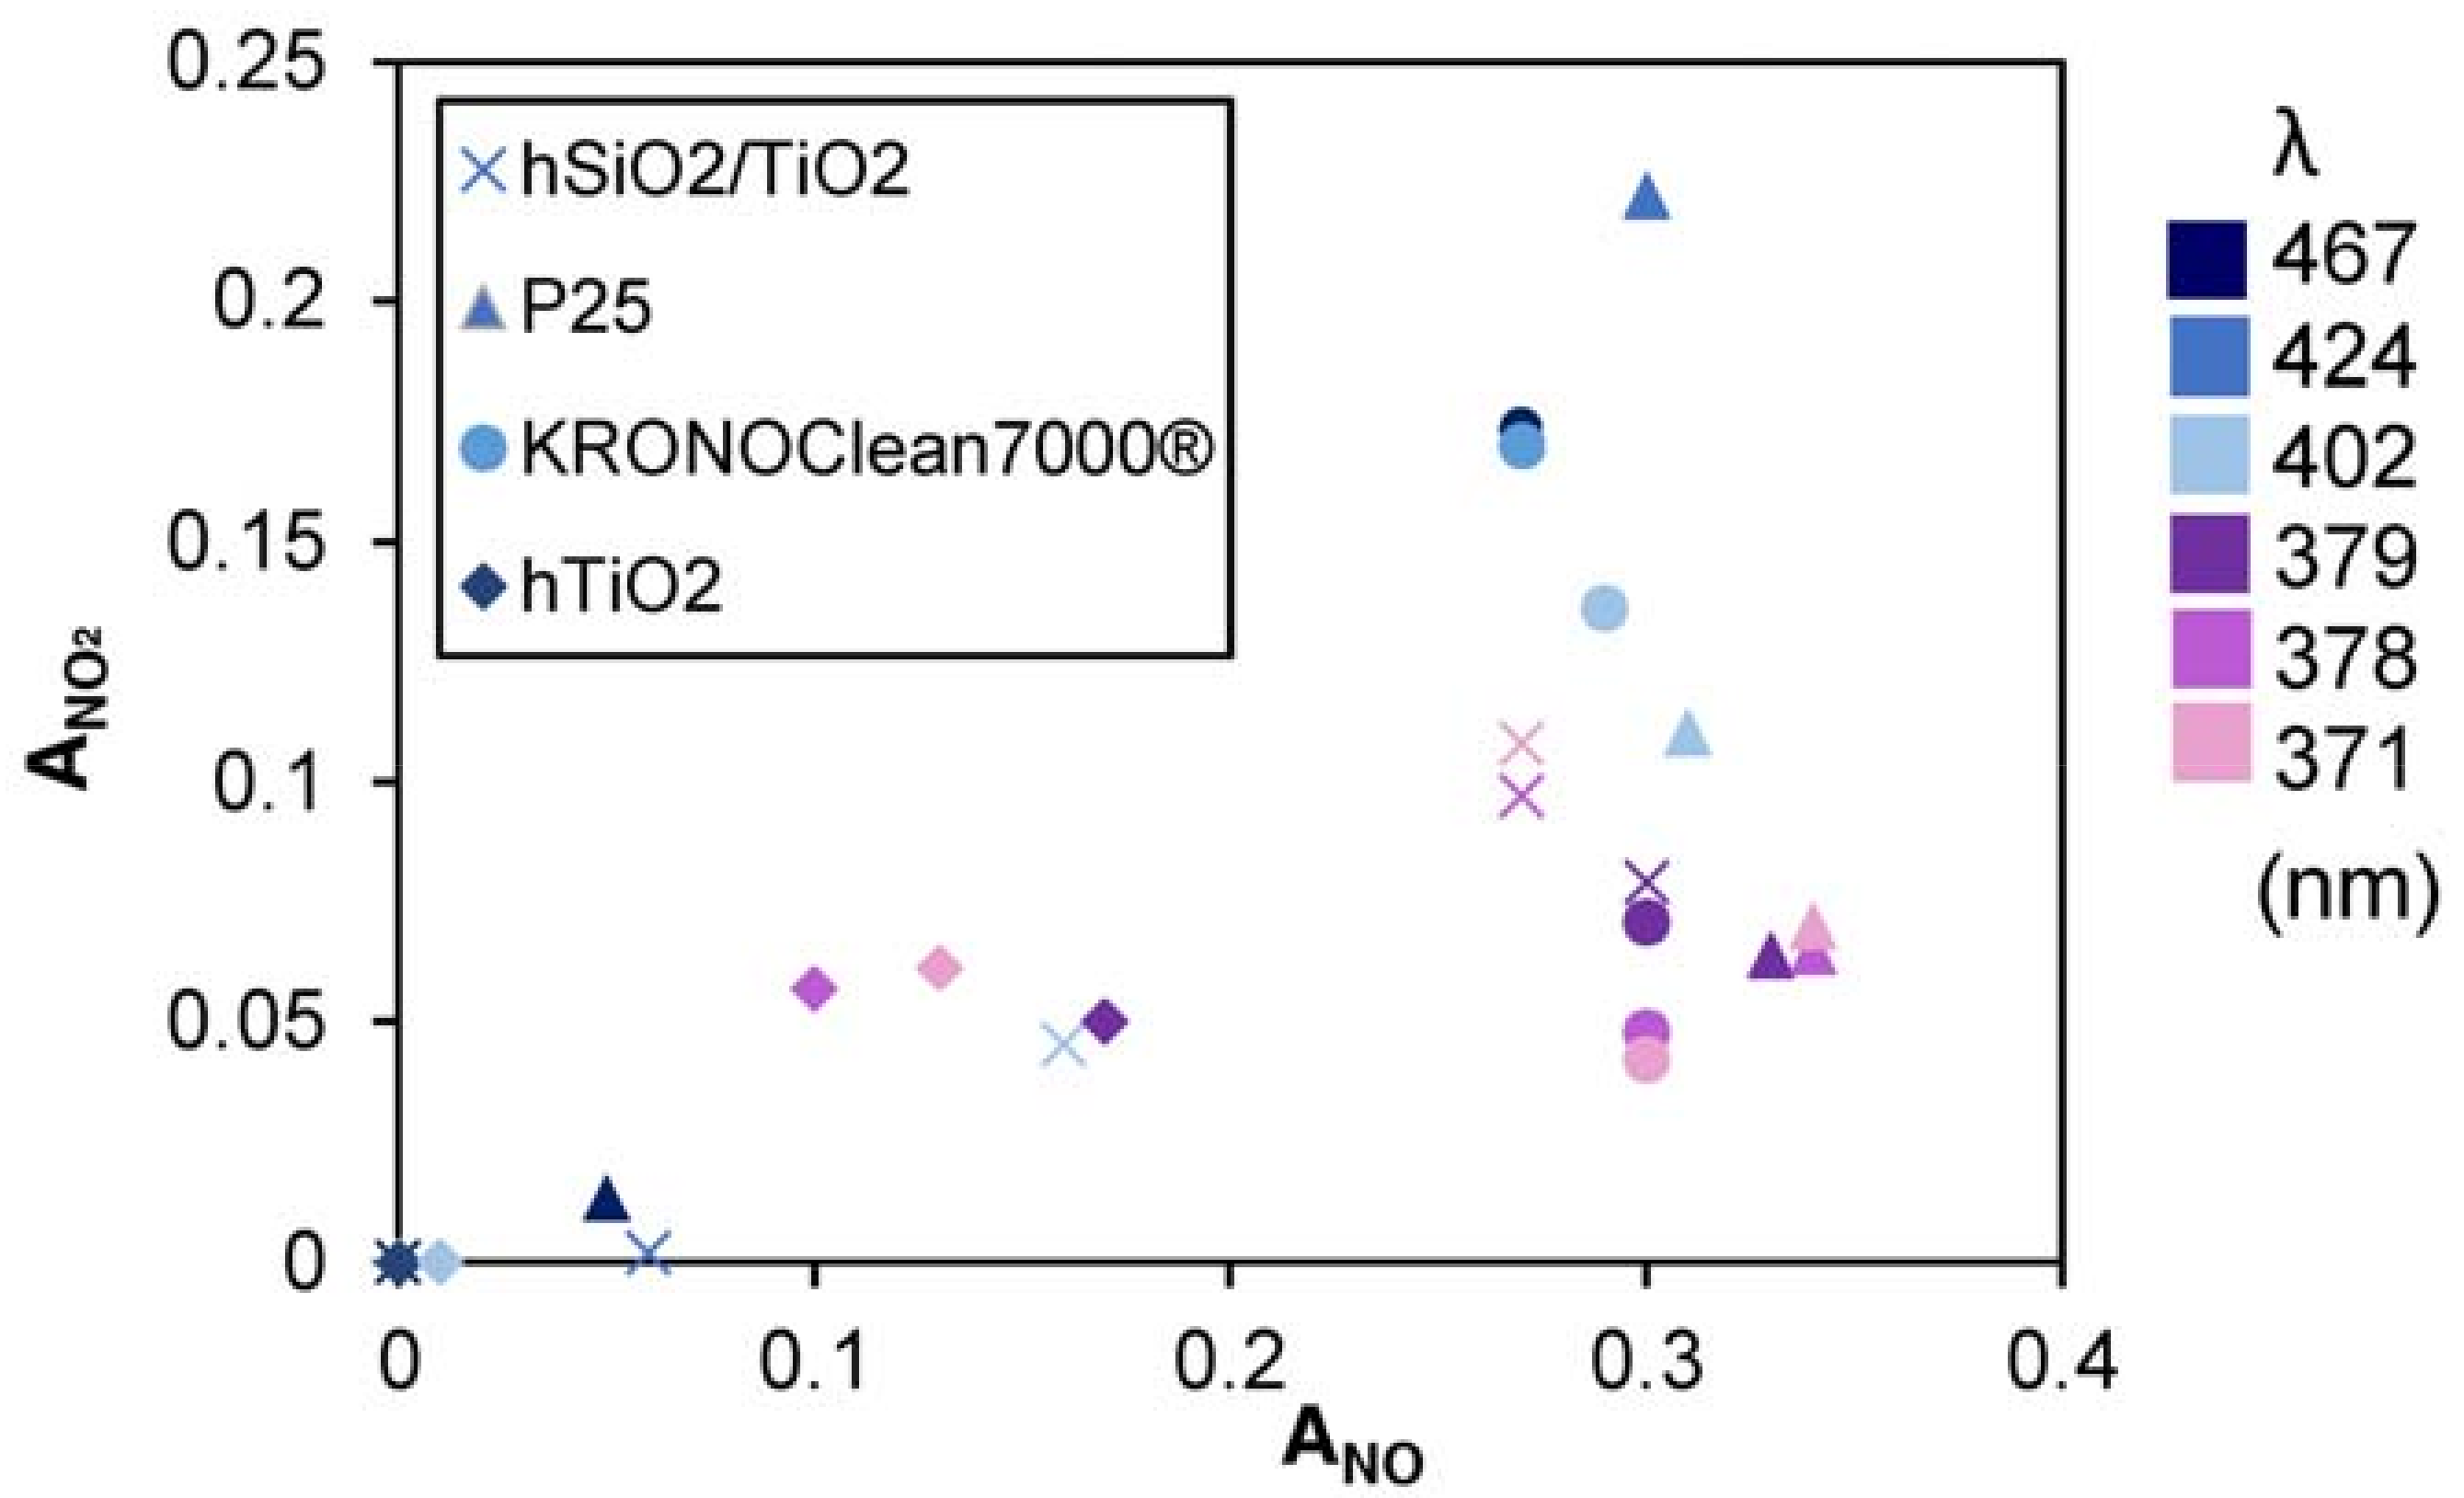
- generally, the amount of NO2 generated is higher at higher wavelengths;
- generally, to a higher NO activity corresponds a higher production of NO2
3.3. Bandgap Estimation
Results of the bandgap estimation, by minimizing the standard error and maximizing the coefficient of determination, are reported in Table 4. Estimated bandgap energies, () fall in the determined activation ranges and they are compatible with the values obtained through UV-vis spectroscopy or reported in the literature ().
4. Discussion
4.1. The Method
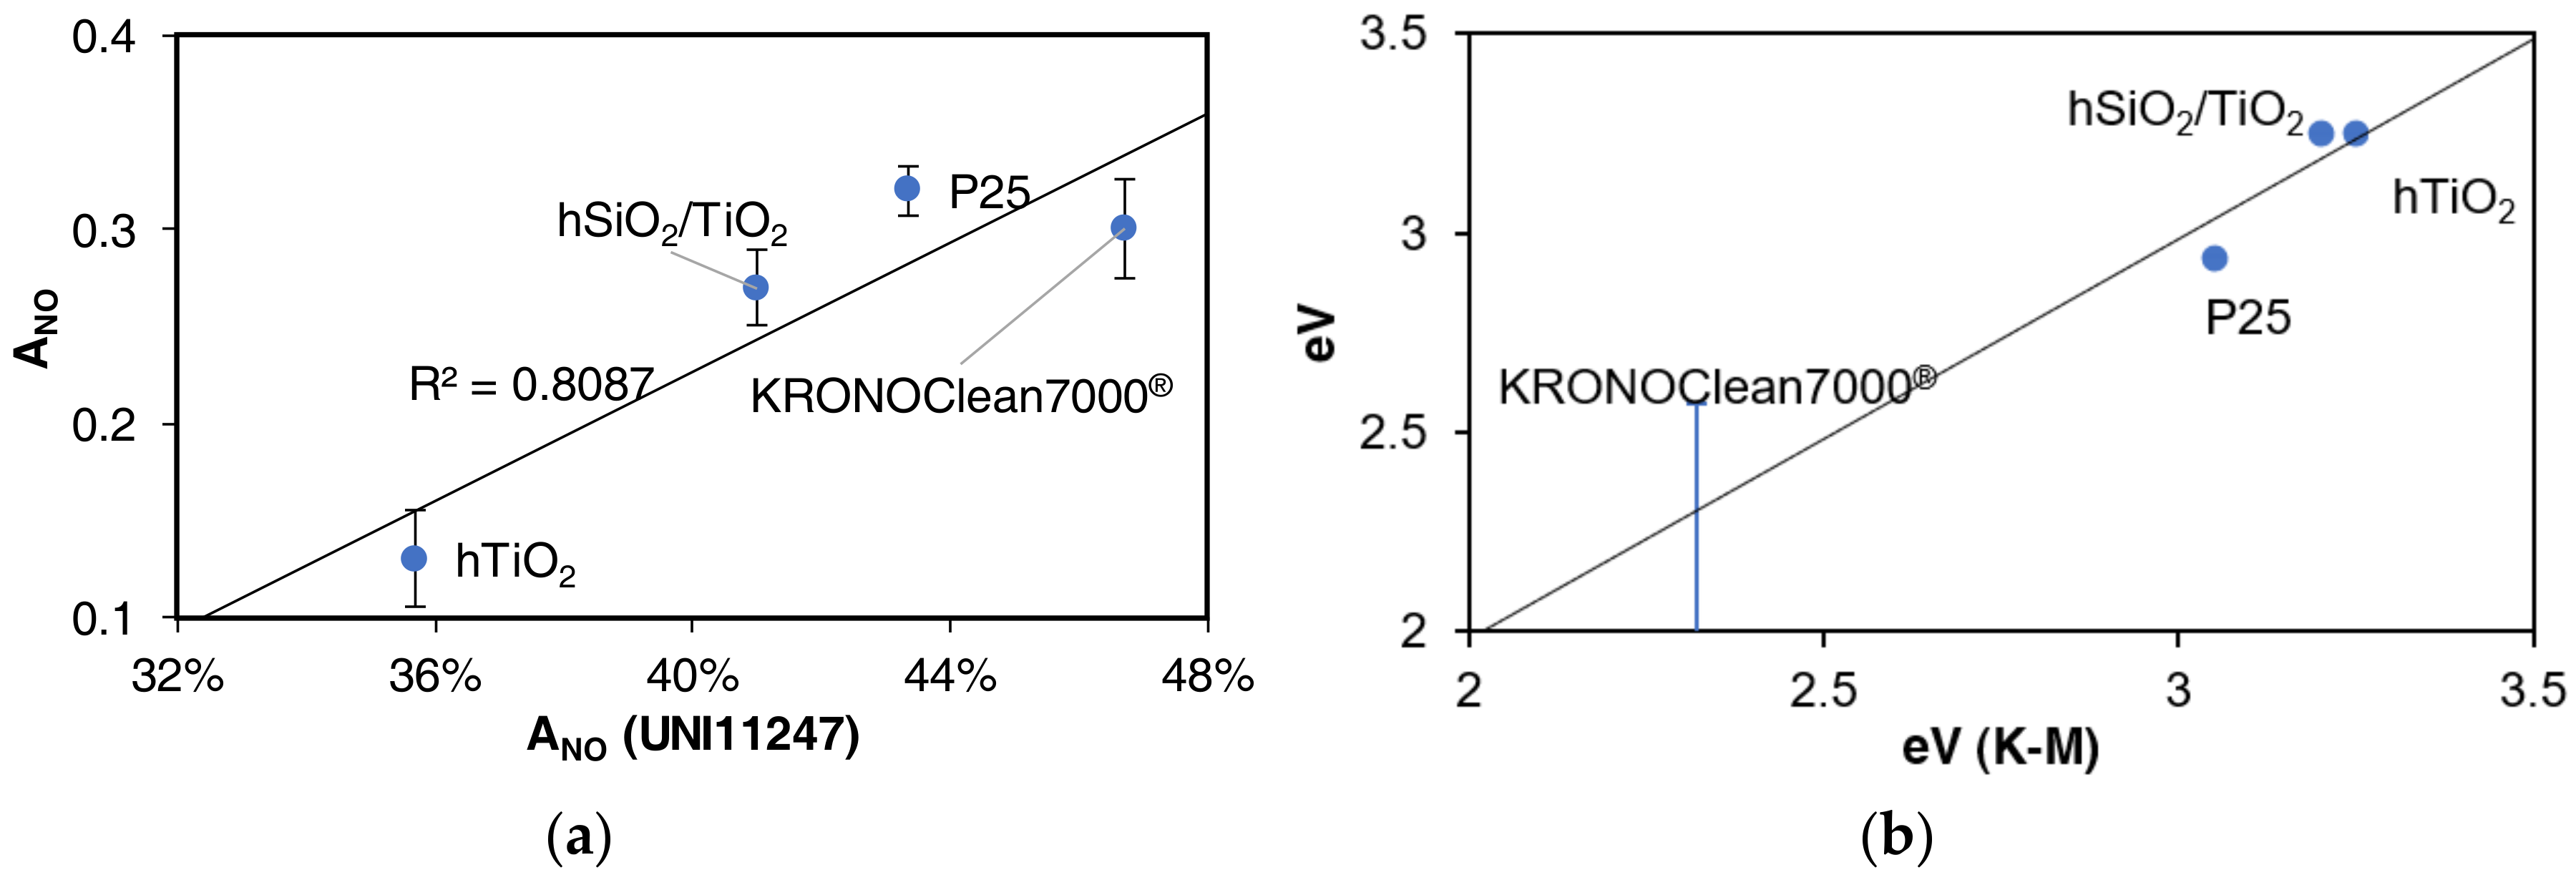
Figure 10 shows the comparison between the proposed method and the NOx standard (a) and to the Kubelka-Munk estimation (b). By increasing the number of LEDs having emission peak close to the correspondent expected photocatalyst bandgap, it is possible to better estimate its value. For instance, as KRONOClean7000® exhibits photocatalytic activity since the first LED is turned on, it is not possible to individuate the end of the activation interval, while the method provides a good estimation for hSiO2/TiO2, hTiO2, P25 with, respectively, 4, 4 and 5 different LED emission spectrum possess enough energy to activate the samples.
The imperfect correspondence between the two procedures, reported in Figure 10a, is due to the fact that two different samples were prepared for the two different tests.
4.2. NO Activity
It is well known that anatase shows a higher photocatalytic activity [19,20] than rutile. At 422 nm (2.94 eV) P25 shows photocatalytic activity, as rutile is reported to activate at 3.0 eV [21,22], and it slightly increases with lowering the wavelength.
The silica/titania composite (hSiO2/TiO2) and the single titania (hTiO2) exhibit similar photocatalytic activity. Despite the amorphous nature of the silica in the composite, XRD diffractogram indicates the presence of anatase, showed by the peak at 2θ = 25.32.
KRONOClean7000 is a C-modified anatase and it was found to be active already at the first LED irradiation, with λ > 467 nm.
4.3. NO2 Selectivity
Selectivity is an important parameter to take into account. In this case, the production of NO2, as an unwanted product, was monitored. Visible-light photocatalysts have been under great observation because of their possible application in indoor conditions; however, their effective beneficial provision must be questioned. Bloh et al. [23] arbitrarily assigned a relative toxicity ratio of 1:3, for NO and NO2. For this reason, systems characterized by high activity, but low selectivity into final products (nitrates) could potentially increase the indoor air toxicity by the formation of NO2. In fact, the application of photocatalytic materials in cement matrices can occur by the combined use of materials with high adsorbent capacity [24].
The commercial KRONOClean7000, despite its low bandgap making it suitable for indoor applications, exhibits a high production of NO2 (17.36%) at high wavelengths. At lower wavelengths (λ < 379 nm) unwanted NO2 selectivity decreases to 4.2%. A similar behavior belongs to the P25, with the only difference that it activates between 424 and 427 nm. This can be due the typical ternary composition of P25, where anatase, rutile, and amorphous TiO2 are present in an average ratio of 78:14:8 [1] and the higher production of NO2, as well the lower mineralization of organic compounds, it is linked to the presence of rutile [1,24]. However, the increased selectivity into NO2 by higher wavelengths was confirmed also by Tseng et al. [25].
For the hSiO2/TiO2 sample, where TiO2 in anatase form is deposited over a silica substrate, NO2 production is lower (11%); similarly for the hTiO2 sample obtained through the same hydrothermal method, but without the silica substrate, which shows a lower production of NO2. However, this aspect is easily explained by the fact that the efficiency is also lower.
5. Conclusions
The bandgap energy and the photocatalytic activity of four TiO2-based material have been jointly estimated by a novel approach based on the effective degradation of NOx, by using a multi-spectrum array of LEDs. The procedure can be easily implemented on an existing testing apparatus, moreover, LEDs are cheap and it is not necessary to shield the light source because of the well-defined emission spectrum.
It is noticed that this multi-UV testing method can provide useful indications either on the activity of the photocatalytic material under different lighting conditions, either on the effectiveness of such material against unwanted by-products.
The suggested method forms a direct assessment of the photocatalytic activity under plausible conditions of irradiance (and pollutant concentration).
Author Contributions
M.P. realized the experimental set-up and run the experiments. O.F. did the XRD analysis and contributed to the correction of the paper. G.F. and M.L.R. took part in the discussion of the results.
Funding
This research received no external funding.
Acknowledgments
We would like to thank: Giorgia Nardini from the DIISM (Department of Industrial Engineering and Mathematical Sciences) for the spectrometric LED emission measurements, Giuseppe Pandarese (DIISM) and Pietro d’Amico for the diffuse reflectance measurements of the samples.
Conflicts of Interest
The authors declare no conflict of interest.
References
- Ohtani, B.; Prieto-Mahaney, O.O.; Li, D.; Abe, R. What is Degussa (Evonik) P25? Crystalline composition analysis, reconstruction from isolated pure particles and photocatalytic activity test. J. Photochem. Photobiol. A Chem. 2010, 216, 179–182. [Google Scholar] [CrossRef] [Green Version]
- Ângelo, J.; Andrade, L.; Madeira, M.L.; Mendes, A. An overview of photocatalysis phenomena applied to NOx abatement. J. Environ. Manag. 2013, 129, 522–539. [Google Scholar] [CrossRef] [PubMed]
- Devahasdin, S.; Fan, C.; Li, K.; Chen, D.H. TiO2 photocatalytic oxidation of nitric oxide: Transient behavior and reaction kinetics. J. Photochem. Photobiol. A Chem. 2003, 156, 161–170. [Google Scholar] [CrossRef]
- Pierpaoli, M.; Giosuè, C.; Ruello, M.L.; Fava, G. Appraisal of a hybrid air cleaning process. Environ. Sci. Pollut. Res. 2017, 24, 12638–12645. [Google Scholar] [CrossRef] [PubMed]
- Jo, K.W.; Tayade, J.R. New generation energy-efficient light source for photocatalysis: LEDs for environmental applications. Ind. Eng. Chem. Res. 2014, 53, 2073–2084. [Google Scholar] [CrossRef]
- Levine, L.H.; Richards, J.T.; Coutts, J.L.; Soler, R.; Maxik, F.; Wheeler, R.M. Feasibility of Ultraviolet-Light-Emitting Diodes as an Alternative Light Source for Photocatalysis. J. Air Waste Manag. Assoc. 2011, 61, 932–940. [Google Scholar] [CrossRef] [PubMed] [Green Version]
- Wang, Z.; Liu, J.; Dai, Y.; Dong, W.; Zhang, S.; Chen, J. CFD modeling of a UV-LED photocatalytic odor abatement process in a continuous reactor. J. Hazard. Mater. 2012, 215–216, 25–31. [Google Scholar] [CrossRef] [PubMed]
- Wang, X.; Lim, T.T. Solvothermal synthesis of C–N codoped TiO2 and photocatalytic evaluation for bisphenol A degradation using a visible-light irradiated LED photoreactor. Appl. Catal. B Environ. 2010, 100, 355–364. [Google Scholar] [CrossRef]
- Korovin, E.; Selishchev, D.; Besov, A.; Kozlov, D. UV-LED TiO2 photocatalytic oxidation of acetone vapor: Effect of high frequency controlled periodic illumination. Appl. Catal. B Environ. 2015, 163, 143–149. [Google Scholar] [CrossRef]
- Rojviroon, T.; Laobuthee, A.; Sirivithayapakorn, S. Photocatalytic activity of toluene under UV-LED light with TiO2 thin films. Int. J. Photoenergy 2012, 2012, 898464. [Google Scholar] [CrossRef]
- Yu, L.; Achari, G.; Langford, C.H. LED-based photocatalytic treatment of pesticides and chlorophenols. J. Environ. Eng. 2013, 139, 1146–1151. [Google Scholar] [CrossRef]
- Natarajan, T.S.; Natarajan, K.; Bajaj, H.C.; Tayade, R.J. Energy efficient UV-LED source and TiO2 nanotube array-based reactor for photocatalytic application. Ind. Eng. Chem. Res. 2011, 50, 7753–7762. [Google Scholar] [CrossRef]
- Moreira, N.F.F.; Sousa, J.M.; Macedo, G.; Ribeiro, A.R.; Barreiros, L.; Pedrosa, M.; Faria, J.L.; Pereira, M.F.R.; Castro-Silva, S.; Segundo, M.A.; et al. Photocatalytic ozonation of urban wastewater and surface water using immobilized TiO2 with LEDs: Micropollutants, antibiotic resistance genes and estrogenic activity. Water Res. 2016, 94, 10–22. [Google Scholar] [CrossRef] [PubMed]
- Natarajan, T.S.; Thomas, M.; Natarajan, K.; Bajaj, H.C.; Tayade, R.J. Study on UV-LED/TiO2 process for degradation of Rhodamine B dye. Chem. Eng. J. 2011, 169, 126–134. [Google Scholar] [CrossRef]
- Aponiene, K.; Luksiene, Z. Effective combination of LED-based visible light, photosensitizer and photocatalyst to combat Gram(−) bacteria. J. Photochem. Photobiol. B Biol. 2015, 142, 257–263. [Google Scholar] [CrossRef] [PubMed]
- Bengtsson, N.; Castellote, M. Photocatalytic Activity for NO Degradation by Construction Materials: Parametric Study and Multivariable. J. Adv. Oxid. Technol. 2010, 13, 342–349. [Google Scholar]
- Herrmann, J.M. Fundamentals and misconceptions in photocatalysis. J. Photochem. Photobiol. A Chem. 2010, 216, 85–93. [Google Scholar] [CrossRef]
- Chen, Y.; Lee, C.; Yeng, M.; Chiu, H. The effect of calcination temperature on the crystallinity of TiO2 nanopowders. J. Cryst. Growth 2003, 247, 363–370. [Google Scholar] [CrossRef]
- Blöß, S.P. Visible Light Photo-catalysts Based on Titanium Dioxide and their Potential Applications: An Introduction. Tenside Surfactants Deterg. 2007, 44, 266–269. [Google Scholar] [CrossRef]
- Hurum, D.C.; Agrios, A.G.; Gray, K.A.; Rajh, T.; Thurnauer, M.C. Explaining the enhanced photocatalytic activity of Degussa P25 mixed-phase TiO2 using EPR. J. Phys. Chem. B 2003, 107, 4545–4549. [Google Scholar] [CrossRef]
- Tanaka, K.; Capule, M.F.V.; Hisanaga, T. Effect of crystallinity of TiO2 on its photocatalytic action. Chem. Phys. Lett. 1991, 187, 73–76. [Google Scholar] [CrossRef]
- Tang, H.; Sanjines, R.; Schmid, P.E.; Prasad, F.L. Electrical and optical properties of TiO2 anatase thin films. J. Appl. Phys. 1994, 75, 2042. [Google Scholar] [CrossRef]
- Bloh, J.Z.; Macphee, A.; Folli, D.E. Photocatalytic NOx abatement: Why the selectivity matters. RSC Adv. 2014, 4, 45726–45734. [Google Scholar] [CrossRef]
- Giosuè, C.; Pierpaoli, M.; Mobili, A.; Ruello, M.L.; Tittarelli, F. Influence of Binders and Lightweight Aggregates on the Properties of Cementitious Mortars: From Traditional Requirements to Indoor Air Quality Improvement. Materials 2017, 10, 978. [Google Scholar] [CrossRef] [PubMed]
- Tseng, Y.; Kuo, C.; Huang, C.; Li, Y.; Chou, P.; Cheng, C.; Womg, M. Visible-light-responsive nano-TiO2 with mixed crystal lattice and its photocatalytic activity. Nanotechnology 2006, 17, 2490–2497. [Google Scholar] [CrossRef] [PubMed]
Figure 1.
Simplified nitrogen oxides (NOx) reaction mechanism.
Figure 2.
Apparatus schematic. Abbreviation: LED, light-emitting diode.

Figure 3.
LEDs emission spectra.
Figure 4.
NO and NO2 concentrations during test condition under different LED illumination.
Figure 5.
Cumulative distribution function adopted for the representation of used LEDs.
Figure 6.
Determination of the best correlation between E(e,λ) and ANO by computing the coefficient of determination (black solid line), and minimizing the standard error (gray solid line). Minimums and maximums are highlighted by the first derivative (dotted lines).
Figure 6.
Determination of the best correlation between E(e,λ) and ANO by computing the coefficient of determination (black solid line), and minimizing the standard error (gray solid line). Minimums and maximums are highlighted by the first derivative (dotted lines).
Figure 7.
Correlation between ANO and E.
Figure 8.
(a) X-ray diffraction (XRD) patterns of (from bottom to top) hTiO2, KRONOClean7000, P25, SiO2, hSiO2/TiO2. (b) XRD for the three distinct peaks characteristic of anatase.
Figure 8.
(a) X-ray diffraction (XRD) patterns of (from bottom to top) hTiO2, KRONOClean7000, P25, SiO2, hSiO2/TiO2. (b) XRD for the three distinct peaks characteristic of anatase.
Figure 9.
Activity indexes grouped by sample and UV light.
Figure 10.
(a) Activity indexes grouped by sample and UV light, (b) relation between the band gap estimated by diffuse UV-visible spectroscopy and the proposed method.
Figure 10.
(a) Activity indexes grouped by sample and UV light, (b) relation between the band gap estimated by diffuse UV-visible spectroscopy and the proposed method.

Table 1.
Reference standards for the determination of the photocatalytic activity, grouped by target compound.
Table 1.
Reference standards for the determination of the photocatalytic activity, grouped by target compound.
| Target Pollutant | Type of Irradiation | |
|---|---|---|
| UV | Visible | |
| NOx | UNI 11247 | DIS 17168-1 |
| ISO 22197-1 | ||
| DIN CEN/TS 16980-1 | ||
| JIS R 1701-1 | ||
| Acetaldehyde | ISO 22197-2 | DIS 17168-2 |
| JIS R 1701-2 | CD 19652 | |
| Toluene | ISO 22197-3 | DIS 17168-3 |
| JIS R 1701-3 | ||
| Formaldehyde | ISO 22197-4 | DIS 17168-4 |
| JIS R 1701-4 | ISO 18560-1 | |
| Methyl mercaptan | ISO 22197-5 | DIS 17168-5 |
| JIS R 1701-5 | ||
Abbreviation: UV, ultraviolet.
Table 2.
Light-emitting diodes (LEDs) characteristics.
| µ, Spectrum Peak (nm) | σ2, Variance (nm2) | (W m−2 nm−1) | R2 | ||
|---|---|---|---|---|---|
| Declared * | Effective | ||||
| LED 1 | blue | 467.5 | 15.2 | 1.11 | 0.9860 |
| LED 2 | 420–430 | 424.4 | 10.5 | 1.10 | 0.9845 |
| LED 3 | 400–410 | 402.4 | 10.8 | 0.46 | 0.9927 |
| LED 4 | 385–390 | 378.9 | 7.2 | 0.74 | 0.9848 |
| LED 5 | 375–380 | 377.8 | 6.9 | 0.43 | 0.9782 |
| LED 6 | 365–370 | 370.6 | 7.0 | 0.40 | 0.9726 |
* Declared by the producer.
Table 3.
Calculated photocatalytic NOx abatement indexes.
| LED | hSiO2/TiO2 | P25 | KRONOClean7000 | hTiO2 | |||||
|---|---|---|---|---|---|---|---|---|---|
| Name | Peak (nm) | ANO | ANO | ANO | ANO2 | ANO | ANO2 | ANO | ANO2 |
| LED 1 | 467 | 0.00 | 0.00 | 0.05 | 0.01 | 0.27 | 0.17 | 0.00 | 0.00 |
| LED 2 | 424 | 0.06 | 0.00 | 0.30 | 0.22 | 0.27 | 0.17 | 0.00 | 0.00 |
| LED 3 | 402 | 0.16 | 0.05 | 0.31 | 0.11 | 0.29 | 0.14 | 0.01 | 0.00 |
| LED 4 | 379 | 0.30 | 0.08 | 0.33 | 0.06 | 0.30 | 0.07 | 0.17 | 0.05 |
| LED 5 | 378 | 0.27 | 0.10 | 0.34 | 0.06 | 0.30 | 0.05 | 0.10 | 0.06 |
| LED 6 | 371 | 0.27 | 0.11 | 0.34 | 0.07 | 0.30 | 0.04 | 0.13 | 0.06 |
© 2018 by the authors. Licensee MDPI, Basel, Switzerland. This article is an open access article distributed under the terms and conditions of the Creative Commons Attribution (CC BY) license (http://creativecommons.org/licenses/by/4.0/).
Share and Cite
MDPI and ACS Style
Pierpaoli, M.; Favoni, O.; Fava, G.; Ruello, M.L. A Novel Method for the Combined Photocatalytic Activity Determination and Bandgap Estimation. Methods Protoc. 2018, 1, 22. https://doi.org/10.3390/mps1020022
AMA Style
Pierpaoli M, Favoni O, Fava G, Ruello ML. A Novel Method for the Combined Photocatalytic Activity Determination and Bandgap Estimation. Methods and Protocols. 2018; 1(2):22. https://doi.org/10.3390/mps1020022
Chicago/Turabian StylePierpaoli, Mattia, Orlando Favoni, Gabriele Fava, and Maria Letizia Ruello. 2018. "A Novel Method for the Combined Photocatalytic Activity Determination and Bandgap Estimation" Methods and Protocols 1, no. 2: 22. https://doi.org/10.3390/mps1020022