Preventing Tire Blowout Accidents: A Perspective on Factors Affecting Drivers’ Intention to Adopt Tire Pressure Monitoring System

1
Department of Industrial Engineering and Management, National Taipei University of Technology, Taipei 10608, Taiwan
2
College of Management, National Taipei University of Technology, Taipei 10608, Taiwan
*
Author to whom correspondence should be addressed.
Safety 2018, 4(2), 16; https://doi.org/10.3390/safety4020016
Submission received: 8 February 2018
/
Revised: 31 March 2018
/
Accepted: 5 April 2018
/
Published: 9 April 2018
Abstract
:The aim of this study is to explore whether risk perception or anticipated regret is responsible for intensifying the participants’ intention to adopt a tire pressure monitoring system (TPMS) to prevent a tire-related accident, and whether the optimism bias has a moderator effect between risk perception/anticipated regret and intention. With 274 valid questionnaires and PLS-SEM (partial least squares structural equation modeling) analysis, the results indicate a significant positive relationship between risk perception and intention to adopt TPMS, but not between anticipated regret and intention. The moderator effect of optimism bias on risk perception and anticipated regret is not found in the model. The findings will prove useful for public service advertising campaigns by providing a basis for an understanding of the role of cognitive and emotional factors in tire-blowout accident prevention, thereby increasing the motivation for drivers in Taiwan to take advantage of the protection afforded them by using TPMS.
1. Introduction
Tire pressure must be checked regularly before driving to ensure that tires are properly inflated. Drivers typically do not check the tire pressure unless they notice unusual vehicle tire performance. According to the roadside survey PMDT (potential mechanical defect tests) in South Africa, 40% of vehicles on suburban roads and 29% of vehicles on highways had mechanical defects which could potentially result in an accident [1]. Velupillai and Guvenc [2] argued that approximately three-fourths of all automobiles operate with at least one underinflated tire, and visual checks are often insufficient to determine if the tires are underinflated. A survey, RRCGB (Reported Road Casualties Great Britain), found that around 2% of fatal road accidents and casualties over the five-year period from 2008 to 2012 had tire defects recorded as a contributory factor, as did around 1% of serious and slight injury reported accidents and casualties [3]. Similarly, Table 1 shows that over the 10-year period from 2007 to 2016, 809 people were killed in accidents on super highways, and the condition of the vehicle tires had been the contributory factor to cause 9.52% (77) of people dead in accidents in Taiwan (Ministry Of Transportation and Communication (MOTC), Taiwan, 2017).
Tires running in flat can damage the tires and lead to an unexpected blowout. Ockert, Johannes, and Grobbelaar [1] noted that a substantial number of road accidents are associated with mechanical tire imperfections. Statistics provided by Michelin Tire show that tire blowouts result in 23,000 collisions and 535 fatalities each year [4]. Ratrout [5] pointed out that statistics on road security personnel indicate that 13% of the accidents they attended were caused by tire blowouts or tread separation. Obviously, a significant number of vehicles operate with tire pressures below the manufacturer’s specifications. Properly inflated tires will ensure the shortest braking distance, a reduction in blowouts, the mitigation of hydroplaning for better road handling, and an increase in tire life [6].
The purpose of a tire pressure monitoring system (TPMS), as an aspect of in-vehicle technology (IVT), is to help drivers maintain the correct tire pressure for their vehicles and thereby reduce the risk of tire-related accidents. TPMS also alerts drivers to pressure loss, tires running at low pressure, tire failure, inflating tire, and location of wheels [6,7,8,9]. Many countries are planning to take similar action requiring vehicles to have a TPMS sensor installed on every wheel [10]. Taiwan has taken action with a mandatory TPMS requirement, which came into effect on 1 November 2014. Although all new passenger vehicles now have TPMS installed by the manufacturer, there are still about 6.5 million older vehicles in Taiwan without TPMS which run the risk of tire-related accidents (Ministry Of Transportation and Communication (MOTC), Taiwan, 2015).
Most previous research on road safety has focused on risky driving behavior [11,12,13,14,15,16,17,18,19,20,21,22,23,24], with some researches being carried out on risk perception [16,19,25,26,27,28,29,30,31,32,33] and IVTs [34,35,36,37,38,39,40,41,42,43,44,45]. Although IVTs have been discussed in areas such as seat-belt use [46,47,48,49,50,51,52], backing aid systems, and rear-view video cameras [53] and event-triggered videos [54], to the best of our knowledge, a comprehensive investigation of the intention to use TPMS is lacking. According to previous models conducted by Li et al. [55], the research model in this study was based on risk perception, anticipated regret, and optimism bias. The purpose of this study is to explore the correlations between risk perception, anticipated regret, and intention, and to determine which of these factors is most likely responsible for the intention to use TPMS. The discussion includes the topic of whether the optimism bias has a moderator effect between risk perception/anticipated regret and intention.
2. Method and Theory Description
2.1. Risk Perception
Risk perception concerns how people perceive and understand risks [56], and it can influence consumer behavior [57]. Sjöberg et al. [58] pointed out risk perception as the subjective assessment of the probable occurrence of a specific type of accident and our degree of concern as to the consequences. Many studies have shown that the tendency to take a certain risk is decreased when people have information regarding a specific high-risk situation. Nordgren et al. [59] stated that the subject of how people make judgments about risks has been of longstanding interest, in terms of how risk perception influences our decisions and behaviors, particularly as the perception of risk is often at odds with the actual risk a behavior entails. While risk perception is theoretically based on two basic judgments, the probability that a negative outcome will occur and the severity of its consequences [60], there are other factors which can have a significant impact on people’s risk perception. One such factor concerns the risk characteristics which refer to features of the risk [61]. Previous studies have suggested that young drivers are more likely to underestimate the probability of the specific risks in certain traffic situations [26]. Milech et al. [62] argued that young drivers tend to perceive the hazards in traffic less holistically and so overestimate their own driving skills [63]. Rundmo and Iversen [30] pointed out that the great majority of studies on young drivers’ risk perception have concluded that the misperception of hazards, as well as the optimism bias related to one’s own driving skills, are core causal factors in traffic accidents, and that this limitation in perception and the processing of information can result in misjudgments and bad perceptions. The results of traffic safety research have also shown that a driver’s behavior is mainly determined by how information is perceived and processed, i.e., the perception of risk is a cognitive or belief-based judgment. Risk perception is often related to certain preventive actions. Stasson and Fishbein [64] argued that the hypothesis that perceived risk is related to seatbelt use has little support. Fhaner and Hane [65] found correlations ranging from −0.02 to 1.3 between a composite perceived risk score and seatbelt usage. However, the present study has posited that the intention to use TPMS is a preventive action which, by detecting the tire pressure, protects a driver against tire blowouts and decreases the incidence of accidents. According to previous studies conducted by Becker [66] and Rogers [67], reasoning that people are inclined to take preventive action if they believe that inaction significantly increases their risk. Thus, we have suggested that the higher the perceived probability that a negative tire-related accident will occur and the higher the perceived severity of the consequences, the more positive the influence on the intention to use TPMS. Therefore, we hypothesize that:
Hypothesis 1 (H1). Risk perception positively influences the intention to use TPMS.
2.2. Anticipated Regret
While the vast majority of studies have focused on the cognitive factors that influence decision making, a growing body of research has emphasized the importance of emotions [55]. Previous studies on the relationship between emotions and decision making have focused on anticipated emotions [68,69,70,71], such as disappointment or regret, which might arise from counterfactual comparisons; while typically not experienced in the immediate present, they are expected to be experienced in the future [72]. Regret is an unpleasant emotion that is said to be experienced when: (1) an obtained outcome compares negatively to a possible other outcome; and (2) there is a sense of personal responsibility over the obtained negative outcome [73]. Loomes and Sugden [69] pointed out that an important feature of regret is that it can be anticipated and taken into account when making decisions. An action-based theory called “regret theory”, a model of decision making with anticipatory aspects of regret, formulated by Bell [68] and Loomes and Sugden [69], suggested that the utility of a chosen option additionally depends on the feelings evoked by the outcomes of the rejected options. Consequently, people compare the actual outcome with what the outcome could have been if a different choice had been made, and experience emotion as a consequence. These emotional consequences of decision making are future anticipated and taken into account when making decisions in situations of uncertainty [55].
Several studies on road safety have shown that anticipated regret influenced participants towards the safer, risk-aversion choice [74,75,76]. Anticipated regret may predict the intention to perform a behavior, whether by action or inaction [77,78,79,80,81]. Sheeran and Orbell [80] have found that anticipated regret increased the consistency between participants’ intentions and their behavior, as failure to act was associated with adverse effects. Therefore, anticipated regret might not only intensify intention, but it could also increase the likelihood of intentions being acted on. Conner, Sandberg, McMillan, and Higgins [81] conducted their research on how far anticipated regret influenced the intention to quit smoking and found significant positive correlations. Thus, we hypothesize that:
Hypothesis 2 (H2). Anticipated regret positively influences the intention to use TPMS.
2.3. Optimism Bias
The concept of optimism bias is that people perceive their likelihood of experiencing negative events to be less when compared with an average individual or a group which is similar to them [82]. This concept has been obtained for a wide variety of health risks [83]. In a study of AIDS-related risks, Van der Pligt et al. [84] found that for groups aware of their relative risk status, high-risk groups gave higher ratings of their own risk than low-risk groups, and all groups showed an optimism bias and thought their risks were lower than those of an average person of their age and gender. Harre et al. [85] found that a higher perception of driving skill was associated with a lower perception of accident risk. Harre and Sibley [86] noted that a number of studies have found that drivers tend to consider themselves superior to their peers in areas such as driving skill, reflexes, judgment, and safety. Optimism bias can lead to overconfidence [27], and lead drivers who believe that they are safer than the average driver tend to think injury prevention campaigns do not apply to them [87]. Martha and Delhomme [88] pointed out that most of the participants expressed comparative optimism regarding speeding-ticket risk and speeding-induced crash risks. Consequently, we suggest that people who tend to consider themselves superior to others in driving skills, reflexes, judgment, and safety will have a lower degree of risk perception, which will in turn affect their intention to use TPMS. Thus, we hypothesize that:
Hypothesis 3 (H3). Optimism bias moderates the relationship between risk perception and the intention to use TPMS.
As noted earlier, optimism bias allows people to perceive the likelihood of their experiencing negative events to be less when compared with an average individual or a group similar to them. This can lead to positive feelings and emotions, such as rejoicing, elation, and pride, rather than negative emotions, such as regret, disappointment, and self-recrimination. In keeping with the context of our study, we argue that individuals with a high optimism bias have intense positive emotions as regards tire-related accidents, because they perceive their risks to be lower than that of the average person. On the other hand, people with a low optimism bias will have negative emotions as regards tire-related accidents. Thus, optimism bias could affect the relationship between anticipated regret and the intention to use TPMS. We hypothesize that:
Hypothesis 4 (H4). Optimism bias moderates the relationship between anticipated regret and the intention to use TPMS.
2.4. Method
According to relevant research questionnaires and scales used by other scholars, a questionnaire was designed using a 7-point Likert-scale, ranging from 1 (strongly disagree) to 7 (strongly agree), to measure participants’ risk perception, anticipated regret, personal optimism bias, and intention to use TPMS. The risk perception scale was adapted and modified from Rundmo and Iversen [30]; the anticipated regret scale was adapted and modified from Abraham and Sheeran [76] and Li, Zhou, Sun, Rao, Zheng, and Liang [55]; the personal optimism bias scale was adapted and modified from Coogan et al. [89]; and the intention scale was adapted from Lee [90].
The participants in this study were individuals over 18 years old. They were randomly selected from the Greater Taipei Area and asked to fill in a questionnaire online. A total of 302 questionnaires were completed. After 28 invalid samples were eliminated, 274 valid samples remained. Of the 274 participants, 165 (60.2%) were male and 109 (39.8) were female. Most of the participants were between the age of 31 and 60 (85.4%), 181 (66.1%) had college degrees, 108 (39.4%) had held a driver’s license for 11–20 years and drove a car 6–10 years old. Table 2 shows the distribution of the basic information of the valid samples.
The investigation into the moderator effects of optimism bias between risk perception/anticipated regret and the intention to use TPMS involved two steps. First, it was necessary to establish moderators within the data by using principal component analysis (PCA), in order to find the components that maximized the variance in the dataset and tease out the factors. The analysis was conducted using a personal optimism bias scale [89], SPSS, to calculate factor 1 and factor 2. To comply with the research context, we defined factor 1—items OB1, OB2, and OB6—as general optimism, and factor 2—items OB3, OB4 and OB5—as drive skill optimism to be the interaction terms (shown in Table 5) in this study.
Second, to understand the correlation between the different degrees of personal optimism bias, categories were established within the data; a hierarchical cluster analysis using Ward’s method and Squared Euclidean Distance was performed on the data to tease out clusters of optimism bias.
3. Results
3.1. Model Analysis
The measurement model of this study was evaluated by the SmartPLS used in partial least squares structural equation modeling (PLS-SEM) for model validation. The main advantage of PLS is that it does not need to consider the multivariate normal distribution of the sample data or total sample [91]. The measurement evaluation is conducted by the least squares method. PLS is a technique using latent structural equation modeling to estimate the structural model and measurement model [92]. Gefen et al. [93] suggested that PLS should be selected for the exploration or extension of an existing structural theory.
The construct reliability (CR) value consists of the validity values of all the measurement variables to represent the internal consistency of the construct indicators. Higher validity suggests the higher internal consistency of the indicators. The recommended CR value is above 0.7 [94,95]. In this study, CR was in the range of 0.896–0.928, which was above the general recommended value of 0.7. The average variance extracted (AVE) is the average amount of variation that a latent construct is able to explain in the observed variables to which it is theoretically related [96]. If the AVE of the latent variable is higher, it means the latent variable has higher degrees of convergence validity and discriminant validity. When AVE is greater than 0.5, it means the dimension has sufficient convergence validity [95]. The AVE values of the variables were between 0.681 and 0.771, over the threshold of 0.5. Therefore, the measurement questionnaire items of this study had a certain degree of convergent validity, as shown in Table 3.
3.2. Testing the Moderator Effects Optimism Bias
Path coefficient analysis was conducted using a PLS algorithm, and t-values were calculated using the PLS bootstrapping method, which showed the interaction terms to have a negative relationship to the intention to use TPMS and not reaching a statistically significant level. This meant that the interaction terms did not have a moderator effect. Furthermore, a slight change in R2 between the two models (model A → model 0, model B → model 0) also showed that there was no significant interaction. As the output in Table 4 shows, the ΔR2 values, associated with the interaction terms in model A (RP × GO, AR × GO), which considered general optimism (GO) as an interaction term in the mode, were 0.001 and 0.002, which were not statistically significant levels (F = 0.365, p > 0.05; F = 0.731, p > 0.05). This meant that there was no significant interaction between general optimism and risk perception/anticipated regret. The ΔR2 values associated with the interaction terms in model B (RP × DO, AR × DO), which considered drive skill optimism (DO) as an interaction term in the mode, were 0.007 and 0.006, also not reaching a statistically significant level (F = 2.568, p > 0.05; F = 2.198, p > 0.05). This meant that there was no significant interaction between driver skill optimism and risk perception/anticipated regret.
3.3. Statistical Cluster and Path Coefficient Analysis
The analysis was performed using a personal optimism bias scale [89]. The hierarchical cluster analysis was formed into two clusters. SPSS was used for the calculations and resulted in 106 (38.68%) in group 1 and 168 (61.32%) in group 2. As Table 5 shows, the mean results of each cluster as to personal optimism bias clearly identified group 1 as high personal optimism and group 2 as low personal optimism.
The purpose of the structural model analysis was to explain the research hypotheses and estimate the path coefficient of constructs in order to examine the relationship between the independent variables and dependent variables. In the structural model, the quality of the model was determined by the dependent variables’ overall explanatory power (R2) and standardized path coefficient (β). Its values of 0.19, 0.33, and 0.67 represent low, medium, and high explanatory power [92], respectively. This study used bootstrap resampling to estimate the values of the dimensions of PLS and t-tests to estimate the standard error and significance of the path coefficient. In this study, the R2 for group 1 and group 2 was 31.1% and 40.7% total variance explanatory power, respectively, in terms of TPMS adoption intention, and group 2 had more moderate model explanatory power in the model, as shown in Table 6.
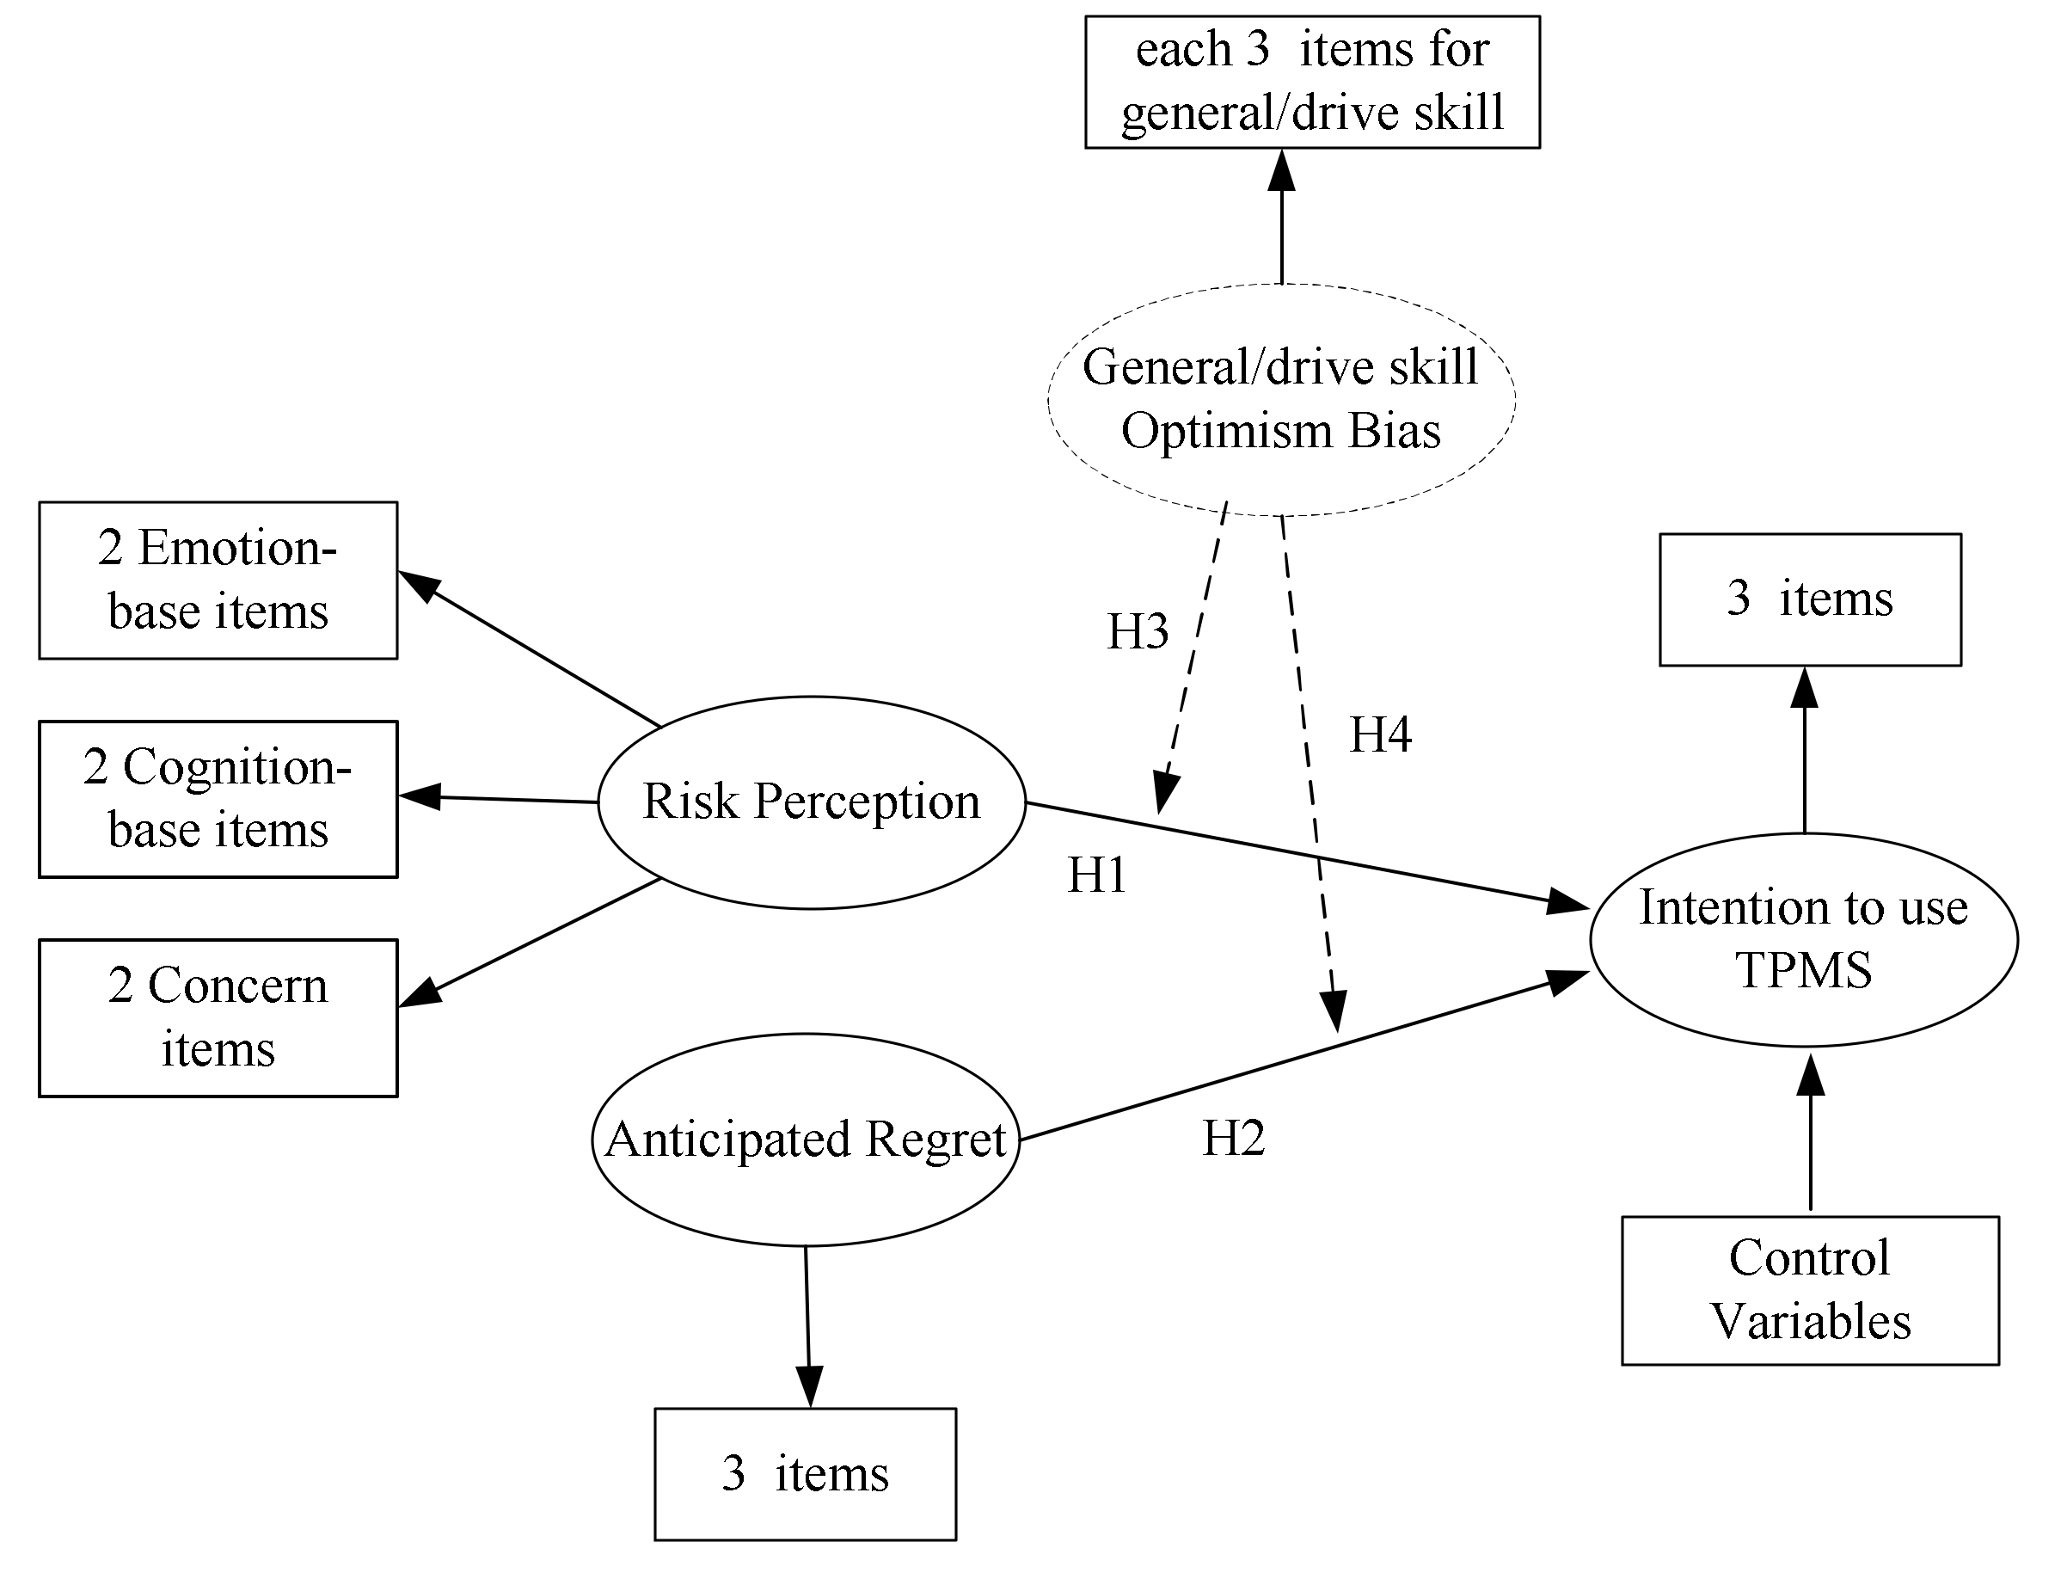
Figure 1 shows this study’s conceptual framework.
According to the path analysis results, all hypotheses relating to the model variables were confirmed. The risk perception variable in the two groups had a positive relationship; however, the relationship was more significant in group 2 (β2 = 0.552, p < 0.001) than in group 1 (β1 = 0.297, p < 0.05). t-Tests were run to show where the significant differences (t = 1.751, p > 0.05) in the risk perception between group 1 and group 2 were missing. This meant that individuals with high personal optimism as well as those with low personal optimism who have a higher risk perception had more intention to use TPMS. In contrast, the impact of the variable of anticipated regret in group 1 (β1 = −0.005) had a slightly negative relationship and in group 2 (β2 = 0.189) had a positive relationship. However, the relationship in neither group was significant. t-Tests were also run to show where the significant differences (t = 1.228, p > 0.05) in the anticipated regret between group 1 and group 2 were missing.
Regarding the control variables, there were two variables which had a significant difference between group 1 and group 2. Education had a negative (β1 = −0.164) and a positive (β2 = 0.067) relationship in group 1 and group 2, respectively, on the intention to use TPMS; however, the relationships were not significant. There was, however, a significant difference (t = 2.061, p < 0.05) between group 1 and group 2, in that clustered high optimism individuals with more education had a lower intention to use TPMS. Car Age had a negative correlation on intention to use TPMS (β1 = −0.254, β2 = −0.045), while the relationship was significant in group 1. There was, however, a significant difference (t = 2.145, p < 0.05) between group 1 and group 2, in that high optimism individuals with older cars had a lower intention to use TPMS than low optimism individuals. The results showed that personal optimism bias had an influence on these two control variables. Age, Experienced, and Check times in each group had a positive relationship on intention to use TPMS. However, the t-tests showed there to be no significant difference between group 1 and group 2. The Experienced variable indicated that both high- and low-optimism individuals with more experience of tire-related accidents had a stronger intention to use TPMS. The length of time individuals, whether of high or low optimism, held a driver’s license did not influence their intention to use TPMS.
4. Discussion
The aim of this study was to explore whether risk aversion or anticipated aversion could intensify the intention to use TPMS to prevent a tire-related accident, and whether the optimism bias had a moderator effect between risk perception/anticipated regret to the intention to use TPMS. The sample group comprised 274 participants in the Greater Taipei Area in Taiwan. Based on the questionnaire statistics and PLS analysis, this study offers the following findings: Regarding risk perception, this variable in the two groups had a positive relationship; however, the relationship was more significant in group 2 (β2 = 0.552, p < 0.001) than in group 1 (β1 = 0.297, p < 0.05). The t-tests showed there was no significant difference (t = 1.751, p > 0.05) in the risk perception between group 1 and group 2, which confirmed the hypothesis (H1). This indicated that participants with low personal optimism had more intention to use TPMS when perceiving the associated risks of not using it than those with high personal optimism. In contrast, the impact of anticipated regret in group 1 (β1 = −0.005) had a slightly negative relationship, but in group 2 (β2 = 0.189) a positive correlation. However, the relationship in neither group was significant. The t-tests indicated a significant difference (t = 1.228, p > 0.05) in the anticipated regret between group 1 and group 2. Thus, the hypothesis (H2) was not confirmed. The results could be due to the short driving distance to the workplace. Narrow roads, speed limits, and traffic jams could make people in Taiwan prefer public transportation, such as MRT (mass rapid transit), bus, train, etc., instead of driving to work. Thus, the less people drive, the less likelihood that they would be involved in a tire-related accident. Therefore, people who are driving less would not feel regret if they do not use TPMS.
Regarding personal optimism bias, the PCA method was used to calculate the results for factor 1 (general optimism) and factor 2 (driver skill optimism), the interaction terms in this study. According to the results, the F-tests of ΔR2 showed that there was no significant interaction between general/driver skill optimism and risk perception/anticipated regret. Following the results from the cluster groups’ path coefficient analysis, the t-tests showed that there was no significant difference in the risk perception/anticipated regret between the two groups. We, consequently, confirmed that optimism bias did not have a moderator effect on perception/anticipated regret and the intention to use TPMS. Therefore, the hypotheses (H3, H4) were not confirmed. These results meant that the relationships between risk perception/anticipated regret and intention would not change significantly, whether the participants had high or low optimism in general or in their driving skill.
The Age, Experienced, and Check time control variables were shown to have positive relationships in both groups, with older people tending to use TPMS, probably due to risk aversion and the desire to feel safer. People who had more experience of tire-related accidents and regularly checked their tires had a higher intention to use TPMS. Car Age and Income level had negative relationships, so that the older the car being driven, the lower the intention to use TPMS. This could be because people do want not to pay for TPMS for an old car. On the other hand, people who have higher incomes usually have a higher class car with more IVTs to protect them than lower income earners, are less likely to use TPMS.
5. Conclusions
Compared to previous relevant studies on IVTs, such as seat-belt use, backing aid systems, rear-view video cameras, and event-triggered videos, this study has explored the correlation of intention, risk perception, anticipated regret, and optimism bias variables, while TPMS acceptance-related areas have not been explored. Our findings showed that risk perception could consistently explain an individual’s risk aversion and desire to take preventive action. This confirmed previous studies conducted by Becker [66] and Rogers [67], which showed that people are inclined to take preventive action if they believe that inaction significantly increases their risk. This finding generally can be observed in IVT acceptance. Interestingly, anticipated regret did not support the hypothesis and did not consistently show that anticipated regret influences participants towards the safe option or risk aversion on road safety with previous studies [74,75,76]. However, whether the intention to use TPMS can be best served by enhancing anticipated regret or increasing awareness of the risk of tire-related accidents, optimism bias did not play a significant interaction role between risk perception/anticipated regret and intention. Additionally, our findings might prove useful for public service advertising campaigns by providing a basis for understanding the roles that cognitive and emotional factors play in accident prevention and road safety in Taiwan, and thereby increase the motivation for drivers to protect themselves by using TPMS.
6. Limitations and Future Research
One of the most important limitations of this work is related with the use of self-report as primary source of information, such as social desirability, acquiescence, or an inefficient understanding of the questions [97], explaining potential several biasing sources, However, self-reports have inherent problems and limitations, most notably the problem of common method variance. In this regard, it is important to remark the use of observational methods, external data sources, or both, for the supplementary assessment of self-rated perceptions and behaviors, or use of multiple types of respondents, longitudinal designs, and confirmatory factor analysis that explicitly models method effects to minimize of the “common method biases” often affecting cross-sectional designs in further research [98]. It is also important to note, however, that risk perception and anticipated regret are not the only factors involved in intention to use TPMS. Others factors from TAM (technology acceptance mode), TPB (theory of planned behavior), and PMT (protection motivation theory) continue to be discussed. Future researchers may focus on other human factors (i.e., intentions, attitudes, beliefs, optimism, road safety education, etc.) or on investigating the relationships to different types of vehicles or occupational fleets and integrate the current findings with other streams of research to extend the existing theory.
Author Contributions
All authors conceptualized the work. Chih-Feng Yeh conducted the questionnaire design of the paper and analyzed the results. All authors were involved in the writing of the paper.
Conflicts of Interest
The authors declare no conflict of interest.
References
- Van Schoor, O.; van Niekerk, J.L.; Grobbelaar, B. Mechanical failures as a contributing cause to motor vehicle accidents—South Africa. Accid. Anal. Prev. 2001, 33, 713–721. [Google Scholar] [CrossRef]
- Velupillai, S.; Guvenc, L. Tire pressure monitoring [applications of control]. IEEE Control Syst. 2007, 27, 22–25. [Google Scholar] [CrossRef]
- RSO. Tires. Road Safety Observatory. Web Resource. 2014. Available online: http://www.roadsafetyobservatory.com/Review/10076 (accessed on 27 March 2018).
- Daly, C. Avoiding tire-related vehicle crashes. Fire Eng. 2007, 160, 51. [Google Scholar]
- Ratrout, N.T. Tire condition and drivers’ practice in maintaining tires in Saudi Arabia. Accid. Anal. Prev. 2005, 37, 201–206. [Google Scholar] [CrossRef] [PubMed]
- Hannan, M.; Hussain, A.; Mohamed, A.; Samad, S. TPMS data analysis for enhancing intelligent vehicle performance. J. Appl. Sci. 2008, 8, 1926–1931. [Google Scholar]
- Bishop, R. A survey of intelligent vehicle applications worldwide. In Proceedings of the IEEE Intelligent Vehicles Symposium 2000 (IV 2000), Dearborn, MI, USA, 5 October 2000; IEEE: Piscataway, NJ, USA, 2000; pp. 25–30. [Google Scholar]
- Bishop, R. Intelligent Vehicle Technology and Trends; Artech House: Norwood, MA, USA, 2005. [Google Scholar]
- Garcia-Pozuelo, D.; Olatunbosun, O.; Yunta, J.; Yang, X.; Diaz, V. A Novel Strain-Based Method to Estimate Tire Conditions Using Fuzzy Logic for Intelligent Tires. Sensors 2017, 17, 350. [Google Scholar] [CrossRef] [PubMed]
- Wei, C.; Zhou, W.; Wang, Q.; Xia, X.; Li, X. TPMS (tire-pressure monitoring system) sensors: Monolithic integration of surface-micromachined piezoresistive pressure sensor and self-testable accelerometer. Microelectron. Eng. 2012, 91, 167–173. [Google Scholar] [CrossRef]
- Begg, D.; Langley, J. Changes in risky driving behavior from age 21 to 26 years. J. Saf. Res. 2001, 32, 491–499. [Google Scholar] [CrossRef]
- Evans, L.; Wasielewski, P. Risky driving related to driver and vehicle characteristics. Accid. Anal. Prev. 1983, 15, 121–136. [Google Scholar] [CrossRef]
- Fillmore, M.T.; Blackburn, J.S.; Harrison, E.L. Acute disinhibiting effects of alcohol as a factor in risky driving behavior. Drug Alcohol Depend. 2008, 95, 97–106. [Google Scholar] [CrossRef] [PubMed]
- Ivers, R.; Senserrick, T.; Boufous, S.; Stevenson, M.; Chen, H.-Y.; Woodward, M.; Norton, R. Novice drivers’ risky driving behavior, risk perception, and crash risk: Findings from the drive study. Am. J. Public Health 2009, 99, 1638–1644. [Google Scholar] [CrossRef] [PubMed]
- Jessor, R. Risky driving and adolescent problem behavior: An extension of problem-behavior theory. Alcohol Drugs Driv. 1987, 3, 1–11. [Google Scholar]
- Nelson, E.; Atchley, P.; Little, T.D. The effects of perception of risk and importance of answering and initiating a cellular phone call while driving. Accid. Anal. Prev. 2009, 41, 438–444. [Google Scholar] [CrossRef] [PubMed]
- Rajalin, S. The connection between risky driving and involvement in fatal accidents. Accid. Anal. Prev. 1994, 26, 555–562. [Google Scholar] [CrossRef]
- Simons-Morton, B.; Lerner, N.; Singer, J. The observed effects of teenage passengers on the risky driving behavior of teenage drivers. Accid. Anal. Prev. 2005, 37, 973–982. [Google Scholar] [CrossRef] [PubMed]
- White, M.P.; Eiser, J.R.; Harris, P.R. Risk perceptions of mobile phone use while driving. Risk Anal. 2004, 24, 323–334. [Google Scholar] [CrossRef] [PubMed]
- Zimbardo, P.G.; Keough, K.A.; Boyd, J.N. Present time perspective as a predictor of risky driving. Personal. Individ. Differ. 1997, 23, 1007–1023. [Google Scholar] [CrossRef]
- Araujo, M.; Illanes, E.; Chapman, E.; Rodrigues, E. Effectiveness of interventions to prevent motorcycle injuries: Systematic review of the literature. Int. J. Inj. Control Saf. Promot. 2017, 24, 406–422. [Google Scholar] [CrossRef] [PubMed]
- Arvin, R.; Khademi, M.; Razi-Ardakani, H. Study on mobile phone use while driving in a sample of Iranian drivers. Int. J. Inj. Control Saf. Promot. 2017, 24, 256–262. [Google Scholar] [CrossRef] [PubMed]
- Alonso, F.; Esteban, C.; Montoro, L.; Useche, S.A. Knowledge, Perceived Effectiveness and Qualification of Traffic Rules, Police Supervision, Sanctions and Justice. Cogent Soc. Sci. 2017, 3, 1393855. [Google Scholar] [CrossRef]
- Yagil, D. Instrumental and normative motives for compliance with traffic laws among young and older drivers. Accid. Anal. Prev. 1998, 30, 417–424. [Google Scholar] [CrossRef]
- Barnett, J.; Breakwell, G.M. Risk perception and experience: Hazard personality profiles and individual differences. Risk Anal. 2001, 21, 171–178. [Google Scholar] [CrossRef] [PubMed]
- Brown, I.; Groeger, J. Risk perception and decision taking during the transition between novice and experienced driver status. Ergonomics 1988, 31, 585–597. [Google Scholar] [CrossRef]
- Deery, H.A. Hazard and risk perception among young novice drivers. J. Saf. Res. 2000, 30, 225–236. [Google Scholar] [CrossRef]
- Leiserowitz, A. Climate change risk perception and policy preferences: The role of affect, imagery, and values. Clim. Chang. 2006, 77, 45–72. [Google Scholar] [CrossRef]
- Machin, M.A.; Sankey, K.S. Relationships between young drivers’ personality characteristics, risk perceptions, and driving behaviour. Accid. Anal. Prev. 2008, 40, 541–547. [Google Scholar] [CrossRef] [PubMed] [Green Version]
- Rundmo, T.; Iversen, H. Risk perception and driving behaviour among adolescents in two Norwegian counties before and after a traffic safety campaign. Saf. Sci. 2004, 42, 1–21. [Google Scholar] [CrossRef]
- Ulleberg, P.; Rundmo, T. Personality, attitudes and risk perception as predictors of risky driving behaviour among young drivers. Saf. Sci. 2003, 41, 427–443. [Google Scholar] [CrossRef]
- Chen, Q.; Li, X.; Zhou, X.; Zeng, L.; Liao, C.; Xiao, Q.; Kang, S. Analysis and research on the man-machine dynamics behaviour coupling mechanism of the super miniature electric vehicle. Int. J. Veh. Saf. 2017, 9. [Google Scholar] [CrossRef]
- Ma, Y.; Lu, L.; Lu, J.J. Safety evaluation model of urban cross-river tunnel based on driving simulation. Int. J. Inj. Control Saf. Promot. 2017, 24, 293–302. [Google Scholar] [CrossRef] [PubMed]
- Brooks, C.A.; Rakotonirainy, A. In-vehicle technologies, advanced driver assistance systems and driver distraction: Research challenges. In Proceedings of the International Conference on Driver Distraction, Sydney, Australia, 2–3 June 2005. [Google Scholar]
- Harbluk, J.L.; Noy, Y.I.; Eizenman, M. The Impact of Cognitive Distraction on Driver Visual Behaviour and Vehicle Control; Transport Canada: Ottawa, ON, Canada, 2002. [Google Scholar]
- Horrey, W.J.; Wickens, C.D.; Consalus, K.P. Modeling drivers’ visual attention allocation while interacting with in-vehicle technologies. J. Exp. Psychol. Appl. 2006, 12, 67–78. [Google Scholar] [CrossRef] [PubMed]
- Lee, J.D. Technology and teen drivers. J. Saf. Res. 2007, 38, 203–213. [Google Scholar] [CrossRef] [PubMed]
- Llaneras, R.E. Exploratory Study of Early Adopters, Safety-Related Driving with Advanced Technologies. Draft Final Task 2 Report: In-Vehicle Systems Inventory, Recruitment Methods & Approaches, and Owner Interview Results; The National Academies of Sciences, Engineering, and Medicine: Washington, DC, USA, 2006. [Google Scholar]
- Llaneras, R.E.; Singer, J.P. Inventory of in-Vehicle Technology Human Factors Design Characteristics; US Department of Transportation: Washington, DC, USA, 2002. [Google Scholar]
- Musicant, O.; Lampel, L. When technology tells novice drivers how to drive. Transp. Res. Rec. J. Transp. Res. Board 2010, 2182, 8–15. [Google Scholar] [CrossRef]
- Regan, M.A.; Mitsopoulos, E.; Haworth, N.; Young, K. Acceptability of in-Vehicle Intelligent Transport Systems to Victorian Car Drivers; Monash University Accident Research Centre: Clayton, VIC, Australia, 2002. [Google Scholar]
- Toledo, T.; Musicant, O.; Lotan, T. In-vehicle data recorders for monitoring and feedback on drivers’ behavior. Transp. Res. Part C Emerg. Technol. 2008, 16, 320–331. [Google Scholar] [CrossRef]
- Weinberg, G.; Harsham, B. Developing a low-cost driving simulator for the evaluation of in-vehicle technologies. In Proceedings of the 1st International Conference on Automotive User Interfaces and Interactive Vehicular Applications, Essen, Germany, 21–22 September 2009; ACM: New York, NY, USA, 2009; pp. 51–54. [Google Scholar]
- Park, E.; Kim, H.; Ohm, J.Y. Understanding driver adoption of car navigation systems using the extended technology acceptance model. Behav. Inf. Technol. 2015, 34, 741–751. [Google Scholar] [CrossRef]
- Ehlers, S.G.; Field, W.E. Injury/fatality-causing incidents involving the rearward movement of agricultural machinery: Types, causes, and preventive measures. Safety 2017, 3, 8. [Google Scholar] [CrossRef]
- Cohen, A.; Einav, L. The effects of mandatory seat belt laws on driving behavior and traffic fatalities. Rev. Econ. Stat. 2003, 85, 828–843. [Google Scholar] [CrossRef]
- Kidd, D.G.; McCartt, A.T.; Oesch, N.J. Attitudes toward seat belt use and in-vehicle technologies for encouraging belt use. Traffic Inj. Prev. 2014, 15, 10–17. [Google Scholar] [CrossRef] [PubMed]
- McCartt, A.T.; Northrup, V.S. Factors related to seat belt use among fatally injured teenage drivers. J. Saf. Res. 2004, 35, 29–38. [Google Scholar] [CrossRef] [PubMed]
- Steptoe, A.; Wardle, J.; Fuller, R.; Davidsdottir, S.; Davou, B.; Justo, J. Seatbelt use, attitudes, and changes in legislation: An international study. Am. J. Prev. Med. 2002, 23, 254–259. [Google Scholar] [CrossRef]
- Van Houten, R.; Hilton, B.; Schulman, R.; Reagan, I. Using Haptic Feedback to Increase Seatbelt Use of Service Vehicle Drivers; US Department of Transportation: Washington, DC, USA, 2011. [Google Scholar]
- Weinstein, N.D.; Grubb, P.D.; Vautier, J.S. Increasing automobile seat belt use: An intervention emphasizing risk susceptibility. J. Appl. Psychol. 1986, 71, 285–290. [Google Scholar] [CrossRef] [PubMed]
- Williams, A.F.; Reinfurt, D.; Wells, J.K. Increasing seat belt use in North Carolina. J. Saf. Res. 1996, 27, 33–41. [Google Scholar] [CrossRef]
- Jenness, J.W.; Lerner, N.D.; Mazor, S.; Osberg, J.S.; Tefft, B.C. Use of Advanced in-Vehicle Technology by Young and Older Early Adopters. Survey Results on Adaptive Cruise Control Systems; Report No. DOT HS 810 917; US Department of Transportation: Washington, DC, USA, 2008. [Google Scholar]
- McGehee, D.V.; Raby, M.; Carney, C.; Lee, J.D.; Reyes, M.L. Extending parental mentoring using an event-triggered video intervention in rural teen drivers. J. Saf. Res. 2007, 38, 215–227. [Google Scholar] [CrossRef] [PubMed]
- Li, S.; Zhou, K.; Sun, Y.; Rao, L.-L.; Zheng, R.; Liang, Z.-Y. Anticipated regret, risk perception, or both: Which is most likely responsible for our intention to gamble? J. Gambl. Stud. 2010, 26, 105–116. [Google Scholar] [CrossRef] [PubMed]
- Cox, D.F.; Rich, S.U. Perceived risk and consumer decision-making: The case of telephone shopping. J. Mark. Res. 1964, 1, 32–39. [Google Scholar] [CrossRef]
- Bauer, R.A. Consumer behavior as risk taking. In Dynamic Marketing for a Changing World; American Marketing Association: Chicago, IL, USA, 1960; p. 398. [Google Scholar]
- Sjöberg, L.; Moen, B.-E.; Rundmo, T. Explaining Risk Perception. An Evaluation of the Psychometric Paradigm in Risk Perception Research; Rotunde: Trondheim, Norway, 2004. [Google Scholar]
- Nordgren, L.F.; Van Der Pligt, J.; Van Harreveld, F. Unpacking perceived control in risk perception: The mediating role of anticipated regret. J. Behav. Decis. Mak. 2007, 20, 533–544. [Google Scholar] [CrossRef]
- Yates, J. Risk-Taking Behavior; John Wiley & Sons: Hoboken, NJ, USA, 1992. [Google Scholar]
- Slovic, P.E. The Perception of Risk; Earthscan Publications: Trondheim, Norway, 2000. [Google Scholar]
- Milech, D.; Glencross, D.; Hartley, L. Skills Acquisition by Young Drivers: Perceiving, Interpreting and Responding to the Driving Environment; Federal Office of Road Safety: Canberra, A.C.T., Australia, 1989. [Google Scholar]
- Moe, D. Young Drivers, Relation between Perceived and Real Ability; Swedish Transport and Communication Research Board: Stockholm, Sweden, 1986. [Google Scholar]
- Stasson, M.; Fishbein, M. The relation between perceived risk and preventive action: A within-subject analysis of perceived driving risk and intentions to wear seatbelts. J. Appl. Soc. Psychol. 1990, 20, 1541–1557. [Google Scholar] [CrossRef]
- Fhaner, G.; Hane, M. Seat belts: Factors influencing their use a literature survey. Accid. Anal. Prev. 1973, 5, 27–43. [Google Scholar] [CrossRef]
- Becker, M.H. The Health Belief Model and Personal Health Behavior; Slack: San Francisco, CA, USA, 1974. [Google Scholar]
- Rogers, R.W. A protection motivation theory of fear appeals and attitude change1. J. Psychol. 1975, 91, 93–114. [Google Scholar] [CrossRef] [PubMed]
- Bell, D.E. Regret in decision making under uncertainty. Oper. Res. 1982, 30, 961–981. [Google Scholar] [CrossRef]
- Loomes, G.; Sugden, R. Regret theory: An alternative theory of rational choice under uncertainty. Econ. J. 1982, 92, 805–824. [Google Scholar] [CrossRef]
- Tsiros, M.; Mittal, V. Regret: A model of its antecedents and consequences in consumer decision making. J. Consum. Res. 2000, 26, 401–417. [Google Scholar] [CrossRef]
- Connolly, T.; Zeelenberg, M. Regret in decision making. Curr. Dir. Psychol. Sci. 2002, 11, 212–216. [Google Scholar] [CrossRef]
- Loewenstein, G.F.; Weber, E.U.; Hsee, C.K.; Welch, N. Risk as feelings. Psychol. Bull. 2001, 127, 267–286. [Google Scholar] [CrossRef] [PubMed]
- Gilovich, T.; Medvec, V.H. The experience of regret: What, when, and why. Psychol. Rev. 1995, 102, 379–395. [Google Scholar] [CrossRef] [PubMed]
- Parker, D.; Stradling, S.G.; Manstead, A.S. Modifying beliefs and attitudes to exceeding the speed limit: An intervention study based on the theory of planned behavior1. J. Appl. Soc. Psychol. 1996, 26, 1–19. [Google Scholar] [CrossRef]
- Elliott, M.A. Testing the capacity within an extended theory of planned behaviour to reduce the commission of driving violations. Transportmetrica 2012, 8, 321–343. [Google Scholar] [CrossRef]
- Abraham, C.; Sheeran, P. Acting on intentions: The role of anticipated regret. Br. J. Soc. Psychol. 2003, 42, 495–511. [Google Scholar] [CrossRef] [PubMed]
- Frost, S.; Myers, L.B.; Newman, S.P. Genetic screening for Alzheimer’s disease: What factors predict intentions to take a test? Behav. Med. 2001, 27, 101–109. [Google Scholar] [CrossRef] [PubMed]
- Wroe, A.L.; Turner, N.; Salkovskis, P.M. Understanding and predicting parental decisions about early childhood immunizations. Health Psychol. 2004, 23, 33–41. [Google Scholar] [CrossRef] [PubMed]
- Ziarnowski, K.L.; Brewer, N.T.; Weber, B. Present choices, future outcomes: Anticipated regret and HPV vaccination. Prev. Med. 2009, 48, 411–414. [Google Scholar] [CrossRef] [PubMed]
- Sheeran, P.; Orbell, S. Augmenting the theory of planned behavior: Roles for anticipated regret and descriptive norms1. J. Appl. Soc. Psychol. 1999, 29, 2107–2142. [Google Scholar] [CrossRef]
- Conner, M.; Sandberg, T.; McMillan, B.; Higgins, A. Role of anticipated regret, intentions and intention stability in adolescent smoking initiation. Br. J. Health Psychol. 2006, 11, 85–101. [Google Scholar] [CrossRef] [PubMed]
- Weinstein, N.D. Unrealistic optimism about future life events. J. Personal. Soc. Psychol. 1980, 39, 806–820. [Google Scholar] [CrossRef]
- Weinstein, N.D. Unrealistic optimism about susceptibility to health problems. J. Behav. Med. 1982, 5, 441–460. [Google Scholar] [CrossRef] [PubMed]
- Van der Pligt, J.; Otten, W.; Richard, R.; van der Velde, F. Perceived risk of aids: Unrealistic optimism and self-protective action. In The Social Psychology of HIV-Infection; Lawrence Erlbaum: Hillsdale, NJ, USA, 1993. [Google Scholar]
- Harre, N.; Foster, S.; O’Neill, M. Self-enhancement, crash-risk optimism and the impact of safety advertisements on young drivers. Br. J. Psychol. 2005, 96, 215–230. [Google Scholar] [CrossRef] [PubMed]
- Harre, N.; Sibley, C.G. Explicit and implicit self-enhancement biases in drivers and their relationship to driving violations and crash-risk optimism. Accid. Anal. Prev. 2007, 39, 1155–1161. [Google Scholar] [CrossRef] [PubMed]
- Walton, D.; McKeown, P. Drivers’ biased perceptions of speed and safety campaign messages. Accid. Anal. Prev. 2001, 33, 629–640. [Google Scholar] [CrossRef]
- Martha, C.; Delhomme, P. Are absolute and comparative judgements about road traffic-risks inherent in speeding realistic? A study among french traffic regulation offenders. Transp. Res. Part F Traffic Psychol. Behav. 2014, 26, 126–137. [Google Scholar] [CrossRef]
- Coogan, M.A.; Campbell, M.; Adler, T.J.; Forward, S. Examining behavioral and attitudinal differences among groups in their traffic safety culture. Transp. Res. Part F Traffic Psychol. Behav. 2014, 26, 303–316. [Google Scholar] [CrossRef]
- Lee, Y. Understanding anti-plagiarism software adoption: An extended protection motivation theory perspective. Decis. Support Syst. 2011, 50, 361–369. [Google Scholar] [CrossRef]
- Chin, W.W.; Marcolin, B.L.; Newsted, P.R. A partial least squares latent variable modeling approach for measuring interaction effects: Results from a Monte Carlo simulation study and an electronic-mail emotion/adoption study. Inf. Syst. Res. 2003, 14, 189–217. [Google Scholar] [CrossRef]
- Chin, W.W. The partial least squares approach to structural equation modeling. Mod. Methods Bus. Res. 1998, 295, 295–336. [Google Scholar]
- Gefen, D.; Straub, D.W.; Rigdon, E.E. An update and extension to SEM guidelines for admnistrative and social science research. Manag. Inf. Syst. Q. 2011, 35, iii. [Google Scholar] [CrossRef]
- Hair, J.F.; Anderson, R.E.; Tatham, R.L.; Black, W. Multivariate Data Analysis; Prentice Hall: Upper Saddle River, NJ, USA, 1998. [Google Scholar]
- Fornell, C.; Larcker, D.F. Evaluating structural equation models with unobservable variables and measurement error. J. Mark. Res. 1981, 18, 39–50. [Google Scholar] [CrossRef]
- Afthanorhan, W.M.A.B.W.; Ahmad, S. Modelling a high reliability and validity by using confirmatory factor analysis on five latent construct: Volunteerism program. Int. Res. J. Adv. Eng. Sci. Technol. 2013, 1, 7. [Google Scholar]
- Perinelli, E.; Gremigni, P. Use of social desirability scales in clinical psychology: A systematic review. J. Clin. Psychol. 2016, 72, 534–551. [Google Scholar] [CrossRef] [PubMed]
- Whitman, M.E.; Woszczynski, A.B. The Problem of Common Method Variance in IS Research. In The Handbook of Information Systems Research; Whitman, M.E., Woszczynski, A.B., Eds.; IGI Global: Hershey, PA, USA, 2004; pp. 1–14. [Google Scholar]
Figure 1.
Conceptual model.


Table 1.
Injury accidents and casualties involving tire-related factors, 2007–2016, Taiwan.
| Year | 2007 | 2008 | 2009 | 2010 | 2011 | 2012 | 2013 | 2014 | 2015 | 2016 | |||
|---|---|---|---|---|---|---|---|---|---|---|---|---|---|
| Accidents (freq). | Accumulate | % | |||||||||||
| total | 110 | 88 | 64 | 67 | 62 | 58 | 66 | 60 | 77 | 67 | 719 | ||
| tire-related | 7 | 11 | 8 | 9 | 6 | 4 | 5 | 5 | 4 | 3 | 62 | 8.62 | |
| Casualties (people) | 1648 (176) | 10.68 | |||||||||||
| Fatal | total | 112 | 98 | 82 | 74 | 72 | 68 | 71 | 73 | 89 | 70 | 809 | |
| tire-related | 7 | 11 | 11 | 13 | 9 | 4 | 5 | 5 | 9 | 3 | 77 | 9.52 | |
| Serious | total | 86 | 104 | 102 | 75 | 47 | 103 | 70 | 83 | 89 | 80 | 839 | |
| tire-related | 13 | 16 | 23 | 17 | 2 | 4 | 8 | 11 | 4 | 1 | 99 | 11.80 |
Table 2.
Demographic information of respondents in this study.
| Items | N | % | Items | N | % |
|---|---|---|---|---|---|
| Gender | Income (USD/Year) | ||||
| Male | 165 | 60.2 | <20,000 | 21 | 7.7 |
| Female | 109 | 39.8 | 20,000~30,000 | 85 | 31.0 |
| Age | 30,001~40,000 | 90 | 32.8 | ||
| 18~30 | 8 | 2.9 | 40,001~50,000 | 43 | 15.7 |
| 31~40 | 88 | 32.1 | 50,001~60,000 | 22 | 8.0 |
| 41~50 | 88 | 32.1 | 60,001~70,000 | 6 | 2.2 |
| 51~60 | 58 | 21.2 | 70,001~80,000 | 7 | 2.6 |
| 61~ | 32 | 11.7 | Car Age (years) | ||
| Education | 3~5 | 91 | 33.2 | ||
| high school | 17 | 6.2 | 6~10 | 93 | 33.9 |
| collage | 181 | 66.1 | 11~15 | 61 | 22.3 |
| graduate school | 76 | 27.7 | 16~20 | 22 | 8.0 |
| Time held License license | 21~ | 7 | 2.6 | ||
| <1 | 10 | 3.7 | Experienced Times | ||
| 1~10 | 40 | 14.6 | No experienced | 155 | 56.6 |
| 11~20 | 108 | 39.4 | <5 | 108 | 39.4 |
| 21~30 | 62 | 22.6 | 6~10 | 11 | 4.0 |
| 31~40 | 42 | 15.3 | 11~ | 0 | 0.0 |
| 40~ | 12 | 4.4 | Check Times | ||
| No check | 113 | 41.3 | |||
| <5 | 148 | 54.0 | |||
| 6~10 | 13 | 4.7 | |||
| 11~ | 0 | 0.0 | |||
Table 3.
Interconstruct correlations.
| Item | Construct | CR | α | AVE | 1 | 2 | 3 | 4 | 5 |
|---|---|---|---|---|---|---|---|---|---|
| 1. | Intention | 0.896 | 0.829 | 0.743 | 0.862 | - | - | - | - |
| 2. | Risk Perception | 0.928 | 0.907 | 0.681 | 0.476 | 0.825 | - | - | - |
| 3. | Anticipated Regret | 0.910 | 0.853 | 0.771 | 0.328 | 0.478 | 0.878 | - | - |
| 4. | General Optimism | 0.748 | 0.719 | 0.539 | 0.281 | 0.362 | 0.212 | 0.734 | - |
| 5. | Drive skill Optimism | 0.851 | 0.820 | 0.666 | 0.146 | 0.189 | −0.181 | 0.226 | 0.816 |
The values on the diagonal represent the square root of the average variance extracted (AVE).
Table 4.
The results of moderator effect.
| Variables | Direct Effect | Moderation Effect | |||||
|---|---|---|---|---|---|---|---|
| Model 0 | Model A1 | Model A2 | Model A3 | Model B1 | Model B2 | Model B3 | |
| Independent variables | |||||||
| Risk perception(RP) | 0.419 *** | 0.381 *** | 0.38 *** | 0.371 *** | 0.377 *** | 0.372 *** | 0.357 *** |
| Anticipated regret(AR) | 0.136 * | 0.129 * | 0.125 * | 0.134 * | 0.177 * | 0.18 * | 0.213 * |
| Moderators | |||||||
| General optimism (GO) | 0.119 * | 0.112 * | 0.113 * | ||||
| Drive skill optimism(DO) | 0.116 | 0.128 | 0.119 | ||||
| Interaction terms | |||||||
| RP × GO | −0.026 | ||||||
| AR × GO | −0.044 | ||||||
| RP × DO | −0.078 | ||||||
| AR × DO | −0.08 | ||||||
| R2 | 0.243 | 0.262 | 0.263 | 0.264 | 0.26 | 0.267 | 0.266 |
| R2 difference | 0.019 ** | 0.001 | 0.002 | 0.017 ** | 0.007 | 0.006 | |
| F-test | 6.95 | 0.365 | 0.731 | 6.2 | 2.568 | 2.198 | |
| p-value | 0.009 | 0.546 | 0.393 | 0.006 | 0.11 | 0.14 | |
* p < 0.05; ** p < 0.01; *** p < 0.001.
Table 5.
Table highlighting responses to personal optimism bias scale.
| Items Description | Group 1 (n = 106) | Group 2 (n = 168) | |||
|---|---|---|---|---|---|
| Mean | S.D. | Mean | S.D. | ||
| Risk Perception | |||||
| RP1 | Feeling unsafe that you yourself could be injured in a tire-related traffic accident. | 5.56 | 1.48 | 5.37 | 1.43 |
| RP2 | Worried for yourself being in a tire-related traffic accident. | 5.44 | 1.46 | 4.97 | 1.52 |
| RP3 | How probable do you think it is in general for a person to be injured in a tire-related traffic accident? | 4.81 | 1.53 | 4.52 | 1.48 |
| RP4 | How probable do you think it is for yourself to be injured in a tire-related traffic accident? | 4.51 | 1.62 | 4.29 | 1.54 |
| RP5 | How concerned are you about traffic and are thinking on the tire-related risks for a person in general? | 5.17 | 1.45 | 4.8 | 1.51 |
| RP6 | How concerned are you about tire-related traffic risks and are thinking that you yourself could be victimized? | 5.1 | 1.65 | 4.68 | 1.35 |
| Anticipated Regret | |||||
| AR1 | How much regret would you feel if you have tire-related problems when driving? | 5.47 | 1.23 | 5.57 | 1.09 |
| AR2 | How likely is it that you would feel regret if you did not check tires pressure when driving at high speed? | 5.46 | 1.14 | 5.54 | 1.16 |
| AR3 | If I did not adapt an action to prevent tire-related accident, I would feel regret. | 5.43 | 1.28 | 5.59 | 0.99 |
| Optimism Bias | |||||
| OB1 | Most accidents are caused by people who are less experienced than myself. | 4.93 | 1.39 | 3.42 | 1.59 |
| OB2 | I am a safer driver than of my age and gender. | 5.61 | 1.11 | 5.05 | 1.39 |
| OB3 | Those speed limit rules make no sense for me, as I am a very precise driver who responses and brakes quickly. | 4.26 | 1.54 | 2.49 | 1.21 |
| OB4 | I have a Low Risk car that is safe to drive considerably above the speed limit. | 4.71 | 1.31 | 2.12 | 1.02 |
| OB5 | There is no danger in following close, as I am a very precise driver. | 4.86 | 1.19 | 2.20 | 1.08 |
| OB6 | My emotions influence my driving less than other of my age and gender. | 5.20 | 1.09 | 4.08 | 1.47 |
| Intention | |||||
| INT1 | I intend to use the TPMS. | 5.07 | 1.52 | 4.47 | 1.19 |
| INT2 | I predict I will use the TPMS in the near future. | 4.44 | 1.48 | 4.30 | 1.32 |
| INT3 | I plan to use the TPMS in the near future. | 4.61 | 1.58 | 4.50 | 1.39 |
Table 6.
Results structural model analysis.
| Path | Group 1 | Group 2 | Significance | |||
|---|---|---|---|---|---|---|
| n = 106 (R2 = 0.311) | n = 168 (R2 = 0.407) | t-Statistic | p-Value (2-Tailed) | |||
| β1 | t-Value | β2 | t-Value | |||
| Independent variables | ||||||
| Risk Perception → Intention | 0.297 | 2.020 * | 0.552 | 7.563 *** | 1.751 | 0.081 |
| Anticipated Regret → Intention | −0.005 | 0.005 | 0.189 | 1.148 | 1.228 | 0.221 |
| Control Variables | ||||||
| Age → Intention | 0.038 | 0.382 | 0.295 | 2.938 ** | 1.737 | 0.084 |
| Gender → Intention | −0.057 | 0.615 | −0.036 | 0.685 | 0.215 | 0.830 |
| Education → Intention | −0.164 | 1.912 | 0.067 | 0.943 | 2.061 * | 0.040 |
| Income → Intention | −0.268 | 2.128 * | −0.064 | 0.577 | 1.191 | 0.235 |
| Time held license → Intention | 0.046 | 0.410 | −0.133 | 1.128 | 1.035 | 0.302 |
| Car age → Intention | −0.254 | 2.179 * | −0.003 | 0.045 | 2.145 * | 0.033 |
| Experienced → Intention | 0.091 | 1.057 | 0.083 | 1.262 | 0.075 | 0.941 |
| Check times → Intention | 0.220 | 2.381 * | 0.075 | 1.153 | 1.327 | 0.186 |
* p < 0.05; ** p < 0.01; *** p < 0.001.
© 2018 by the authors. Licensee MDPI, Basel, Switzerland. This article is an open access article distributed under the terms and conditions of the Creative Commons Attribution (CC BY) license (http://creativecommons.org/licenses/by/4.0/).
Share and Cite
MDPI and ACS Style
Chen, K.-Y.; Yeh, C.-F. Preventing Tire Blowout Accidents: A Perspective on Factors Affecting Drivers’ Intention to Adopt Tire Pressure Monitoring System. Safety 2018, 4, 16. https://doi.org/10.3390/safety4020016
AMA Style
Chen K-Y, Yeh C-F. Preventing Tire Blowout Accidents: A Perspective on Factors Affecting Drivers’ Intention to Adopt Tire Pressure Monitoring System. Safety. 2018; 4(2):16. https://doi.org/10.3390/safety4020016
Chicago/Turabian StyleChen, Kai-Ying, and Chih-Feng Yeh. 2018. "Preventing Tire Blowout Accidents: A Perspective on Factors Affecting Drivers’ Intention to Adopt Tire Pressure Monitoring System" Safety 4, no. 2: 16. https://doi.org/10.3390/safety4020016
Note that from the first issue of 2016, this journal uses article numbers instead of page numbers. See further details here.