
Potential Benefit of the Quadbar™ on All-Terrain Vehicles

Emory University Rollins School of Public Health, 4916 Holland View Drive, Flowery Branch, Atlanta, GA 30542, USA
Safety 2016, 2(1), 5; https://doi.org/10.3390/safety2010005
Submission received: 28 August 2015
/
Revised: 7 February 2016
/
Accepted: 14 February 2016
/
Published: 19 February 2016
(This article belongs to the Special Issue All-Terrain (ATVs, Quad Bikes) and Off-Highway (ROVs, UTVs, SSVs, LSVs, LUVs, MUVs, XUVs) Vehicle Safety)
Abstract
:An epidemic exists related to all-terrain vehicle (ATV) fatal and nonfatal injuries in the United States and in Australia as well as in other countries. More than 60% of these injuries are associated with ATV overturns. While behavior-related methods have failed to abate this epidemic, engineered interventions have been lacking. However, one technology, the Quadbar™ (QB), shows promise as a crush prevention device for reducing overturn-related injuries and their severity. The question addressed in this study is “What is the potential public health and economic benefit of the QB when used on ATVs?” At 40% effectiveness, our model estimated that 5082 injuries related to ATV overturns would be prevented per 100,000 ATVs equipped with QBs. The overall societal economic benefit was estimated at US$3,943 per ATV that greatly exceeds the QB purchase price of US$478, which represents an 8:1 return on investment.
1. Introduction
“The concept pulls together information from epidemiology and public health surveillance, intervention studies, and economic analysis, using direct evidence when available and indirect evidence when necessary”―Steven M. Teutsch and Jeffrey R. Harris [1].
Injuries are a serious problem of epidemic proportions regarding all-terrain vehicle (ATV) incidents. The US Consumer Product Safety Commission (CPSC) documented a total of 10,561 ATV-related deaths for the years 1985 to 2009 in its 2013 annual report [2]. In the same report, CPSC also documented another 1.2 million nonfatal injuries from 2001 to 2009 due to ATV-related crashes including overturns. These ATV-related deaths and injuries are a tragic, unanticipated consequence of ATV design and use. See Figure 1 for CPSC-reported ATV-related deaths and injuries in the United States for the years 2003–2009 [2]. Although much of the focus has been on the social costs of fatalities, nonfatal injuries are a major concern as well and deserve attention. While an explanation is not totally clear, the decline in ATV-related injuries in 2008 and 2009 as shown in Figure 1 may be related to decreased sales of new ATVs during the economic recession of the mid-2000s [3]. CPSC is still collecting data on the deaths that have occurred since 2009. Overturns of these machines are associated with 60.3% and 60.6% of ATV-related nonfatal and fatal injuries, respectively, and the cause of another 18% of the fatalities is unknown, which likely includes additional overturn-related deaths [4].
A technology has emerged that is aimed at reducing this public health epidemic by preventing crush-related injuries and asphyxia associated with ATV overturns. The technology is the crush prevention device (CPD). According to John Lambert, an engineer in Australia, CPD requirements include both safety and operational criteria [5]:
- Safety Criteria
- ➢
- Effective in protecting the rider in rear and side overturns
- ➢
- Improved safety in front overturns
- ➢
- High enough clearance to provide survival space in the upside-down position
- ➢
- A safe distance away from the rider to minimize impact with the rider in the event of an overturn
- ➢
- A design to minimize the chance of pinning or spearing a rider in the event of an overturn
- Operational Criteria
- ➢
- Must not restrict access and egress from the ATV or driver visibility
- ➢
- Has minimal impact on stability with low weight and low center-of-gravity
- ➢
- Must be low enough to not catch overhead branches
The Quadbar™ (QB), as shown in Figure 2, is claimed to meet these criteria. In Australia, where the QB is manufactured, the term “quad bike” is used for ATVs. A natural experiment is in play regarding the effectiveness of the QB. Tony Lower at the Australian Centre for Agriculture Health and Safety in New South Wales reported in August 2015 on a review of ATVs in New Zealand and Australia over a 15-year period since 2000. The review found that at least 10,000 ATVs have some form of CPD, and they found no incident where the CPD was implicated in a fatal overturn [6]. Lower also estimated the total CPDs in place in New Zealand at 8000 units, representing 10% of the ATVs there [7].
Moreover, David Robertson, inventor of the QB, reported at a 2015 coroner’s inquest in Australia that he had sold more than 3700 QBs since 2007, mostly in Australia. He said that more than 100 QBs were fitted on ATVs at a resort where more than 3000 tourists ride QB-equipped ATVs per month. The director at that resort reported to him that since fitting the ATVs with the QB, injury rates declined by about 90%. Furthermore, Robertson said, no deaths have been identified with the use of CPDs in New Zealand or Australia [8].
The potential benefit of the QB on ATVs warrants attention. Critical for this attention is an analysis of the effectiveness of the QB to prevent overturn-related injuries. Three estimates are considered: 12%, 40%, and 80%. Associate Professor Robert Anderson conducted a review of a computer simulation report by Dynamic Research Inc. regarding the QB and testified at an inquest that he had extracted from the report a non-statistically significant net benefit of the QB at 12% [9]. The net benefit calculation included the negative effect of the estimated injuries from rider impact with the QB during an ATV collision or overturn. However, Anderson expressed concern about the validity of the assumptions and data input used in the computer simulations.
In a presentation at a CPSC meeting, James Helmkamp referred to Australian research and suggested that fitting ATVs with QBs could potentially reduce the number of ATV-related deaths by up to 40% [10]. The 40% value corresponds to the lower percentage in which Lambert reported that Australian engineers and technical experts predicted a reduction of 40% to 50% of both fatalities and serious injuries when a QB was used on an ATV [11]. Lambert’s estimate was informed by a Myers and Pana-Cryan decision analysis in which 81% of deaths were averted in the event of an overturn when a rollover protective structure (ROPS) was placed on a tractor [12]. He observed no difference in injury prevention effectiveness between the fitting of a ROPS behind the seat on a tractor and the fitting of a CPD to the back of the cargo rack behind the rider of an ATV [11]. In their analysis of 109 ATV-related deaths, Grzebieta et al. determined that 71.6% of 109 ATV-related deaths were associated with overturns, and in 50.5% of all cases the descendent was pinned by the quad bike [13]. Based upon his observation, Lambert calculated that these cases could be prevented by a QB with a reduction in deaths of 40% (80% × 50%). However, a CPD could also reduce other overturn-related fatalities, and thus he made a conservative estimate of a 40% to 50% reduction in deaths [11]. Both Anderson’s 12% and Helmkamp’s 40% reduction estimates include all fatalities and injuries, not just those related to overturn events.
Moreover, Lambert opined that the QB is an ideal start for reducing deaths and serious injuries related to ATV overturns by 80% [5]. Lambert stated that at least 20 individuals claimed that their lives were saved as a result of the QB. To date, no deaths have been associated with a QB-fitted ATV or, for that matter, any CPD-equipped ATV. He identified only two cases of hospital admissions for an equivalent of 12,170 ATV years with QB protection as of August of 2015 [11].
2. Method and Materials
The research question herein is “What is the potential public health and economic benefit of the QB when used on ATVs?” To answer this question, this study addresses the QB and its potential social benefit for averting fatal and nonfatal injuries as a result of ATV overturns. This section describes the use of injury severity scales in order to consider the full range of injuries by severity. It also describes a cost-benefit approach used to determine the benefit of fitting an ATV with a QB. The cost side is the purchase and installation of the QB on an ATV. The benefit side of this action is complex and follows a three-step process. After the discussion of injury severity, decision analysis is described, which uses probabilities of different levels of injury severity as shown in Table 1. The result of the decision analysis is the calculation of injuries potentially averted by the QB intervention [14]. The decision analysis uses the 40% figure described earlier as the effectiveness of the QB in reducing fatal and nonfatal ATV-related injuries as the base case. Next, economic analysis is described, which associates the benefit (cost savings) figures from Table 1 as applied to the ATV-related injuries averted and the cost and benefit comparison of the QB intervention [15]. A concluding step is a sensitivity analysis to test the effect of variables in this model where uncertainty is a concern [16].
2.1. Injury Severity Scales
The task in this study is to address the social cost of ATV-related nonfatal injuries in addition to fatal injuries and the potential benefits of an intervention. An Abbreviated Injury Scale (AIS) provides a relationship between fatal and nonfatal injuries and associated costs. The cost of nonfatal injuries can be pegged against the cost of ATV-related fatal injuries. The AIS scale was derived from motor vehicle data, the limitations of which will be addressed later. A search for AIS data used in studies of ATV-related nonfatal injuries found two studies that used another injury scale, the Injury Severity Score (ISS), which is derived from the AIS scale. Through a process of relating these two studies back to the AIS, one of which has specific AIS data, relationships can be established to estimate the nonfatal and fatal injuries averted and associated benefits for the prevention of these injuries.
First, a determination is made of the severity of injuries associated with ATV incidents based on the AIS from Blincoe et al. [17]. This scale has been extended to trauma in general. Its value in the current study is to examine the cost of nonfatal injuries in addition to the cost of fatal injuries regarding ATV-related incident trauma [18]. The AIS is assigned in the trauma centers to reflect anatomically-based injury severity with six rankings: (1) minor; (2) moderate; (3) serious; (4) severe; (5) critical; and (6) not survivable (dead) [19]. This scoring reflects the threat to life. A “0” is used for property damage without personal injury and is not used in this study. The score of 0 through 6 is applied to six separate body parts (head, face, chest, abdomen, extremities, and external (i.e., integumentary system)). The AIS ranks severity against the potential of survival [20]. When multiple scores are assigned, the highest score for any of the separate body parts is assigned the Maximum Abbreviated Injury Scale (MAIS).
The Blincoe et al. study was conducted in 2014 using 2010 data. It updated an earlier study that used 2000 data, and it modified the earlier approach to include intangible costs such as pain and suffering. The per-person cost figures include medical and emergency service expenses, losses of market and household productivity, insurance administration expenses, and workplace and legal costs. The resulting cost in 2015 dollars is US$1,524,818 per fatality as adjusted for inflation for all motor vehicle incidents. These costs exclude property damage and traffic congestion costs. The cost for the subset of motorcycle-related deaths in that report is US$1,505,993 per fatality in 2015 dollars [17]. Table 1 shows how the MAIS associates injury severity with the social cost of the injury. The dollar figures shown in the table are based on a classic analysis set in the year 2010 in the United States. The dollar figures have been adjusted for inflation to 2015 using the US Consumer Price Index (CPI). While studies have been conducted to estimate the cost of ATV-related fatalities or compensation costs [21,22,23,24], the broader cost across society of nonfatal injuries associated with ATV incidents has yet to be addressed. The cost model used in this analysis thus depends on a study that associates fatal with nonfatal injuries from motor vehicle crashes as shown in Table 1 [17].
The second scale is the ISS, which provides an opportunity to differentiate serious (3–5 AIS) from non-serious injuries (1–2 AIS). It is based upon injuries across the six different body parts, which uses the sum of squares of the three highest AIS scores by body part for each case [25]. The ISS score is important in order to separate non-serious from serious injuries in the analysis. Serious injuries have an ISS score of 15 or higher.
Additional studies used ISS scores to evaluate the severity of ATV-related injuries. As an example, Krause et al. conducted a study with a focus on ATV-related serious injuries with an ISS score of 15 or higher [26]. The study was conducted in Alberta, Canada, for the 10-year period of 1 April 1998–31 March 2008, during which 4117 ATV-related trauma hospital admissions were recorded. They collected data on 429 serious trauma cases (i.e., ISS ≥ 15) for riders 18 years of age and older and 64 medical examiner (ME) death records. From both sources, 79 deaths were recorded: 54% at the scene, 19% at the trauma center, and 27% at rural hospitals. These data are useful for developing probabilities of different serious ATV-related injury severity levels (ISS ≥ 15) for AIS 3, 4, and 5, which were presented in their study.
Wood et al. conducted a study of ATV-related injuries in New Zealand that covered the four-year period of February 2007–March 2011 [27]. The study found that 64.3% of patients with ATV-related injuries had an ISS less than 10, 8.9% had scores in the range of 10–15, and 26.7% had scores greater than 15. This study is used to differentiate serious injuries from non-serious injuries and, within non-serious injuries, to differentiate moderate from minor injuries as well.
The use of AIS and its derivative, ISS, is consistent across these two cohorts. The primary difference between the two studies is the exclusion of children with ages less than 18 years from the Canadian study, whereas in New Zealand children were included in the study population.
Nonetheless, the profiles of serious injuries with ISS > 15 for both studies are similar at 37% and 39% for head and face injuries; 49% and 38% (plus 7% for respiratory injuries) for chest, spine, and abdomen injuries; and 14% and 15% for extremity injuries for the Canadian [26] and New Zealand [27] studies, respectively. The “other” category is not listed.
2.2. Decision Analysis
The decision analysis makes use of a decision tree as shown in Figure 3 and Figure 4. This tool provides a way to compare the potential outcome in averting a range of injuries with an intervention between the choices “OB Installed” and “No Change”. The results of this analysis can show the potential lives saved and injuries averted as a result of the intervention. The analysis depends upon probabilities drawn from the literature, and in areas of uncertainty, sensitivity analyses will be used to better understand the validity of the results, which will be described later.
The probabilities are calculated from studies with available information about nonfatal injuries for which data are scarce. Thus, data are derived from the United States for relative proportions of overturn-related fatal and nonfatal injuries [17], from New Zealand for differentiating serious from non-serious injuries and differentiating non-serious injuries into two different AIS codes [27], and from Canada for differentiating serious injuries into three different AIS codes [28]. The injury coding is common across all three countries. Moreover, the machines in use in the three countries have common designs and manufacturers for ATVs. ATV-related injuries are a serious problem in all three countries, and overturns are a dominant cause of injuries in all three as well. Indeed, the transnational interpretation of the effectiveness of ROPS on tractors has built a precedent for probability generation for this study [28].
In the tree, the probabilities are multiplied across each branch to its terminal node to determine the overall probability of an outcome by level of severity. All of the probabilities in the decision tree are summarized in Table 2. By subtracting like outcomes of the “OB Installed” branch from the “No-Change” branch (e.g., fatal injury), the potential impact of the intervention on injury reduction can be calculated.
The sum of the probabilities across each branch is 1.0 as shown in Table 2. The decision progresses through several chance branches as described below. The sources of the probabilities are shown in Table 2.
2.2.1. Injury versus No Injury Branch
The “QB Installed” and “No Change” branches separately lead to two branches, one that presents the probability of an overturn-related injury and the other the probability of no injury in the event of an overturn. CPSC nonfatal injury data are based on emergency department (ED) reports reports as adjusted with omitted medical treatment at other clinics [29]. The probability of an injury in the event of an ATV overturn is a combination of 1490 nonfatal (ED only) and 8.3 fatal injuries per 100,000 ATVs [30], and they are combined with the percentage of these injuries associated with ATV overturns at 60.3% and 60.6%, respectively, with the ED proportions increased by medical facilities omitted by 60.4% of the ED data [29]. The resulting probability for injuries per ATV associated with an overturn and the “No Change” choice, Pr_I′, is
where Pr_I’ is the annual probability of overturn-related injuries per ATV, F is the annual ATV-related fatalities per 100,000 ATVs, FO is the percentage of overturn-related ATV-related fatal injuries, N is the annual ATV-related emergency department (ED) injuries treated per 100,000 ATVs, C is the percentage of ATV-related injuries treated in non-ED clinics, and NO is the percentage of overturn-related ATV-related nonfatal injuries. The probability of an overturn-related injury is Pr_I’ = 0.014462, and the corresponding probability of no injury is 1-Pr_I’ = 0.985538 per year. In the base case, when the QB is fitted onto the ATV at an effectiveness rate of 40%, the probability for injuries per ATV in the “QB installed” choice, Pr_I, is
where Pr_I is the annual probability of overturn-related injuries per QB-fitted ATV, and E is the effectiveness of the QB to prevent ATV overturn-related injuries. The probability of an overturn-related injury is Pr_I = 0.008677, and the corresponding probability of no injury is 1-Pr_I = 0.991323 per year.
Pr_I′ = ((F × FO) + ((N + (N × C)) × NO)/100,000
Pr_I′ = ((8.3 × 0.606) + ((1490 + (1490 × 0.604)) × 0.603)/100,000 = 0.014462
Pr_I = Pr_I’ × (1-E)
Pr_I = Pr_I’ × (1–0.40) = 0.008677
These probabilities are multiplied against the probabilities in the remaining branches to the terminal node, which indicates the probability of injuries per ATV by the respective injury severity MAIS levels. The probabilities in the remaining branches are identical between each choice.
2.2.2. Fatal versus Nonfatal Branch
The next pair of branches separates the probability of death associated with an overturn, Pr_D = 0.003478, from that of the probability of nonfatal injuries associated with an ATV overturn, 1-P_D = 0.996522, as shown in Figure 3. The branch is the same in both choice branches. The fatal injury probabilities reach terminal nodes at this juncture (AIS = 6).
2.2.3. Serious versus Not Serious Branch
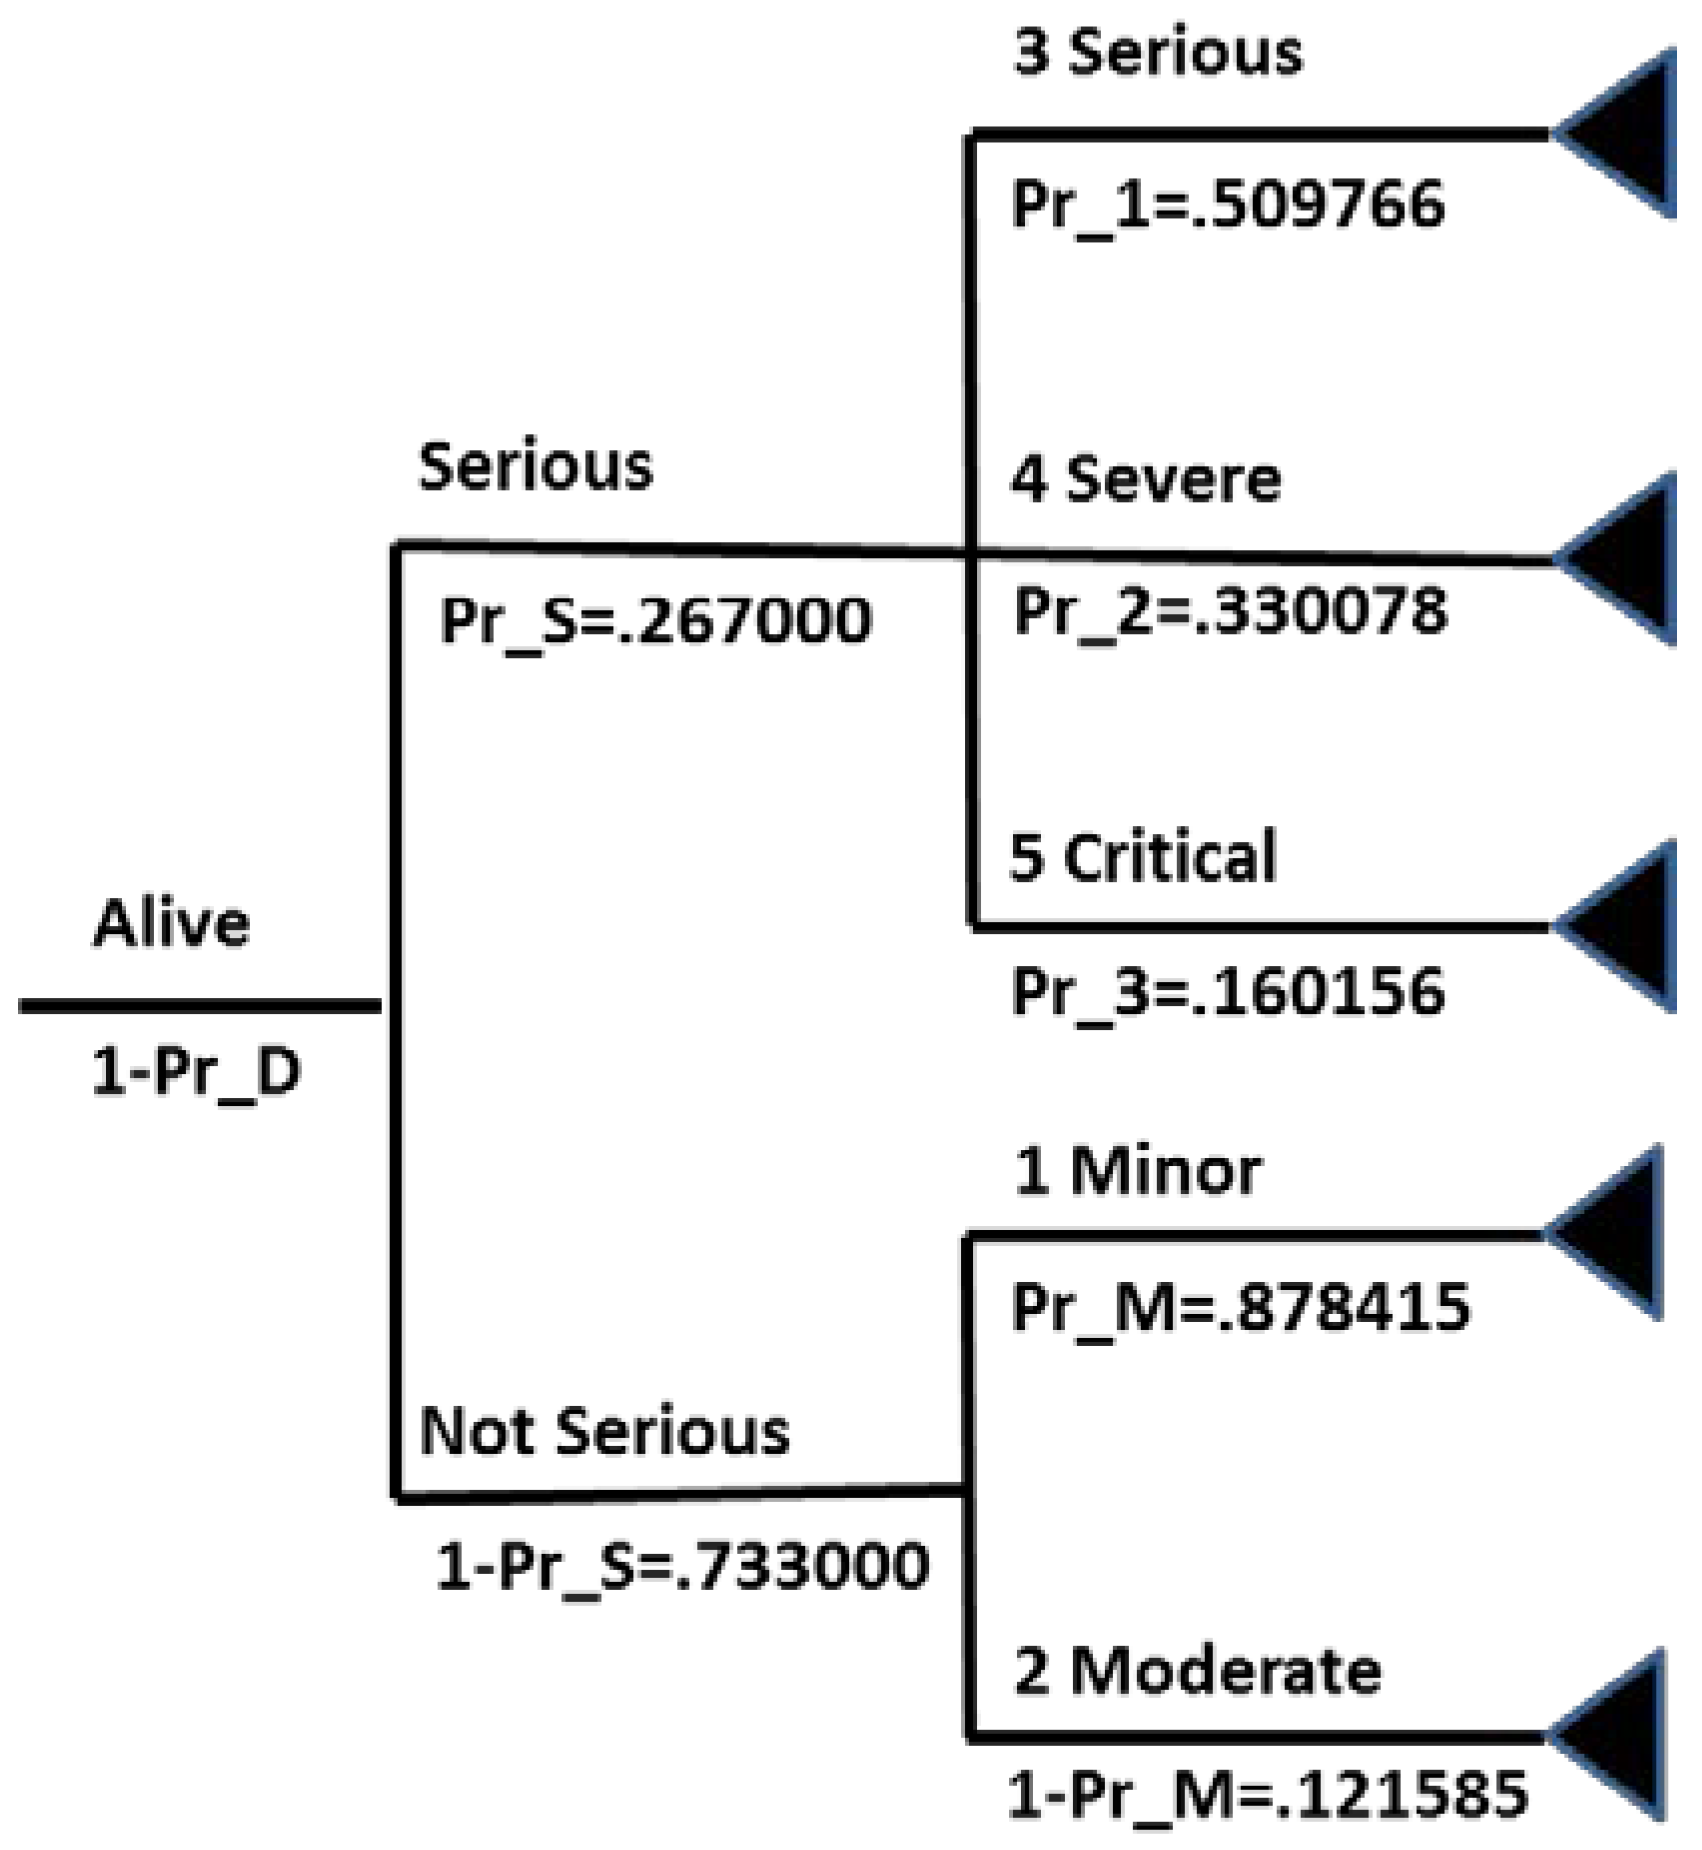
The next branch relates to nonfatal injuries and separates the probability of serious (ISS ≥ 15) from non-serious (ISS < 15) injuries. See the sub-tree in Figure 4. Wood et al. conducted a study of ATV-related injuries in New Zealand that covered the period February 2007–March 2011 [27]. The study used the ISS as a marker that resulted in an ISS score in which 26.7% were at a score greater than 15. This study provides insight to distinguish serious injuries from non-serious injuries with the assumption that serious injuries with an ISS score >15 include AIS 3–5 [17]. The probability of serious injury in the event of an overturn is Pr_S = 0.267000 and of a non-serious injury is 1-Pr_S = 0.733000.
2.2.4. Serious Branch → Serious, Severe, and Critical Branches
One arm of the next branch regards serious injuries and covers the three-point range of serious through critical scores (MAIS = 3–5) based upon an ISS > 15, leading to three branches with individual terminal nodes: serious, severe, and critical injuries based on the Krause et al. data [26]. The three branches have probabilities as follows: serious injuries, Pr_1 = 0.509766; severe injuries, Pr_2 = 0.330078; and critical injuries, Pr_3 = 0.160156 (see Figure 4).
2.2.5. Not Serious Branch → Minor and Moderate Branches
The other arm of the final branch relates to non-serious injuries and is based upon scores of ISS < 15, and is differentiated into minor and moderate severity levels (AIS = 1–2) with two individual terminal nodes for each choice branch. The Wood et al. study also informed this study in separating minor from moderate injuries with ISS as a marker that resulted in 87.8% with an ISS score less than 10 and 12.2% with an ISS score range of 10–15, respectively [27]. Thus, the probability in this branch of minor injury is Pr_M = 0.878415 and of moderate injury is 1-Pr_M = 0.121585 (see Figure 4).
The outcomes of the decision analysis are used in the next section to calculate the economic benefit of the intervention (i.e., QB Installed).
2.3. Benefit Analysis
For benefit analysis, economics is used to determine the value of the intervention. This value is assessed by addressing the cost of the intervention and the social economic savings that result from the intervention. The analysis considers three temporal issues: inflation, the analytic horizon, and discounting the future value of the benefit to the current time [31].
First, past dollar values are corrected for inflation, which was previously used in this analysis with the use of the CPI. A second temporal consideration is the analytic horizon, T, based upon the time period that the QB is assumed to be fitted on an ATV. The CPSC has conducted exposure studies that address the period of purchase of ATVs, but these studies do not report the year of manufacture of the units [32]. One insurer places the depreciable life for an ATV at 10 years [33]; thus, the analytic horizon of 10 years is used to represent the time period of protection on a machine.
While the intervention cost occurs one time at the beginning of the analytic horizon, the third temporal consideration is to discount the out-year costs (e.g., benefits of injuries averted) to society. In this study, the out-year costs and injuries averted are discounted at a rate of 3% per year compounded over the 10-year period. This social discount rate is the same as the rate used by Blincoe et al. and by Helmkamp et al. to value a life in their studies [17,21]. Discounting is traditionally used in present value calculations. Discounting is used because people value their money as worth more today than in the future although the rate can vary greatly between individuals. Economists also recommend discounting the future value of life as well, which is much more controversial. Nonetheless, Gold et al. recommended this course of action, which is followed in this analysis [34].
The formula used to calculate the relationship of the cost of the QB to its social benefit is shown below [35].
Co is the retrofit cost of the QB at time “0” (now), and Bt is the expected benefit in year “t” after the retrofit. The benefits, Bt, are discounted over time “T” (the analytic horizon) at the discount rate “i”. Co is a one-time cost, while the benefits accrue over the analytic horizon into the future for a period that the intervention is in place. The benefits include all social costs of deaths and injuries averted by the intervention. The measure of costs and benefits is in US dollars.
Helmkamp et al. determined in their study that the average cost for each ATV-related fatality was US$947,658 in 2015 dollars [21]. This figure is used to peg against the per person fatality cost in Table 1 to generate costs proportional to each severity level of ATV-related nonfatal injuries. The benefit was calculated by multiplying these cost figures against corresponding outcomes from the decision analysis and adding the results to determine the benefit of the intervention.
The results are compared to the purchase cost of the QB, C0. This cost can vary downward with respect to quantity purchased or when used as standard equipment on ATVs. The cost can vary upward regarding shipment and handling fees, taxes, and time to install the QB. However, these costs are much less than the social costs of the deaths and injuries studied. Thus, the intervention cost used is the posted price of the QB at US$478 corrected at an August 2015 exchange rate of Australia to United States dollars of 1 to 0.75 [36].
2.4. Sensitivity Analyses
Sensitivity analyses are conducted to evaluate the variability in parameter value changes that affects the outcomes so as to better understand uncertainties in the analysis relative to the base case as discussed above [14]. Sensitivity analyses were conducted against five different scenarios as follows.
- One-year analytic horizon: This is an alternative to the 10-year analytic horizon.
- Emergency department cases only: This is an alternative to the addition of injuries treated in physician offices and clinics [2].
- QB = 12% effective: This is an alternative below the 40% QB effectiveness in preventing crush and collision-related injuries [9].
- QB = 80% effective: This is an alternative above the 40% QB effectiveness in preventing crush-related injuries in ATV overturns [5].
- 0% discount rate: This is an alternative to the 3% discount rate used in the economic analysis.
While the analytic horizon chosen for the base case was 10 years, an alternative period in the extreme at one year was used to observe the analytic horizon effect upon the benefits versus the cost in the analysis. A second sensitivity analysis regards the CPSC reports of injuries from EDs across the United States. The base case includes injuries that do not reach the ED and that includes patients treated in physician offices and at clinics in which these patients were added to the base case at the omission rate of 60.4% [29]. A sensitivity analysis was conducted to examine the effect of the addition of values in this parameter on the outcome by considering only the ED treatment cases.
Another area of complexity is the effectiveness of the QB to prevent crush-related injuries or asphyxia as a result of an overturn. In the base case, we used the estimate of 40% effectiveness. The aforementioned percentages, 12% and 80%, were tested as alternative figures.
Another analysis was performed by holding the discount rate at 0% to observe the effect of the discounting on the benefit of the intervention as compared to the base case of 3%.
3. Results
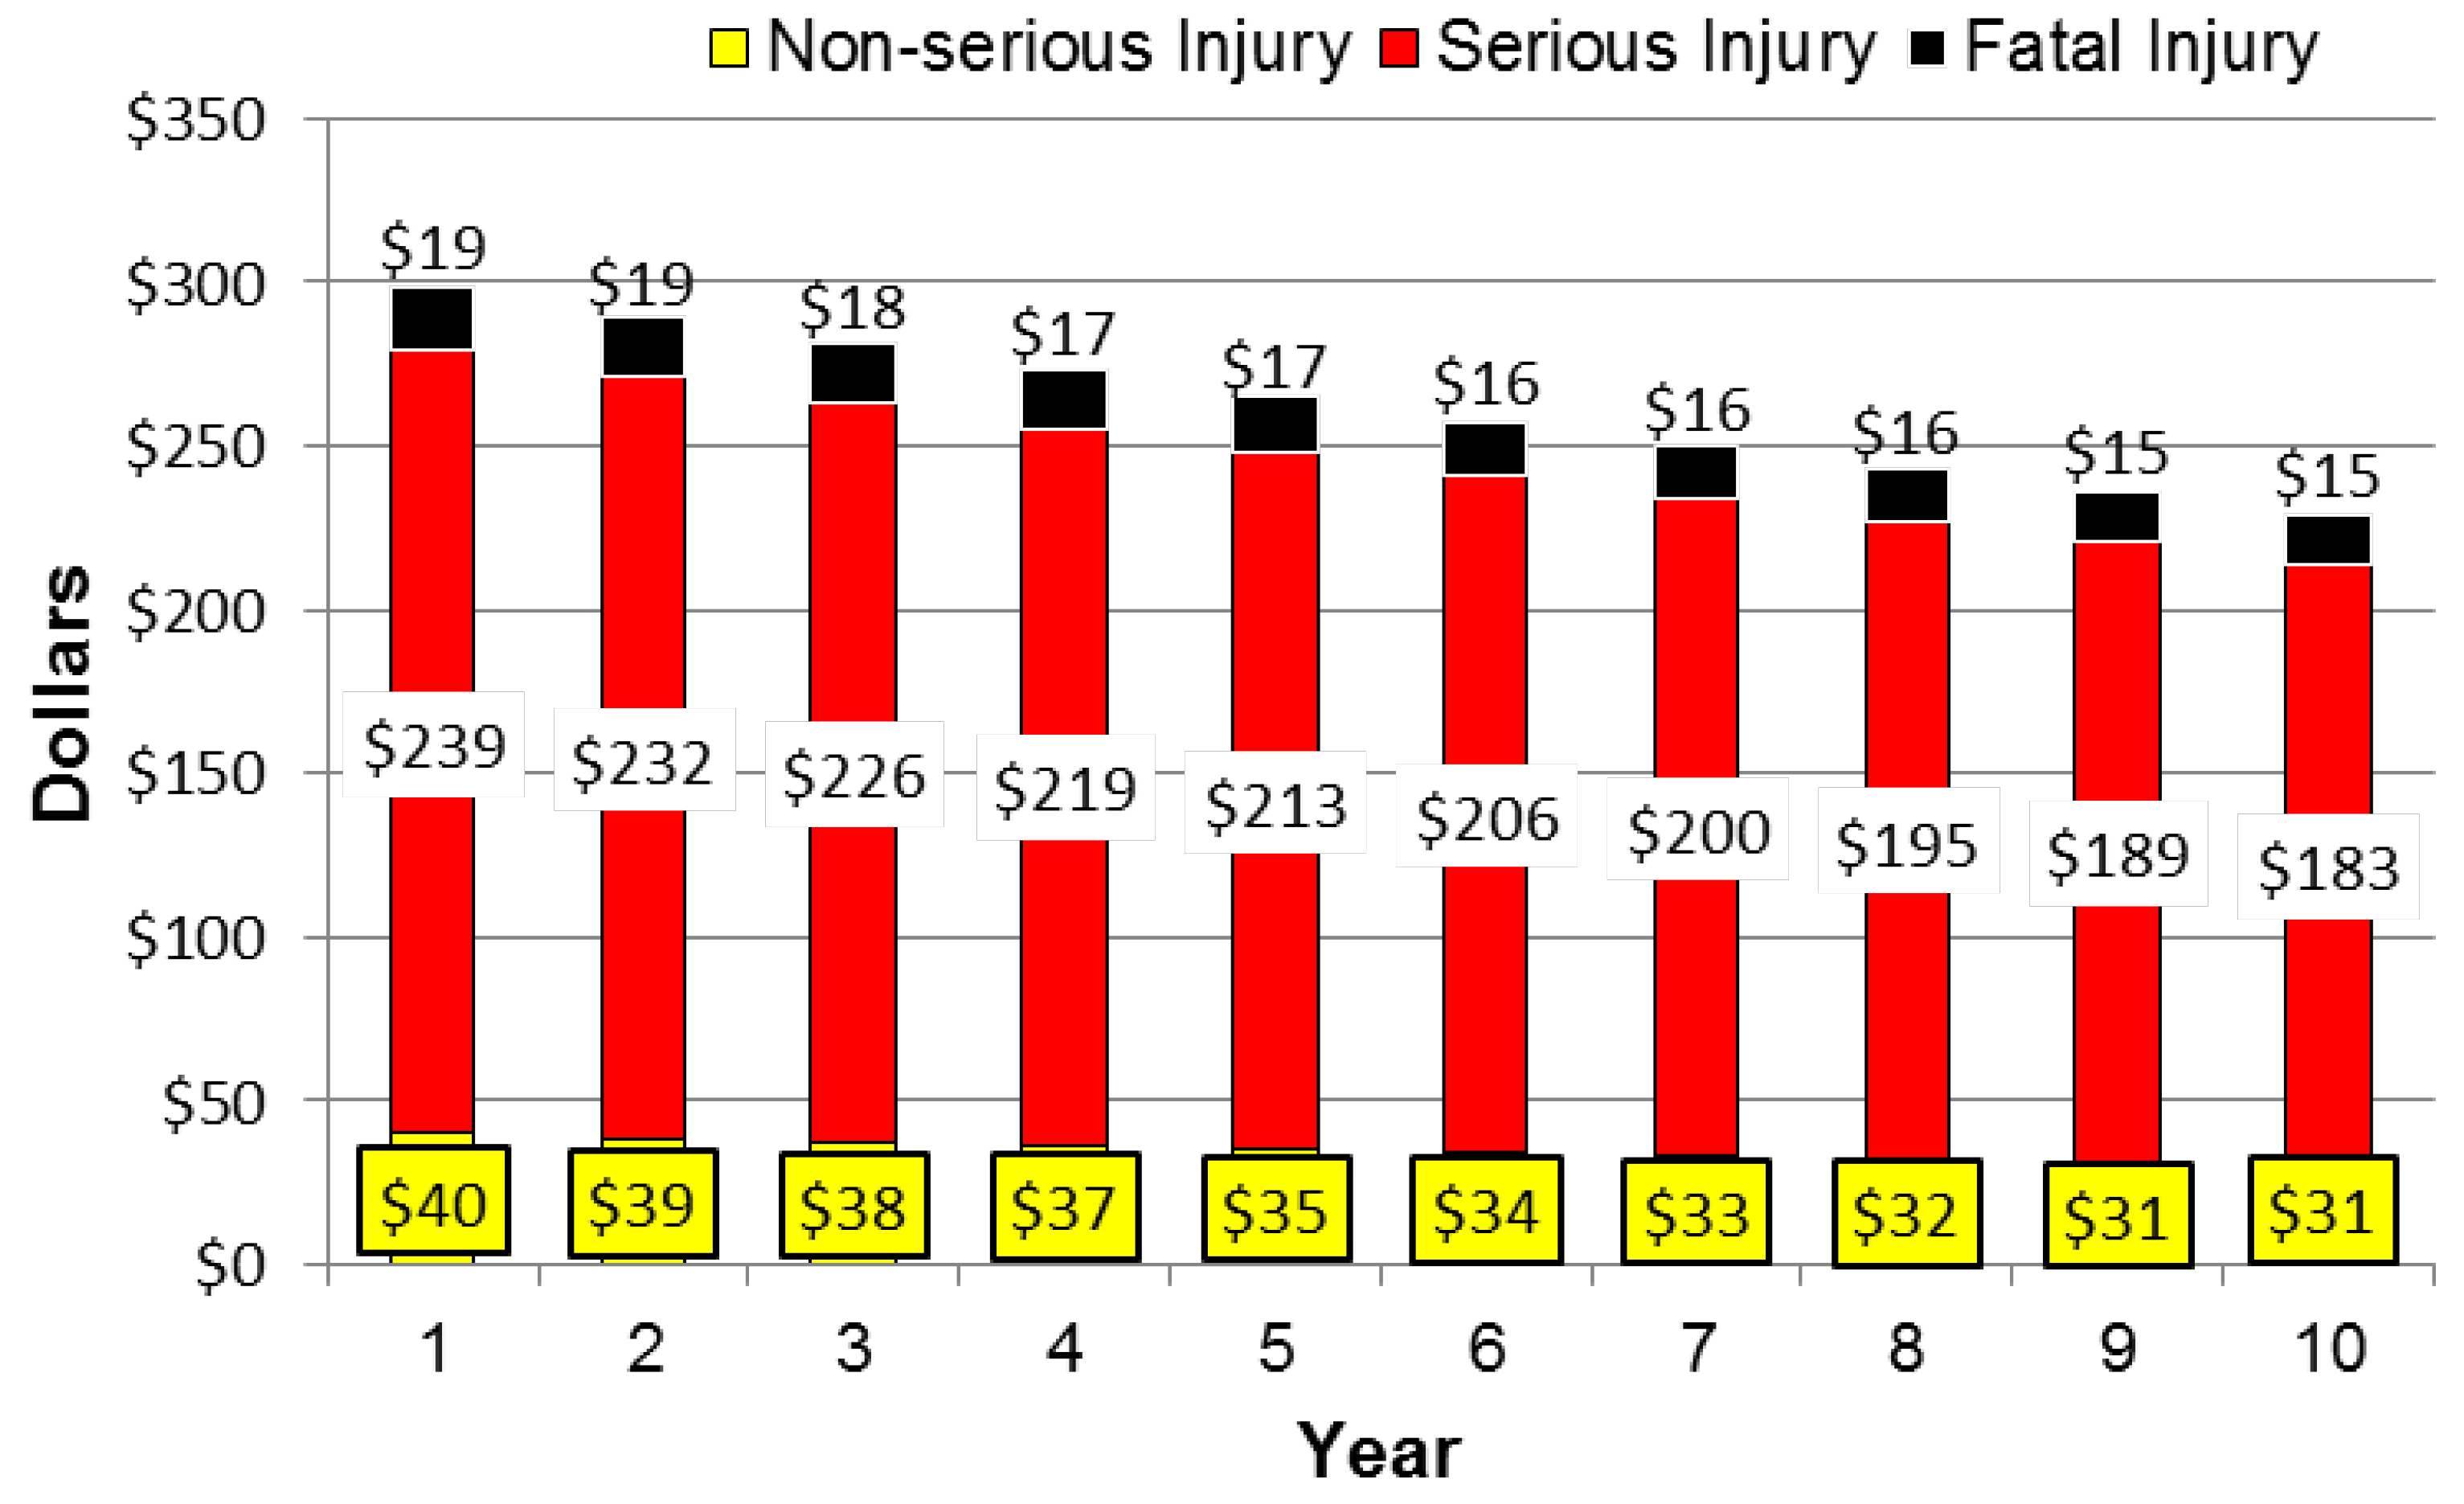
As shown in Table 3, injuries averted by fitting 100,000 ATVs with the QB totaled 5082 injuries over a 10-year period, which included 17.7 deaths (0.3%), 1352 serious injuries (26.6%), and 3712 non-serious injuries (73.0%). At 40% QB effectiveness, the social benefits per ATV for the same period totaled US$3,943 per ATV and included US$168 for deaths averted (0.4%), US$3,376 for serious injuries averted (85.6%), and US$399 for non-serious injuries averted (10.1%). The benefit for averting serious injuries dominates the cost savings to society. Fatal injuries are low as a percentage of injuries. Fatalities are rare events, and medical care is typically close at hand in the United States from where the data were drawn. In addition, Figure 5 shows the annual economic benefits discounted at 3% per annum over the 10-year analytical horizon by the three categories of injury: fatal, serious, and non-serious injury. From a societal perspective, the investment pays off at an 8:1 return on investment over the 10-year analytic horizon.
Table 3 also shows the results of the sensitivity analyses. The one-year analytic horizon rather than a 10-year horizon shows 89% fewer injuries averted and reduced economic benefit of 89%, as expected when the analytical timeframe is reduced by 90%. In this scenario, the economic benefits approach the purchase cost (CO) of the QB of US$478, falling short by $29. The break-even point would be reached early in year 2.
In the sensitivity analysis that removed the addition of physician and clinic cases used in the base case showed a 38% potential reduction in injuries and a 36% associated reduction in economic benefits in the analysis. Nonetheless, the benefits still exceed the investment.
All remaining sensitivity analyses likewise support an early investment in effective crush prevention that includes fitting QBs on ATVs with an assumed effectiveness at 12%. This percentage included the negative impact of potential rider injury due to the QB based on computer simulations as described earlier in this article. The 80% effectiveness rate can potentially double the injury reduction impact and the benefit of QB use. When the discount rate is changed to 0%, both the number of injuries averted and the associated economic savings increased by 14%. This percentage is notable, since—when injuries are not discounted—the actual injuries averted over 10 years increase from 5082 to 5785 cases.
4. Limitations
A number of assumptions were made in this analysis. Most assumptions are conservative regarding potential injuries averted and associated economic values. Table 4 summarizes these limitations. One concern raised by some investigators is that the QB could cause impact injuries as a side effect in both overturn and non-overturn events. Regarding this issue, the 12% and 40% QB effectiveness percentages factored in these potential injuries.
5. Discussion
This analysis showed potential benefits exceeded costs in all scenarios examined with the exception of the benefits in year 1. Nonetheless, in year 1 the cost exceeded the benefit by $29, and the breakeven point for the investment would be reached early in year 2. While using the AIS classification to calculate severity levels of injuries and their associated costs, the path to discovering useful studies was complex. Moreover, the ISS coding is more prevalent in studies of severity for which cost schedules are not apparent. Nonetheless, ISS coding is based on AIS codes, thus the classifications are available. When injury studies are conducted, details regarding AIS classification would be helpful for future benefit analyses. AIS coding allows calculations of the benefits of nonfatal injury reduction in addition to fatality reduction, and the results in economic studies are potentially enormous, as shown in Figure 5. While in early development, AIS classifications have also informed engineering studies of CPD-related incidents in computer simulations and anthropomorphic dummy experiments [37,38].
As shown in Figure 5, consideration of nonfatal injuries has a significant effect on the potential benefits of the intervention of safety provided by the QB. Missing from this analysis is a potentially great number of minor injuries since they are rarely seen in emergency rooms and trauma care centers. Thus, more investigations in this area beyond serious injuries are warranted. It is apparent in this study that the most reliable data is in regards to fatalities, which were used as markers for this analysis.
ATV use differs between nations. In the United States, more than half of all ATV-related fatalities occur on roadways [4], a place for which they are ill-designed. Paved roads are the most hazardous [39]. ATVs are also prevalent on roads in Sweden [40]. Traffic laws may be needed to limit public roadway travel with ATVs, although the agriculture sector uses these roads to travel between farms. In Australia, the primary use of ATVs is in agriculture, where rural roads are prevalent, and much of ATV driving occurs on the farm and ranch [37]. In New Zealand, ATVs are used on farms, but they also have a heavy use by employees in other industries as well [27].
This analysis points out the many uncertainties in public policy regarding equipping ATVs with CPDs and more particularly QBs. More information is needed regarding the real-world effectiveness of attaching these devices on ATVs. Detailed information is important for conducting simulations, and systematic studies are needed that demonstrate the effectiveness of these devices in preventing injuries in the event of an ATV overturn. Since there are many of these devices in use in Australia and New Zealand, opportunities exist for comparing incidents regarding the effectiveness of the devices on ATVs with machines that lack the protection. These comparisons need to include collisions as well as overturns to determine the net effect of the CPDs and QBs.
6. Conclusions
This study provides the results of an analysis of ATV-related injuries across a range of severity from minor injuries to death. It found that at 40% effectiveness, the QB can avert 5082 injuries per 100,000 ATVs (17.7 fatal, 1352 serious, and 3712 non-serious injuries) over a 10-year period. The social benefit of injuries averted over the 10-year period discounted at 3% per year was found to total US$3,943 per ATV. The social benefit exceeded the purchase cost of US$478 per QB by a factor of eight over the 10-year period. Indeed, the social benefit by the second year of fitting a QB on an ATV exceeded the QB cost. This study demonstrates the need to include nonfatal injuries in cost studies regarding ATVs. Furthermore, systematic studies are needed to better understand the effectiveness of the QB and, more generally, CPDs.
Acknowledgments
The author is grateful to the reviewers of this manuscript for the many constructive comments provided and to a colleague, Gerald Kersey, for his edit of the final version of the manuscript.
Author Contributions
The author used existing materials to construct a model to evaluate the cost and benefit of fitting all-terrain vehicles with the Quadbar. The author used his knowledge and published manuscripts regarding overturn protection and cost analysis to inform his analysis.
Conflicts of Interest
The author declares no conflict of interest.
References
- Teutsch, S.M.; Harris, J.R. Introduction. In Prevention Effectiveness: A Guide to Decision Analysis and Economic Evaluation; Haddix, A.C., Teutsch, S.M., Corso, P.S., Eds.; Oxford University Press: New York, NY, USA, 2003; pp. 1–10. [Google Scholar]
- Topping, J.; Garland, S. 2013 Annual Report of A TV-Related Deaths and Injuries; U.S. Consumer Product Safety Commission: Bethesda, MD, USA, 2015.
- Shults, R.; West, B.A.; Rudd, R.A.; Helmkamp, J.C. All-terrain vehicle–related nonfatal injuries among young riders in the United States, 2001–2010. Pediatrics 2013, 132, 282–289. [Google Scholar] [CrossRef] [PubMed]
- Garland, S. National Estimates of Victim, Driver, and Incident Characteristics for ATV-Related, Emergency Department Treated Injuries in the United States from January 2010–August 2010 Victim, Driver, and Incident Characteristics for ATV-Related Fatalities from 2005 through 2007. In Consumer Product Safety Commission; Directorate for Epidemiology, Division of Hazard Analysis: Bethesda, MD, USA, 2014. [Google Scholar]
- Lambert, J. Public Discussion Paper; Review of Design and Engineering Control for Improving Quad Bike Safety. In QB028—John Lambert & Associates Pty; 28 September 2012. Available online: http://www.safeworkaustralia.gov.au/sites/SWA/whs-information/agriculture/quad-watch/Documents/Discussion-paper-PC/Public-submissions-L/QB028-John_Lambert_and_Associates_Pty_Ltd.PDF (accessed on 3 August 2015). [Google Scholar]
- Staight, K. On the Safe Side. ABC Landline. 14 August 2015. Available online: http://www.abc.net.au/landline/content/2015/s4280755.htm (accessed on 18 August 2015).
- Lower, T. Professor and Director of the Centre for Agricultural Health and Safety at the University of Sydney, Australia. In Inquest into Nine (9) Deaths Caused by Quad Bike Accidents; Deputy State Coroner, Office of the State Coroner Findings of Inquest: Brisbane, Australia, 2015; pp. 31–32. Available online: http://www.courts.qld.gov.au/__data/assets/pdf_file/0018/432306/cif-quadbikeaccidents-20150803.pdf (accessed on 24 October 2015). [Google Scholar]
- Robertson, D. Inquest into Nine (9) Deaths Caused by Quad Bike Accidents; Deputy State Coroner, Office of the State Coroner Findings of Inquest: Brisbane, Australia, 2015; p. 31. Available online: http://www.courts.qld.gov.au/__data/assets/pdf_file/0018/432306/cif-quadbikeaccidents-20150803.pdf (accessed on 24 October 2015).
- Anderson, R. Associate Professor Anderson’s Review of DRI’s 2012 and 2014 Computer Simulation Reports of the Quadbar. In Inquest into Nine (9) Deaths Caused by Quad Bike Accidents; Deputy State Coroner, Office of the State Coroner Findings of Inquest: Brisbane, Australia, 2015. Available online: http://www.courts.qld.gov.au/__data/assets/pdf_file/0018/432306/cif-quadbikeaccidents-20150803.pdf (accessed on 24 October 2015). [Google Scholar]
- Helmkamp, J. Vehicle Rollover Protection. In Presented at the US Consumer Product Safety Commission ATV Safety Summit, Bethesda, USA, 11–12 October 2012; Available online: http://www.slideshare.net/USCPSC/2-rollover-protection-helmkamp (accessed on 18 August 2015).
- Lambert, J. Real Life Data Proves Quad Bars Have Saved Many People from Trauma; Lambert, J., Ed.; John Lambert & Associates: Wandana Heights, Australia, 2015. [Google Scholar]
- Myers, M.L.; Pana-Cryan, R. Prevention effectiveness of roll-over protective structures part II: Decision analysis. J. Agric. Saf. Health 2000, 6, 41–55. [Google Scholar] [CrossRef] [PubMed]
- Grzebieta, R.; Rechnitzer, G.; McIntosh, A.; Mitchell, R.; Patton, D.; Simmons, K. Investigation and Analysis of Quad Bike and Side by Side Vehicle (SSV) Fatalities and Injuries (Supplemental Report). In The Quad Bike Performance Project; University of New South Wales, The Workcover Authority of New South Wales: Gosford, Australia, 2015. Available online: http://www.tars.unsw.edu.au/research/Current/Quad-Bike_Safety/Reports/Supplemental_Report_Exam&Analysis_Fatals&Injuries_Jan-2015.pdf (accessed on 2 February 2016). [Google Scholar]
- Goldie, S.F.; Corso, P.S. Decision analysis. In Prevention Effectiveness: A Guide to Decision Analysis and Economic Evaluation; Haddix, A.C., Teutsch, S.M., Corso, P.S., Eds.; Oxford University Press: New York, NY, USA, 2003; pp. 103–126. [Google Scholar]
- Messonnier, M.; Meltzer, M. Cost-Benefit Analysis. In Prevention Effectiveness; Haddix, A.C., Teutsch, S.M., Corso, P.S., Eds.; Oxford University Press: New York, NY, USA, 2003; pp. 127–155. [Google Scholar]
- Gift, T.L.; Haddix, A.C.; Corso, P.S. Cost-effectiveness Analysis. In Prevention Effectiveness: A Guide to Decision Analysis and Economic Evaluation; Haddix, A.C., Teutsch, S.M., Corso, P.S., Eds.; Oxford University Press: New York, NY, USA, 2003; pp. 156–177. [Google Scholar]
- Blincoe, L.J.; Miller, T.R.; Zaloshnja, E.; Lawrence, B.A. The Economic and Societal Impact of Motor Vehicle Crashes, 2010 (Revised); (Report No. DOT HS 812 013); National Highway Traffic Safety Administration: Washington, DC, USA, 2015.
- Zaloshnja, E.; Miller, T.; Romano, E.; Spicer, R. Crash costs by body part injured, fracture involvement, and threat-to-life, United States, 2000. Accid. Anal. Prev. 2004, 36, 415–427. [Google Scholar] [CrossRef]
- Copes, W.S.; Sacco, W.J.; Champion, H.R.; Bain, L.W. Progress in characterizing anatomic injury. In Proceedings of the 33rd Annual Meeting of the Association for the Advancement of Automotive Medicine, Baltimore, MA, USA, 2–4 October 1995; pp. 205–218.
- Ayyub, B.M. Risk Analysis in Engineering and Economics; CRC Press: New York, NY, USA, 2014; pp. 382–383. [Google Scholar]
- Helmkamp, J.C.; Biddle, E.; Marsh, S.M.; Campbell, C.R. The economic burden of all-terrain vehicle related adult deaths in the U.S. workplace, 2003–2006. J. Agric. Saf. Health 2012, 18, 233–243. [Google Scholar] [CrossRef] [PubMed]
- Helmkamp, J.C.; Aitken, M.E.; Lawrence, B.A. ATV and bicycle deaths and associated costs in the United States, 2000–2005. Public Health Rep. 2009, 124, 409–418. [Google Scholar] [PubMed]
- Lower, T.; Pollock, K.; Herde, E. Australian quad bike fatalities: what is the economic cost? Aust. N.Z. J. Public Health 2013, 37, 173–177. [Google Scholar] [CrossRef] [PubMed]
- Bentley, T.; Macky, K.; Edwards, J. Injuries to New Zealanders Participating in Adventure Tourism and Adventure Sports: An Analysis of Accident Claims Corporation (ACC) claims. N.Z. Med. J. 2006, 119, 9. Available online: http://nzma.org.nz/journal/119-124/2359/ (accessed on 8 August 2015). [Google Scholar]
- Baker, S.P.; O'Neill, B.; Haddon, W.; Long, W.B. The Injury Severity Score: A method for describing patients with multiple injuries and evaluating emergency care. J. Trauma 1974, 14, 187–196. [Google Scholar] [CrossRef] [PubMed]
- Krause, E.M.; Dyer, D.M.; Laupland, K.B.; Buckley, R. Ten years of all-terrain vehicle injury, mortality, and health care costs. J. Trauma 2010, 69, 1338–1343. [Google Scholar] [CrossRef] [PubMed]
- Wood, A.; Duijff, A.W.; Christey, G.R. Quad bike injuries in Waikato, New Zealand: An institutional review from 2007–2011. ANZ J. Surg. 2013, 83, 206–210. [Google Scholar] [CrossRef] [PubMed]
- Reynolds, S.J.; Groves, W. Effectiveness of roll-over protective structures in reducing farm tractor fatalities. Am. J. Prev. Med. 2000, 18, 63–69. [Google Scholar] [CrossRef]
- Miller, T.R.; Lawrence, B.A.; Jensen, A.F.; Waehrer, G.M.; Spicer, R.S.; Lestina, D.C.; Cohen, M.A. The Consumer Product Safety Commission’s Revised Injury Cost Model. December 2000. Available online: https://www.cpsc.gov/PageFiles/100269/costmodept1.PDF (accessed on 12 August 2015). [Google Scholar]
- Rodgers, G.B.; Adler, P. Risk factors for all-terrain vehicle injuries: A national case-control study. Am. J. Epidemiol. 2001, 153, 1112–1118. [Google Scholar] [CrossRef] [PubMed]
- Corso, P.S.; Haddix, A.C. Time Effects. In Prevention Effectiveness: A Guide to Decision Analysis and Economic Evaluation; Haddix, A.C., Teutsch, S.M., Corso, P.S., Eds.; Oxford University Press: New York, NY, USA, 2003; pp. 92–102. [Google Scholar]
- Consumer Product Safety Commission. All-Terrain Vehicle Exposure, Injury, Death, and Risk Studies; Consumer Product Safety Commission: Bethesda, MD, USA, 1998.
- Recreational Motor Vehicles includes ATV. Depreciation. pp. 13–14, Insurance Non-Depreciation Repairs at 10-years. Available online: http://www.nstarco.com/UserFiles/File/agentmanual/sd/AllStatesInlandMarine.pdf (accessed on 29 July 2015).
- Gold, M.R.; Siegel, J.E.; Russell, L.B.; Weinstein, M.C. (Eds.) Cost-Effectiveness in Health and Medicine: Report of the Panel on Cost-Effectiveness in Health and Medicine; Oxford University Press: New York, NY, USA, 1996.
- Stephens, W.B.; Ibendahl, G.A.; Myers, M.L.; Cole, H.P. Risk analysis of tractor overturns on catfish farms. J. Agromed. 2010, 15, 405–411. [Google Scholar] [CrossRef] [PubMed]
- QB Industries. Buying a Quad Bar. Available online: http://www.quadbar.com.au/the-quadbar/buying-a-quadbar.html (accessed on 24 August 2015).
- Wordley, S. Quad Bike Crush Protection Devices (CPDs): Updates to ISCRR Snapshot Review C-I-12-022; Department of Mechanical and Aerospace Engineering, Monash University: Melbourne, Australia, 2012. [Google Scholar]
- Grzebieta, R.H.; Rechnitzer, G.; McIntosh, A.S.; Mitchell, R.; Patton, D. Road related quad bike and side by side vehicle casualties. In Proceedings of the 2014 Australian Road Safety Research, Policing, and Education Conference, Melbourne, Australia, 12–14 November 2014.
- Denning, G.M.; Jennissen, C.A.; Harland, K.K. ATV-related fatalities on paved and unpaved roads: Implications for public policy. In Proceeding of the International Society for Agricultural Safety and Health 2015 Annual Conference, Normal, IL, USA, 24–27 June 2015.
- Johansson, P.; Krog, G.F.; Harlin, L.; Danielson, A.; Tysk, L.; Heimdahl, A.; Olausson, M.; Brahn, S.; Nilsson, B. Better Safety on Quad Bikes, Joint Strategy Version 1.0 for the Years 2014–2020; The Swedish Transport Administration: Bolänge, Sweden, 2013; Available online: http://www.trafikverket.se/contentassets/9b6853f0faae41949ca03184b28edb49/strategi_fyrhjuling_eng.pdf (accessed on 9 August 2015).
Figure 1.
All-terrain vehicle-related fatal and nonfatal injuries reported by the US Consumer Product Safety Commission for the years 2003–2009. Source: Topping and Garland 2015 [2].
Figure 1.
All-terrain vehicle-related fatal and nonfatal injuries reported by the US Consumer Product Safety Commission for the years 2003–2009. Source: Topping and Garland 2015 [2].
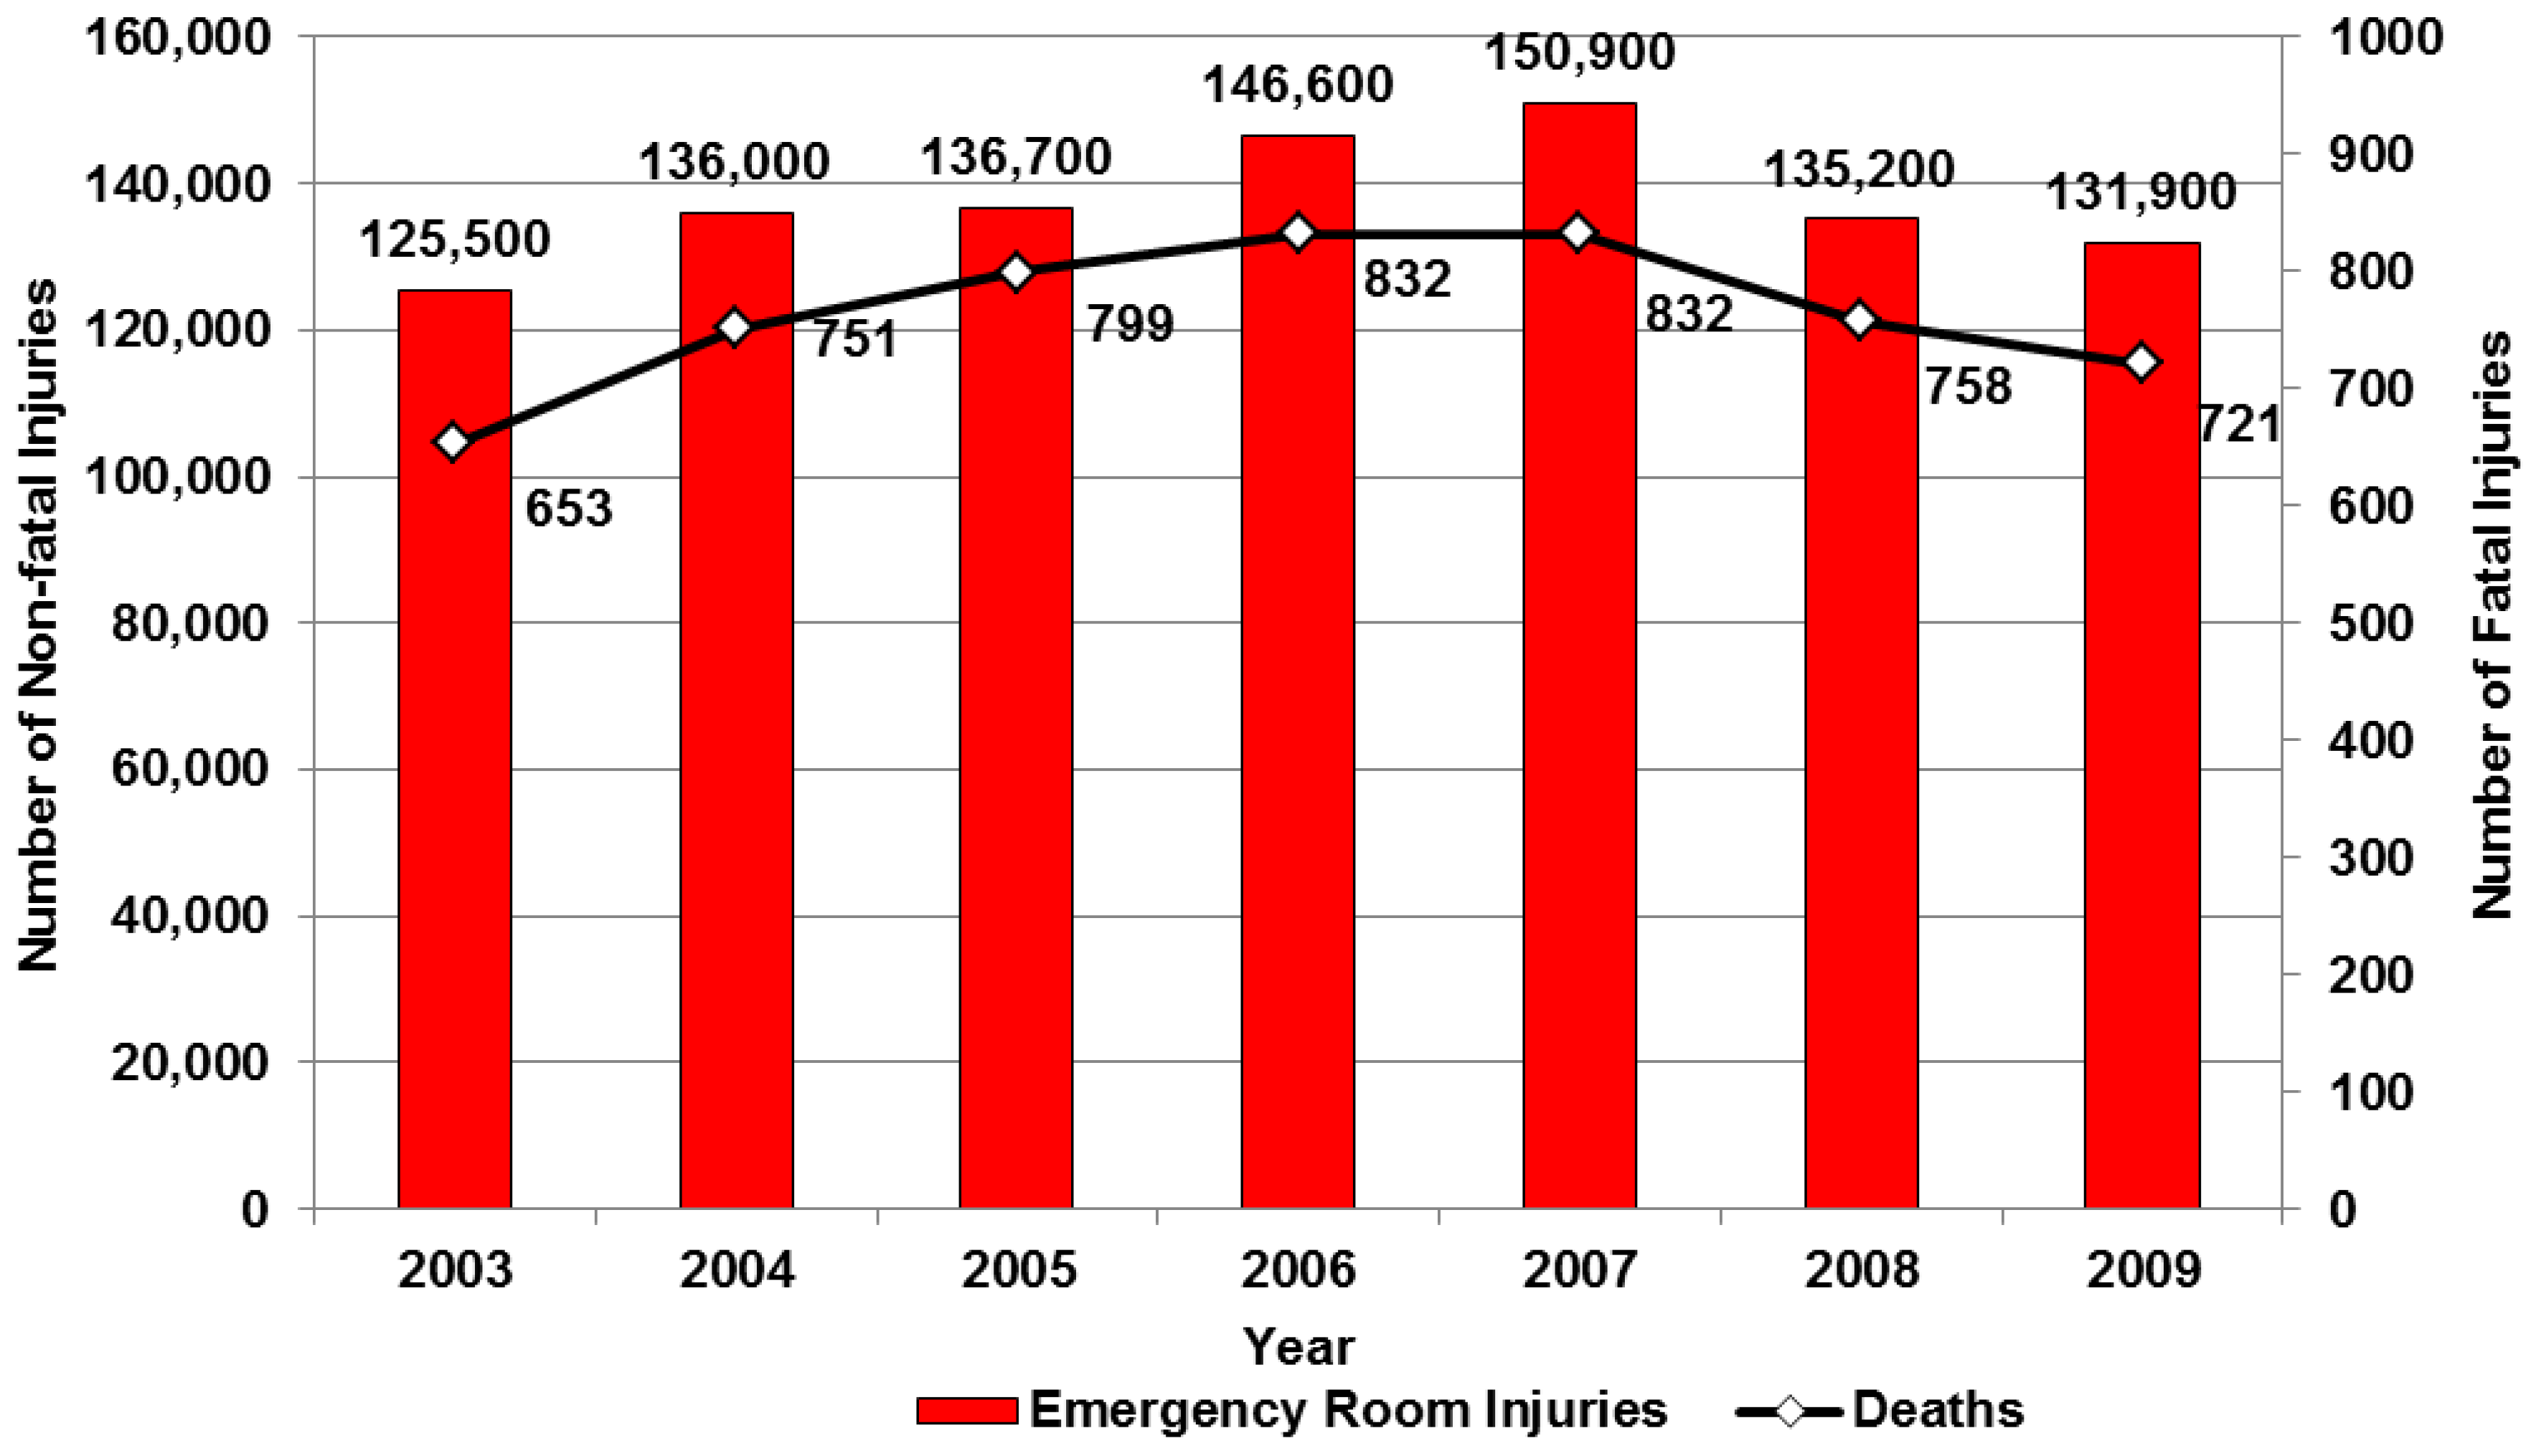
Figure 2.
A Quadbar™ attached to the rear of an all-terrain vehicle.
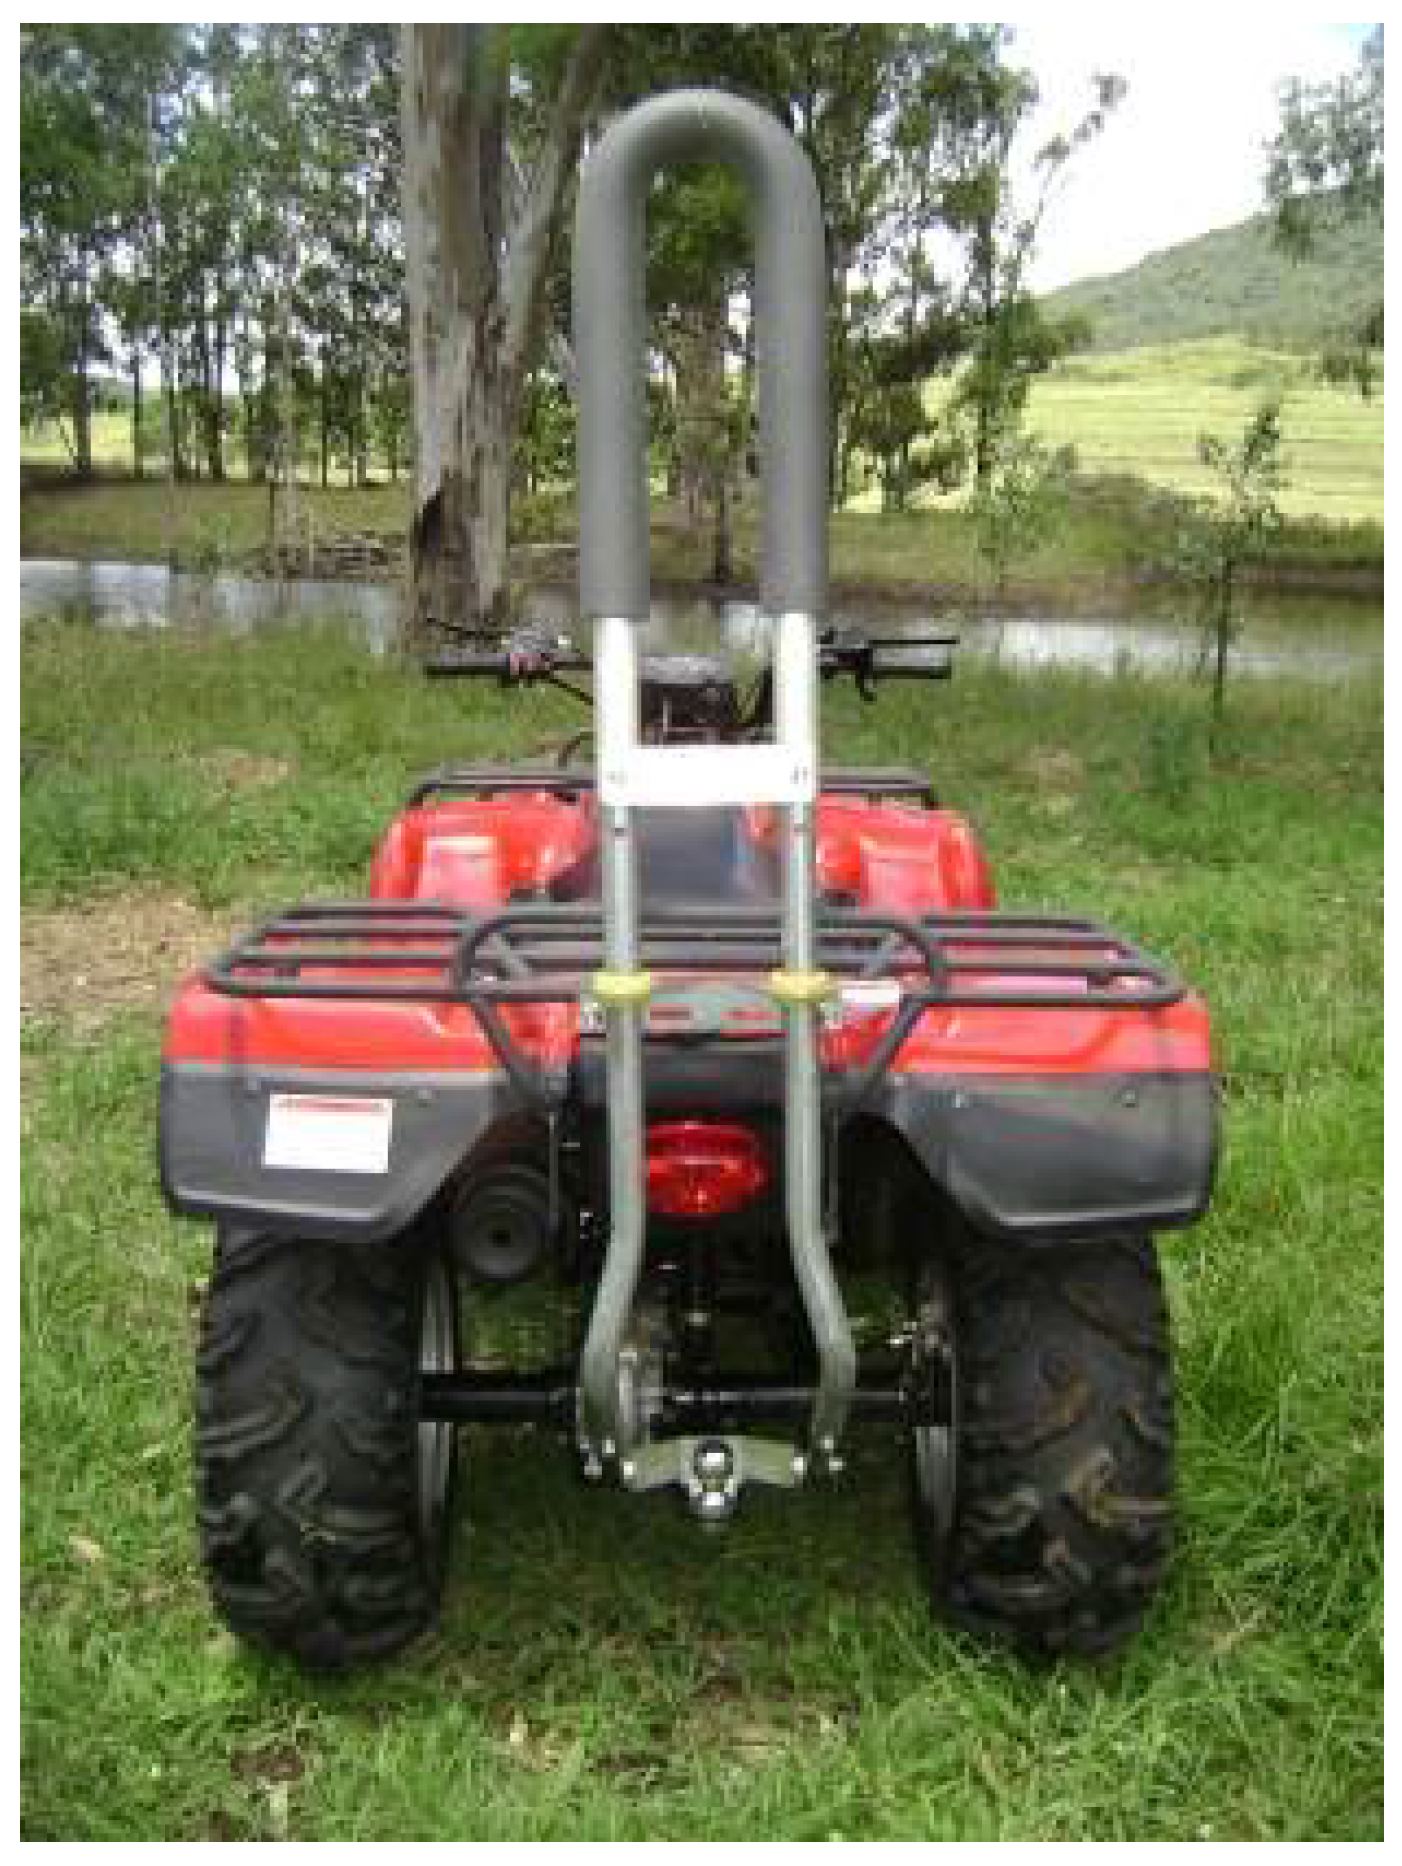
Figure 3.
Decision tree that compares the probabilities of fatal and nonfatal injuries between all-terrain vehicles (ATVs) on which Quadbars (QBs) are installed (QB installed) and ATVs with no crush prevention (No change). Note: The node values in each leg of the tree sum to 1.0.
Figure 3.
Decision tree that compares the probabilities of fatal and nonfatal injuries between all-terrain vehicles (ATVs) on which Quadbars (QBs) are installed (QB installed) and ATVs with no crush prevention (No change). Note: The node values in each leg of the tree sum to 1.0.
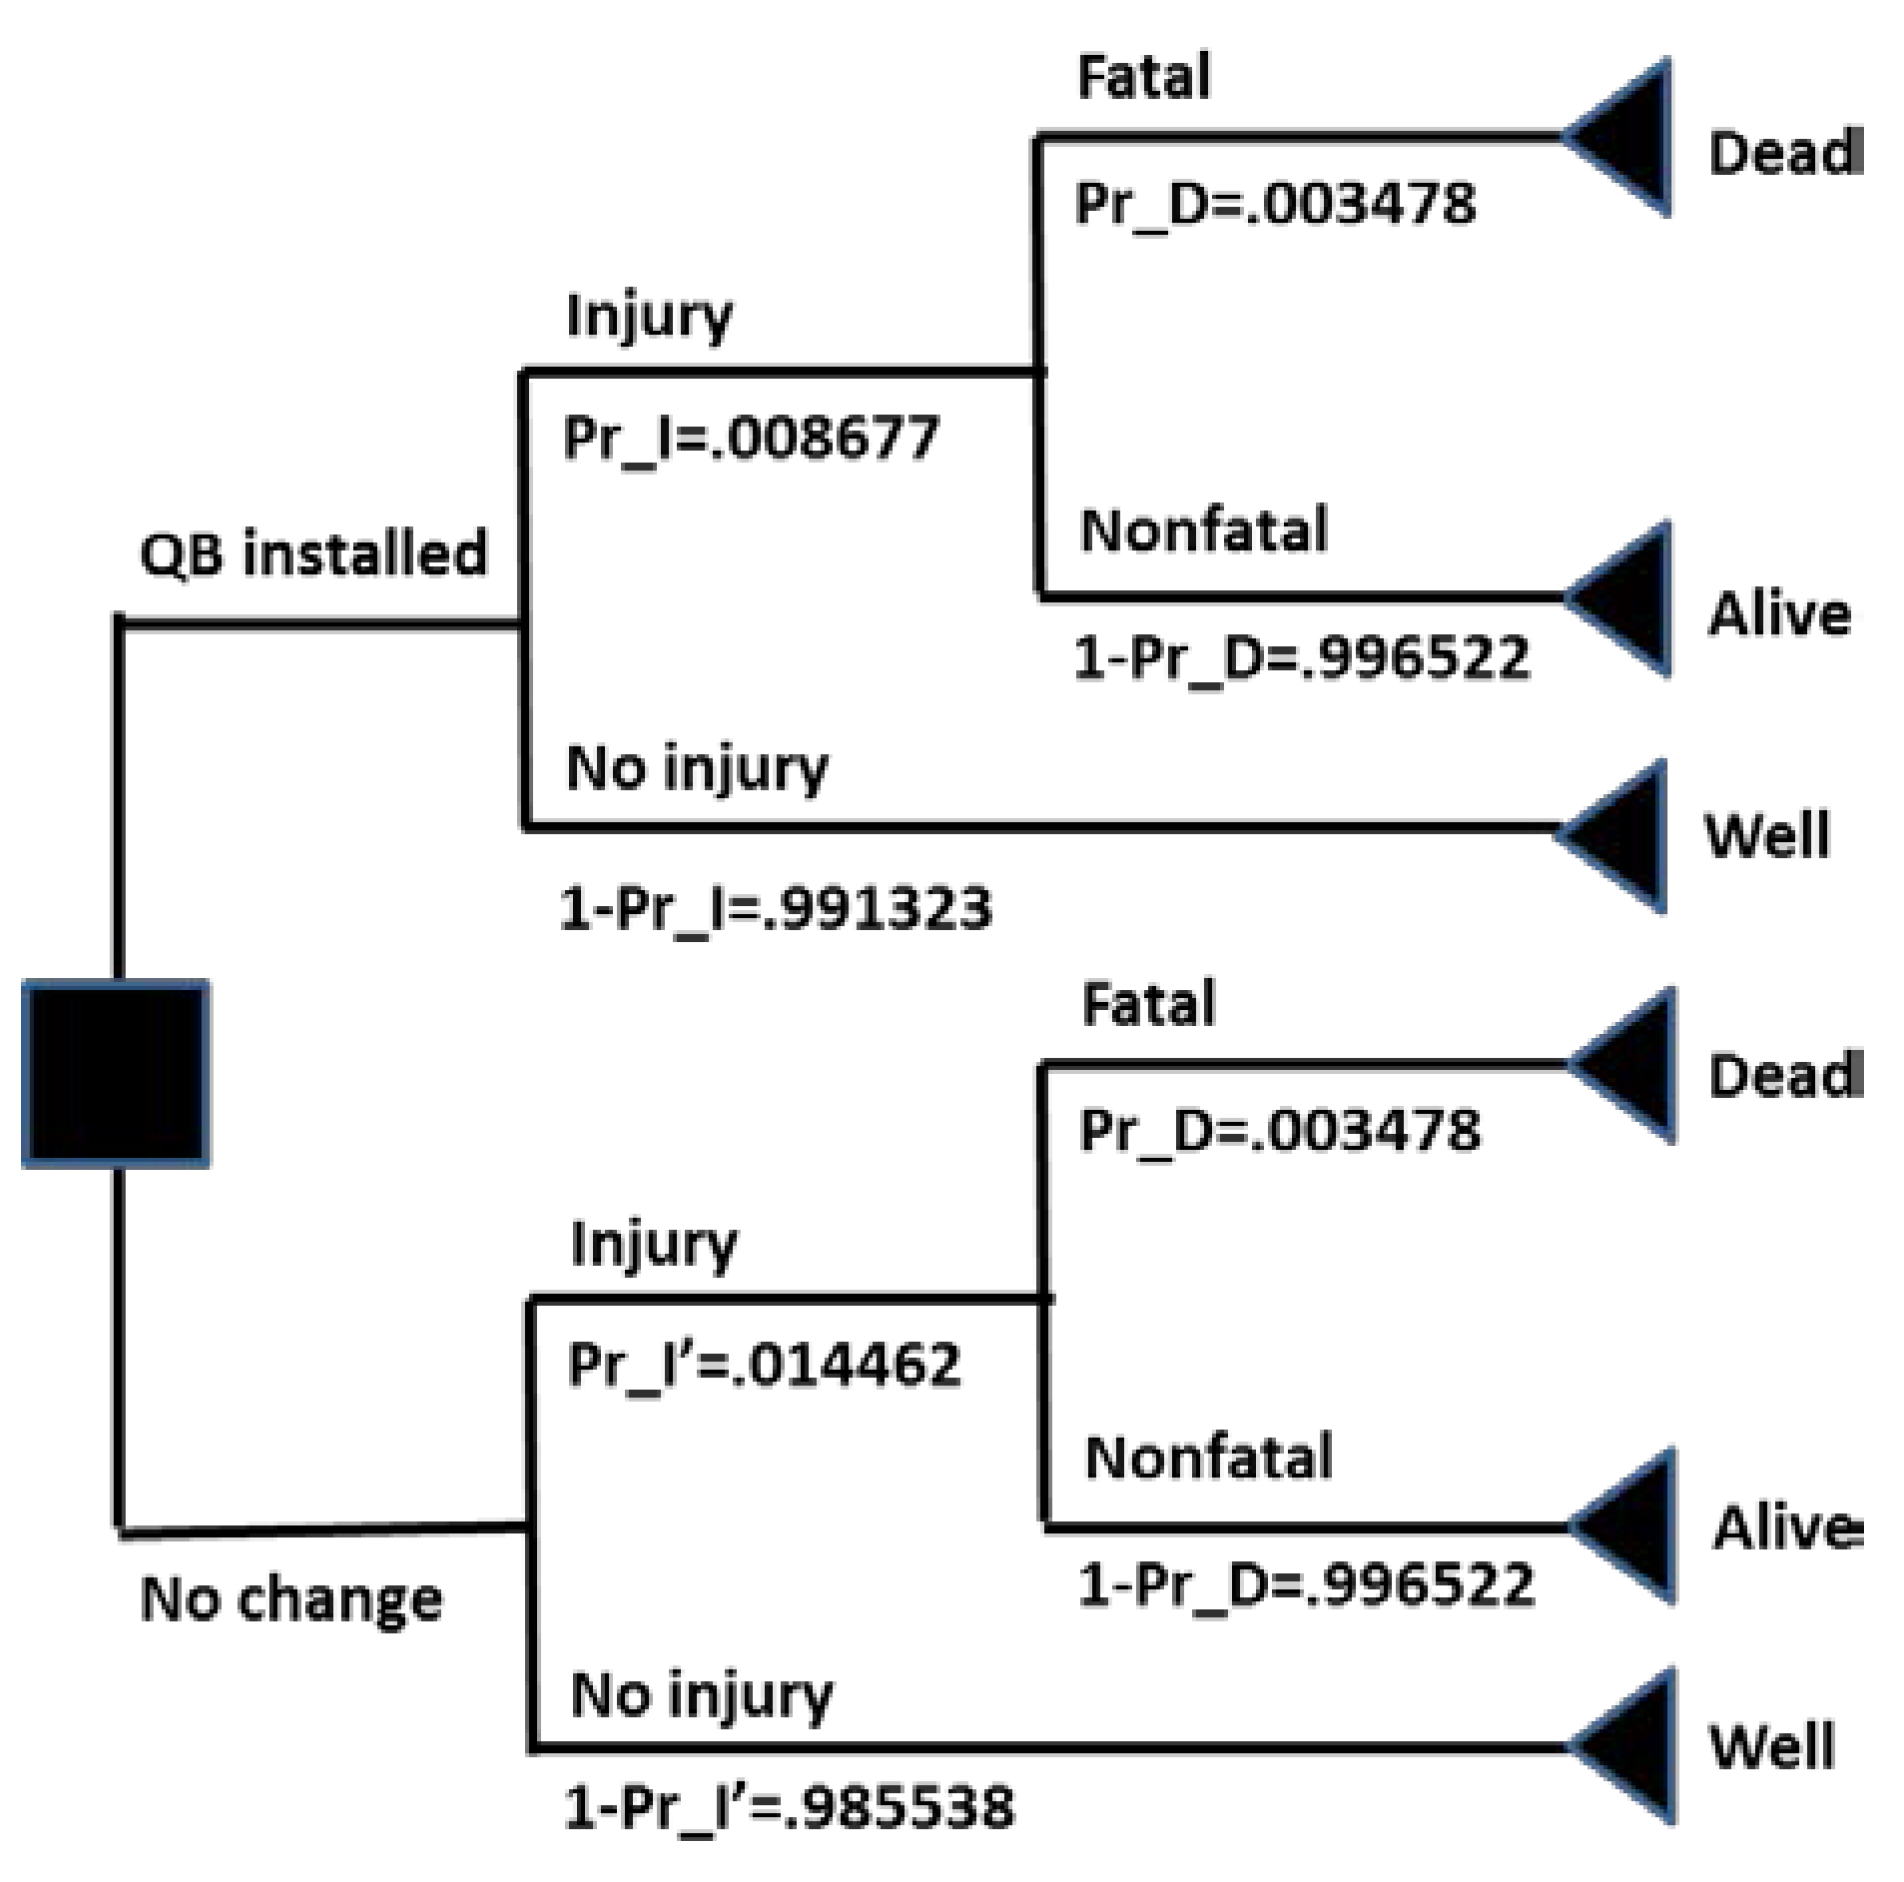
Figure 4.
A sub-tree of the decision tree that differentiates probabilities of serious and non-serious injuries and branches further into probabilities of different levels of injury severity.
Figure 4.
A sub-tree of the decision tree that differentiates probabilities of serious and non-serious injuries and branches further into probabilities of different levels of injury severity.

Figure 5.
Annual discounted benefits at 3% of Quadbar installation on an all-terrain vehicle that include fatal, serious, and non-serious injuries over a 10-year period for the base case in the analysis.
Figure 5.
Annual discounted benefits at 3% of Quadbar installation on an all-terrain vehicle that include fatal, serious, and non-serious injuries over a 10-year period for the base case in the analysis.

| MAIS | Selected Injuries | 2015 US$ | |
|---|---|---|---|
| 0 | No injury | $278 | |
| 1 | Minor | Superficial abrasion or laceration of skin; digit sprain; first-degree burn; head trauma with headache or dizziness | $12,314 |
| 2 | Moderate | Major abrasion or laceration of skin; concussion; finger or toe crush/amputation; closed pelvic fracture | $53,155 |
| 3 | Serious | Major nerve laceration; multiple rib fracture; abdominal organ contusion; hand, foot, or arm crush/amputation | $184,876 |
| 4 | Severe | Spleen rupture; leg crush; chest-wall perforation; concussion with other neurological signs | $410,678 |
| 5 | Critical | Spinal cord injury; extensive second- or third degree burns; cerebral concussion with severe neurological signs | $1,073,070 |
| 6 | Fatal | Injuries ultimately result in death | $1,524,818 |
Source: Blincoe et al., 2015 [17]; * Maximum represents the highest level score for multiple injuries across Abbreviated Injury Scale scores given for individual body parts.
| Event | Situation | Symbol | Probability per ATV‡ | Sum | Source** |
|---|---|---|---|---|---|
| Injury * | QB installed | Pr_I | 0.008677 | 1.0 | Garland, 2014 [4] Miller et al., 2000 [29] |
| Noninjury | QB installed | 1-Pr_I | 0.991323 | ||
| Injury * | No change | Pr_I′ | 0.014462 | 1.0 | |
| Noninjury | No change | 1-Pr_I′ | 0.985538 | ||
| Fatal injury | Both Choices | Pr_D | 0.003478 | 1.0 | Rodgers and Adler, 2001 [30] |
| Nonfatal Injury | 1-Pr_D | 0.996522 | |||
| Serious Injury | Both Choices | Pr_S | 0.267000 | 1.0 | Wood et al., 2014 [27] |
| Non-serious injury | 1-Pr_S | 0.733000 | |||
| Minor Injury | Both Choices | Pr_M | 0.878415 | 1.0 | Wood et al., 2014 [27] |
| Moderate Injury | 1-Pr_M | 0.121585 | |||
| Serious Injury | Both Choices | Pr_1 | 0.509766 | 1.0 | Krause et al., 2010 [26] |
| Severe Injury | Pr_2 | 0.330078 | |||
| Critical Injury | Pr_3 | 0.160156 |
† Quadbar (QB); ‡ all-terrain vehicle (ATV). * This event is the only difference between the two choices in the decision tree. It takes into account the propensities of overturn-related fatal (60.7%) and nonfatal (60.3%) injuries in which the difference is the assumed QB effectiveness (40%) in the “QB installed” choice.
Table 3.
Health and economic benefits and cost of Quadbar™ (QB) use over a 10-year analytic horizon, discounted at 3% per year (both injuries and dollars).
| Parameter | Injuries Averted/100,000 ATVs Over 10 Years | ATV Equipped with QB (US$ 2015) | |
|---|---|---|---|
| Benefit (B10) | QB Cost (C0) | ||
| Base Case, QB 40% effective | |||
| Fatal Injuries | 17.7 | $168 | |
| Serious Injuries | 1352 | $3376 | |
| Critical AIS | 97.2 | ||
| Severe AIS | 214.6 | ||
| Serious AIS | 1040.5 | ||
| Non-Serious Injuries | 3712 | $399 | |
| Moderate AIS | 451.4 | ||
| Minor AIS | 3261.1 | ||
| Total | 5082 | $3943 | $478 |
| Sensitivity Analyses | |||
| One-year analytic horizon | 578 (−88.6%) | $449 (−88.6%) | |
| Emergency department cases only | 3175 (−37.5%) | $2521 (−36.0%) | |
| QB = 12% effective | 1525 (−70.0%) | $1183 (−70.0%) | |
| QB = 80% effective | 10,165 (+100.0%) | $7884 (+100.0%) | |
| 0% discount rate | 5785 (+13.8%) | $4486 (+13.8%) | |
| This Study Assumed That | Implication |
|---|---|
| The number of patients and decedents are discounted at the same social rate as the dollars as recommended in Gold et al. [34]. | This procedure undercounts the actual number of injuries and deaths by more than 700 cases over the analytic horizon of 10 years. See the sensitivity analysis “0% discount rate” in Table 3. |
| The proportion of overturn-related deaths is 60.6% of all fatalities related to all-terrain vehicles (ATVs). | This percentage undercounts the proportion of ATV-related overturn deaths since the cause of 18% of the deaths are unknown and many are likely overturn-related [4] |
| The proportion of overturn-related nonfatal injuries is 60.3% of all ATV-related emergency department (ED) cases, and treatments in other clinical settings were added to the analysis based on a Consumer Product Safety Commission estimate. | The ED data is considered accurate, and the added non-ED cases likely were less severe injuries (e.g., fewer hospitalizations), thus entering a bias toward more severe injuries added [29], and minor injuries not treated by physicians were likely missing. |
| ATV injury-related data reported by three levels of injury severity score (ISS) data, <10, 10–15, and >15 *, reflected abbreviated injury scale (AIS) codes of minor, moderate, and serious severity levels from a study by Wood et al. [27] which was used to differentiate serious from non-serious injuries and moderate from minor injuries. | ISS codes average the three highest AIS across six body parts, which has the effect of reducing the severity level used. Thus, the ISS injury level, ((12 + 12 + 32)/3 = 11) would be reported as a moderate injury and would not count the serious injury by body part (AIS = 3) as the highest AIS. The averaging effect can reduce reported severity and the cost of an injury, which depends on the highest AIS overall. |
| Multiple maximum abbreviated injury scale (MAIS) injury data (from a Krause et al. study) [26] by body part for a cohort with ISS data for serious ATV injuries at ≥15 * represents the probabilities of serious, severe, and critical injuries (AIS = 3, 4, and 5, respectively). | All MAIS data by body part are presented for a large cohort with multiple injuries for which the highest three AISs by six body parts are reported. Thus, a single case represents up to three data points. While the profile of injuries by severity is helpful from a probability perspective and is consistent with the injury pyramid effect with the fewer injuries at the higher severity level, some serious cases would not be counted as ISS > 15 because of the averaging effect discussed above. |
| The Blincoe et al. estimates of financial cost for motor vehicle injuries per person were proportional to the ATV fatality cost for nonfatal injuries (Figure 1) for MAIS severity levels 1–5. | The motorcycle data presented in the Blincoe et al. report [17] presented a higher proportion of more severe injuries than motor vehicle incidents overall (which could be attributed to no safety enclosure). Half of US ATV injuries occur on roads [4], and larger ATVs can reach roadway speeds. Thus, the comparison is reasonable. |
| The Helmkamp et al. study that placed the social cost of an ATV-related fatality at US$947,658 is valid for the benefit analysis as conducted. | This value does not include intangible costs such as those for pain and suffering. While the cost per person of a fatality in a previous study by Blincoe et al. of 2000 data compared closely with the US$947,658 figure in 2015 dollars, their 2010 updated study included intangible costs and totaled US$1,524,818 per fatality in 2015 dollars. Thus, the dollar value in our study appears to be undervalued. |
| The cost of a Quadbar (QB) in the United States was US$478. | The posted list price of the QB was adjusted from Australian to US dollars based on an August 2015 conversion rate of $1:$.75. The cost may be higher when accounting for shipping and installation time and lower when accounting for large order discounts or being installed as standard equipment in the manufacturing process. Nonetheless, the QB unit cost could increase by an additional US$400 and still reach a breakeven point in year 2. |
| The effectiveness of the QB to reduce overturn-related injuries is 40%. | The effectiveness of the QB as evaluated ranged from 12% to 80% in the sensitivity analyses. Across this range, the benefits exceeded the cost. |
* The difference between these values is irrelevant since no combination of the sum of three squares = 15.
© 2016 by the author; licensee MDPI, Basel, Switzerland. This article is an open access article distributed under the terms and conditions of the Creative Commons by Attribution (CC-BY) license (http://creativecommons.org/licenses/by/4.0/).
Share and Cite
MDPI and ACS Style
Myers, M.L. Potential Benefit of the Quadbar™ on All-Terrain Vehicles. Safety 2016, 2, 5. https://doi.org/10.3390/safety2010005
AMA Style
Myers ML. Potential Benefit of the Quadbar™ on All-Terrain Vehicles. Safety. 2016; 2(1):5. https://doi.org/10.3390/safety2010005
Chicago/Turabian StyleMyers, Melvin L. 2016. "Potential Benefit of the Quadbar™ on All-Terrain Vehicles" Safety 2, no. 1: 5. https://doi.org/10.3390/safety2010005
Note that from the first issue of 2016, this journal uses article numbers instead of page numbers. See further details here.