1. Introduction
Farmers have a high prevalence of spinal musculoskeletal disorders (MSDs) that can impact on work practice, job satisfaction, and production [
1,
2,
3]. Whole body vibration (WBV) exposure from vehicle and machinery operation is recognised as a contributing factor to neck and low back MSDs [
4,
5,
6,
7,
8], as well as a number of other adverse health effects [
8,
9,
10,
11]. The risk is heightened when vibration exposure is prolonged, frequent, and includes episodes of mechanical shock [
12]. Agricultural workers have been found to exceed the European Union (2006) recommended daily action limits regarding occupational WBV exposure when operating tractors and quad bikes [
13,
14], posing a substantial risk for spinal MSDs. Vibration has also been associated with increased risk of agricultural quad bike loss-of-control events [
15]. With an estimated 80,000 quad bikes in use on New Zealand farms [
16] and 220,000 in use in Australia [
17], identifying WBV exposure levels would allow for more targeted intervention and preventative measures to reduce neck and low back MSDs.
The ISO2631-1 and 5 [
18,
19] standards provide recommendations for the direct measurement of WBV exposure, however, the financial cost in terms of equipment and time requirements renders direct measurement impractical in many settings. Studies employing direct WBV exposure measurement tend to have small sample sizes, reducing external validity. Larger, epidemiological studies predominantly rely on self-report surveys to establish vibration exposure [
20,
21]. Predicting vibration using task, workplace, and vehicle characteristics is more affordable and practical; however, to be meaningful, such estimates must be quantitatively related to direct measurement within the industry context and for the specific vehicle/machinery under study.
Exposure prediction modeling [
22], whereby statistical models are developed from direct field measurement and questionnaires, has been successfully used to predict WBV (explaining 26%–90% variance) in occupational drivers and heavy industries such as forestry and construction [
7,
23,
24]. The aim of the current study was to develop models to predict agricultural quad bike WBV exposure using self-report variables. Vibration levels, measured in the field over a working day, were compared to self-reported survey data to determine the factors that best predicted vibration exposure in a sample of farmers using quad bikes in New Zealand (NZ). Successful prediction modeling will allow for improved exposure assessment in large epidemiological studies and could serve as a screening tool for ergonomists and occupational health clinicians when considering risk factors for spinal MSDs in farmers.
2. Method
A convenience sample of 130 livestock farmers, from 120 different farms, in southern NZ was recruited for the study. For each participant, quad bike vibration and mechanical shock data were measured following ISO 2631-1 and ISO 2631-5 guidelines [
18,
19], over one working day using a series 2, eighth-order, 1.2 elliptical tri-axial accelerometer (NEXGEN Ergonomics) housed within a rubberised seat pad fixed directly to the quad bike seat. At the beginning and end of the day researchers documented the quad bike’s odometer readings. Participants completed a self-report questionnaire adapted from the Whole Body Vibration Health Surveillance Questionnaire (WBVHSQ) [
25] regarding the farm environment, quad bike vehicle specifications, driving behaviours, and general demographic information. Data collection methods have been described in detail elsewhere [
15]. For the purposes of the current study the following data were extracted:
Vehicle data: The sum of vibration exposure levels from x, y, and z axis calculated in two ways: (a) Eight-hour equivalent root mean square (A8rms) and (b) vibration dose value (VDV) [
2]. For the purposes of this study, the term “mean vibration exposure” will be used as an expression of A8rms whilst the term “mechanical shock” will refer to VDV exposures. In addition, the actual distance driven over the data collection period measured in kilometres was gathered from the odometer for each farmer.
Self-report data: Age, height, weight, years worked, quad bike experience (years) and farmers estimate of how long they had driven their quad bike on the day of data collection (hours) were recorded as continuous variables. Categorical variables were related to sex, smoking status (yes/no), alcohol consumption (dichotomised to ≤6 standard drinks/per week>6 standard drinks per week [
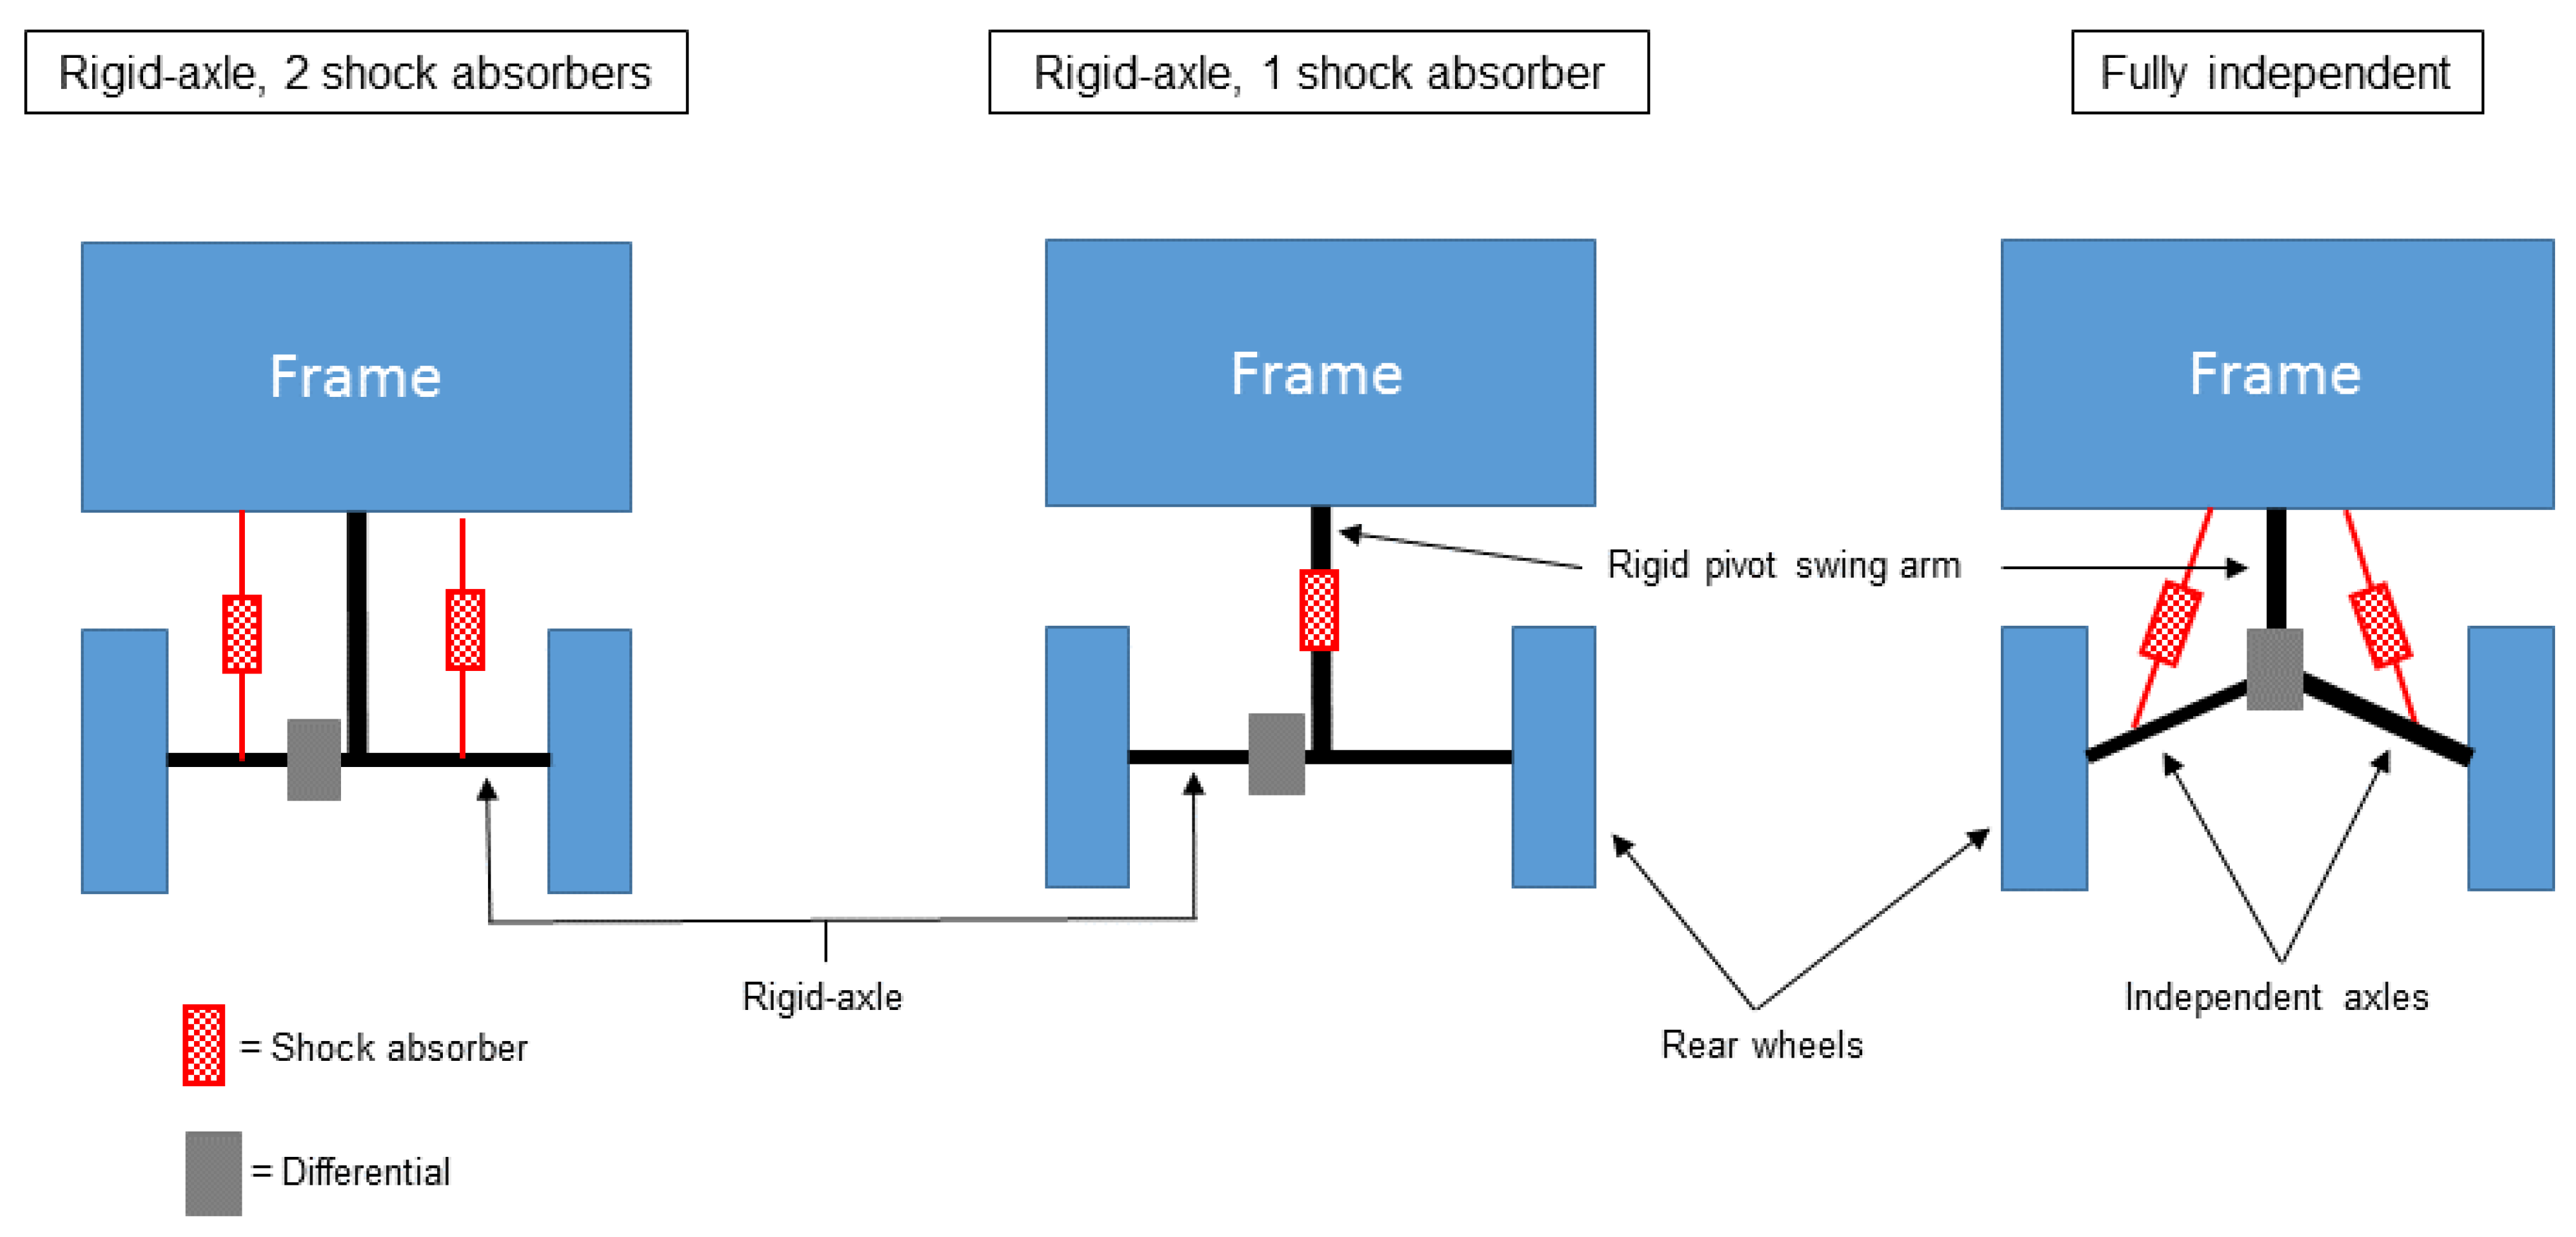
26]), occupational status (employee/self-employed), farm type (dichotomised to dairy/non-dairy), farm terrain (flat/flat-hilly/hilly/steep-hilly), quad bike rear suspension (dichotomised to rigid-axle with two shock absorbers/other rigid-axle, single shock absorber or fully independent—see
Figure 1), neck or low back pain in past 12 months (yes/no), neck or low back pain in past 7 days (yes/no) and history of quad bike rollover in working lifetime (yes/no).
Figure 1.
Schematic representation of quad bike rear suspension systems.
Figure 1.
Schematic representation of quad bike rear suspension systems.
Prediction Modeling
We set out to produce statistical models to predict agricultural quad bike vibration exposure from self-reported survey variables. We knew from previous research [
2,
13] that quad bike users were subjected to daily mean vibration exposures (most strongly represented by the A8rms value) and to mechanical shocks (most strongly represented by the VDV value), and as such we required different models to predict these two types of exposures. Further, we theorised farmers would be able to provide quad bike odometer readings, if requested in future surveys, which may provide a more powerful prediction model. Thus, four multivariate models were developed:
Model 1 A8rmsSum—estimated hours
Model 2 A8rmsSum—estimated hours + actual distance
Model 3 VDVSum—estimated hours
Model 4 VDVSum—estimated hours + actual distance
The lme4 package [
27] in the statistical program R [
28] was used to perform linear mixed-effects modeling for both A8rms and VDV. Variables reaching a significance level of
p < 0.2 on bivariate linear regression analysis were offered as fixed effects for each model, whilst farm code was entered as a random effect variable. The final model was selected when all variables in the model were significant (
p ≤ 0.05) predictors. In order to estimate the proportion of explained variance in each linear mixed model, the Ω
02, as recommended by Xu [
29] was calculated. A value of Ω
02 = 0 represents a model unable to explain any variance from the included variables whilst Ω
02 = 1 represents a model that explains all the variance. Ω
02 is an appropriate alternative to R
2, since R
2 is considered an unreliable statistic when using mixed models.
3. Results
Data from 130 participants were used to develop the prediction models.
Table 1 shows the sample demographics and descriptive analysis of each variable. All quad bikes used in the study had similar independent front suspension systems utilising pivoting control arms suspended by coil-over shock absorbers. However, three differing forms of rear suspension were noted (
Figure 1). Sixty-one (46.9%) of the study sample currently drove a quad bike with a rigid pivoting swing arm, rigid-axle suspension using two coil-over shock absorbers, mounted vertically from the axle to the rear of the frame. Forty (30.8%) drove a quad bike using a rigid pivoting swing arm, rigid-axle suspension with a single coil-over shock absorber, mounted horizontally from the pivot arm to the frame. Twenty nine (22.3%) drove a quad bike using an independent rear suspension system utilising two coil-over shock absorbers mounted vertically from each axle arm to the frame.
Table 1.
Descriptive characteristics and quad bike exposures of participating farmers.
Table 1.
Descriptive characteristics and quad bike exposures of participating farmers.
| Characteristic | Mean (sd), Range (
n = 130) |
|---|
| Age (years) | 40.6 (13.0), 16–67 |
| Height (m) | 1.77 (0.08), 1.60–1.96 |
| Weight (kg) | 87.0 (16.0), 50–129 |
| Farming experience (years) | 19.1 (13.2), 0.5–51 |
| Quad bike experience (years | 14.6 (8.3), 0.7–30.0 |
| Distance (km) | 22.2 (10.8), 5–60 |
| Estimated quad bike driving (hours) | 2.43 (1.37), 0.3–7 |
| A8rmsSum (ms−2) | 1.28 (0.26), 0.8–2.3 |
| VDVSum (ms−1.75) | 18.75 (4.56), 8.3–33.8 |
| Characteristic | Number of Participants (%) |
| Sex | |
| - Male | 111 (85.4) |
| - Female | 19 (14.6) |
| Smoker | |
| - Yes | 52 (40.0) |
| - No | 78 (60.0) |
| Alcohol | |
| - >6/week | 29 (22.3) |
| - ≤6/week | 101 (77.7) |
| Occupational status | |
| - Self-employed | 83 (63.8) |
| - Employed | 47 (36.2) |
| Farm type | |
| - Dairy | 40 (30.8) |
| - Sheep | 14 (10.8) |
| - Beef | 2 (1.5) |
| - Mixed livestock | 70 (53.8) |
| - other | 4 (3.1) |
| Terrain | |
| - Flat | 20 (15.4) |
| - Rolling-flat | 48 (36.9) |
| - Hilly | 39 (30.0) |
| - Steep-hilly | 23 (17.7) |
| Rear suspension | |
| - Rigid-axle, 2 shock absorbers | 61 (46.9) |
| - Rigid-axle, 1 shock absorber | 40 (30.8) |
| - Fully independent | 29 (22.3) |
| LBP7 | |
| - Yes | 46 (35.4) |
| - No | 84 (64.6) |
| LBP12 | |
| - Yes | 75 (57.7) |
| - No | 55 (42.3) |
| Cx7 | |
| - Yes | 14 (10.8) |
| - No | 116 (89.2) |
| Cx12 | |
| - Yes | 34 (26.2) |
| - No | 96 (73.8) |
| Previous rollover | |
| - Yes | 79 (60.8) |
| - No | 51 (39.2) |
The bivariate linear regression findings for WBV exposures (A8rmsSum and VDVSum) and self-reported variables are shown in
Table 2. Relationships reaching a significance of
p < 0.2 have been bolded. It is these variables that were offered into the multivariate linear mixed models.
The multivariate models are shown in
Table 3. Only three distinct models were produced; recorded odometer distance was not retained when offered into the VDVSum model, resulting in the same outcome as Model 3.
Model 1 predicting A8rmsSum was the simplest, yet strongest model with a Ω02 = 0.57. Older farmers experienced lower A8rms WBV exposure (−0.02, 95%CI: −0.04, 0.000; p = 0.035). The more hours in a day farmers estimated they drove their quad bike, the greater the A8rms exposure (0.086, 95%CI: 0.066, 0.105; p < 0.001), whilst using a quad bike with a pivot arm, rigid-axle rear suspension and two shock absorbers reduced A8rms exposure (−0.076, 95%CI: −0.129, 0.024; p = 0.005). Adding the variable “actual distance” into the A8rms model (Model 2) produced similar results when compared with estimated driving hours and rear suspension, however age was not retained in the model. Instead, being a dairy farmer entered the model and increased A8rms exposure levels (0.069, 95%CI: 0.013, 0.125; p = 0.016). The greater distance farmers actually drove (as recorded from the odometer) increased A8rms exposure levels (0.006, 95%CI: 0.003, 0.009; p < 0.001).
Table 2.
Simple linear regression relationships between WBV exposure and farmer, farm, and quad bike characteristics (variables reaching a p-value < 0.2 bolded).
Table 2.
Simple linear regression relationships between WBV exposure and farmer, farm, and quad bike characteristics (variables reaching a p-value < 0.2 bolded).
| Variable | A8rmsSum | VDVSum |
|---|
| β value | 95%CI | p-value | β value | 95%CI | p-value |
|---|
| Age (years) | −0.004 | −0.006, −0.001 | 0.005 | −0.143 | −0.198, −0.088 | <0.001 |
| Height (m) | −0.030 | −0.473, 0.413 | 0.893 | 6.228 | −3.855, 16.311 | 0.226 |
| Weight (kg) | −0.001 | −0.003, 0.001 | 0.306 | −0.026 | −0.075, 0.023 | 0.300 |
| Farming experience (years) | −0.004 | −0.006, −0.001 | 0.007 | −0.130 | −0.186, −0.073 | <0.001 |
| Quad bike experience (years) | −0.004 | −0.008, 0.000 | 0.042 | −0.144 | −0.238, −0.051 | 0.002 |
| Distance (km) | 0.011 | 0.008, 0.013 | <0.001 | 0.137 | 0.065, 0.208 | <0.001 |
| Estimated quad bike driving (hours) | 0.088 | 0.068, 0.108 | <0.001 | 1.348 | 0.822, 1.874 | <0.001 |
| Sex (male) | −0.05 | −0.147, 0.047 | 0.311 | −0.219 | −2.444, 2.006 | 0.847 |
| Smoker (yes) | 0.016 | −0.054, 0.086 | 0.651 | 0.317 | −1.287, 1.921 | 0.698 |
| Alcohol (>6/week) | −0.056 | −0.138, 0.025 | 0.177 | 0.362 | −1.526, 2.249 | 0.707 |
| Occupational status (self-employed) | −0.105 | −0.174, −0.036 | 0.003 | −2.898 | −4.455, −1.340 | <0.001 |
| Farm type (dairy) | 0.051 | −0.023, 0.124 | 0.179 | 2.611 | 0.969, 4.253 | 0.002 |
| Terrain | | | | | | |
| Rolling-flat | −0.018 | −0.121, 0.085 | 0.736 | −1.562 | −3.916, 0.791 | 0.193 |
| Hilly | 0.026 | −0.080, 0.132 | 0.632 | −1.001 | −3.428, 1.426 | 0.419 |
| Steep hilly | −0.024 | −0.142, 0.095 | 0.693 | −1.529 | −4.236, 1.177 | 0.268 |
| Rear suspension (rigid-axle, 2 shock absorbers) | −0.079 | −0.147, −0.012 | 0.021 | −1.987 | −3.516, −0.441 | 0.012 |
| LBP7 (no) | 0.020 | −0.0051, 0.092 | 0.577 | 0.508 | −1.134, 2.150 | 0.544 |
| LBP12 (no) | 0.003 | −0.067, 0.072 | 0.937 | −0.071 | −1.6662, 1.520 | 0.930 |
| Cx7 (no) | −0.026 | −0.136, 0.085 | 0.651 | −1.393 | −3.917, 1.132 | 0.280 |
| Cx12 (no) | −0.051 | −0.129, 0.027 | 0.198 | −1.748 | −3.512, 0.015 | 0.052 |
| Previous rollover (no) | −0.042 | −0.112, 0.028 | 0.242 | −1.176 | −2.773, 0.421 | 0.149 |
The model predicting VDVSum exposure (Model 3) contained the same variables as Model 1 and had a Ω02 = 0.33. In similar fashion, increasing age (−0.122, 95%CI: −0.173, −0.071; p < 0.001) and rigid-axle rear suspension with two shock absorbers (−1.947, 95%CI: −3.246, −0.647; p = 0.003) reduced VDV exposure whilst higher estimated quad bike use increase VDV exposure (1.157, 95%CI: 0.676, 1.635; p < 0.001).
Table 3.
Multivariate Linear Mixed-Effects Models predicting WBV exposure from self-reported variables.
Table 3.
Multivariate Linear Mixed-Effects Models predicting WBV exposure from self-reported variables.
| Variables | β value | 95% CI | p-value |
|---|
| Lower | Upper |
|---|
| Model 1: A8rmsSum – estimated hours Ω02= 0.57 |
| Intercept | 0.546 | 0.439 | 0.654 | <0.001 |
| Age (years) | −0.002 | −0.004 | 0.000 | 0.035 |
| Estimated driving (hours) | 0.086 | 0.066 | 0.105 | <0.001 |
| Rigid-axle rear suspension, 2 shock absorbers—Yes | −0.076 | −0.129 | 0.024 | 0.005 |
| Model 2: A8rmsSum – estimated hours + distance Ω02= 0.50 |
| Intercept | 0.359 | 0.289 | 0.429 | <0.001 |
| Estimated driving (hours) | 0.059 | 0.036 | 0.082 | <0.001 |
| Distance (km) | 0.006 | 0.003 | 0.009 | <0.001 |
| Rigid-axle rear suspension, 2 shock absorbers—Yes | −0.071 | −0.122 | −0.021 | 0.005 |
| Farm type—Dairy | 0.069 | 0.013 | 0.125 | 0.016 |
| Model 3 & 4: VDVSum – estimated hours +/− distance Ω02= 0.33 |
| Intercept | 21.792 | 19.116 | 24.469 | <0.001 |
| Age (years) | −0.122 | −0.173 | −0.071 | <0.001 |
| Estimated driving (hours) | 1.157 | 0.676 | 1.635 | <0.001 |
| Rigid-axle rear suspension, 2 shock absorbers—Yes | −1.947 | −3.246 | −0.647 | 0.003 |
4. Discussion
The current study developed statistical models that can be used to predict agricultural quad bike WBV exposure using self-report variables. Three models emerged from the linear mixed effects modeling. Models 1 and 2 (
Table 3) predict A8rmsSum WBV exposure from agricultural quad bike use both with (Model 2), and without (Model 1) the need for farmers to record their odometer reading for the day in question. Model 1 is the stronger of these prediction models, with 57% of the variance in A8rmsSum exposure explained by a farmer’s age, their estimate of quad bike driving hours in a day, and the type of quad bike rear suspension. With “distance” included in the prediction model (Model 2), 50% of the variance in A8rmsSum vibration exposure was explained. Adding distance removed farmer age as a predictor and added farm type (with “dairy” increasing the exposure risk compared to “non-dairy”). Predicting mechanical shocks as measured by VDVSum proved more difficult; Models 3 and 4 contained the same variables as Model 1, but were only able to explain 33% of the exposure variance. The mean vibration exposure (as measured by A8rmsSum) denotes the average acceleration a person is exposed to on the measurement day, whereas VDV results are a cumulative dose over the day of measurement and more strongly weighted towards shock values [
30]. The occurrence and magnitude of mechanical shocks on farmland are considered more difficult to predict, and are thought to be closely linked to driving over unexpected and irregular terrain perturbations and influenced by personal riding style [
2]. Thus, it was anticipated that it would be more difficult to find appropriate predictors for VDV, and that Models 3 and 4 would explain lower variance than Models 1 and 2.
Previous prediction modeling studies show comparable findings in terms of predictors, suggesting the importance of vehicle suspension systems with regards to WBV exposure. Nitti and DeSantis [
24] investigated WBV exposure in truck drivers and produced three regression models. The initial model (adjusted R
2 = 0.80) found WBV exposure was predicted by the type of front and rear wheel suspension, speed, whether the truck had an empty or full load, and how rough the road surface was. Pneumatic rear suspension was the only non-significant variable. Further models combined pneumatic suspension with road roughness, added into the model as a variable interaction, and a new variable derived from the square of speed. Both models explained more of the variance in WBV exposure (adjusted R
2 0.86 and 0.90). However, the methods for model building and the variable selection were not fully explained. Only 24 WBV measurements were recorded by Nitti and DeSantis. The same driver was used throughout and drove two models of truck under a range of conditions (wheel suspension, speed, load, and road type) likely contributing to the model strength.
A study of 90 long haul truck drivers randomly sampled rms exposure, for five minutes every working hour, over four different highway routes at speeds over 80 kph [
31]. The rmsSum value was statistically significantly predicted by road surface, type of truck, cab location with respect to engine, age of truck, and wheel suspension. Non-significant variables in the model were driver experience, seat type and truck mileage, with a final model R
2 = 0.53. In another study of 125 workers from five heavy industries (construction, forestry, transportation, warehousing, and wood/paper products), Village
et al. [
23] measured A8rms exposure in the field and investigated vibration exposure prediction models using (1) observation data from trained observers and; (2) self-report data from workers. Vehicle speed, vehicle type and, and industry type explained 58% of the variance in WBV exposure from observed data and 60% from self-report data. The industries included in this study used a range of vehicles over different terrains from smooth indoor flooring, to highway, to off-road trails and the combined model was strongly influenced by the type of vehicle. In contrast, all data gathered in the present study were gathered from one type of farm vehicle (albeit from a variety of manufacturers) being used in off road, on-farm situations. Given our focus on this commonly used type of farm vehicle the strongest factor for both VDV and rms models appear to have strong behavioural/personal components centered on the age of the driver and the length of time they drive their vehicle.
Quad bike manufacturers offer a range of rear suspension designs, increasing in cost, from rigid-axle with one or two shock absorbers to fully independent (see
Figure 1). While this observational fieldwork study did not control other components of the suspension system (e.g., tyre pressure, type of tyre, shock absorber ride adjustment setting) and did not standardise the terrain surface, it is interesting to note the consistent influence of rear suspension type on vibration exposure. It appears that a rigid rear axle system, attached to a pivot arm and supported by two coil-over shock absorbers mounted vertically between the axle and frame, can more effectively attenuate vibration transmission from the terrain to the driver than the other two described forms. It will take further controlled laboratory or field-based experiments, with a number of mechanically standardised conditions, to explore this observation further.
The majority of on farm quad bike travel is off-road; on gravel tracks, formed tracks through paddocks, unformed tracks, tussock hills,
etc. Environmental and seasonal conditions continually change the roughness of these surfaces impacting on WBV exposure. For example, livestock can churn up the surface in wet muddy conditions and when the ground hardens, in dry or freezing conditions, the terrain becomes very uneven. Riding slowly over rough terrain reduces WBV and mechanical shock exposure [
31,
32] and, therefore, rider behaviour and driving technique is also worthy of consideration. These, and previous results [
33] for an age reducing influence on WBV exposure indirectly support this argument. It is plausible that work experience, previous injury, and reflective wisdom accrued over a working lifetime allows older farmers/rural workers a greater ability to exercise prudence and caution as they travel over and negotiate terrain that will place a less experienced farmer at higher exposure risk.
Farmer age was a significant predictor in the current study, suggesting that older farmers are exposed to lower levels of WBV and mechanical shock than younger farmers. Extrapolating from Model 1 we can estimate that a 60-year old farmer would lower her/his A8rmsSum exposure by 0.12 ms
−2, compared to 0.04 ms
−2 in a 20-year old. Mechanical shock exposure (VDVSum) would be reduced by 7.32 ms
−1.75 in a 60 year old farmer and a by 2.44 ms
−1.75 in a 20 year old. The European Union (2006) set a safe daily VDV action limit of 9.1 ms
−1.75 in workers. Younger farmers, using a quad bike without a rear suspension system of rigid-axle with two shock absorbers, for long periods (such as during the typical NZ lambing and calving season) may well exceed the action limit, putting themselves at risk for adverse health effects from vibration exposure. Previous research has posited possible reasons as to why older farmers have less quad bike vibration exposure: prior experience of spinal MSDs leading to farmers choosing to limit quad bike riding time, ride slower or take smoother, more established farm tracks [
15], whilst younger farmers often feel pressured to “get the job done” taking short-cuts and rushing in order to prove themselves [
34].
Vibration exposure is dependent on time, so it was not surprising to find farmer’s estimate of quad bike driving hours to be an integral predictor in all the models. We chose to use farmer’s estimate as opposed to the actual time recorded in the field for two reasons: estimated hours correlated well with actual time recorded from accelerometers (r = 0.74, p < 0.001), and the aim of the study was to use self-reported data that could be included in larger surveys. The original data set included a measure of distance taken from quad bike odometer readings. It was anticipated that adding distance would strengthen the vibration prediction models, as farmers could easily record odometer information over one day of quad bike use and self-report the distance driven. Interestingly, distance did not strengthen the models suggesting that exposure time is more relevant. When distance was included, being a dairy farmer became significant, as seen in Model 2. The same phenomenon occurred when distance was forced to stay in the VDV model. Post-hoc analysis found no significant difference in the distance dairy farmers rode compared to other livestock farmers (mean difference = 3.28 km with dairy farmers riding the shorter distance on average, p = 0.10) but a significant difference with regards mean velocity farmers rode their quad bikes (mean difference = 2.18 kph with dairy farmers riding slower on average, p = 0.01). The A8rmsSum model (Model 2) shows a small increase in exposure for dairy farms (0.069, 95%CI: 0.013, 0.125) but the VDV model showed a much higher value for dairy (1.741, 95%CI: 0.165, 3.317) suggesting dairy farmers are exposed to more mechanical shocks. While it is not clear why dairy farmers are at greater risk of exposure to mechanical shocks when driving their quad bikes, clinical and anecdotal evidence, as well as on-farm observation, indicates greater surface irregularities from dairy cattle movement within fields, greater use of animal walkways from the field to milking sheds, and a generally younger workforce compared to other livestock farms.
In two previous studies (
n = 12 and
n = 130), farmers have been found to exceed European Union (2006) action limit values for WBV and mechanical shock exposure from quad bike use [
2,
13]. Quad bike vibration exposure has also been associated with spinal MSDs. Using the prediction models presented here would allow for more efficient exposure quantification with a larger sample size in this occupational sector known to experience higher than average neck and low back pain disorders [
35,
36,
37]. The prediction models developed in the current study are not able to provide a perfect estimate of farmers WBV and mechanical shock exposure from quad bike use at the individual level—for this direct measurement is still the gold standard. However, for large, countrywide or provincial epidemiology studies direct measurement is impractical, especially in terms of manpower to travel to rural locations and process accelerometer data [
38]. Thus, there is a compromise between accuracy and sample size, well recognised in the epidemiology field [
39,
40,
41]. Using farmers to self-report specific information has greater utility, is more timely and, likely more cost-efficient in comparison [
39]. Self-reporting is flexible in that it can be done via phone interviews, online or postal surveys. Although farmer responses using a fully self-administered survey method could differ from researcher-gathered data (collected by phone or face-to-face) in terms of response rate, missing data, and interpretation, the ability to sample a larger proportion of the population may be more advantageous. Only three variables are required to make use of the models presented here: age, type of quad bike rear suspension, and estimated daily hours of quad bike use. It is anticipated that the majority of farmers would be able to provide this information with minimal effort, thereby assuring a high participation rate and minimal missing data.
The current study used field data collected from livestock farmers working in one geographical area of NZ. The sample under study included farmers and farm workers operating quad bikes on flat, rolling, hilly and steep terrain, considered representative of farms throughout NZ. Thus, results and interpretation may only pertain to farmers working in such conditions. As a secondary analysis of previously collected data, the exposure prediction models presented here were limited in the number and type of prediction variables available.
While our models are considered to be statistically strong, it is obvious that the strongest models still only explain 57% and 33% of the variance for daily vibration and mechanical shock exposure (respectively), and thus 43% and 67% of the variance for these exposures is unexplained by this multivariate analysis. The current research was a secondary analysis of data from a study primarily designed to explore full daily recorded exposure (ref), and the survey used was an adapted version of the WBVHSQ developed by Pope
et al. in 2002 [
25]. The survey was not specifically designed to suit New Zealand on-farm conditions, and likely needs further research relative to validity of exposure measures and whether it truly reflects all factors likely to contribute on-farm quad bike driving exposures. Given these limitations, it is still important to note the strong associative models; we consider identification of further contributing factors will most likely strengthen these models.
Furthermore, the current study used field data collected from livestock farmers working in one geographical area of NZ. The sample under study included farmers and farm workers operating quad bikes on flat, rolling, hilly and steep terrain, considered representative of farms throughout NZ. Thus, results and interpretation may only pertain to farmers working in such conditions. Further information regarding ground conditions, speed, tyre pressure and rider style/behaviour may have added strength to the modeling process. Data were also collected from multiple farms, over a wide variety of surface conditions, in different seasonal conditions. Smaller field studies designed to mitigate these confounding variables and control for type of rear suspension, tyre pressure, riding time, riding route etc. would be a natural progression to the current research.


