Applications of Laboratory-Based Phase-Contrast Imaging Using Speckle Tracking Technique towards High Energy X-Rays


1
Diamond Light Source, Harwell Science and Innovation Campus, Didcot OX11 0DE, Oxfordshire, UK
2
Empa, Swiss Federal Laboratories for Materials Science and Technology, 8600 Dübendorf, Switzerland
*
Author to whom correspondence should be addressed.
†
Now at Excillum AB, Torshamnsgatan 35, 164 40 Kista, Sweden.
J. Imaging 2018, 4(5), 69; https://doi.org/10.3390/jimaging4050069
Submission received: 15 March 2018
/
Revised: 27 April 2018
/
Accepted: 8 May 2018
/
Published: 11 May 2018
(This article belongs to the Special Issue Phase-Contrast and Dark-Field Imaging)
Abstract
:The recently developed speckle-based technique is a promising candidate for laboratory-based X-ray phase-contrast imaging due to its compatibility with polychromatic X-rays, multi-modality and flexibility. Previously, successful implementations of the method on laboratory systems have been shown mostly with energies less than 20 keV on samples with materials like soft tissues or polymer. Higher energy X-rays are needed for penetrating materials with a higher atomic number or that are thicker in size. A first demonstration using high energy X-rays was recently given. Here, we present more potential application examples, i.e., a multi-contrast imaging of an IC chip and a phase tomography of a mortar sample, at an average photon energy of 40 keV using a laboratory X-ray tube. We believe the results demonstrate the applicability of this technique in a wide range of fields for non-destructive examination in industry and material science.
1. Introduction
High energy X-rays are used for many applications in non-destructive examinations in industry or security for materials with high density or large thickness, because of their higher penetration ability. Biomedical imaging, such as dental and chest radiography, or large animal imaging, is also a field where high energy X-rays are applied. Research shows that even low-absorbing tissues, such as breast tissue, with the aid of phase-contrast imaging technique, can be imaged by X-rays with higher energies, providing the benefit of lower dose deposition [1].
X-ray phase-contrast imaging (XPCI) has drawn increasing attention as being complimentary or an alternative to the conventional attenuation-contrast method. From the phase contrast, the electron density of the material can be retrieved [2]. With the contrasts from both attenuation and phase, the complex refractive index of a material can be obtained. This allows the effective atomic number to be calculated and hence the quantitative characterization of the material [3]. Moreover, comparisons have been done theoretically and experimentally for the two contrast mechanisms and have shown that the phase contrast can provide higher signal-to-noise ratio for high spatial resolution imaging of materials within certain energy ranges [4,5,6].
While the attenuation of the X-ray intensity can be measured directly with an X-ray detector, the phase shift needs to be converted to a detectable signal and retrieved using post processing. Varieties of XPCI techniques have been developed during recent decades [7,8]. Some of them have a high demand on the temporal coherence of X-ray beams, which are more practical for synchrotron sources, such as crystal interferometry [9], and analyzer-based imaging, also known as diffraction-enhanced imaging [10]. For XPCI to be practical and more accessible for medical imaging and industrial non-destructive examination, laboratory sources are the preferred options. Several XPCI methods are compatible with polychromatic X-rays, namely propagation-, grating-, speckle-based imaging and edge illumination [11,12,13,14]. With the aid of monochromators, the analyzer-based technique has been realized using laboratory sources [15]. Energy-sensitive detectors can potentially enhance the imaging signal-to-noise ratio [16] and loosen a phase-contrast technique’s demand on monochromaticity of a beam.
The speckle-based imaging (SBI) technique has been developed in recent years, starting at synchrotron facilities [17,18]. SBI has then been implemented on a laboratory-based liquid-metal jet source with an average X-ray energy less than 20 keV [13]. The imaged samples had materials with a low atomic number, such as organic polymers. A first demonstration of implementing SBI on high-energy X-ray laboratory source has been presented recently with an average energy over 100 keV [19]. For many XPCI methods, the challenge of being implemented to a high energy range involves the fabrication of corresponding optics. For example, an absorption grating with an aspect ratio of 143 was fabricated for the grating-based phase-contrast imaging technique for 100 keV [20]. The fabrication process can be both cost- and time-consuming. In comparison, steel wool was used as a random wavefront mask for SBI [19]. No stringent requirement on optics allows SBI to be easily and widely implemented. Here, we further investigate the applicability of SBI on commercially available laboratory sources towards high energies of the multi-contrast modalities and phase-contrast tomography. Tests from two samples are presented here: An integrated circuit (IC) chip and a cement mortar specimen, as examples of potential applications.
2. Materials and Methods
The experiments were conducted at Empa’s Center for X-ray Analytics. The alignment is shown in Figure 1a. The source was a Hamamatsu source in an EasyTom system from Rx Solutions (Rx Solutions SAS, Chavanod, France), with a tungsten target operated at 80 kV with an emission current of 74 µA. Estimated from a simulated spectrum [21], the average photon energy was about 40 keV. The detector, located 1.03 m downstream of the source, was a CCD camera based on a scintillator coupled by a fibre optic plate. The camera was binned 2 × 2 during experiments, resulting in a pixel size of 18 µm. The camera sensor area is 36 × 24 mm2, meaning the numerical aperture of the imaging system was about 35 mrad horizontally and 23 mrad vertically. The speckle pattern was generated by a stack of three layers of sandpaper (P220) with an average grit size of 68 µm [22], as shown in Figure 1b. Steel wool (Grade 0000) with an average fiber thickness of about 25 µm [23] packed to around 3 mm thick was also tested as wavefront modulator and is shown in Figure 1c. The speckle pattern from steel wool had higher visibility, but much higher absorption. If visibility is defined as the ratio of standard deviation and mean intensity within a subset window , the average visibility of the speckle pattern from sandpaper is about 5% and from steel wool 17%. A subset window of 50 × 50 pixel2 and an average over the image was used for calculation of visibility to provide better statistical data. However, the mean intensity in the speckle image from the sandpaper is 8 times higher than the image from the steel wool. Due to the limitations of the flux, the sandpaper was used for the experiments. The samples were mounted on a rotational stage located 0.2 m downstream of the source. The diffuser was mounted 7 cm away from the sample. The distances between each component in the alignment are flexible, which is easy to implement in any laboratory, compared to other phase-contrast imaging techniques, e.g., grating interferometry, which needs to match the grating periods and corresponding Talbot distances. With longer effective propagation distance, the speckle visibility is higher. A longer propagation distance also gives higher angular sensitivity, with the cost of lower flux density. A larger magnification means a smaller field of view. Therefore, there are tradeoffs for any alignment geometry and an optimization can only be discussed with a determined goal.
The principle of the speckle-tracking technique applied in the experiment is that the speckle patterns generated by the sandpaper function as a wavefront marker. The distortion of the wavefront can be retrieved by tracking the spatial change of the wavefront marker. Under the assumption that the phase is not changing rapidly, a rigid shift of the speckle pattern is approximated. The wavefront refraction can hence be measured as , where p is pixel size and z is the propagation distance. Taking two speckle images with and without a sample in the beam, the shift of the speckle pattern between the two images can be calculated pixel-wise by normalized cross-correlation and then by polynomial fitting to achieve sub-pixel resolution [24]. The precision of the algorithm is 0.001 pixel, meaning that the limit of spatial and angular resolution in this experimental alignment are 18 nm and 24 nrad, respectively. The observable resolution critically depends on the noise level in the result, which is largely determined by the photon noise and visibility of the speckle pattern [25]. Under small angle assumption, the differential phase contrast is approximately proportional to the refraction angle as . The phase map can then be integrated from the phase gradients in two directions. Simultaneously, the transmission image T can be achieved by calculating the intensity change between the images; while the change of the visibility of the speckle patterns can be defined as the dark-field images , providing information about the small angle scattering of a sample [26].
3. Results
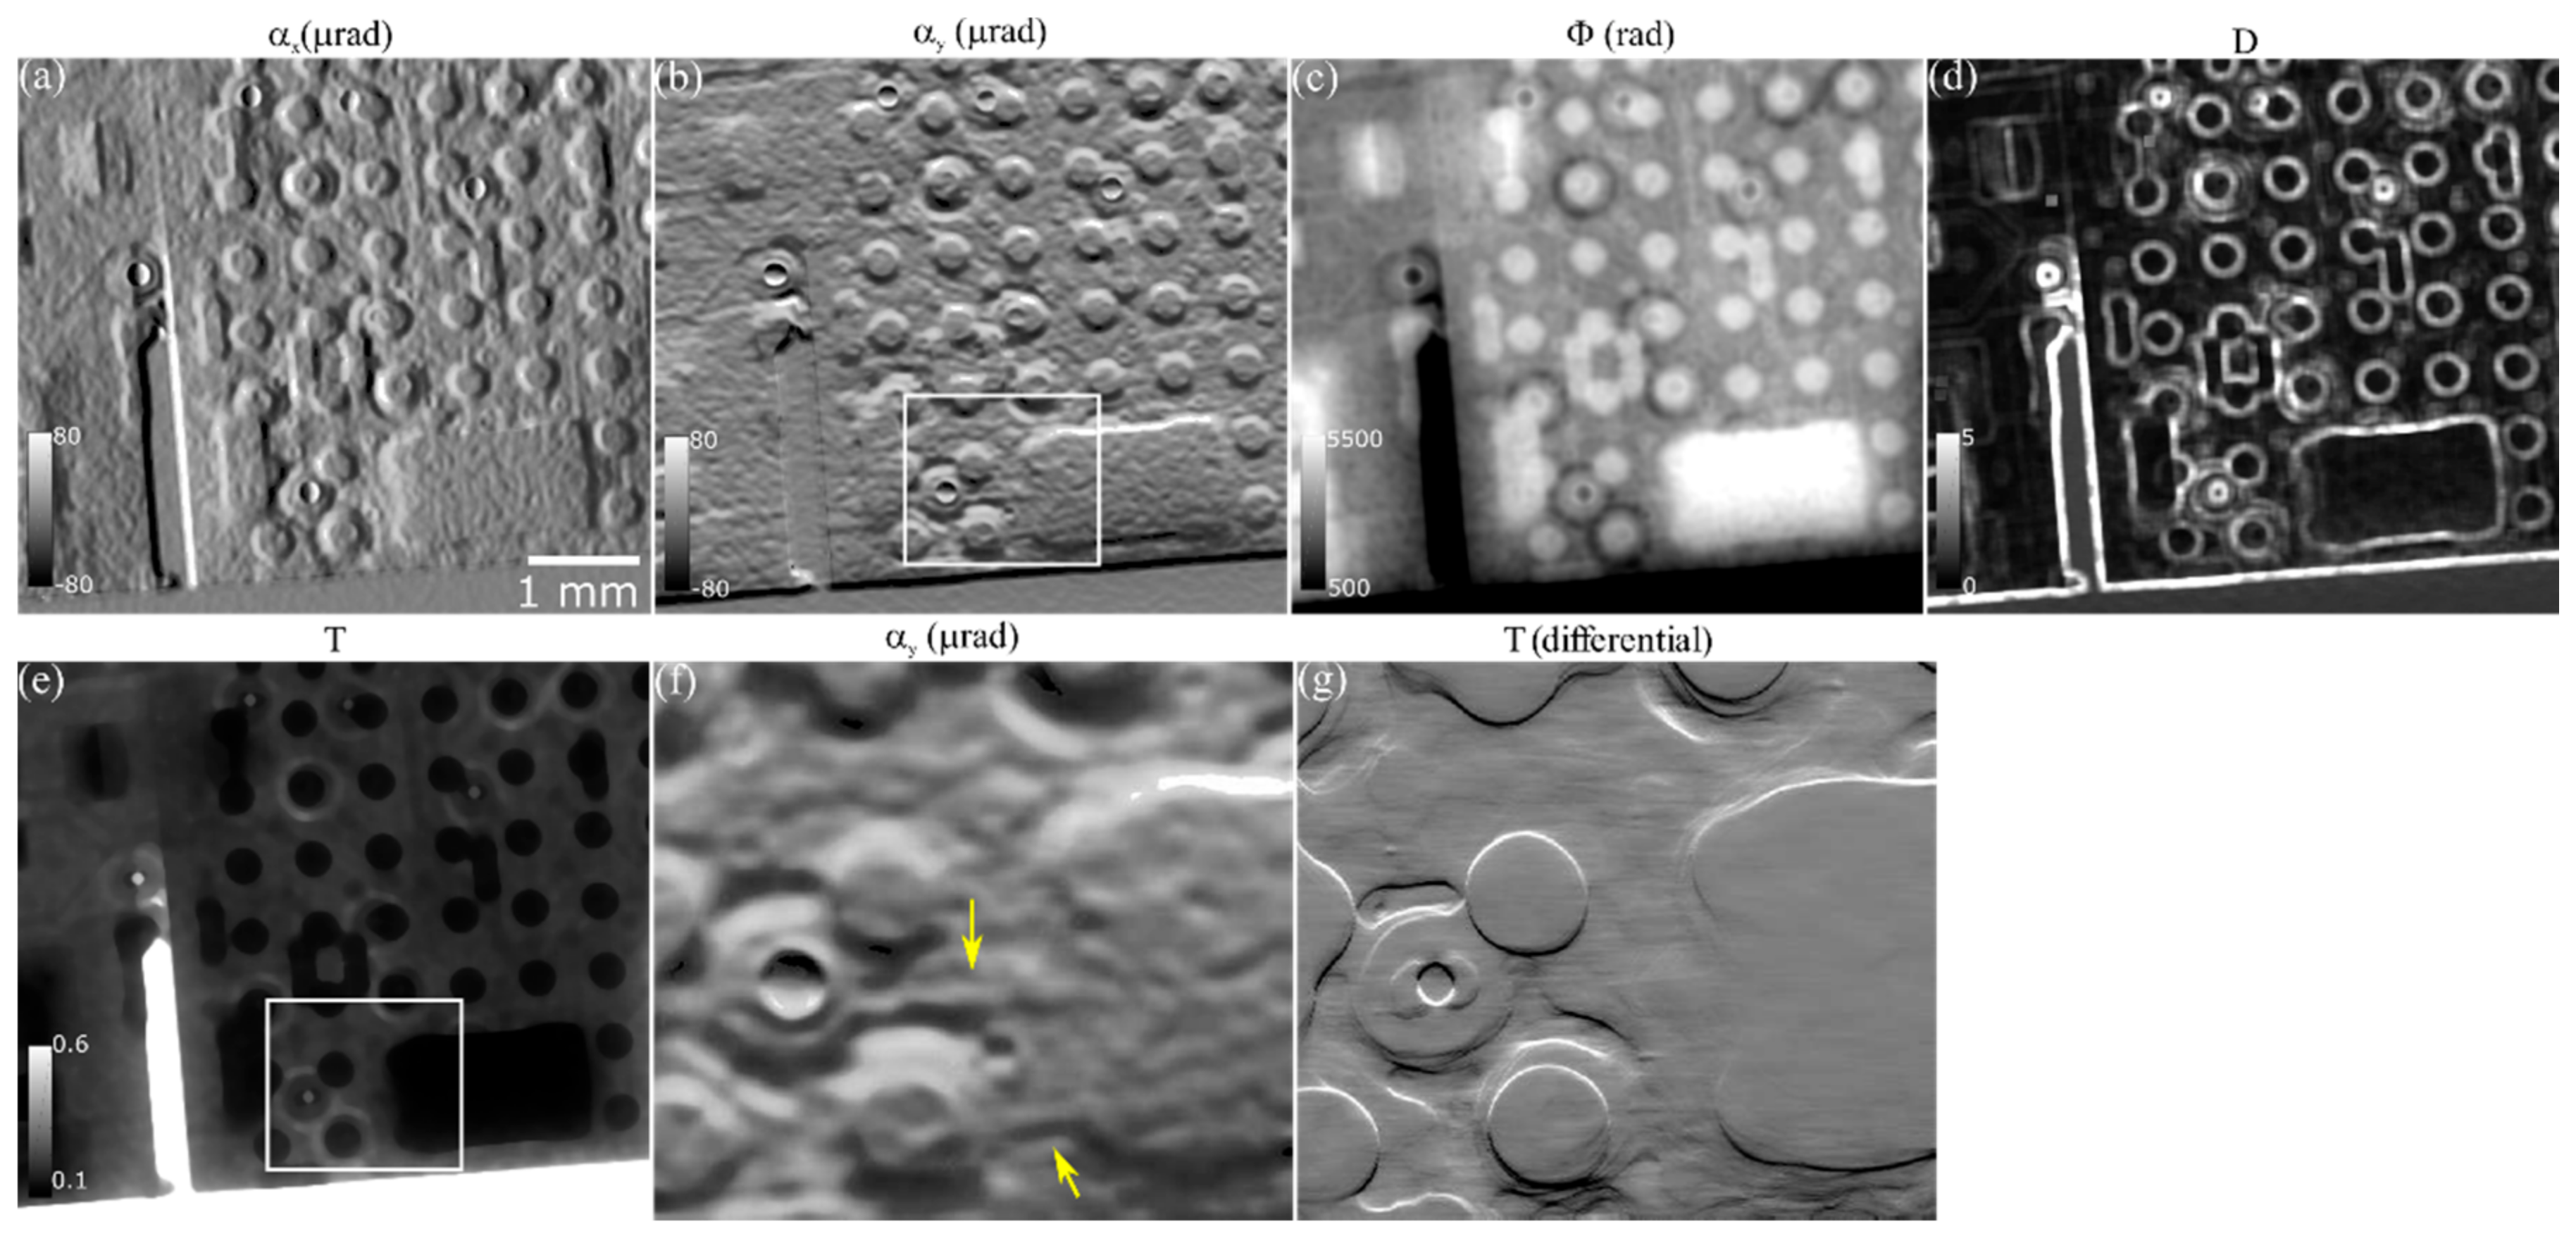
The first result presented here is the multi-contrast radiography of an IC chip. The image was acquired with an exposure time of 5 min. The imaging processing uses a cross-correlation window width of 27 pixels with hamming weighting. The choice of the subset window size is a tradeoff between the spatial resolution and the noise level [25,27]. It is flexible, with a thumb of rule of being larger than the speckle size. Figure 2 shows the results of the multi-contrast images with the refraction angle in horizontal and vertical directions shown in Figure 2a,b, respectively; the phase shift in Figure 2c, the dark-field image in Figure 2d and the transmission image in Figure 2e. Figure 2f,g are the marked areas from the refraction angle Figure 2b and the vertical differential of the transmission image Figure 2e, respectively. The differentiation is taken to have a more visually straightforward comparison with the differential of the phase signal, as the derivative of a signal has the potential of higher sensitivity to small structures. From Figure 2f, we can distinguish structures beneath the resistor, such as the example indicated by the arrows in the figure, but in Figure 2e,g, there is not enough attenuation-contrast for the structures. For a non-destructive examination of strong absorbing products, like in this example, the speckle-based technique can realize multi-contrast imaging from a single data set and provide complimentary information. Structures that cannot be identified from the conventional attenuation signal can hence be examined from signals based on other modalities. The flexible experimental arrangement and low-cost wavefront modulator can allow this technique to be easily implemented for online quality control or production monitoring in laboratories or industry.
The second example is a tomography scan of a mortar specimen. Cement mortar is one of the most commonly used construction materials. To understand the materials’ physical properties, such as strength, permeability, etc., extensive knowledge of their microstructure and composition is essential. Various imaging techniques have been applied to study the microstructure, such as light microscopy, electron microscopy, etc. [28,29]. Being non-destructive, X-ray tomography has the advantage of conserving the original state of the sample and removes the need for sophisticated sample preparation [30,31]. Attenuation contrast works well between pores and groundmass, but faces challenges distinguishing other components. XPCI has been applied on porous samples using the grating-based technique at synchrotron facility and with a conventional X-ray tube [32,33]. High resolution phase-contrast tomography has been achieved using methods such as the Zernike phase-contrast method and ptychography, at synchrotron sources [34,35]. A complex refractive index was retrieved from the phase and absorption signal. With similarities in imaging technique to the grating-based method, the speckle-based method has the potential for a similar achievement, with a more cost-efficient and more flexible manner that, offers complimentary information for laboratory non-invasive examinations.
The mortar specimen was casted following the mixing design as described below: 0.51 water-to-cement ratio by mass, 50% volumetric fraction of sand (0.3–0.4 mm average size and 1 mm maximum size) and 19% volumetric fraction of cement CEM I 52.5 N (3.13 g/cm3 density and 3440 cm2/g Blaine fineness). After being cured for 91 days, a cylindrical mortar specimen was cored out of the large specimen, while being flushed with deionized water. The sample was dried in oven at 50 °C for 5 days, and then its lateral surface was covered with a 70-µm-thick polyimide film. Before the scan, the sample was kept in a dried state.
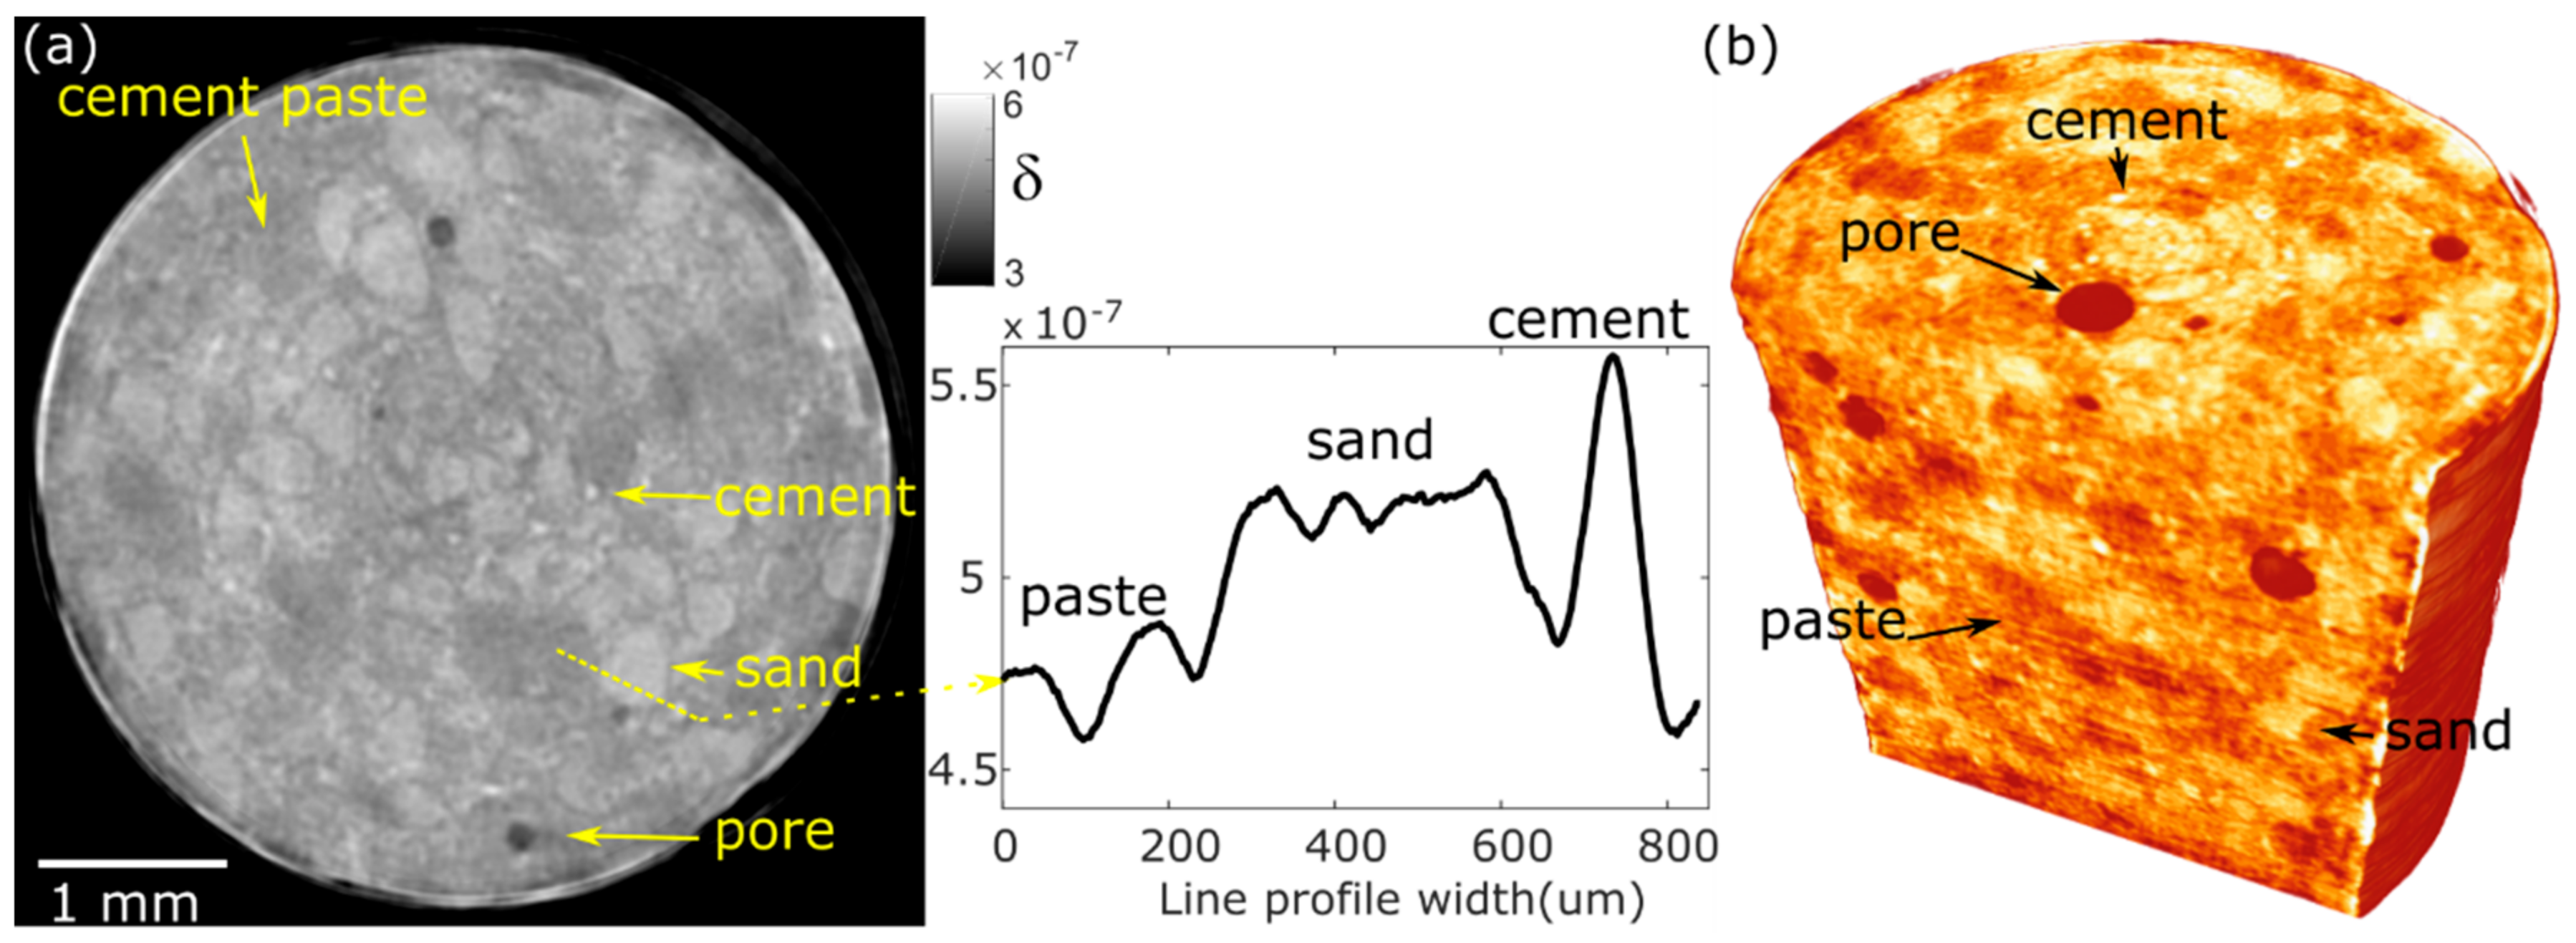
The scan was taken with 1 min exposure time for each projection and 992 projections over 360°. The width of the cross-correlation window was 33 pixels. Tomographic reconstruction of the phase images was done with Feldkamp-Davis-Kress (FDK) algorithm [36] with ram filter in Octopus software [37]. One reconstructed slice from phase data is shown in Figure 3a and the volume rendering in Figure 3b. As marked in Figure 3, from the reconstruction result we can clearly identify the different components in the sample. The brighter large particles are the sands, the brightest small particles are the unhydrated cement, the relative darker ground regions are the cement paste, and the darkest regions are the pores. The difference of the components is also shown in the line profile that passes through regions of cement paste, sand and cement, in the inset of Figure 3a. Some artefacts observed at the outer part of the sample as bright edges were induced by the strong edge enhancements due to the rapid phase change at the edge of the sample. It has been shown that these artefacts can be reduced by using the images with sample in the beam instead of the flatfield image in the processing algorithm to remove the edge enhancements [38]. The oscillation observed in the line profile in the cement paste and sand are partially due to the uncorrected ring artifact and the pores that are unresolved by the imaging system presented. The cement paste region, which has higher level gray value oscillation, in particular contains the pores that have a size of nm to tens of µm, which are far below the resolution of imaging system, but may shift the gray value. In addition, there might be unhydrated cement particles, which are below the level of spatial resolution. Due to these artifacts, the result presented here may not be highly quantitatively accurate, however it demonstrates the potential of applying the speckle-based imaging on tomography on a laboratory source towards high energies with future improvement.
Compared to previous study from Prade et al. [33], the source used in this study had over 10 times less power and effective pixel size that was about 30 times smaller. A longer exposure time was therefore needed. As rapid developments occur in X-ray tube research, there are already microfocus sources with higher power on market than the conventional tube used in Ref. [33], such as the metal-jet source. With a more powerful source, a more efficient detector, and without the absorption of the source and analyzer gratings as in the grating-based method, the speckle-based technique has the potential to have comparable or even shorter exposure time than in Ref. [33]. The spatial resolution for speckle tracking technique here is largely limited by the correlation window size but can be largely improved by using extra stages to scan the wavefront modulator, e.g., in 1D, 2D raster or a non-gird scheme [26,39,40]. The speckle size and visibility also affect the spatial resolution and noise level [24,25], which can be adjusted by changing to different diffusers for other applications.
4. Conclusions
The speckle-based imaging has been implemented on a laboratory source with an average energy of 40 keV. The results of the multi-contrast signal of a chip show structures which otherwise cannot be seen by conventional attenuation-contrast imaging. A first demonstration of a tomography of a cement mortar sample on a laboratory system using the speckle-based technique towards high energies has been presented. It shows the applicability of the technique for volumetric reconstructing of porous and composite materials. As the image quality can be further improved by utilizing a higher-power source, more efficient detector, scanning scheme, etc., the speckle-based technique shows potential to be widely applied in the future for non-destructive imaging for industry and research in material science.
Author Contributions
T.Z. and F.Y. conceived, designed and performed the experiments; R.K. assisted conducting the experiments; T.Z. and F.Y. analyzed the data; T.Z., H.W., F.Y. and R.K. contributed the formation of the paper.
Acknowledgments
We acknowledge the financial support of the Swiss National Science Foundation (project numbers 143782 and 162572) and of the Helmholtz Virtual Institute for New X-ray analytic Methods in Materials Science (VI-NXMM). Part of this work was performed by the use of the Empa Platform for Image Analysis, http://empa.ch/web/s499/software-/-imaging-platform, at Empa’s Center for X-ray Analytics. We would like to thank Carmelo Di Bella for the help in the preparation of the mortar specimens. We acknowledge Pietro Lura and Michele Griffa for the support of the project and help in manuscript preparation.
Conflicts of Interest
The authors declare no conflict of interest. The founding sponsors had no role in the design of the study; in the collection, analyses, or interpretation of data; in the writing of the manuscript, and in the decision to publish the results.
References
- Diemoz, P.C.; Bravin, A.; Sztrokay-Gaul, A.; Ruat, M.; Grandl, S.; Mayr, D.; Auweter, S.; Mittone, A.; Brun, E.; Ponchut, C.; et al. A method for high-energy, low-dose mammography using edge illumination X-ray phase-contrast imaging. Phys. Med. Biol. 2016, 61, 8750–8761. [Google Scholar] [CrossRef] [PubMed]
- Als-Nielsen, J.; McMorrow, D. Elements of Modern X-ray Physics; John Wiley and Sons: Hoboken, NJ, USA, 2001. [Google Scholar]
- Zhihua, Q.; Joseph, Z.; Nicholas, B.; Guang-Hong, C. Quantitative imaging of electron density and effective atomic number using phase contrast ct. Phys. Med. Biol. 2010, 55, 2669. [Google Scholar]
- Raupach, R.; Flohr, T. Performance evaluation of X-ray differential phase contrast computed tomography (PCT) with respect to medical imaging. Med. Phys. 2012, 39, 4761–4774. [Google Scholar] [CrossRef] [PubMed]
- Lundstrom, U.; Larsson, D.H.; Burvall, A.; Takman, P.A.C.; Scott, L.; Brismar, H.; Hertz, H.M. X-ray phase contrast for CO2 microangiography. Phys. Med. Biol. 2012, 57, 2603. [Google Scholar] [CrossRef] [PubMed]
- Zambelli, J.; Bevins, N.; Qi, Z.H.; Chen, G.H. Radiation dose efficiency comparison between differential phase contrast CT and conventional absorption CT. Med. Phys. 2010, 37, 2473–2479. [Google Scholar] [CrossRef] [PubMed]
- Momose, A. Recent advances in X-ray phase imaging. Jpn. J. Appl. Phys. 2005, 44, 6355–6367. [Google Scholar] [CrossRef]
- Endrizzi, M. X-ray phase-contrast imaging. Nucl. Instrum. Methods Phys. Res. A 2018, 878, 88–98. [Google Scholar] [CrossRef]
- Bonse, U.; Hart, M. An X-ray interferometer. Appl. Phys. Lett. 1965, 6, 155–156. [Google Scholar] [CrossRef]
- Chapman, D.; Thomlinson, W.; Johnston, R.E.; Washburn, D.; Pisano, E.; Gmur, N.; Zhong, Z.; Menk, R.; Arfelli, F.; Sayers, D. Diffraction enhanced X-ray imaging. Phys. Med. Biol. 1997, 42, 2015–2025. [Google Scholar] [CrossRef] [PubMed]
- Wilkins, S.W.; Gureyev, T.E.; Gao, D.; Pogany, A.; Stevenson, A.W. Phase-contrast imaging using polychromatic hard X-rays. Nature 1996, 384, 335–338. [Google Scholar] [CrossRef]
- Pfeiffer, F.; Weitkamp, T.; Bunk, O.; David, C. Phase retrieval and differential phase-contrast imaging with low-brilliance X-ray sources. Nat. Phys. 2006, 2, 258–261. [Google Scholar] [CrossRef]
- Zanette, I.; Zhou, T.; Burvall, A.; Lundström, U.; Larsson, D.H.; Zdora, M.; Thibault, P.; Pfeiffer, F.; Hertz, H.M. Speckle-based X-ray phase-contrast and dark-field imaging with a laboratory source. Phys. Rev. Lett. 2014, 112, 253903. [Google Scholar] [CrossRef] [PubMed]
- Olivo, A.; Speller, R. A coded-aperture technique allowing X-ray phase contrast imaging with conventional sources. Appl. Phys. Lett. 2007, 91, 074106. [Google Scholar] [CrossRef]
- Parham, C.; Zhong, Z.; Connor, D.M.; Chapman, L.D.; Pisano, E.D. Design and implementation of a compact low-dose diffraction enhanced medical imaging system. Acad. Radiol. 2009, 16, 911–917. [Google Scholar] [CrossRef] [PubMed]
- Epple, F.M.; Ehn, S.; Thibault, P.; Koehler, T.; Potdevin, G.; Herzen, J.; Pennicard, D.; Graafsma, H.; Noel, P.B.; Pfeiffer, F. Phase unwrapping in spectral X-ray differential phase-contrast imaging with an energy-resolving photon-counting pixel detector. IEEE Trans. Med. Imaging 2015, 34, 816–823. [Google Scholar] [CrossRef] [PubMed]
- Morgan, K.S.; Paganin, D.M.; Siu, K.K.W. X-ray phase imaging with a paper analyzer. Appl. Phys. Lett. 2012, 100, 124102–124104. [Google Scholar] [CrossRef]
- Berujon, S.; Ziegler, E.; Cerbino, R.; Peverini, L. Two-dimensional X-ray beam phase sensing. Phys. Rev. Lett. 2012, 108, 158102. [Google Scholar] [CrossRef] [PubMed]
- Wang, H.; Kashyap, Y.; Cai, B.; Sawhney, K. High energy X-ray phase and dark-field imaging using a random absorption mask. Sci. Rep. 2016, 6, 30581. [Google Scholar] [CrossRef] [PubMed]
- Thuring, T.; Abis, M.; Wang, Z.; David, C.; Stampanoni, M. X-ray phase-contrast imaging at 100 keV on a conventional source. Sci. Rep. 2014, 4, 5198. [Google Scholar] [CrossRef] [PubMed] [Green Version]
- Hernandez, A.M.; Boone, J.M. Tungsten anode spectral model using interpolating cubic splines: Unfiltered X-ray spectra from 20 kV to 640 kV. Med. Phys. 2014, 41, 042101. [Google Scholar] [CrossRef] [PubMed]
- FEPA-Standard. Available online: https://www.fepa-abrasives.com/abrasive-products/grains (accessed on 10 May 2018).
- The Commonly Used Grading System for Steel Wool Fibre Thickness Can Be Found for Example in the Engineering Toolbox as a Reference. Available online: https://www.engineeringtoolbox.com/steel-wool-grades-d_1619.html (accessed on 10 May 2018).
- Pan, B.; Xie, H.-M.; Xu, B.-Q.; Dai, F.-L. Performance of sub-pixel registration algorithms in digital image correlation. Meas. Sci. Technol. 2006, 17, 1615. [Google Scholar]
- Zhou, T.; Zdora, M.C.; Zanette, I.; Romell, J.; Hertz, H.M.; Burvall, A. Noise analysis of speckle-based X-ray phase-contrast imaging. Opt. Lett. 2016, 41, 5490–5493. [Google Scholar] [CrossRef] [PubMed]
- Berujon, S.; Wang, H.; Sawhney, K. X-ray multimodal imaging using a random-phase object. Phys. Rev. A 2012, 86, 063813. [Google Scholar] [CrossRef]
- Pan, B.; Xie, H.M.; Wang, Z.Y.; Qian, K.M.; Wang, Z.Y. Study on subset size selection in digital image correlation for speckle patterns. Opt. Express 2008, 16, 7037–7048. [Google Scholar] [CrossRef] [PubMed]
- Scrivener, K.L.; Gartner, E.M. Microstructural gradients in cement paste around aggregate particles. MRS Proc. 1987, 114. [Google Scholar] [CrossRef]
- Leemann, A.; Münch, B.; Gasser, P.; Holzer, L. Influence of compaction on the interfacial transition zone and the permeability of concrete. Cem. Concr. Res. 2006, 36, 1425–1433. [Google Scholar] [CrossRef]
- Bentz, D.P.; Martys, N.S.; Stutzman, P.; Levenson, M.S.; Garboczi, E.J.; Dunsmuir, J.; Schwartz, L.M. X-ray microtomography of an ASTM C109 mortar exposed to sulfate attack. MRS Proc. 1995, 370, 77–82. [Google Scholar] [CrossRef]
- Chotard, T.J.; Boncoeur-Martel, M.P.; Smith, A.; Dupuy, J.P.; Gault, C. Application of X-ray computed tomography to characterise the early hydration of calcium aluminate cement. Cem. Concr. Compos. 2003, 25, 145–152. [Google Scholar] [CrossRef]
- Sarapata, A.; Ruiz-Yaniz, M.; Zanette, I.; Rack, A.; Pfeiffer, F.; Herzen, J. Multi-contrast 3D X-ray imaging of porous and composite materials. Appl. Phys. Lett. 2015, 106, 154102. [Google Scholar] [CrossRef]
- Prade, F.; Fischer, K.; Heinz, D.; Meyer, P.; Mohr, J.; Pfeiffer, F. Time resolved X-ray dark-field tomography revealing water transport in a fresh cement sample. Sci. Rep. 2016, 6, 29108. [Google Scholar] [CrossRef] [PubMed]
- Trtik, P.; Soos, M.; Munch, B.; Lamprou, A.; Mokso, R.; Stampanoni, M. Quantification of a single aggregate inner porosity and pore accessibility using hard X-ray phase-contrast nanotomography. Langmuir 2011, 27, 12788–12791. [Google Scholar] [CrossRef] [PubMed]
- Cuesta, A.; De la Torre, A.; Santacruz, I.; Trtik, P.; Da Silva, J.; Diaz, A.; Holler, M.; Aranda, M. In situ hydration imaging study of a ye’elimite paste by ptychographic X-ray computed tomography. In Proceedings of the 39 International Conference on Cement Microscopy, Toronto, ON, Canada, 10–13 April 2017. [Google Scholar]
- Feldkamp, L.A.; Davis, L.C.; Kress, J.W. Practical cone-beam algorithm. J. Opt. Soc. Am. A 1984, 1, 612–619. [Google Scholar] [CrossRef]
- Vlassenbroeck, J.; Dierick, M.; Masschaele, B.; Cnudde, V.; Hoorebeke, L.; Jacobs, P. Software tools for quantification of X-ray microtomography. Nucl. Instrum. Methods Phys. Res. A 2007, 580, 442–445. [Google Scholar] [CrossRef]
- Wang, F.X.; Wang, Y.D.; Wei, G.X.; Du, G.H.; Xue, Y.L.; Hu, T.; Li, K.; Deng, B.; Xie, H.L.; Xiao, T.Q. Speckle-tracking X-ray phase-contrast imaging for samples with obvious edge-enhancement effect. Appl. Phys. Lett. 2017, 111, 174101. [Google Scholar] [CrossRef]
- Wang, H.; Kashyap, Y.; Sawhney, K. From synchrotron radiation to lab source: Advanced speckle-based X-ray imaging using abrasive paper. Sci. Rep. 2016, 6, 20476. [Google Scholar] [CrossRef] [PubMed]
- Zdora, M.-C.; Thibault, P.; Zhou, T.; Koch, F.J.; Romell, J.; Sala, S.; Last, A.; Rau, C.; Zanette, I. X-ray phase-contrast imaging and metrology through unified modulated pattern analysis. Phys. Rev. Lett. 2017, 118, 203903. [Google Scholar] [CrossRef] [PubMed]
Figure 1.
(a) Illustration of the experimental alignment. X-ray image of (b) sandpaper and (c) steel wool, and profiles from the dashed lines.
Figure 1.
(a) Illustration of the experimental alignment. X-ray image of (b) sandpaper and (c) steel wool, and profiles from the dashed lines.

Figure 2.
The multimodal images of a chip retrieved from the speckle-based imaging method: (a) refraction angle in horizontal and (b) in vertical direction, (c) phase shift (d) dark-field signal and (e) transmission image. (f) shows the refraction angle in vertical direction of the zoomed region in (b), and (g) is the transmission signal differentiated in vertical direction from the region of interest from (e).

Figure 3.
(a) Reconstructed tomographic slice of phase image of a mortar specimen. Inset shows the intensity profile of the dashed line marked in the slice. (b) Volume rendering from the reconstructed tomography.
Figure 3.
(a) Reconstructed tomographic slice of phase image of a mortar specimen. Inset shows the intensity profile of the dashed line marked in the slice. (b) Volume rendering from the reconstructed tomography.
© 2018 by the authors. Licensee MDPI, Basel, Switzerland. This article is an open access article distributed under the terms and conditions of the Creative Commons Attribution (CC BY) license (http://creativecommons.org/licenses/by/4.0/).
Share and Cite
MDPI and ACS Style
Zhou, T.; Yang, F.; Kaufmann, R.; Wang, H. Applications of Laboratory-Based Phase-Contrast Imaging Using Speckle Tracking Technique towards High Energy X-Rays. J. Imaging 2018, 4, 69. https://doi.org/10.3390/jimaging4050069
AMA Style
Zhou T, Yang F, Kaufmann R, Wang H. Applications of Laboratory-Based Phase-Contrast Imaging Using Speckle Tracking Technique towards High Energy X-Rays. Journal of Imaging. 2018; 4(5):69. https://doi.org/10.3390/jimaging4050069
Chicago/Turabian StyleZhou, Tunhe, Fei Yang, Rolf Kaufmann, and Hongchang Wang. 2018. "Applications of Laboratory-Based Phase-Contrast Imaging Using Speckle Tracking Technique towards High Energy X-Rays" Journal of Imaging 4, no. 5: 69. https://doi.org/10.3390/jimaging4050069
Note that from the first issue of 2016, this journal uses article numbers instead of page numbers. See further details here.