Detection of Orientation-Modulation Embedded Data in Color Printed Natural Images

Department of Computer Science, Norwegian University of Science and Technology, 2815 Gjovik, Norway
*
Author to whom correspondence should be addressed.
J. Imaging 2018, 4(4), 56; https://doi.org/10.3390/jimaging4040056
Submission received: 10 March 2018
/
Revised: 27 March 2018
/
Accepted: 29 March 2018
/
Published: 4 April 2018
(This article belongs to the Special Issue Computational Colour Imaging)
Abstract
:This article addresses methods for detection of orientation-modulation data embedded in color dispersed-dot-halftone images. Several state-of-the-art methods for detection of orientation-embedded data in printed halftone images have been proposed, however they have only been evaluated independently without comparing with each other. We propose an improved detection method, which is using Principal Component Analysis (PCA) components as oriented-feature extractors, and a probabilistic model for the print-and-scan channel for maximum likelihood detection. The proposed detector and four state-of-the-art detectors are compared with each other in terms of correct detection rate, using a comprehensive testing set of printed natural images captured with three different devices. The proposed detector achieves highest correct detection rate using fewer feature extractors than the other methods, and it is significantly more robust to non-calibrated devices used for capturing the printed images. This is mostly due to the improved PCA-based oriented-feature extractors that are responsive to the embedded orientations and robust and insensitive to the other visual content.
1. Introduction
Techniques for embedding hidden data in to-be-printed content have been studied for the past few decades. Such embedded data may be used in different ways and applications, including: authentication of a document content, as additional layer of protection against document copy-attack, or simply as digital identifiers in applications where barcodes or Quick Response (QR) codes are actively used nowadays. The printing process normally introduces significant amount of distortion to data embedded in continuous-tone images, so techniques that do not account for the properties of the printing channel may not be optimal in rate/distortion terms. A typical printing workflow includes a step named halftoning, which is the process of converting a continuous-tone (contone), normally 8-bits per colorant channel input image, to a binary, 1-bit per colorant channel, halftone image [1]. Binarized halftone images can be easily handled by most off-the-shelf printers as they are binary devices themselves—during the printing process, at any addressable location on the printing substrate, the printer either deposits a colorant dot or not. The halftoning step can be seen as a heavy quantization that could have severe impact on previously embedded data. In order to increase the robustness of embedded data in to-be-printed images, the data embedding can be done during or after the halftoning step.
Methods for data embedding in halftones have been proposed for different underlying halftoning algorithms. A selected overview include data hiding techniques based on ordered dither halftoning [2,3], error diffusion halftoning [4,5,6], direct binary search (DBS) halftoning [7,8,9], or clustered-dot halftoning [10,11,12]. Most of these methods embed data by enforcing certain criteria on isolated printer dots (halftone pixels or halftone cells), which makes the extraction of embedded data sensitive to synchronization/focus—the data extraction from prints is effectively possible using scanners and very difficult using consumer cameras or smartphone cameras. Guo et al. [13] proposed a data hiding method in dispersed-dot DBS halftones, which embeds oriented features in an arbitrary halftone block that may contain hundreds or few thousands halftone pixels. This method is named orientation modulation (OM), it offers flexibility regarding the printed size and the strength of the embedded oriented features, and hence, the capture device used for data detection/extraction. This OM method was later extended to color images by embedding oriented features in the chromatic channels only [14], and it is based on the color direct binary search (CDBS) halftoning algorithm [15]. The data capacity of such CDBS-OM embedded data, depending on the size and strength of the oriented embedded features, ranges from few dozens to few hundreds bits per square inch of printed image area [14]. This opens the possibility of using CDBS-OM watermarked images in many camera-based applications where existing barcode or QR-codes are used, such as: marketing/advertising, ticketing, packaging, IDs and passports, documents and certificates, or supply chain management.
This work is focused on the detection of CDBS-OM embedded data in chrominance channels of color printed images. The originally proposed method [14] uses PCA-based oriented feature extractors in a simple correlation-based detector that does not use any knowledge about the print-and-scan channel. Other relevant detection strategies are using reconstruction error from sparse dictionaries learned for each orientation [16], least means squares (LMS) filters as oriented feature extractors [13], or image moments as orientation descriptors [10]. The last two detectors use a probabilistic model for the print-and-scan channel, the last three detectors have been proposed and evaluated for monochromatic printed images only, and all four detectors have been evaluated using only scanned images. The aim of this work is to propose an efficient and robust method for detection of CDBS-OM embedded data in color printed images captured using wider range of capture devices, and evaluate its performance on a large image dataset with respect to relevant state-of-the-art detection methods. The proposed method is using PCA-based oriented feature extractors, and maximum likelihood (ML) detection based on a probabilistic model for the print-and-scan communication channel. We show that PCA can be used to reduce the number of oriented feature extractors, which decreases the computational complexity of the detector. The comparison with the state-of-the-art detectors shows that the proposed PCA-based feature extractors, together with a probabilistic model for the data communication print-and-scan channel and ML detection, achieve the highest correct detection rate and they are significantly more robust to the scan/capture part of the print-and-scan channel.
2. Materials and Methods
2.1. Data Embedding Using Orientation Modulation Based on CDBS Halftoning
The color direct binary search algorithm is an iterative, dispersed-dot type, halftoning algorithm that minimizes the difference between the perceived contone image and the perceived halftone image. These perceived images are obtained by converting the contone and the halftone to the color space used for difference minimization and filtering them with point-spread functions (PSFs) that model the low-pass nature of the human visual system [15]. During the iterations over all of the halftone pixels, two types of halftone changes are evaluated: a ‘toggle’—the current halftone pixel is changed to all the other possible values, and a ‘swap’—the current halftone pixel is swapped with all the pixels from a pre-defined (usually 3 × 3) neighborhood. These potential halftone changes are evaluated in terms of the impact on the minimization cost—the difference between the perceived images. The change that causes the largest cost decrease is accepted and the halftone is updated with the change. This process is repeated for every halftone pixel in several iterations until no halftone pixel changes may further decrease the cost.
The data embedding in CDBS-OM is performed by embedding oriented features in the chrominance channels of the block-segmented halftone. This is achieved by orienting the chrominance point-spread functions that are used for obtaining the perceived images in the CDBS halftoning method. The flowchart of this process is shown on Figure 1 where modulating the orientation of the chrominance PSFs according to the to-be-embedded watermark data is shown within the whole CDBS iterative framework. For analytical formulations of the CDBS and the oriented PSFs, the reader is referred to [14]. Briefly, the embedding is performed by segmenting the halftone into M × N blocks and using one of the n different oriented PSFs (according to the n-ary to-be-embedded data) for each block in each of the two chrominance channels during the CDBS iterations. These oriented PSFs enforce the orientation of the perceived error during the iterations. The resulting halftone texture is coarser in the orientation of the point-spread function, but it is smoother in the perpendicular orientation. That can be easily detected in frequency domain because of lower energy concentration in the smoothening spatial orientation. In order to embed oriented features in the chrominance channels using the CDBS-OM method, the iterative minimization needs to be performed in an opponent color space. In this work, we use the YyCxCz color space [17]. We also use the 2 × 2 dot-centered printer model [18] to predict the printer output using 2 × 2 halftone cells.
Figure 2 shows an example of two different oriented features embedded in the two chrominance channels of the same halftone block—they can be seen both in spatial and in frequency domain. The embedded oriented features (oriented at 45° and 135°) are obtained via CDBS-OM using two different oriented PSFs for the red-green (Cx) and the blue-yellow (Cz) chrominance channels of the halftone block.
2.2. State of the Art Detection Methods for OM Embedded Data
This subsection briefly describes relevant state-of-the-art methods for detecting embedded oriented features in printed images. In the evaluation section of this paper, we compare all of them to our proposed detection method. Given that some of these methods were not originally proposed for color images or for dispersed-dot halftones, here we also specify their extension to our scenario.
2.2.1. LMS Trained Filters
The originally proposed orientation modulation method for data hiding in dispersed-dot halftones uses LMS trained filters as oriented feature extractors [13]. The LMS-filters are trained from the magnitude of the Discrete Fourier Transform (DFT) of the watermarked halftone blocks, and a separate LMS-filter is trained for each of the embeddable orientations. In the training process for orientation , a gradient-based approach is used for minimizing the squared difference between the trained LMS-filter and the training halftone blocks for the orientation , while maximizing the squared difference from all the other embeddable orientations. The extracted feature is the cross-correlation score (the scalar product) between the LMS-filters and the testing halftone block. These single-number features are extracted for each possible (embeddable) orientation and they are used for maximum likelihood (ML) detection of the embedded orientation:
In Equation (1), is the detected orientation in the testing block, is the LMS-filter for orientation , is the magnitude of the discrete Fourier transform of the testing block, is the extracted feature—their cross-correlation score, and is the probability density of the extracted feature using LMS-filter for orientation when the embedded orientation is .
This detection method was originally proposed for grayscale dispersed-dot halftones. We extended them to the CDBS-OM color halftones in the following way: the LMS-filters are trained from the block-DFT representation of the chrominance channels of the CDBS-OM halftones; then a joint decision is made for the detected data in the two chrominance, red-green (indexed as ‘rg’) and blue-yellow (indexed as ‘by’), channels:
In Equation (2), and are the detected orientations in the two chrominance channels of the testing block, and are extracted features (cross-correlations score), i and j are indexing the orientations in the red-green and blue-yellow channels, respectively. The trained LMS-filters for the blue-yellow channel and embeddable orientations 45° and 135° are shown in Figure 3a.
We use histogram densities to estimate the probability densities in Equation (2), as that approach achieved best results in the original grayscale case.
2.2.2. PCA Components
The color extension of the orientation modulation method in dispersed-dot halftones uses PCA to learn the main components, or eigen-templates, of the watermarked halftone blocks for each embeddable orientation [14]. Similar to the previous method, these eigen-templates are calculated from the DFT-transformed watermarked blocks (with the highest frequencies removed), and the extraction of the oriented feature from the testing blocks is done using cross-correlation scores calculated between the eigen-templates for different orientations and the testing block. The sign of the eigen-templates is chosen such that the cross-correlation score is positive when their orientation matches the one embedded in the testing block. A detection metric composed of similarity and dissimilarity score, both based on cross-correlation scores, is calculated for each of the possible orientations. The embedded orientation in the testing block is decided to be the one that maximizes the detection metric :
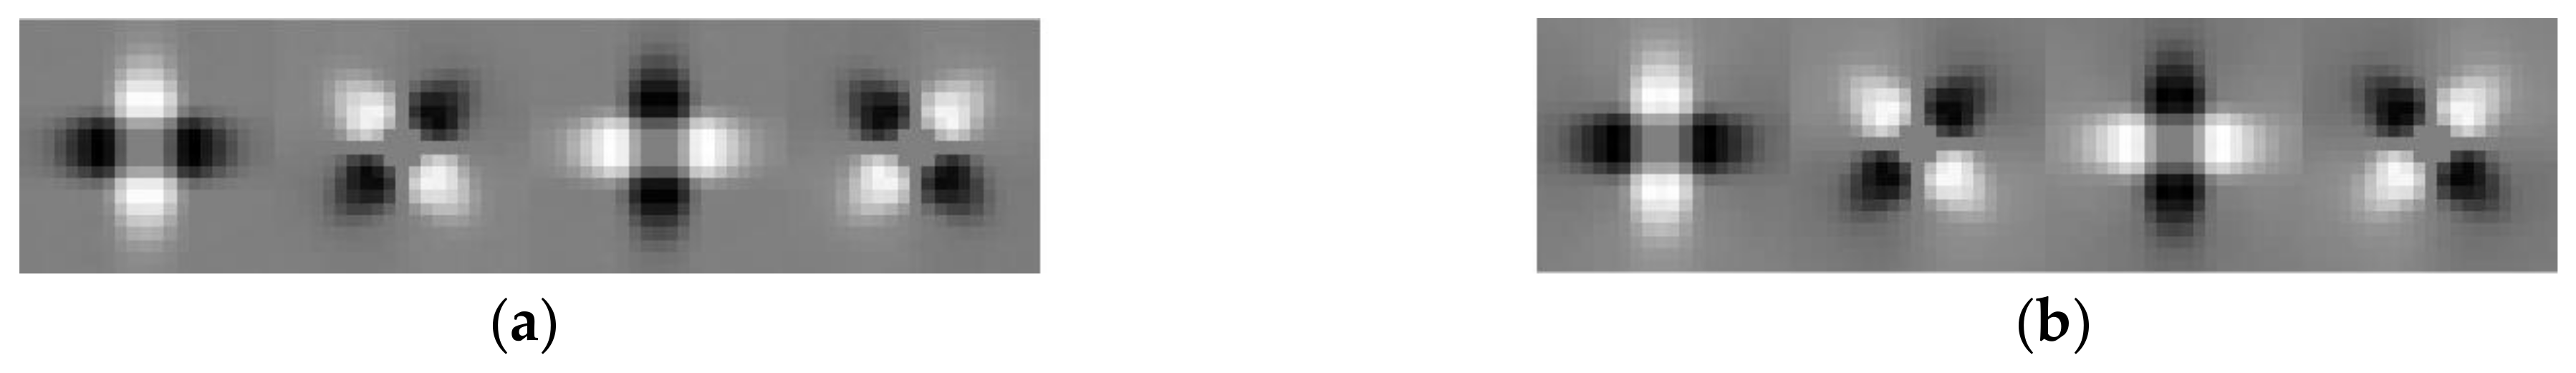
In Equation (3), is the detected orientation in the testing block , and are the k-th PCA components for the orientations θ and θ + 90°, respectively. The detection of embedded orientation is made for the two chrominance channels independently of each other. This detector uses more cross-correlation calculations per orientation than the one in Section 2.2.1, but it does not use probabilistic characterization of the chrominance print-and-scan channel. The first two eigen-templates for the blue-yellow channel, with orientations 45° and 135° are shown in Figure 3b.
2.2.3. Image Moments
An orientation modulation approach for data embedding in to-be-printed images was proposed initially for clustered-dot halftones [10,11], where the embedded oriented features are the clustered dots themselves. For detection of the orientation of each clustered dot, image moments calculated along the embeddable orientations are used as orientated feature extractors. The grayscale version of OM in clustered-dot halftones uses a probabilistic model for the OM communication channel and ML detection rule:
In Equation (4), is the detected orientation in the testing block, is the image moment calculated along orientation θi, and is the probability density of the extracted moments along orientation when the embedded orientation is θ. The extension to color is similar as in the LMS-filter detector case:
In the case of our dispersed-dot halftones, it makes sense to use image moments as orientation descriptors if they are calculated in frequency domain. An example of DFT representation of the embedded features is shown on Figure 2b,c. However, due to moment’s sensitivity to noise and poorer orientation discrimination ability in cases of more-than-two embeddable orientations [10,16], they are not suitable for orientation detection of CDBS-OM embedded data.
2.2.4. Sparse Dictionaries
Son and Choo showed that the detection of the orientation of clustered dots could be done by utilizing sparse dictionaries [16], and their approach performs significantly better than the method using image moments. A separate sparse dictionary of size is learned for each orientation θ:
In Equation (6), is a matrix whose columns (k) are filled with the training halftone blocks watermarked with specific orientation θ, is the learned sparse dictionary for orientation θ, is the matrix of representation whose columns (k) are coefficients for representation of (k) using . In other words, the sparse dictionaries are learned so that the representation error is minimized (lower than an arbitrary value of ε) while the number of non-zero (k) coefficients used for that representation is also minimized. The Equation (6) can be solved iteratively using the K-SVD algorithm [19]. The detected orientation in a testing block is decided as the one whose associated dictionary achieves minimal reconstruction error when only limited number of atoms from the dictionary are used for reconstruction:
In Equation (7), is the testing block, and is the representation column-vector with maximum non-zero coefficients. The vector is obtained using the orthogonal matching pursuit algorithm [19], and given that Equation (7) is solved for each orientation (each dictionary ) and for each testing block, it results in significantly higher computational time compared to the other detection methods. Figure 3c shows arbitrary three atoms from the dictionaries of size 32 learned from watermarked blue-yellow channel with orientations 45° and 135°. The number of atoms in the dictionary can vary typically from few dozens to few hundreds, with the overall computational requirements of the detector increasing with the number of atoms in the learned dictionaries. In order to extend this dictionary-based detection to our color, dispersed-dot case, we train the dictionaries separately for each chrominance channel and perform detection using the DFT representation of the chrominance channels of the watermarked images. The dictionaries can also be learned from spatial domain chrominance data, but on average, they performed worse using our testing parameters sets. In this work, we use them fully trained on DFT-based blocks—the same as all of the detection methods addressed in this paper.
2.3. Proposed Detection Method
2.3.1. New PCA-Based Orientation Feature Extractors
The data embedding by forcing certain oriented halftone textures through oriented PSFs in the CDBS iterative halftoning framework (Figure 1) is not direct and explicit—the final texture of the watermarked halftone block is dominantly influenced by the contone image content, and the actual instantiation of the embedded oriented feature can vary a lot among different blocks. Using PCA to learn the main components of embedded feature variation for each orientation and using those components as correlation-based feature extractors is easy to justify—the cross-correlation score is proportional to the covariance by definition, and the main PCA components capture the direction of highest variance in the training watermarked halftone blocks.
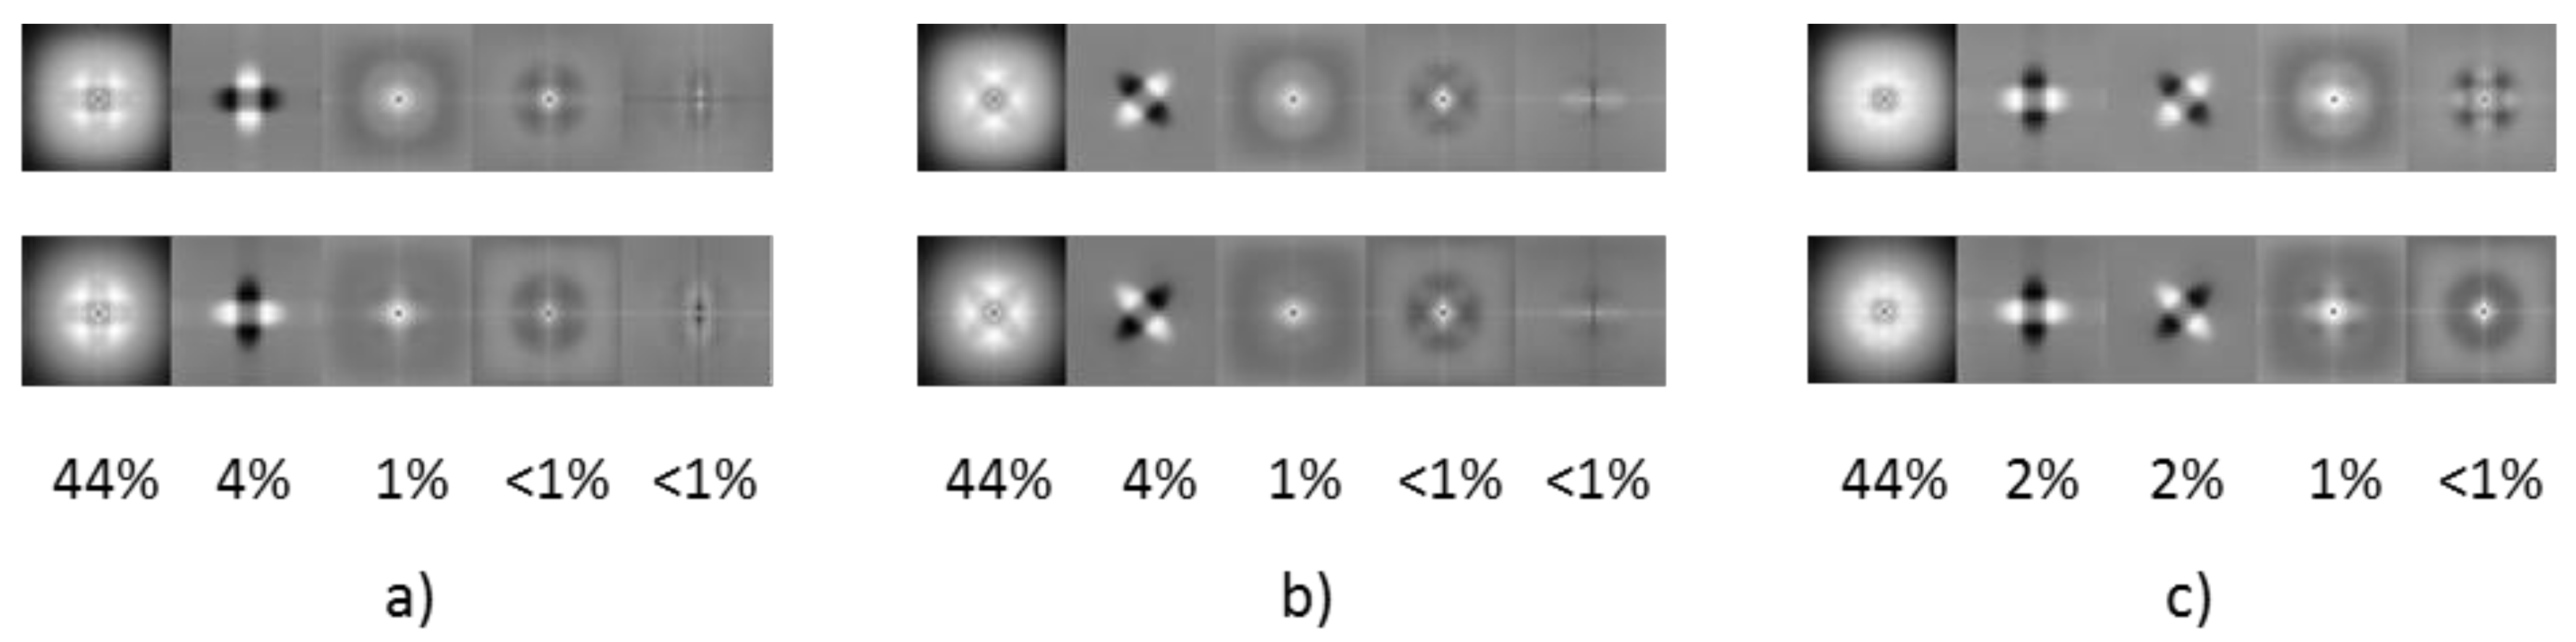
In the previously published work [10,11,13,14,16], the oriented feature extractors in the detectors are constructed separately for each of the embeddable orientations. In this work, we demonstrate the use of PCA to reduce the number of feature extractors. Instead of using separate training sets for each embeddable orientation, the training set can consist of watermarked blocks with all of the embeddable orientations (in an equal amount). PCA decomposition of such joined set results in principal components that discriminate the orientations in a more efficient way. We show three different examples in Figure 4, obtained using three training sets consisted of 11,250 watermarked blocks. In the case of two possible embeddable orientations (1 bit per block) with associated angles of 0° and 90°, we obtained the first five principal components shown in Figure 4a. Figure 4b shows the first five components when the embeddable orientations are 45° and 135°, while the case of 2 bits per block, or four embeddable orientations 0°, 45°, 90° and 135°, is shown in Figure 4c. What is common for all cases is that the first component cannot be used as an orientation discrimination feature—it captures the main direction of blocks variation regardless of the embedded orientation. The approximate explained variance is given below each of the components and it is significantly higher for the first component—we could argue that the first component captures the main direction of visual content variation. The next component, or the next two components for the 4-orientations case, efficiently captures the variation due to the orientations embedding. The gray areas in those components have values very close to zero. In the case of two orientations, the cross-correlation score between the second component and a testing block would normally be either positive and closer to one or negative and closer to minus one depending on the actual embedded orientation in the testing block. In the case of four orientations, the cross-correlation score calculated using the second component could obviously be used to discriminate between the horizontal and the vertical orientation, while the third component can be used to discriminate between the two diagonal orientations. The proposed feature extractors are those PCA components that can discriminate between at least two embeddable orientations. While it can be formally tested which of those components, starting from the first, are suitable as feature extractors, in the case of OM embedded data it is easy to select them simply by visual inspection.
2.3.2. ML Detection
The extracted features using the proposed PCA components can be used for detection of an oriented feature embedded in the testing block. However, a simple decision criterion might not be optimal, so we use a statistical model for the chrominance print-and-scan channel that acts as a transmission channel for the data between the embedder and the detector. The channel likelihood function can be modelled to be of the form that is a conditional probability density function of the extracted features and calculated in the red-green and blue-yellow chrominance channel, when the embedded orientations in those channels are and respectively. If we assume conditional independence between the extracted features in the two chrominance channels, then the channel likelihood function can be factorized as:
This assumption for conditional independence may not fully hold, however, in practice it would be difficult to estimate the channel likelihood function without making this assumption. The vectors and have as many elements as orientation feature extractors, i.e., it is a one-element vector for the 2-orientations case, two-element vector for the 4-orientations case, and so on. Without losing generality, the following presentation is tailored to the case with four orientations—our previous work [14] showed that increasing the number of embeddable orientations up to four does not have significant impact on the detector’s performance. In that case, the channel likelihood function can be written as:
In Equation (9), the indexes 1 and 2 correspond to the features extracted using the first and second PCA-based feature extractor, i.e., the second and third principal components in Figure 4c. It is safe to assume that the features extracted using different PCA components are independent—they are uncorrelated due to the PCA orthogonality property, and given that they are close to normally distributed (an example is shown in Figure 5a) we can safely assume their independence. Thus, the channel likelihood function gets the following form:
Given that in our case, each of and can have four different values, the channel likelihood function can be obtained using Equation (10) by estimating a total of 43 = 64 probability density functions. These functions are estimated via histogram densities obtained using training CDBS-OM printed and scanned images. The ML detection rule is simply the combination of orientations and that maximize the channel likelihood function:
The channel likelihood function (as in Equation (10)) can be easily derived in the same way for cases with different number of embeddable orientations. We note that we used this channel modelling approach to define the extension of LMS-filter-based detector and moments-based detector to our color case—hence the high similarity between the detection criterion in Equation (11) and the ones in Equations (2) and (5). However, for the LMS-filter-based and moments-based ML detections, the channel likelihood factorize into twice the components i.e., the number of probability density functions that need to be known is double than for the proposed detector—due to twice more orientation feature extractors (one feature extractor per embeddable orientation).
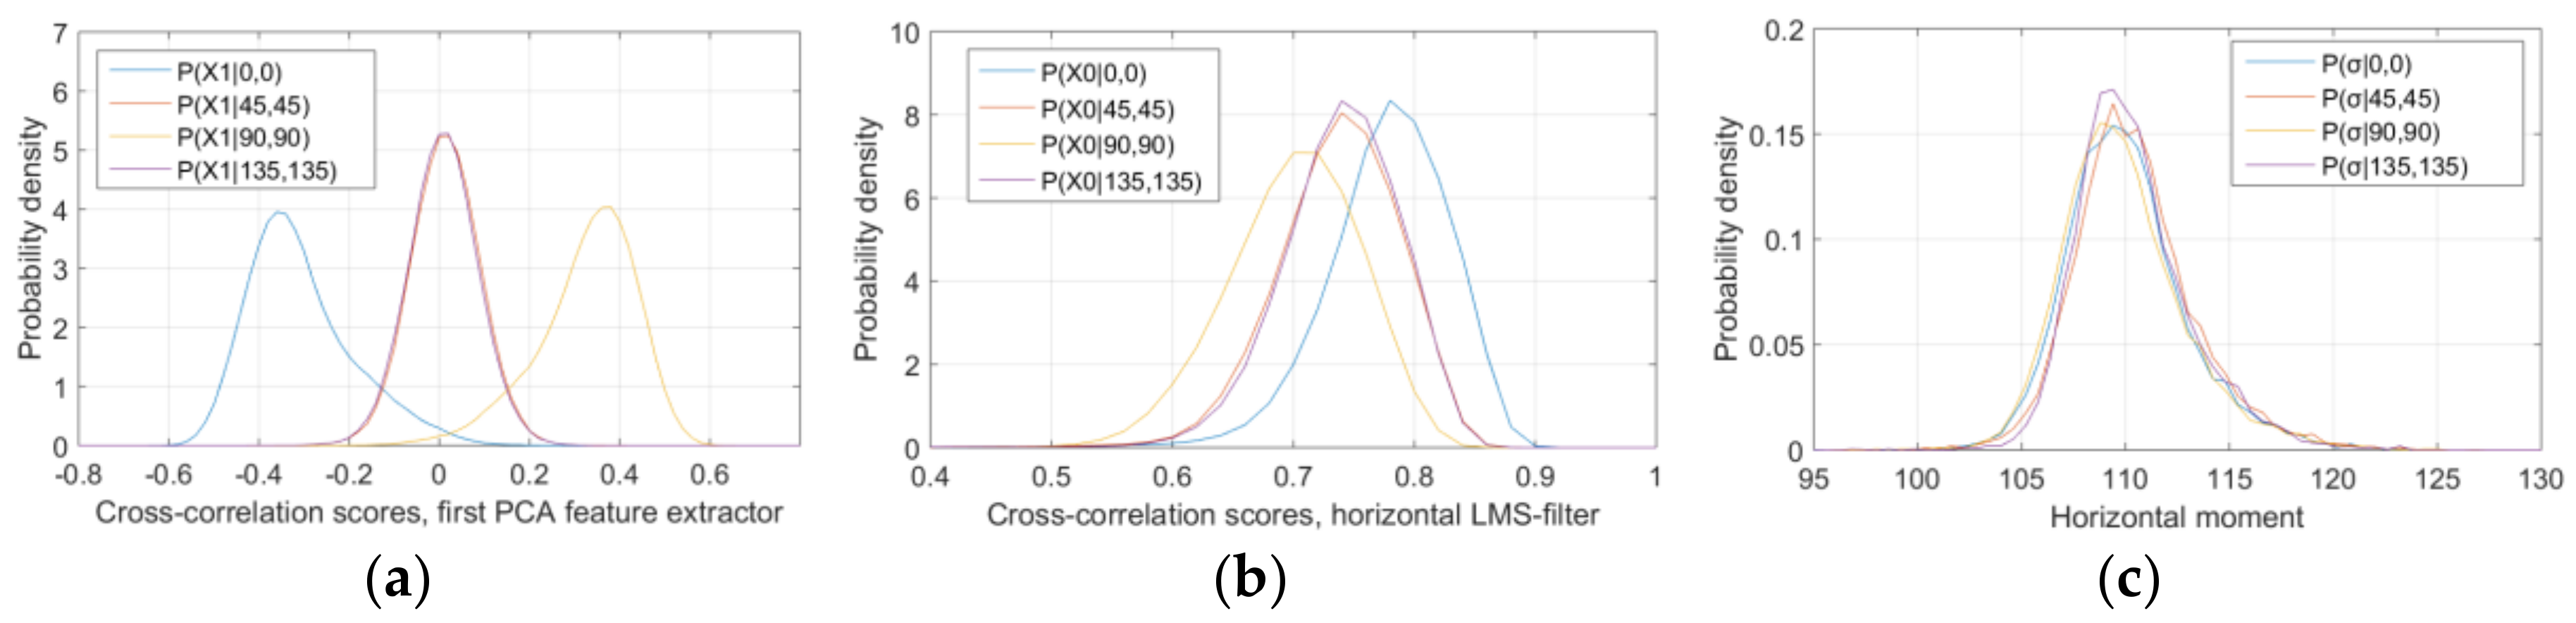
We show the estimated probability densities in the red-green Cx channel for extracted horizontal features using the proposed PCA-based extractors, LMS-filters, and image moments. Figure 5a shows the probability densities of the scores obtained using the first PCA feature extractor (second component in Figure 4c), for {0°, 45°, 90°, 135°}. It can be seen that this feature can almost fully discriminate between the horizontal and vertical embedded orientations, while the overlap between the distributions for the horizontal and both diagonal orientations is also very low. Figure 5b shows the corresponding probability densities for the extracted features using the horizontal LMS-filter for {0°, 45°, 90°, 135°}. The overlap between the densities is substantial when compared to the proposed PCA feature extractors. The maximum probability density value for the PCA-based extracted features is reached for correlation scores closer to zero when compared to the LMS-filter extracted features. This is because the proposed PCA-based extractors does not capture the main variance direction—leading to lower, in absolute values, cross-correlation scores. Figure 5c shows the estimated probability densities for {0°, 45°, 90°, 135°}. The huge overlap between the distributions indicates poor orientation discrimination ability of the horizontal image moment, and it is the same case for the other moments as well.
3. Results
In this section, we evaluate the proposed detector and compare it to the previously published types of detectors. All of the presented results are in terms of correct detection rate (CDR) defined as percentage of correctly detected oriented features from CDBS-OM watermarked printed images. For training the feature extractors and estimating the distributions in the channel likelihood functions in Equations (2), (5), and (11), we used 11250 training halftone blocks obtained from 18 images (the first 18) from the CID:IQ image dataset [20]. The feature extractors for the different detection methods, as well as the dictionaries, were obtained/trained from digital watermarked halftones. The feature distributions for the ML detectors were obtained from printed and 600 dpi-scanned watermarked halftone images. For testing the detectors performance, we used 54 natural images: the 24 images from the Kodak dataset [21] and the 30 images from the CSIQ dataset [22]. In all of the tests, we used random quaternary watermark data i.e., embedded features with four equally-probable different orientations (0°, 45°, 90°, 135°). The halftone block size per embedded oriented feature was M × N = 32 × 32. The size of the Kodak images is 768 × 512 pixels, while the CSIQ images, originally 512 × 512 pixels, were scaled to 640 × 640 pixels so they can carry approximately the same number of embedded features as the images from the Kodak dataset. The watermark quality factor [14] was set to η = 2.5. All of the images were printed through the Caldera RIP software at 300 dpi on the HP Premium Matte Photo Paper using the HP Designjet Z3200 printer (HP Inc., Palo Alto, CA, USA). For the dictionary-based detection, Equations (6) and (7) were solved using the open-source implementation [23].
For scanning/capturing the watermarked printed images, we used three different devices: Epson 10000XL scanner (Seiko Epson Co., Ltd., Tokyo, Japan), Canon Powershoot A700 compact 6 mega-pixels camera (Canon Co., Ltd., Tokyo, Japan), and Huawei Honor 7 smartphone 20 mega-pixels camera (Huawei Co., Ltd., Shenzhen, China). All of the scanned/captured images were manually rotated, aligned and scaled to their original halftone size. We calibrated the Epson scanner using the Color Engineering Toolbox [24] that uses 3rd order polynomials for least squares fitting between the scanner RGB and the XYZ space (with D50 as white point). From the Epson scanner, we obtained two different scanned sets, at 300 dpi and 600 dpi resolution, which, including the Canon and Huawei captures, resulted in four different sets of the 54 testing images. The Canon and Huawei cameras were not color-calibrated—we assumed sRGB values of the captured images in order to convert them via XYZ to YyCxCz for watermark detection. Given that a real application scenario may include different and unknown scanning/capture devices as well as different lighting conditions, we tested the detectors robustness to those type of deviations in the following way: we estimated the probability densities in Equations (2), (5), and (11) only for the 600 dpi Epson scans of the training images and we used those estimated probability densities for the whole evaluation that included the other three scans/captures of the testing images—the 300 dpi Epson scans and the captures using Canon and Huawei camera. The reason for using only the color-calibrated 600 dpi scans for modelling the chrominance print-and-scan channels is that they are least affected of external geometric distortions in the scanning part of the print-and-scan channel such as rotation, scaling or lens barrel distortion. The Matlab code for features training and detectors comparison is available as Supplementary Materials; the training and testing printed and scanned/captured images (including the Matlab code) are available for download [25].
The moments-based detector (Equation (5)) performed considerably worst, with CDR below 45% in all of the tests and for both of the chrominance channels of all the 54 testing images. As it can be seen from Figure 5c, the moment’s probability densities considerably overlap between each other for different orientations, which also yields to very low ability for discriminating the embedded oriented features. We conclude that image moments are not appropriate to use as orientation-description features for OM data embedded in dispersed-dot halftones. To avoid polluting our results, we have excluded the moments-based detector from further evaluation.
For the performance of the dictionary-based detector, two parameters are most important: the dictionary size, , and the maximum number of atoms used for reconstruction of a testing watermarked block, . In order to find nearly optimal values for these two parameters, we performed tests for three values of —(32, 64, 128) and six values of —(from 1 to 6). Regardless of the scanning/capture device, the CDR had very similar trends, so we show it aggregated for all four testing sets in Figure 6. It can be seen that the CDR increases with the number of atoms in the dictionary for the red-green Cx channel. For both chrominance channels, the largest tested dictionary size = 128 achieved highest CDR regardless of the number of atoms used in detection. Regarding the number of atoms, , the results showed that different values of may be best for different sizes or chrominance channels. However, averaged for both chrominance channels when = 128, using = 2 atoms achieves highest CDR on average for all testing images from all four testing sets. We use these parameter values for the comparison with the other detectors that follows. While using dictionaries larger than = 128 may potentially achieve even higher CDR, we decided not to test them because the training time and the actual detection time using dictionaries of size = 128 is already excessively large to be useful in a practical application.
Regarding the LMS-filters training, there are few parameters such as convergence rate or stopping threshold [13]. We trialed different values for these parameters, but we did not get any significant difference in the final detection results. That was mostly because after training the LMS-filters are normalized to unit energy, so those parameters hardly influence the shape of the learned LMS-filters, especially when the training set is relatively large—in our case, we used 11250 training watermarked halftone blocks. Therefore, in this work we train the LMS-filters using the exact parameter values as in the original work [13].
The 54 testing images include a wide variety of content. Some of them have areas with extreme dark or light levels, or heavily saturated areas that include a dominant single colorant or dominant halftone pixel value. In those types of image areas, oriented features may not be embedded at all, or have very poor strength. That means that the highest CDR of 100% may not be possible regardless of the detector used, simply because some of the oriented features were not (or were poorly) embedded with the CDBS-OM method and therefore are not present in the printed images. To demonstrate this, we show an example in Figure 7. The CDR from the 600 dpi scans using the proposed detector is shown in Figure 7a. It can be seen that for some of the testing images, a CDR of 100% was achieved in the Cx or the Cz channel. Figure 7b shows the scanned 20th testing image. The large sky area is very bright, and the OM data embedding resulted in covering the sky area with only yellow colorant dots. The data can be relatively correctly extracted from the blue-yellow Cz channel—the CDR is around 94%. However, the absence of magenta or cyan dots in the sky area (used for rendering red or green tones) means that the data were not actually embedded in the red-green channel of that sky area, resulting in low CDR of around 65%. Figure 7c shows the scanned 45th testing image. There are large very dark areas where the OM embedded data cannot be extracted due to absence of oriented red-green or blue-yellow variations. That results in low CDR for both channels. However, the CDR in the Cx channel of the 45th image is significantly higher than the CDR in the Cz channel. That is mainly due to the darker tones present in the image, which are rendered using mostly darker (including red and green) colorant dots.
In order to eliminate this fluctuation of CDR among the testing images, we used one-sided paired t-test in the CDR analysis. Specifically, in the next tables along the CDR values, we show a column ‘Margin’. The value in this column is the maximum CDR percentage points added to the results of the competing detectors for which the t-test still rejects (at 95% confidence) the null-hypothesis that the proposed PCA-based detector on average does not achieve higher CDR. In this way, the ‘Margin’ value can be interpreted as a CDR margin of a statistically significant improvement of the proposed detector over each of the competing detectors.
In Table 1, we show the average CDR values obtained using the proposed detector and its competitors, separately for the two chrominance channels, Cx and Cz. We used only the 600 dpi scanned images for these results. It can be seen that both PCA-based detectors achieve higher CDR than the rest, with the proposed one, in the Cz channel, achieving statistically significant 0.8 percentage points higher CDR than the old PCA-based detector. The CDR margins of improvement for the proposed detector over the rest two vary from 3.7 to 11.7%. The LMS-filter detectors performed third best, while the dictionary-based detector performed worst.
In real application scenarios, the detection of oriented features may be performed with various capture devices, and it is not practically viable to have channel likelihood functions tailored to each specific capture device. Therefore, it is important that the feature extractors are robust to non-calibrated devices in the scan/capture part of the print-and-scan channel. As previously mentioned, apart from the 600 dpi scans, we made three other captures using: the same calibrated Epson scanner but at 300 dpi resolution, a Canon compact camera, and a Huawei smartphone camera. The watermark detection from these sets was performed assuming the chrominance print-and-scan channel model obtained from the 600 dpi scanned images. We note that this is relevant only for the LMS-filters detector and the proposed PCA-based detector, as the old PCA-based detector as well as the dictionary-based detector are not using probabilistic model for the print-and-scan channel. The CDR from the 300 dpi scans are given in Table 2. It can be seen that CDR values for all detectors remained roughly the same as for the 600 dpi scans, with few detectors even performing marginally better than the 600 dpi case. We argue that the slightly higher CDR may be result to the absence of down resizing when aligning the 300 dpi images—as they were printed at 300 dpi resolution as well. We can conclude that the 300 dpi scanning resolution is still high enough to allow non-degraded watermark detection from the 300 dpi-printed images.
Table 3 and Table 4 show CDR obtained using the images from the Canon and the Huawei phone camera, respectively. Compared to the previous CDR values obtained from the scanned images, there is significant drop of CDR in both chrominance channels and for all detectors. This can mainly be attributed to the fact that these two cameras were not color-calibrated, and there was a visible geometrical barrel distortion. However, the drop in CDR was lower for the proposed detector, which further increased its improvement margin over the rest. An interesting issue occurred with the LMS-filter-based detector. The drop in CDR in the Cx channel was quite large, and it occurred for both camera-captured sets. The low CDR values of around 30–33% are very close to the theoretical value of 25% that a random guess would achieve as CDR (for this 4-orientations case). After inspecting the issue more closely, we noticed that the actual probability densities in the channel likelihood for these cameras are shifted from those obtained for the 600 dpi scans. This is shown on Figure 8 where probability densities (for 600 dpi scans) used by the detector are shown with solid lines, while the actual estimated (for the Huawei captured images, similar happens for the Canon captured images) are shown with dotted lines. The main reason for the shifts is the capture with non-color-calibrated camera, and this impact is further increased by the lower orientation-discrimination ability of the LMS-filters (Figure 5b).
Except for the specific LMS-filter case, in both Table 3 and Table 4 the CDR in the Cz channel is significantly lower than the CDR in the Cx channel. The main reason for this is the lower visibility of the distortion introduced from the data embedding in the Cz channel—due to the lower sensitivity of the human visual system along the blue-yellow axis. The lower visibility of the embedded data in the Cz channel is reflected in both of the Canon and Huawei captures, effectively reducing the strength of the embedded oriented features and leading to lower CDR. When compared between the two camera captures, the CDR was higher for the Huawei captures mainly due to the higher sensor resolution of the Huawei camera.
Regarding the computational complexity, the proposed PCA-based detector requires fewer calculations of cross-correlation scores when compared to the LMS-filter detector and the old PCA-based detector. While the ML detection adds extra calculations, they can be greatly reduced by using lookup tables and increasing the memory requirement instead. In that case, the computational overhead from ML detection is minor compared to calculating more cross-correlation scores for feature extraction. The dictionary-based detector requires significantly more computational power than the rest—for the case = 128, using = 2, the detector took around 300 times longer compared to the proposed detector.
4. Discussion
An interesting discussion point is that both PCA-based detectors had similar CDR performance, despite the proposed one using ML detection criterion. The main reason for that is the high similarity of their feature extractors. If we change the summation order in Equation (3), the detection metric of the old PCA-based detector can be re-written as:
In Equation (12), is the equivalent feature extractor for embedded orientation θ, and it is a linear combination of 2K PCA templates obtained for embedded orientations θ and θ + 90°. In Figure 9, we show these equivalent feature extractors for four different orientations θ {0°, 45°, 90°, 135°} in both Cx and Cz channels. It can be seen that they are quite visually similar to the feature extractors (2nd and 3rd PCA components in Figure 4c) used by the proposed detector. Only two of the four equivalent feature extractors are linearly independent, the other two are their inverted versions. Their value is very close to zero for DFT coefficients that are practically not affected from the orientations embedding. This makes them robust to visual content variations, and they have similar orientation-discrimination abilities as the feature extractors of the proposed detector (as illustrated in Figure 5a). However, as it can be seen from Table 1, Table 2, Table 3 and Table 4, using ML detection criterion achieves higher CDR, especially for the cases of detection from images captured with non-calibrated devices. If the old PCA-based detector is implemented as in Equation (12), then it requires same number of feature extraction calculations as for the proposed detector, but the overall computational requirements are lower from all detectors—due to not using ML detection.
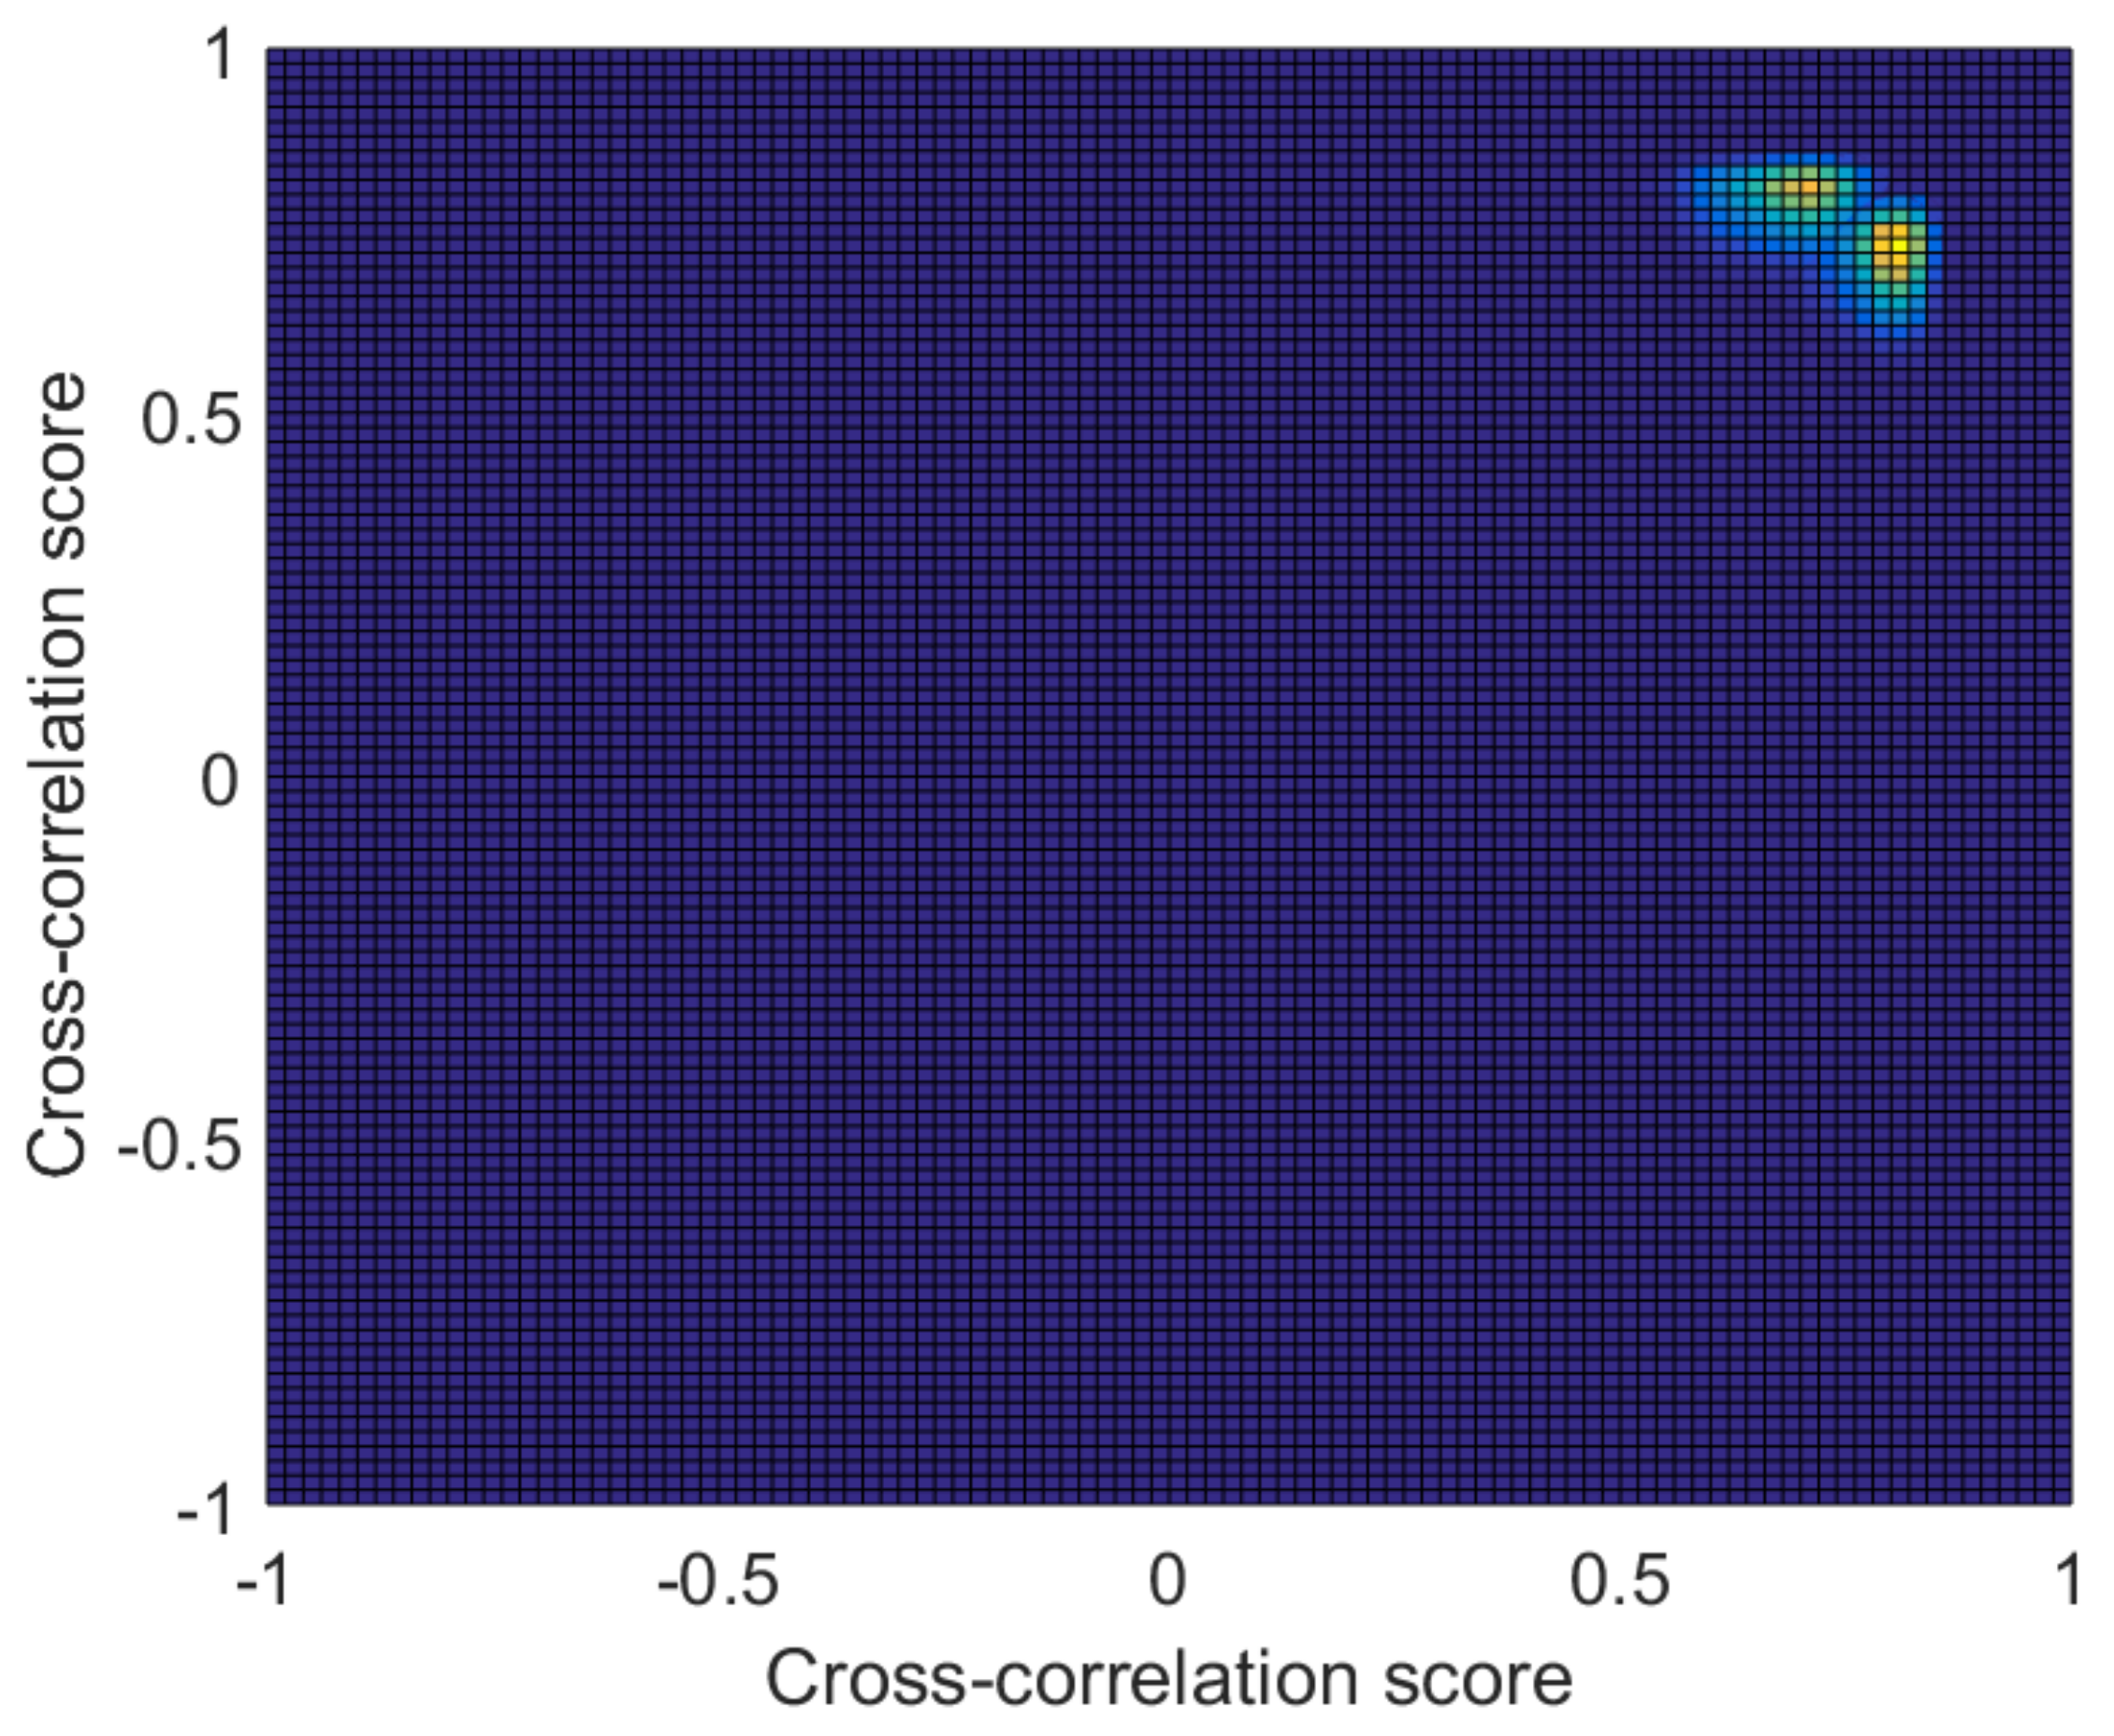
Another discussion point is the comparison between detection using LMS-filters as feature extractors, and the proposed PCA learned feature extractor. The LMS-filters as feature extractors for detection have been used in other similar halftoning-and-watermarking methods [5,26]. However, in this work we show that they are inferior to the proposed feature extractors, which can be mainly attributed to the fact that they are responsive to not just the embedded data but to the visual content as well. That degrades their ability for discriminating orientations despite the ML detection criterion, and may render them impractical in scenarios where the detection is performed on images captured using unknown devices. Another way to illustrate the difference in orientation-discrimination ability between the LMS-filters and the proposed PCA-based feature extractors is by looking at the joint probability densities of the extracted features using the LMS-filters—we consider a two-orientations case (horizontal and vertical orientation) so that the joint probability densities are 2D and suitable for visualization. The joint probability densities of extracted features for those two orientations using LMS-filters, and , are shown in Figure 10. They span smaller space and are very close to each other—making them more sensitive to variation/shifts in the cross-correlation scores due to changes in the print-and-scan channel. While Figure 5a shows the relevant two probability densities of extracted features using the proposed PCA template, shown with blue line and shown with yellow line. They are 1D as only one PCA feature can discriminate the two orientations, the two curves are barely overlapping and are distant from each other, span larger range of the cross-correlation axis, and hence are more robust to variations in the feature distributions for different scan/capture devices.
The significance of this study can be sublimed in two main points. The first point is that an improved PCA-based detector for OM embedded data is proposed, which uses lower number of feature extractors and ML detection criterion. The second point is that relevant state-of-the-art detectors are compared to each other on a large set of testing images captured using three different devices, with the training/testing images as well as the code implementation provided as open-source.
As a main limitation of this study, we consider the parameters used in the CDBS-OM data embedding. It was stated previously that the whole evaluation used fixed values for parameters, such as the size of the watermarked blocks, the watermark quality factor, the number of embeddable orientations, or the printing resolution. These parameters values were selected based on our previous work [14] as a good compromise between watermark perceptibility, watermark data capacity, and CDR, and hence, we believe that a real application would use those values (or very close to them). We have no reason to suspect that the conclusions from this study would be significantly different if different parameters were used—we argue that the CDR is strongly related to the features’ discrimination ability, and detectors’ relative performance is not depending on parameters such as the size or the strength of embedded orientations. However, this claim may be investigated further in a future work.
Another limitation of this study is the manual alignment of images prior to detection. Manual alignment was also used in the previous works [13,14,16], but a real application would normally use a method for automatic image registration. Different strategies to achieve image alignment, including use of synchronization points/patterns or exploiting periodicity in the embedded data, will be investigated in future work.
5. Conclusions
In this paper, we propose a method for detection of orientation-modulation embedded data in color printed images. We demonstrate the use of PCA to learn the main components of orientations embedding, that, when used as correlation-based feature extractors, provide high orientation-discrimination ability. We use a probabilistic model for the chrominance print-and-scan channel and an ML detection of the embedded data. The proposed method is compared to four state-of-the-art detectors using a large set of testing images obtained from three scan/capture devices. The proposed detector achieved higher average correct detection rate than all other detectors. Other advantages of the proposed detection method are lower number of feature extractors needed—leading to lower computational requirements, and increased robustness to unknown/non-calibrated scanning/capture devices. This increased robustness is mainly due to the ability of the proposed PCA-based feature to better separate the embedded oriented features from the visual image content.
Supplementary Materials
The following are available online at https://www.mdpi.com/2313-433X/4/4/56/s1, Matlab code and all figures. The data used, including the Matlab code, is available online, see [25].
Acknowledgments
This work was supported through scholarship from the Norwegian Ministry of Education and Research.
Author Contributions
V.K. contribution is: method design, algorithms implementation, performing the experimental work, data analysis, writing the paper. M.P. contributed to paper revision.
Conflicts of Interest
The authors declare no conflict of interest. The founding sponsors had no role in the design of the study; in the collection, analyses, or interpretation of data; in the writing of the manuscript, and in the decision to publish the results.
References
- Sharma, G. Digital Color Imaging Handbook; CRC Press: Boca Raton, FL, USA, 2003; ISBN 9781315220086. [Google Scholar]
- Pei, S.-C.; Guo, J.-M.; Lee, H. Novel Robust Watermarking Technique in Dithering Halftone Images. IEEE Signal Process. Lett. 2005, 12, 333–336. [Google Scholar] [CrossRef]
- Guo, J.-M. Watermarking in dithered halftone images with embeddable cells selection and inverse halftoning. Signal Process. 2008, 88, 1496–1510. [Google Scholar] [CrossRef]
- Fu, M.S.; Au, O.C. Steganography in halftone images: Conjugate error diffusion. Signal Process. 2003, 83, 2171–2178. [Google Scholar] [CrossRef]
- Pei, S.-C.; Guo, J.-M. High-Capacity Data Hiding in Halftone Images Using Minimal-Error Bit Searching and Least-Mean Square Filter. IEEE Trans. Image Process. 2006, 15, 1665–1679. [Google Scholar] [CrossRef] [PubMed]
- Guo, J.-M.; Pei, S.-C.; Lee, H. Watermarking in halftone images with parity-matched error diffusion. Signal Process. 2010, 91, 126–135. [Google Scholar] [CrossRef]
- Kacker, D.; Allebach, J.P. Joint halftoning and watermarking. IEEE Trans. Signal Process. 2003, 51, 1054–1068. [Google Scholar] [CrossRef]
- Wan, X.; Hu, C.; Xu, J. A Watermarking Algorithm for Halftone Image Based on Human Vision System Model. In Proceedings of the Color Imaging XII: Processing, Hardcopy, and Applications, San Jose, CA, USA, 30 January–1 February 2007. [Google Scholar] [CrossRef]
- Zhuge, X.; Nakano, K. Direct Binary Search Based Algorithms for Image Hiding. Int. J. Digit. Content Technol. Appl. 2012, 6, 457–466. [Google Scholar]
- Bulan, O.; Sharma, G.; Monga, V. Orientation Modulation for Data Hiding in Clustered-Dot Halftone Prints. IEEE Trans. Image Process. 2010, 19, 2070–2084. [Google Scholar] [CrossRef] [PubMed]
- Bulan, O.; Sharma, G. High Capacity Color Barcodes: Per Channel Data Encoding via Orientation Modulation in Elliptical Dot Arrays. IEEE Trans. Image Process. 2011, 20, 1337–1350. [Google Scholar] [CrossRef] [PubMed]
- Oztan, B.; Sharma, G. Continuous Phase-Modulated Halftones. IEEE Trans. Image Process. 2009, 18, 2718–2734. [Google Scholar] [CrossRef] [PubMed]
- Guo, J.-M.; Su, C.; Lee, H.; Lee, J. Oriented Modulation for Watermarking in Direct Binary Search Halftone Images. IEEE Trans. Image Process. 2012, 21, 4117–4127. [Google Scholar] [CrossRef] [PubMed]
- Kitanovski, V.; Pedersen, M. Orientation Modulation for Data Hiding in chrominance Channels of Direct Binary Search Halftone Prints. J. Imaging Sci. Technol. 2016, 2016, 32–40. [Google Scholar] [CrossRef]
- Agar, A.U.; Allebach, J.P. Model-Based Color Halftoning Using Direct Binary Search. IEEE Trans. Image Process. 2005, 14, 1945–1959. [Google Scholar] [CrossRef] [PubMed]
- Son, C.; Choo, H. Watermark detection from clustered halftone dots via learned dictionary. Signal Process. 2014, 102, 77–84. [Google Scholar] [CrossRef]
- Flohr, T.J.; Kolpatzik, B.W.; Balasubramanian, R.; Carrara, D.A.; Bouman, C.A.; Allebach, J.P. Model-based color image quantization. In Proceedings of the SPIE: Human Vision, Visual Processing, and Digital Display IV, San Jose, CA, USA, 1–4 February 1993; pp. 270–281. [Google Scholar] [CrossRef]
- Wang, S. Algorithm-independent color calibration for digital halftoning. In Proceedings of the 4th IS&T/SID Color Imaging Conference, Scottsdale, AZ, USA, 19–22 November 1996; pp. 75–77. [Google Scholar]
- Aharon, M.; Elad, M.; Bruckstein, A. K-SVD: An algorithm for designing overcomplete dictionaries for sparse representation. IEEE Trans. Signal Process. 2006, 54, 4311–4322. [Google Scholar] [CrossRef]
- Liu, X.; Pedersen, M.; Hardeberg, J.Y. CID:IQ—A New Image Quality Database. In Proceedings of the International Conference on Image and Signal Processing, Cherbourg, France, 30 June–2 July 2014; pp. 193–202. [Google Scholar] [CrossRef]
- Kodak Lossless True Color Image Suite. Available online: http://r0k.us/graphics/kodak (accessed on 10 March 2018).
- Larson, E.C.; Chandler, D.M. Most Apparent Distortion: Full-Reference Image Quality Assessment and the Role of Strategy. J. Electron. Imaging 2010, 19, 011006. [Google Scholar] [CrossRef]
- Skretting, K. Dictionary Learning Tools for Matlab. Available online: http://www.ux.uis.no/~karlsk/dle/ (accessed on 10 March 2018).
- Green, P.; MacDonald, L. Colour Engineering: Achieving Device Independent Colour; Wiley: Hoboken, NJ, USA, June 2002; ISBN 978-0-471-48688-6. [Google Scholar]
- Kitanovski, V. Associated Matlab Code. Available online: http://folk.ntnu.no/vladok/OMdetection.zip (accessed on 10 March 2018).
- Guo, J.-M.; Lai, C.-H.; Wong, K.; Chang, L.-C. Progressive Halftone Watermarking Using Multilayer Table Lookup Strategy. IEEE Trans Signal Process. 2015, 24, 2009–2024. [Google Scholar] [CrossRef]
Figure 1.
Flowchart of the CDBS-OM data embedding method.

Figure 2.
(a) Watermarked CMY halftone block; (b) PSF used for embedding the oriented feature in the red-green Cx channel, shown in spatial and frequency domain; (c) Same as (b) but for the blue-yellow channel Cz.
Figure 2.
(a) Watermarked CMY halftone block; (b) PSF used for embedding the oriented feature in the red-green Cx channel, shown in spatial and frequency domain; (c) Same as (b) but for the blue-yellow channel Cz.
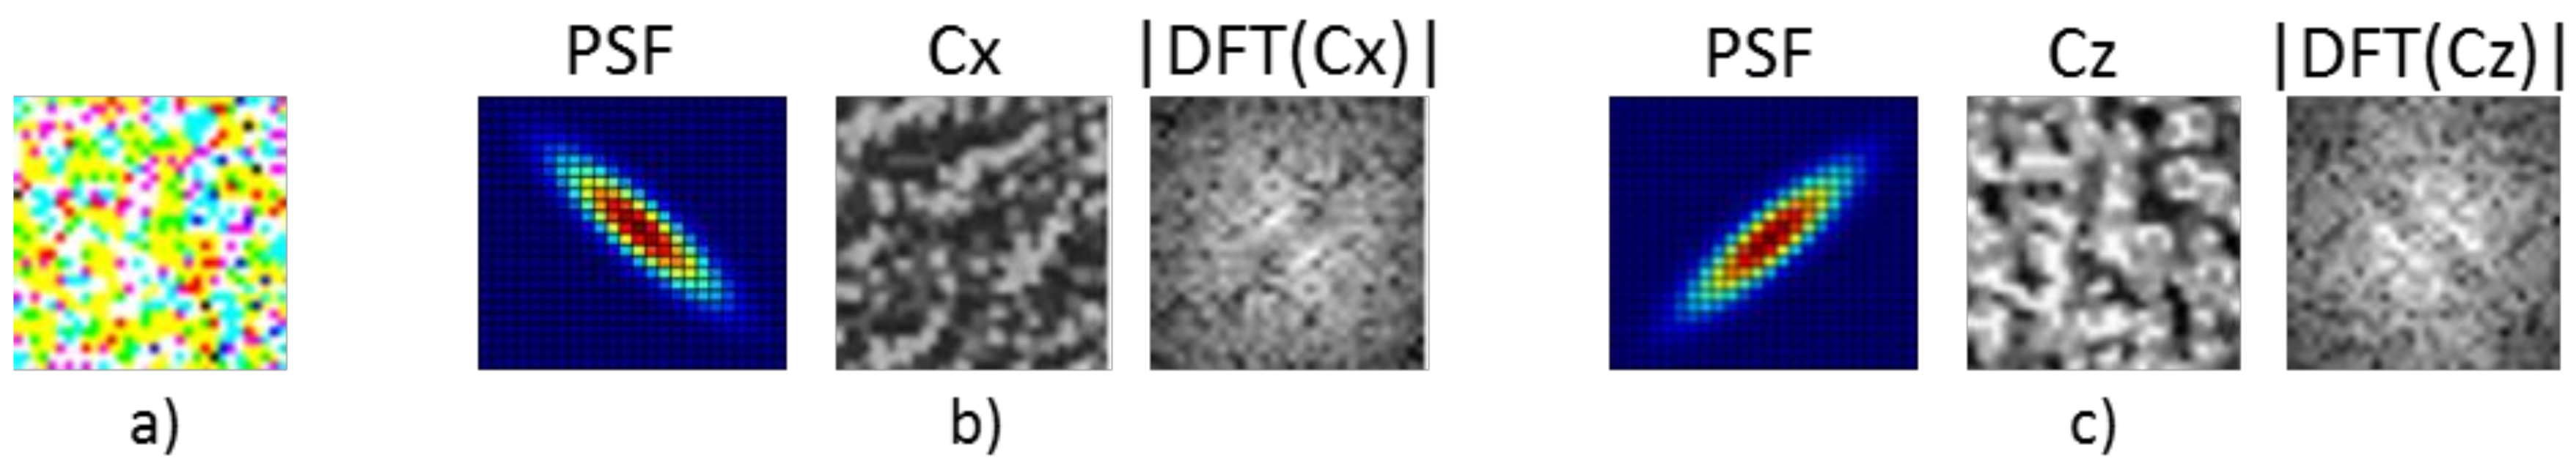
Figure 3.
(a) Trained LMS-filters from blocks with embedded orientations 45° and 135°; (b) First two PCA components for 45° and 135°; (c) Three atoms from learned dictionaries for 45° and 135°.
Figure 3.
(a) Trained LMS-filters from blocks with embedded orientations 45° and 135°; (b) First two PCA components for 45° and 135°; (c) Three atoms from learned dictionaries for 45° and 135°.
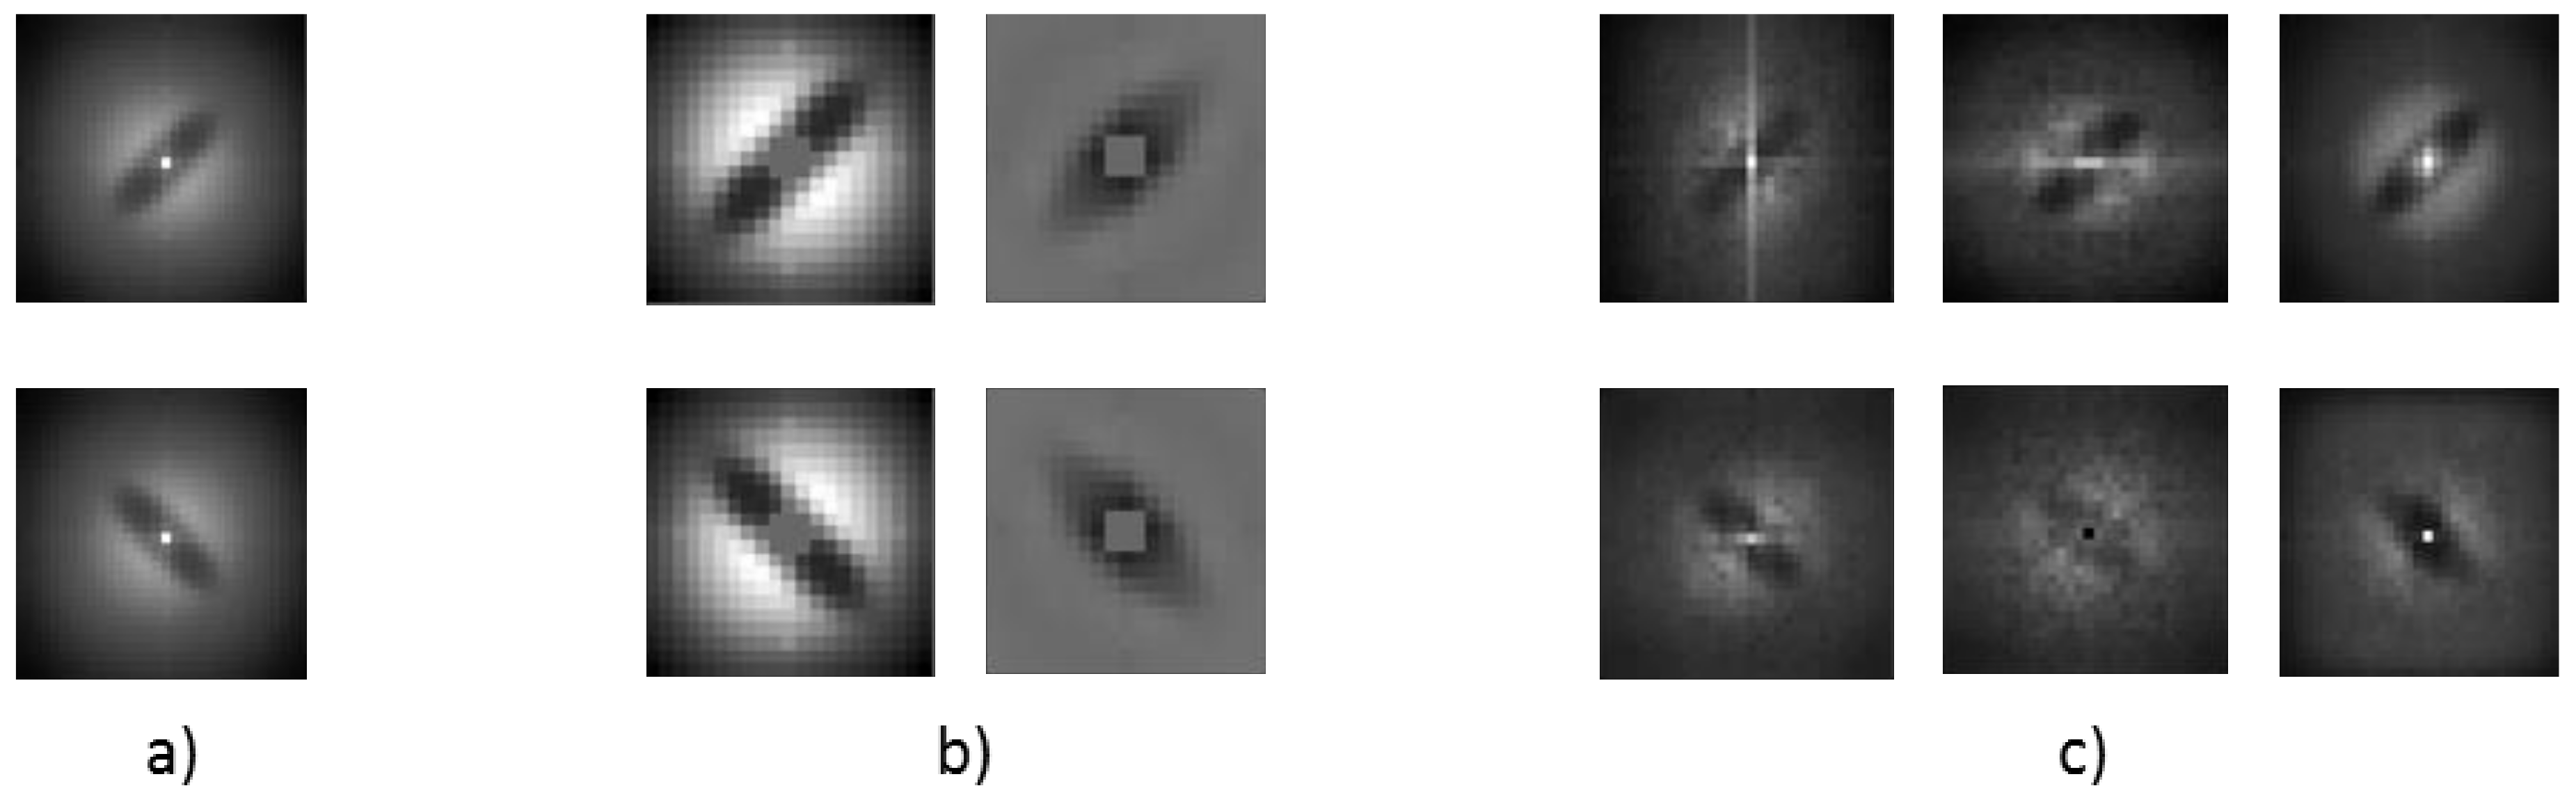
Figure 4.
The first five PCA components of watermarked blocks with different orientations in the Cx (top) and Cz channel (bottom), rounded percentage of explained variance in the training set is shown below the components. (a) Two embeddable orientations, 0° and 90°; (b) Two embeddable orientations, 45° and 135°; (c) Four embeddable orientations, 0°, 45°, 90° and 135°.

Figure 5.
(a) Probability densities for the extracted feature using the first PCA extractor (second PCA component in Figure 4c), calculated on training data in Cx channel with four different orientations; (b) Probability densities for extracted feature using horizontal LMS-filter; (c) Probability densities for horizontal moment.

Figure 6.
CDR for all images and capture devices using dictionary-based detector, in the Cx (a) and Cz channel (b), depending on the dictionary size (color-coded) and the number of atoms used in the detection .
Figure 6.
CDR for all images and capture devices using dictionary-based detector, in the Cx (a) and Cz channel (b), depending on the dictionary size (color-coded) and the number of atoms used in the detection .
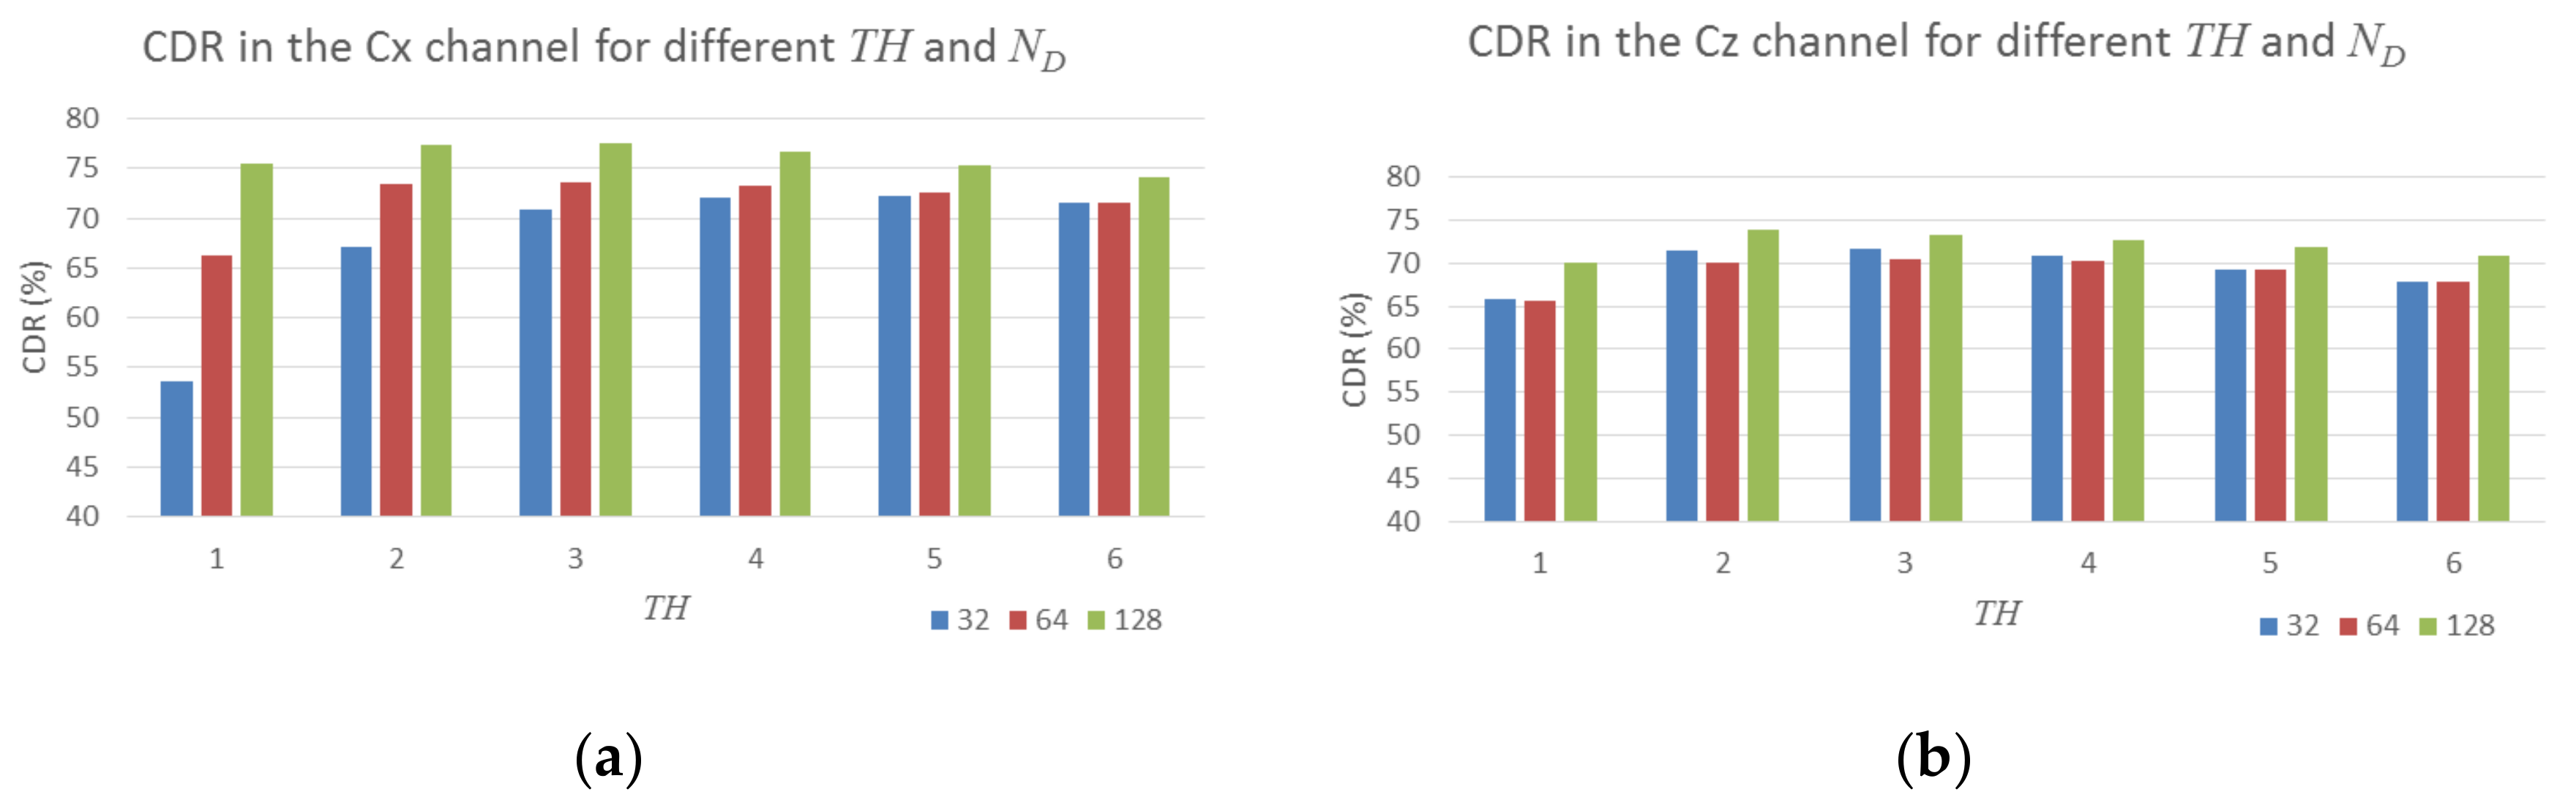
Figure 7.
(a) CDR from 600 dpi scans of all testing images; (b) 600 dpi scan of the 20th testing image; (c) 600 dpi scan of the 45th testing image.
Figure 7.
(a) CDR from 600 dpi scans of all testing images; (b) 600 dpi scan of the 20th testing image; (c) 600 dpi scan of the 45th testing image.
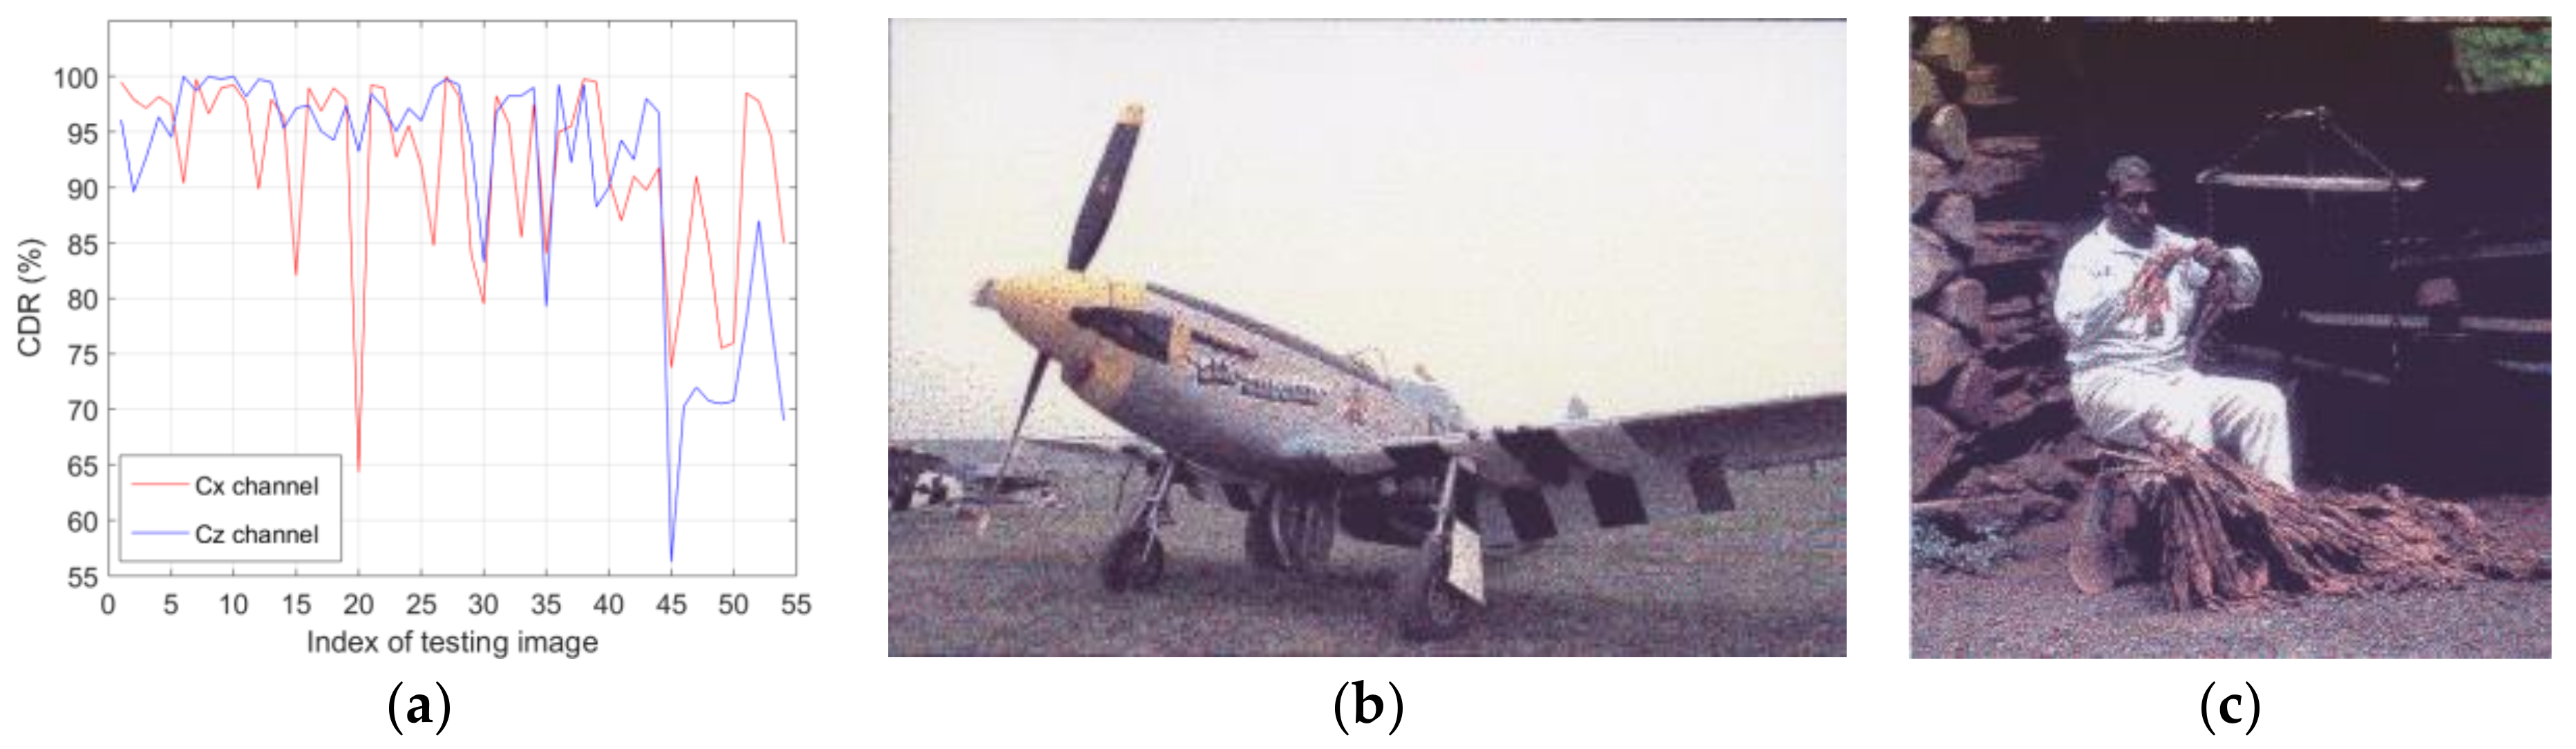
Figure 8.
Two probability densities of extracted features, and , estimated from the Epson 600 dpi scans (solid line) and Huawei camera captures (dashed line).
Figure 8.
Two probability densities of extracted features, and , estimated from the Epson 600 dpi scans (solid line) and Huawei camera captures (dashed line).
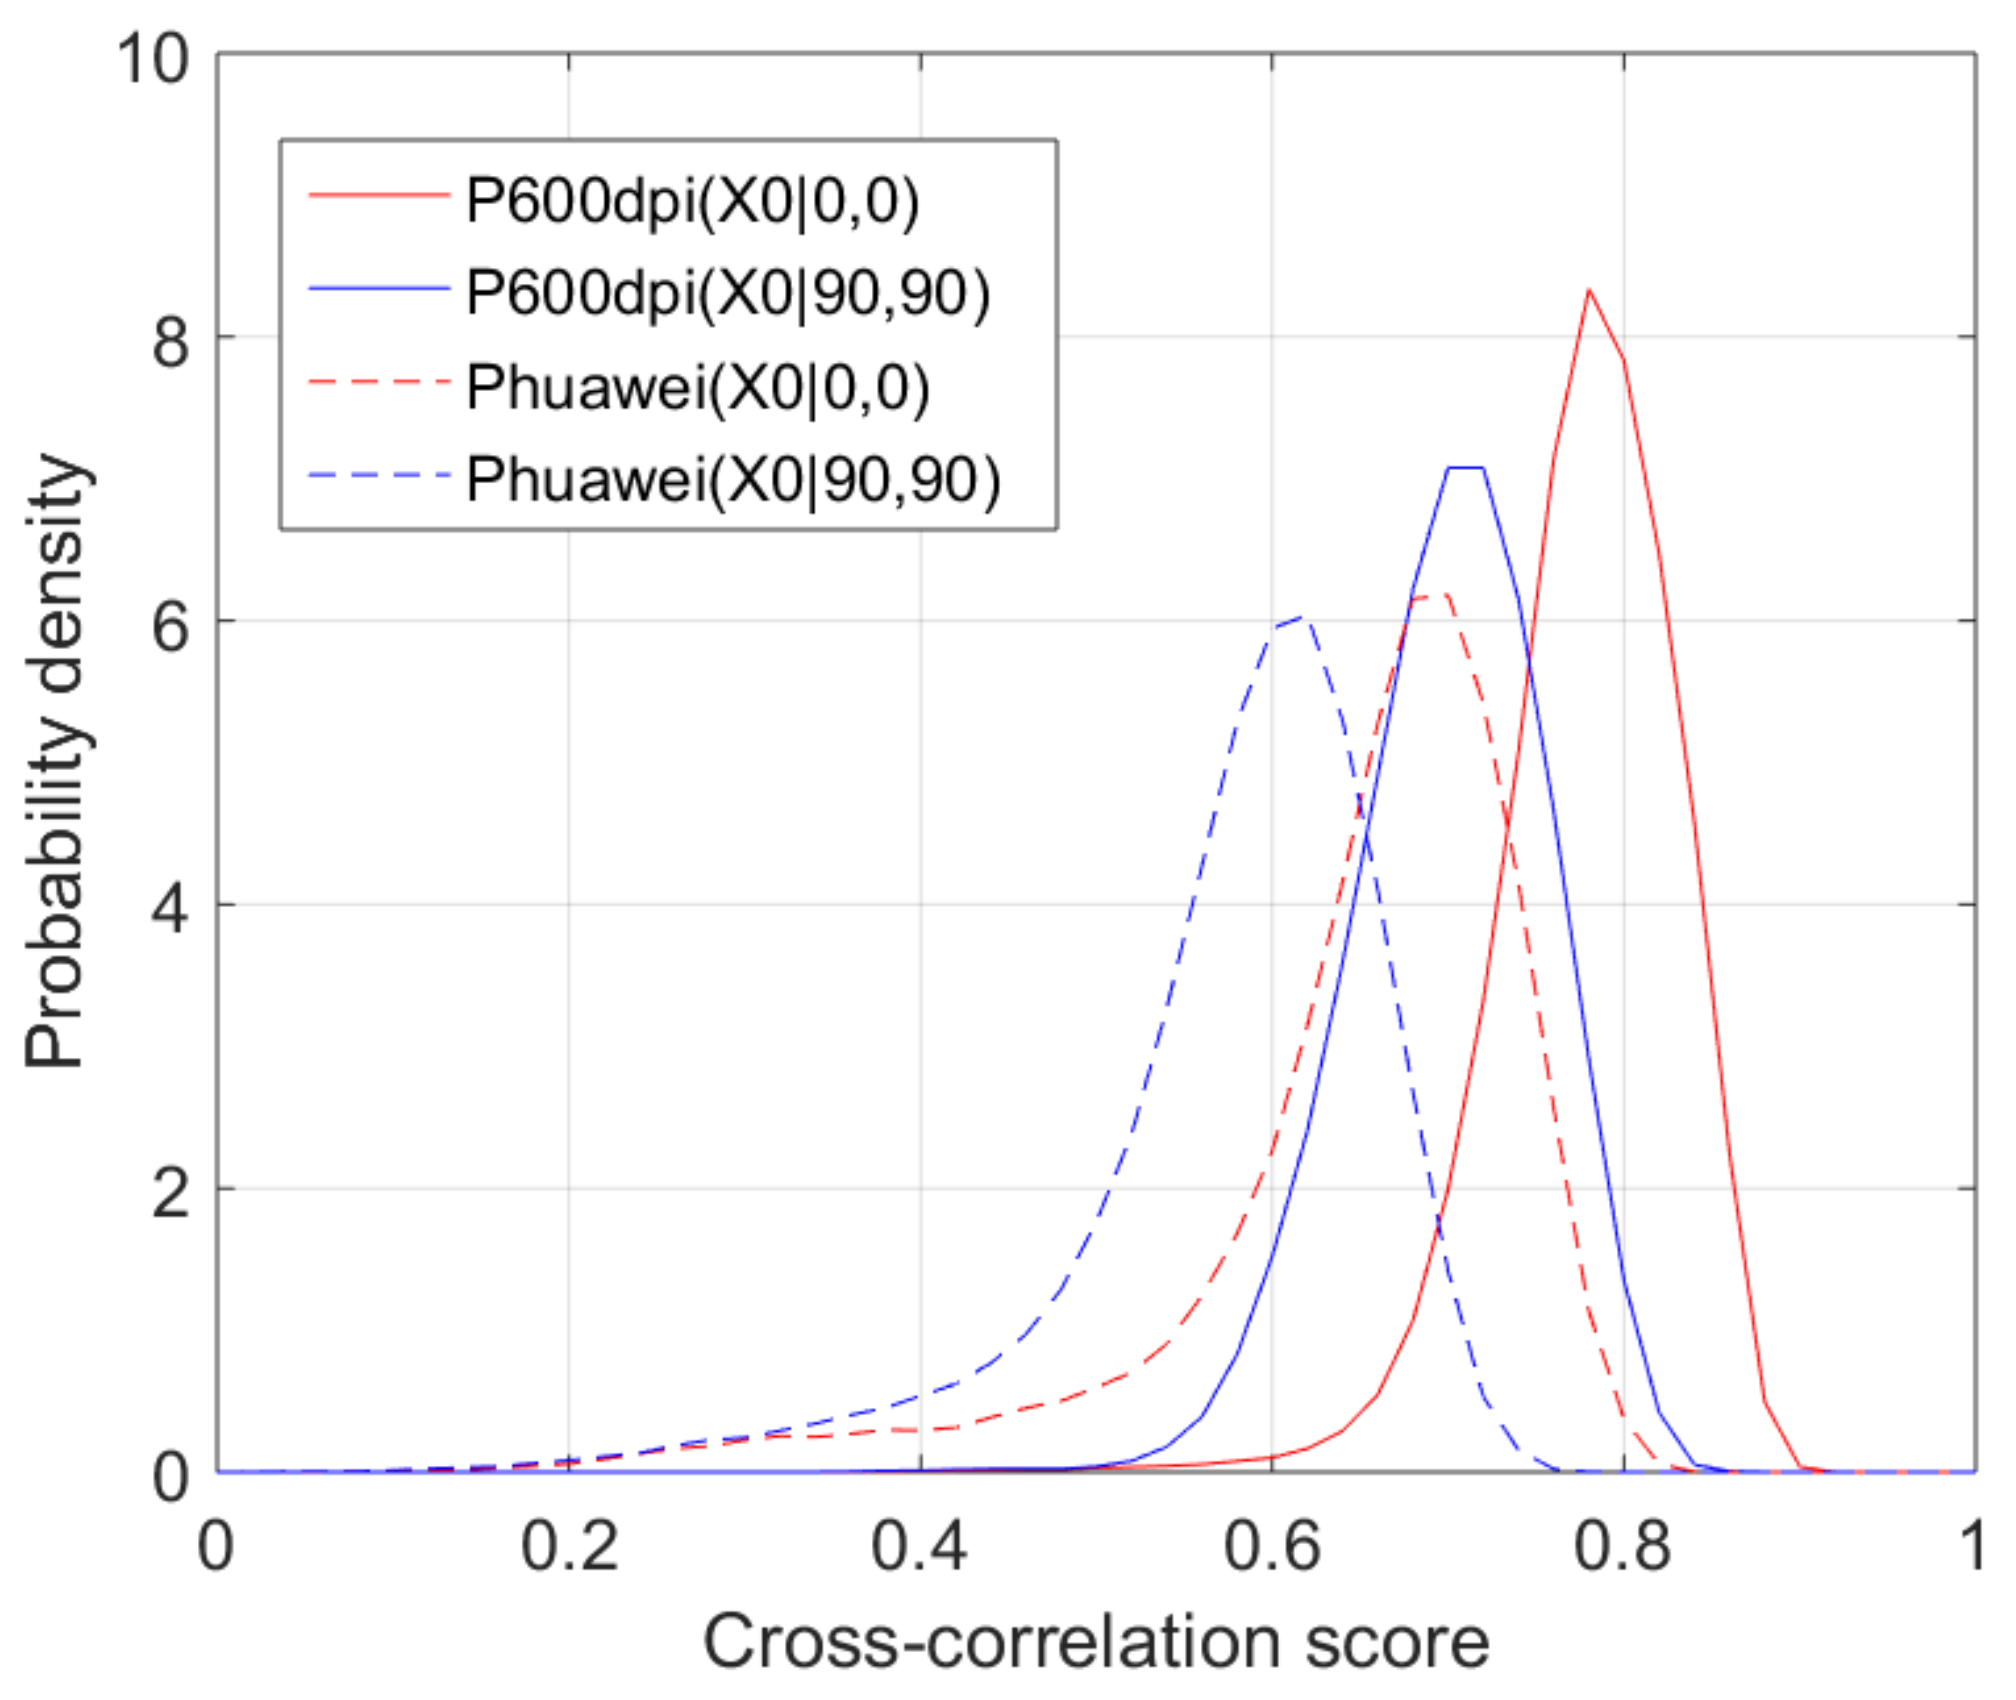
Figure 9.
Equivalent feature extractors of the old PCA-based detector [14], for orientations θ {0°, 45°, 90°, 135°}, in the Cx channel (a) and Cz channel (b).
Figure 9.
Equivalent feature extractors of the old PCA-based detector [14], for orientations θ {0°, 45°, 90°, 135°}, in the Cx channel (a) and Cz channel (b).

Figure 10.
Joint distributions of LMS-filters extracted features (cross-correlation scores) for horizontal and vertical orientation in the Cx channel, and .
Figure 10.
Joint distributions of LMS-filters extracted features (cross-correlation scores) for horizontal and vertical orientation in the Cx channel, and .

Table 1.
CDR for different detectors using the 600 dpi scanned testing images, and statistically significant improvement of the proposed PCA-based detector.
Table 1.
CDR for different detectors using the 600 dpi scanned testing images, and statistically significant improvement of the proposed PCA-based detector.
| Detector | Cx Channel | Cz Channel | ||
|---|---|---|---|---|
| CDR (%) | Margin (% Points) | CDR (%) | Margin (% Points) | |
| Proposed PCA-based | 92.2 | - | 91.4 | - |
| Old PCA-based [14] | 92.3 | no | 90.1 | 0.8 |
| LMS-filters-based [13] | 87.4 | 4.2 | 86.8 | 3.7 |
| Dictionary-based [16] | 79.2 | 11.7 | 82.4 | 7.7 |
Table 2.
CDR for different detectors using the 300 dpi scanned testing images, and statistically significant improvement of the proposed PCA-based detector.
Table 2.
CDR for different detectors using the 300 dpi scanned testing images, and statistically significant improvement of the proposed PCA-based detector.
| Detector | Cx Channel | Cz Channel | ||
|---|---|---|---|---|
| CDR (%) | Margin (% Points) | CDR (%) | Margin (% Points) | |
| Proposed PCA-based | 92.7 | - | 91.8 | - |
| Old PCA-based [14] | 92.9 | no | 90.8 | 0.3 |
| LMS-filters-based [13] | 86.6 | 5.4 | 87.1 | 3.5 |
| Dictionary-based [16] | 82.2 | 9.1 | 84.2 | 6.3 |
Table 3.
CDR for different detectors using the Canon-captured testing images, and statistically significant improvement of the proposed PCA-based detector.
Table 3.
CDR for different detectors using the Canon-captured testing images, and statistically significant improvement of the proposed PCA-based detector.
| Detector | Cx Channel | Cz Channel | ||
|---|---|---|---|---|
| CDR (%) | Margin (% Points) | CDR (%) | Margin (% Points) | |
| Proposed PCA-based | 85.6 | - | 69.2 | - |
| Old PCA-based [14] | 83.7 | 1.5 | 64.3 | 4.2 |
| LMS-filters-based [13] | 33.1 | 48.8 | 48.9 | 17.9 |
| Dictionary-based [16] | 75.4 | 9.3 | 58.8 | 9.1 |
Table 4.
CDR for different detectors using the Huawei-captured testing images, and statistically significant improvement of the proposed PCA-based detector.
Table 4.
CDR for different detectors using the Huawei-captured testing images, and statistically significant improvement of the proposed PCA-based detector.
| Detector | Cx Channel | Cz Channel | ||
|---|---|---|---|---|
| CDR (%) | Margin (% Points) | CDR (%) | Margin (% Points) | |
| Proposed PCA-based | 86.1 | - | 78.7 | - |
| Old PCA-based [14] | 84.6 | 1.2 | 73.9 | 4.1 |
| LMS-filters-based [13] | 30.6 | 53.4 | 52.7 | 23.7 |
| Dictionary-based [16] | 77.9 | 7.5 | 63.6 | 13.6 |
© 2018 by the authors. Licensee MDPI, Basel, Switzerland. This article is an open access article distributed under the terms and conditions of the Creative Commons Attribution (CC BY) license (http://creativecommons.org/licenses/by/4.0/).
Share and Cite
MDPI and ACS Style
Kitanovski, V.; Pedersen, M. Detection of Orientation-Modulation Embedded Data in Color Printed Natural Images. J. Imaging 2018, 4, 56. https://doi.org/10.3390/jimaging4040056
AMA Style
Kitanovski V, Pedersen M. Detection of Orientation-Modulation Embedded Data in Color Printed Natural Images. Journal of Imaging. 2018; 4(4):56. https://doi.org/10.3390/jimaging4040056
Chicago/Turabian StyleKitanovski, Vlado, and Marius Pedersen. 2018. "Detection of Orientation-Modulation Embedded Data in Color Printed Natural Images" Journal of Imaging 4, no. 4: 56. https://doi.org/10.3390/jimaging4040056
Note that from the first issue of 2016, this journal uses article numbers instead of page numbers. See further details here.