Digital Image Correlation of Strains at Profiled Wood Surfaces Exposed to Wetting and Drying

1
College of Engineering & Computer Science, The Australian National University, Canberra, ACT 0200, Australia
2
Centre for Advanced Wood Processing, University of British Columbia, Vancouver, BC V6T 1Z4, Canada
3
School of Civil Engineering (Centre for Future Timber Structures), University of Queensland, St Lucia, Queensland 4072, Australia
*
Author to whom correspondence should be addressed.
J. Imaging 2018, 4(2), 38; https://doi.org/10.3390/jimaging4020038
Submission received: 31 December 2017
/
Revised: 31 January 2018
/
Accepted: 6 February 2018
/
Published: 10 February 2018
Abstract
:We hypothesize that machining grooves and ridges into the surface of radiata pine deck boards will change the pattern of strains that develop when profiled boards are exposed to wetting and drying. Two wavy profiles were tested, and flat unprofiled boards acted as controls. Full-field surface strain data was collected using digital image correlation. Strains varied across the surface of both flat and profiled boards during wetting and drying. Profiling fundamentally changed surface strain patterns; strain maxima and minima developed in the profile ridges and grooves during wetting, respectively, but this pattern of strains reversed during drying. Such a pronounced reversal of strains was not observed when flat boards were exposed to wetting and drying, although there was a shift towards negative strains when flat boards were dried. We conclude that profiling changes surface strain distribution in deck boards exposed to wetting and drying, and causes high strains to develop in the grooves of profiled boards. These findings help explain why checks in profiled deck boards are mainly confined to profile grooves where they are difficult to see, and the commercial success of profiling at reducing the negative effects of checking on the appearance of wood decking.
1. Introduction
Wood surfaces exposed to wetting and drying develop unbalanced strains that cause cracks (checks) to form [1]. Large checks adversely affect the properties of wood products, and have led to their substitution by products that are less susceptible to checking [2]. For example, wooden decks are losing market share to wood plastic composites that are less susceptible to checking [2,3]. The decking market is a large and important end-use for treated timber, and in the US alone over 3.6 billion lineal feet (1.1 billion metres) of decking valued at 7.1 billion dollars is manufactured each year [3]. In North America, most wooden decking is smooth on both sides, but in Asia, Australia, Europe and New Zealand, profiled decking that has small ridges and grooves machined into the surface of boards is common [4,5,6]. Profiling makes the surface of wood less slippery [5], and it also reduces the negative effects of weathering checks on the appearance of decking [7]. Recently, there has been interest in North America in optimizing surface profiling to make it more effective at reducing the checking of wooden deck boards made from different species [7,8,9,10,11,12,13,14]. Such interest in profiling stems from the desire to create wooden decking that can match the performance of wood plastic composites, or manufacture decking from species whose susceptibility to surface checking has been an obstacle to their successful exploitation for deck boards [9,15]. However, our knowledge of how profiling alters the strains and restricts surface checking of wooden deck boards exposed to cyclic variation in moisture content during weathering is rudimentary. Checks in deck boards exposed to weathering are narrower in profiled boards than in flat boards, and checks in profiled deck boards mainly occur in grooves where they are difficult to see [4,7]. The ability of profiling to confine checks to grooves of wooden deck boards accords with studies showing that checks in metals develop at the base of stress relief grooves because stresses and strains are concentrated at the base of grooves [16].
Strains in wood can be measured at individual points using ‘dial gauges, electrical strain gauges or linear variable displacement transducers’, as pointed out by Zink et al. [17], but the measurement of strains over larger areas (full-field measurements) requires the use of optical imaging methods based on interferometry or non-interferometric techniques [18]. Interferometric methods used to obtain displacement data include moiré interferometry and electronic speckle pattern interferometry [18,19]. Non-interferometric methods include speckle photography, geometric moiré, grid method [18], and digital image correlation [20]. Strains are obtained algorithmically from displacement data by ‘numerical differentiation of displacement fields, or directly, for example, with shearography, speckle shearing photography or by moiré fringes shifting’, as pointed out by Grédiac in his review of full-field measurements for composite materials [18]. Strains and checking at the surface of wood during drying have been measured using digital image correlation [21,22], and the method is simple, cost-effective and robust (less prone to errors [noise] caused by vibration) [23]. Digital image correlation is used here to test the hypothesis that surface profiling will concentrate stresses at the base of grooves in profiled deck boards exposed to wetting and drying. We were also interested in comparing the magnitude of strains that develop in profiled and flat boards to better understand why profiling reduces the dimensions of checks in deck boards exposed to the weather, and also the increased tendency of profiled deck boards to cup (deviate from flatness transversely across their faces) [14].
2. Materials and Methods
2.1. Materials and Machining of Deck Boards
Five 4800 (length) × 90 (width) × 35 (thickness) mm3 (nominal) machine stress-graded (MGP10) plain-sawn radiata pine (Pinus radiata D. Don) boards were purchased from a retailer (Bunnings, Cannon Hill, Queensland, Australian). Boards contained some knots even though we selected the clearest, defect-free, material available. Boards were cross-cut using a chop-saw (Omga T55-300, OMGA Industries Inc., South Bend, IN, USA) to remove two 100 mm long pieces from the ends of each board that were not tested during machine stress-grading. These pieces provided specimens whose densities and ring widths were measured, as described previously [24,25], (Table 1).
Each board was cross-cut to produce four 800 mm long samples. These four samples from each parent board were then machined to a similar thickness of 31 mm using a rotary planer (Martin T44, Otto Martin Maschinenbau, Ottobeuren, Germany). The three clearest defect-free samples from each board were allocated at random to three profiles (ribble, ripple and flat, Table 2, Figure 1) [6]. Samples from the first parent board were assigned at random to the three different profile types, including the unprofiled, flat, control. The two relevant profile knives for the first selected profile were inserted into a 125 mm diameter, two-wing, cylindrical rotary cutter head (Great-Loc SG Positive Clamping Universal Tool System, Great Lakes Custom Tool Mfg. Inc., Peshtigo, WI, USA) with a hook angle of 15°, and secured in place. The cutter head was placed on the machine spindle of a moulding machine (Weinig Profimat 26 Super, Michael Weinig Inc., Mooresville, NC, USA), aligned and then secured in place. The decking sample was then machined using a feed speed of 13 m/min, and a spindle speed of 6000 rpm to produce the selected profile. This process was then repeated for the second assigned profile and so on, until the three samples from the first parent radiata pine board were profiled. Then samples from the second parent board were profiled, as above, followed by samples from boards 3, 4 and 5 until all 15 samples (5 boards × 3 samples) had been profiled. The ends of each of the 800 mm long profiled samples were cross-cut to remove sections that were 150 mm in length. This procedure ensured that samples were free of machining damage (snipe) and end-checks. The final dimensions of the profiled boards were 500 mm (length, longitudinal direction) × 89 ± 1 mm (width, tangential direction) × 22 ± 1 mm (thickness). A bench drill (Delta 161/2, Akhurst Machinery Ltd., Delta, BC, Canada) was used to pre-drill 4 holes (Ø = 3.5 mm) in each of the deck board samples. Each hole was positioned 100 mm from end-grain, and 22 mm from the nearest edge of the sample. All samples were then stored in a conditioning room at 20 ± 1 °C and 65 ± 5% relative humidity (r.h.) for two weeks and weighed.
The surface of each deck board sample was very lightly sprayed (two passes) with white enamel paint (Dulux Spraypak Quick Dry Low Aromatic spray paint, Bunnings, Tuggeranong, Canberra, Australia). The paint was allowed to air dry and the surface was sprayed (one pass) with coarsely atomized black enamel paint (Dulux Spraypak Quick Dry Low Aromatic spray paint) followed (after air drying) by two-passes of more finely atomized black paint. Spraying samples with white and black paint created a high-contrast stochastic pattern of coarse and fine dots on board surfaces, as required for digital image correlation [26].
2.2. Moisture Cycling and Digital Image Correlation
An individual deck board sample from the first parent board was selected at random and screwed to two wooden joists that were firmly clamped to a rigid galvanized steel test frame (Figure 1). Digital image correlation requires ‘no special lighting’, as pointed out by McCormick and Lord in their review of real-world applications of digital image correlation [23], but deck board samples here were continuously and evenly illuminated with two halogen lamps and a heat lamp. The main function of these lamps, however, was to heat samples to temperatures of 63–68 °C, temperatures that are similar to those recorded at wood surfaces exposed outdoors in the USA to direct sunlight [27]. Each sample was sprayed with a fine mist of water (11.6 g per sample) at the start of the test cycle and again after 7, 14, and 21 min. At the end of the wetting cycle (t = 30 min.), the sample was allowed to dry under the lamps for 2 h. During the wetting and drying cycle, two CCD cameras (ARAMIS 1.3 MB, Trillon Quality Systems, Plymouth Meeting, PA, USA), each with a 50 mm macro lens and a fully-closed aperture, were positioned 380 mm from the deck board sample at an angle of 25°. These cameras captured the swelling and shrinkage strains that evolved during the wetting and drying cycle. Images were processed using ARAMIS software. Defined correlation areas (micro-image facets) measuring 15 pixels square with two pixel overlap were used to track changes in speckle pattern during moisture cycling. The two-dimensional displacements recorded by each of the cameras were correlated to a three-dimensional measurement using the intersection of the two-dimensional measurements. The result is a three-dimensional point distribution for each of the stages. The displacement field is obtained from this point distribution, and the strain field is calculated by measuring the gradient of the displacement field for the entire viewing area. This digital image provides a full-field contour map of the sample and the strain distribution. The accuracy of the strain field measured by the system is up to 0.02% of the measured strain values. Strains resulting from hygroscopic dimensional change of radiata pine wood are greatest in the tangential direction, and smallest longitudinally [28], and the ARAMIS software calculated and exported longitudinal, tangential (perpendicular to profile grooves and ridges) and shear strains.
After the first deck board sample was tested and imaged, the process was repeated for the second assigned profile, and so on until the three samples from the first parent radiata pine board had been imaged. Then samples from the second parent board were subjected to moisture cycling and imaging, followed by samples from boards 3, 4 and 5 until all samples (5 boards × 3 samples) had been imaged.
3. Results
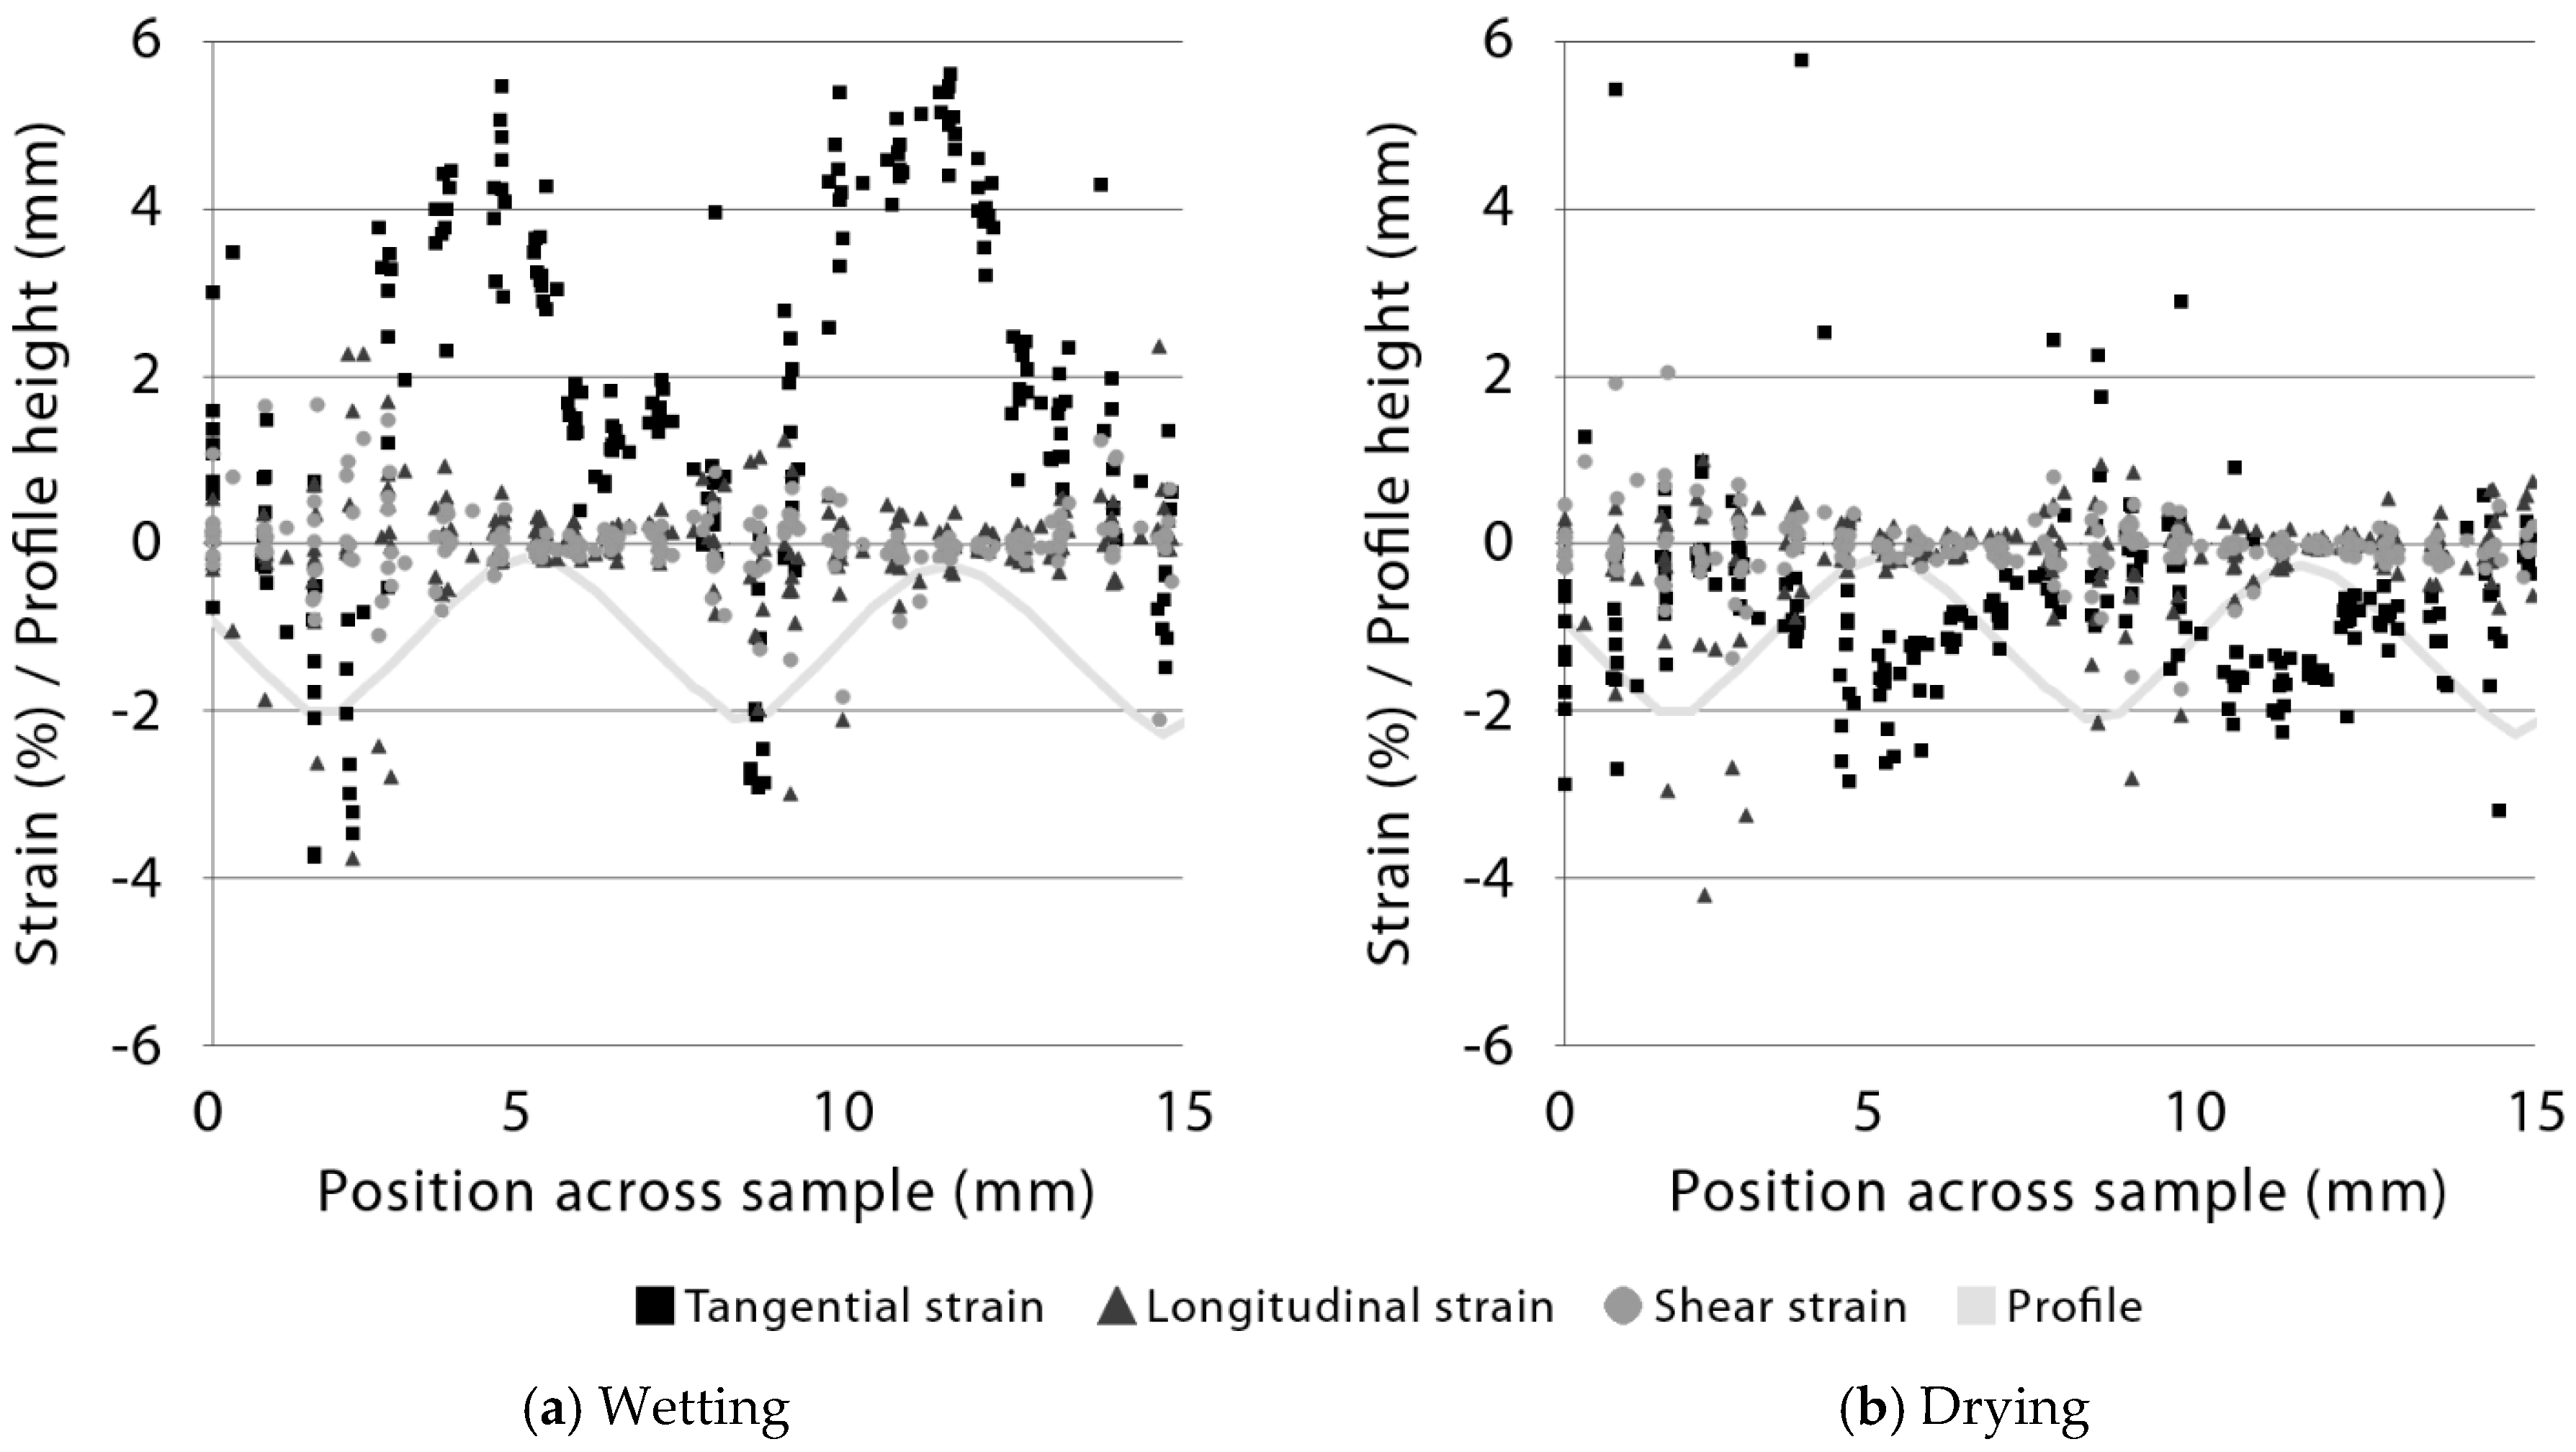
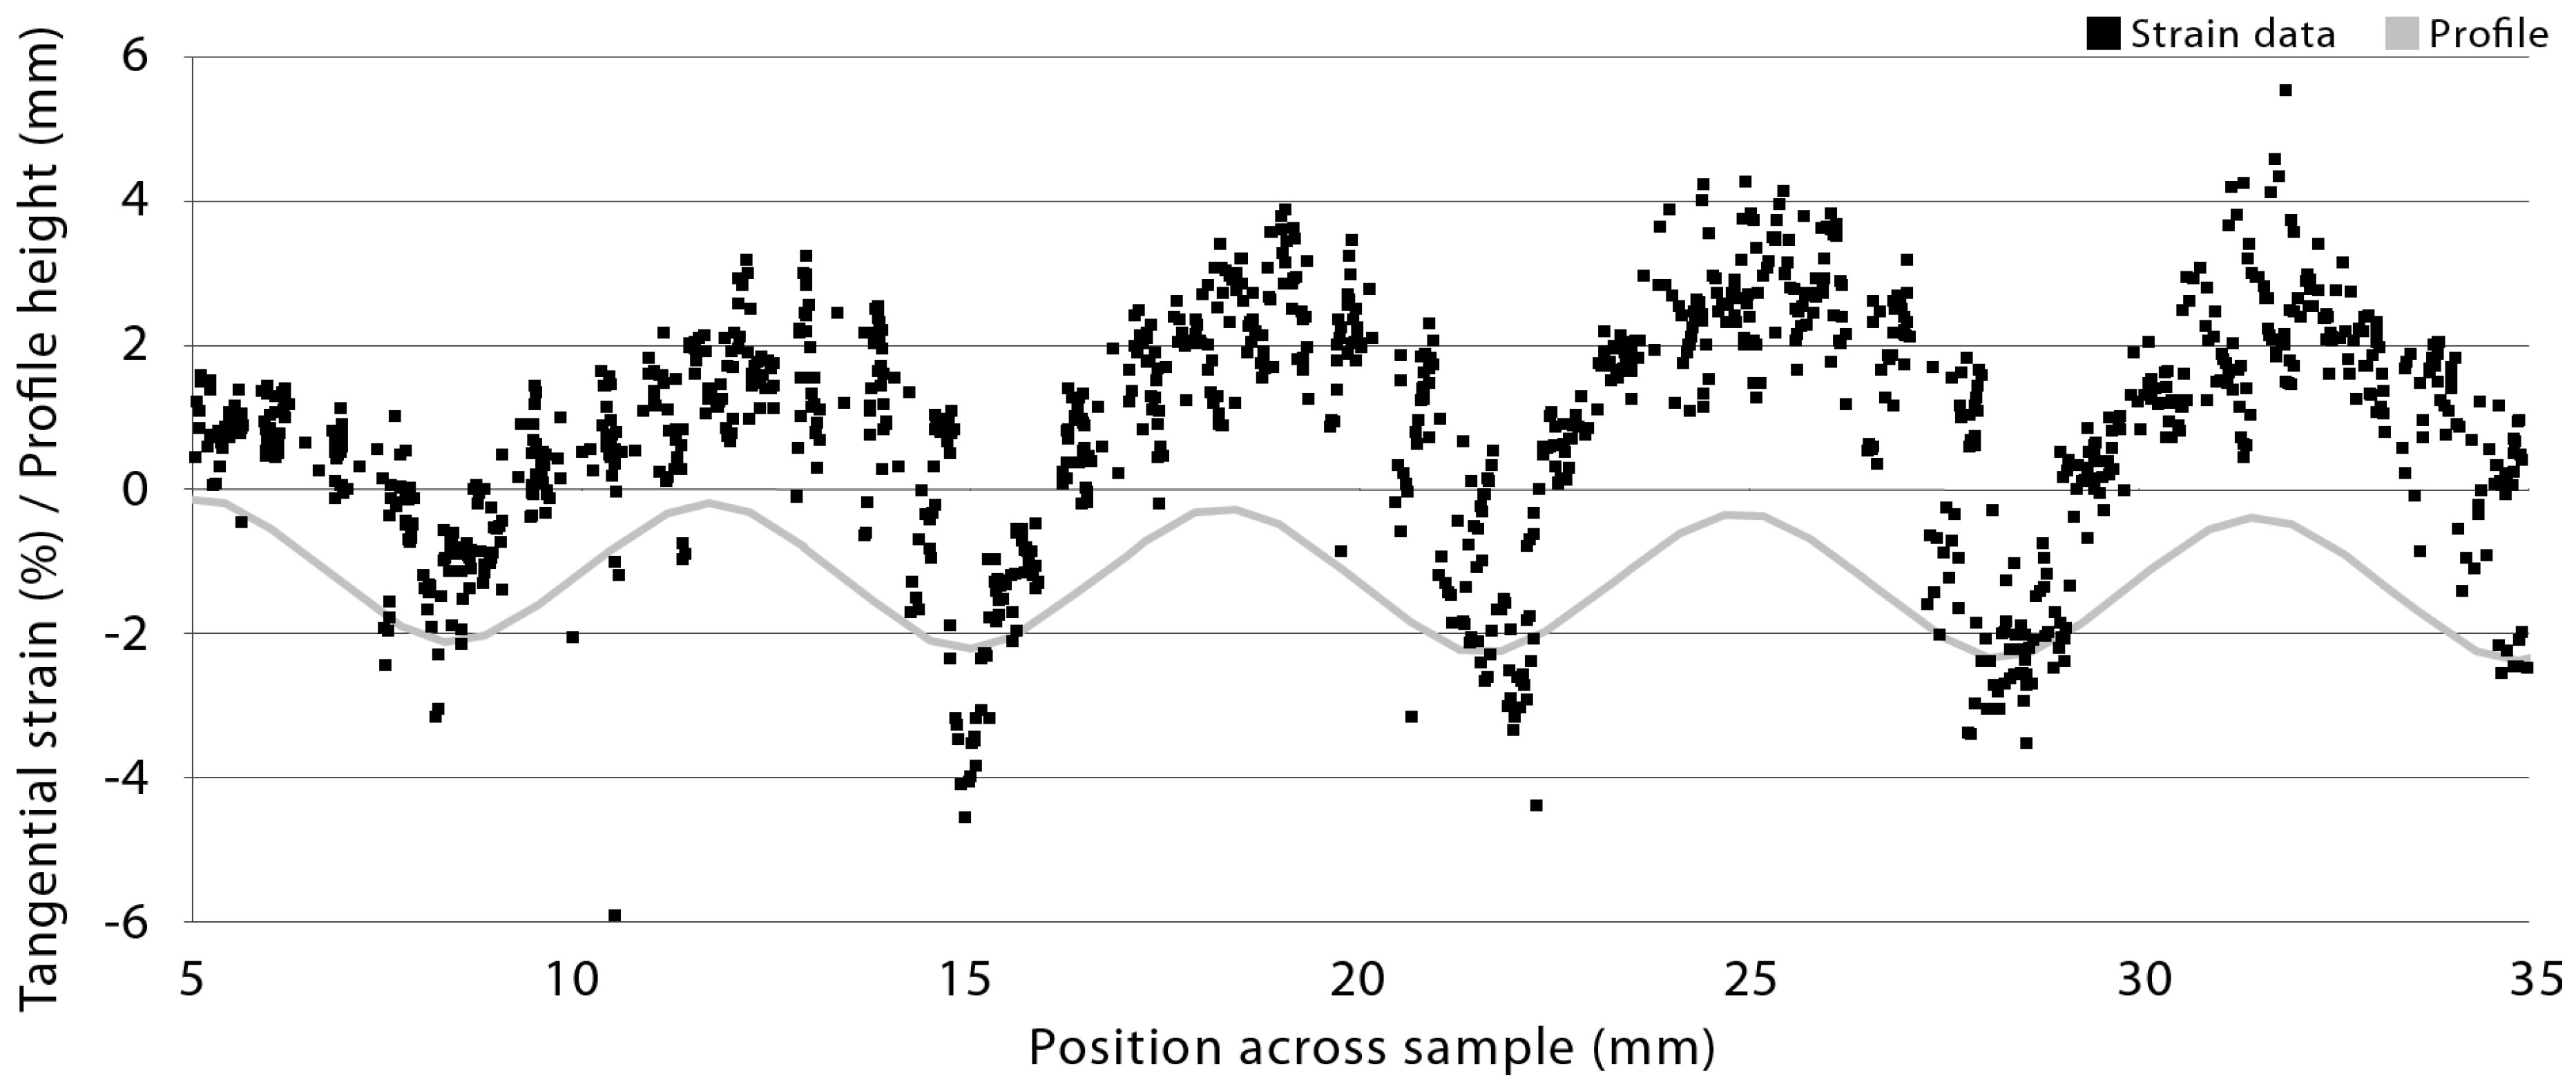
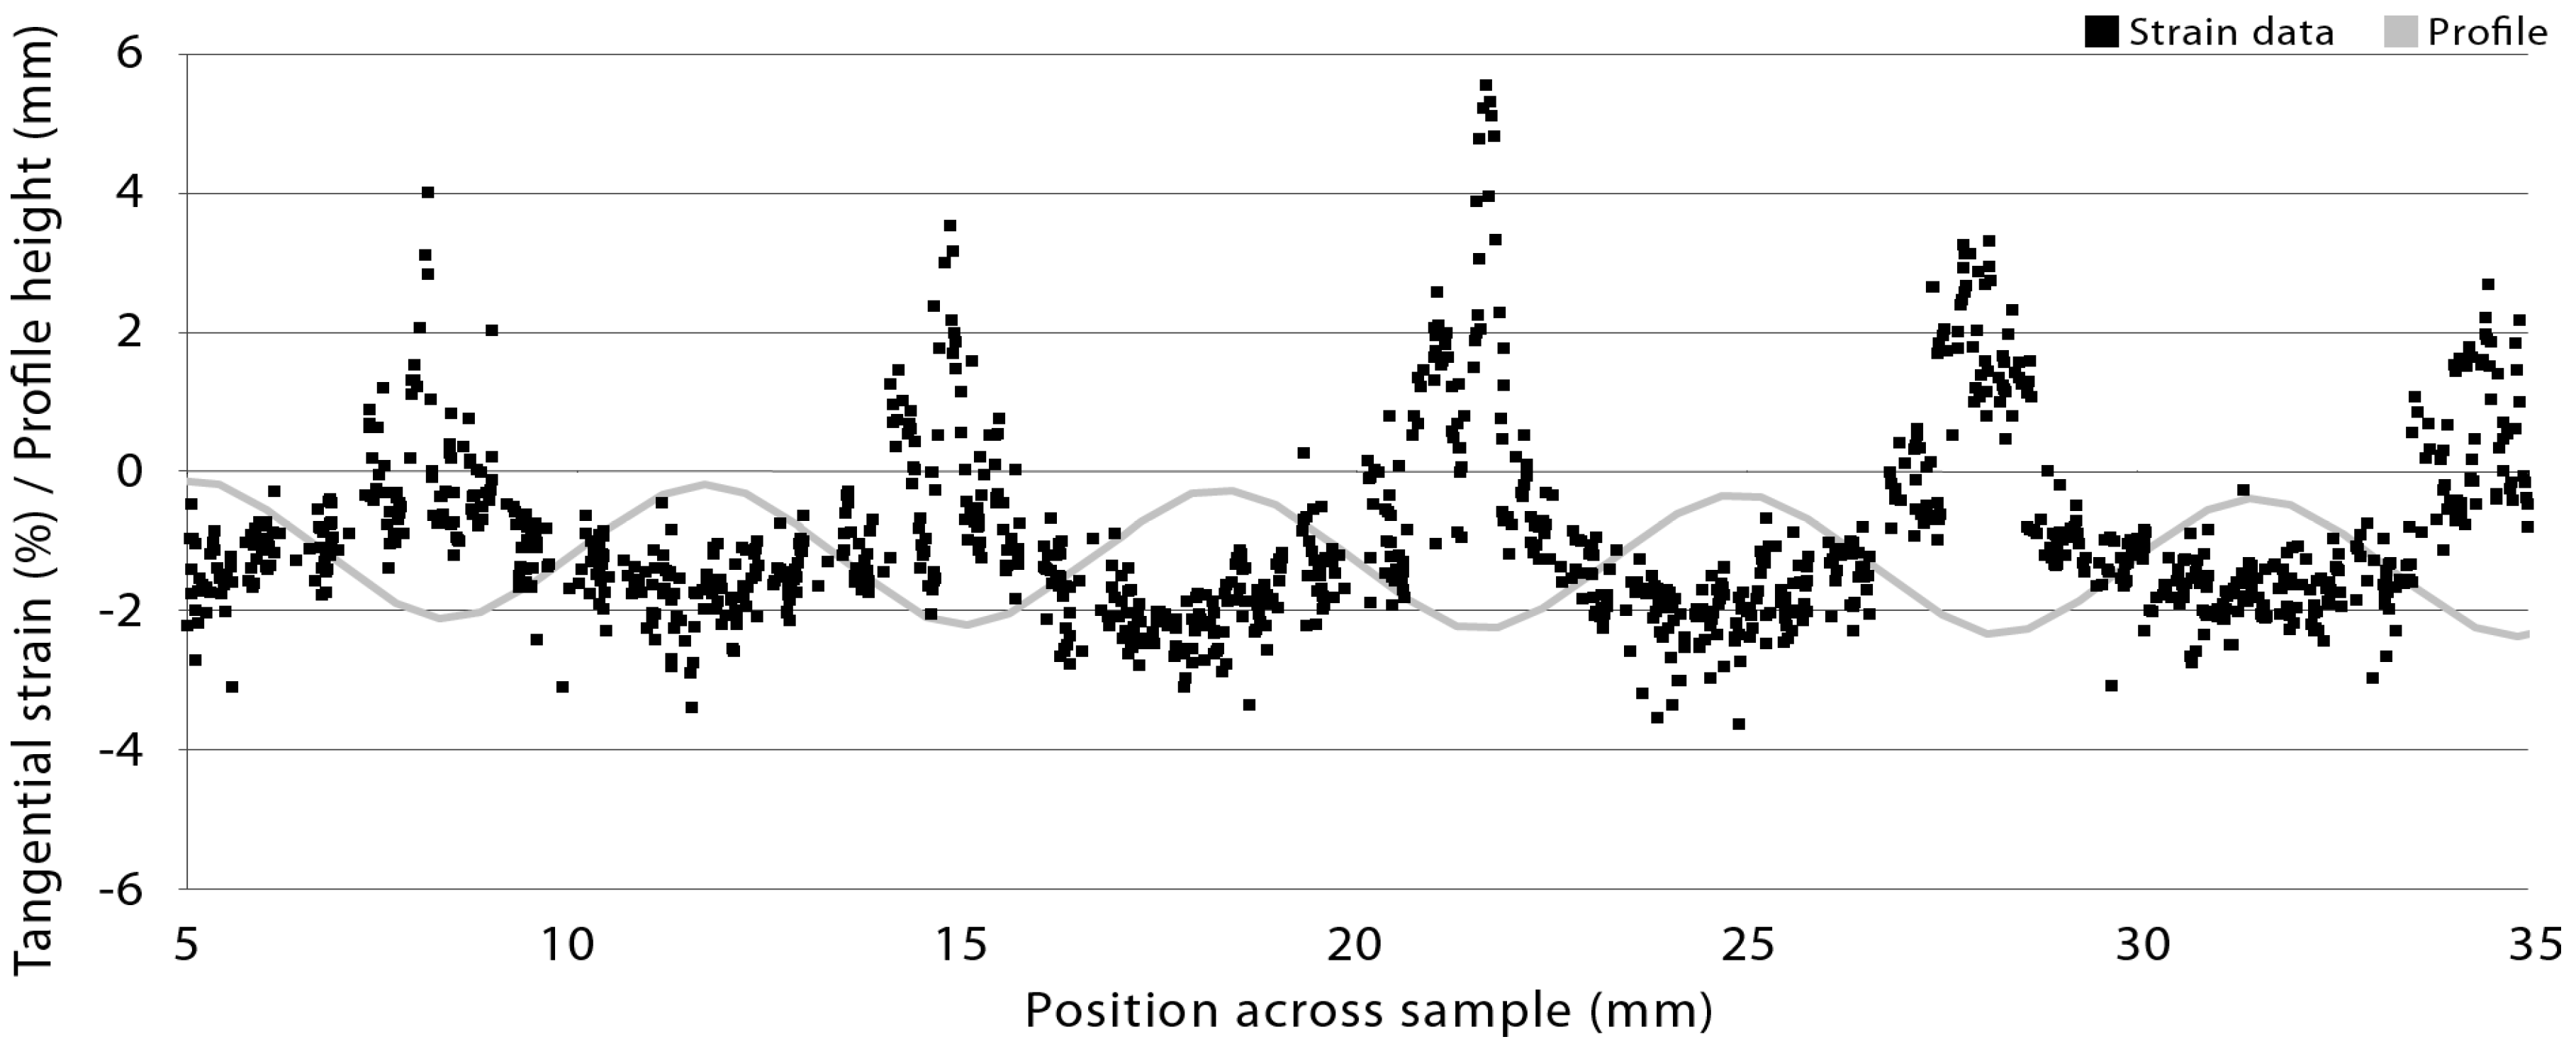
Strain data from digital image correlation of a radiata pine board with a ribble profile (sample 2, profile 1, Table 1 and Table 2) and exposed to wetting and drying is plotted in Figure 2. Tangential strain during wetting and drying is larger than longitudinal and particularly shear strains (Figure 2). The magnitude of tangential strain during wetting varies from a maximum of 5.8 to a minimum of just under −4.0 (Figure 2a). Maximum tangential strain during wetting occurs on the ridges (peaks) of the profiled board surface, and minimum strains occur in profile grooves. Such cyclical variation in tangential strains during wetting is not apparent for longitudinal or shear strains, although longitudinal strain minima occur in profile grooves (like tangential strain minima). During drying, strain data is shifted towards more negative values indicating shrinkage at the surface of profiled boards, as expected (Figure 2b), but positive strains are observed, indicating swelling. In particular, high positive tangential strains are observed in profile grooves, which is the opposite pattern to that observed during wetting. The same reversal of tangential strains during wetting and drying was observed in boards with a more wavy ‘ripple’ profile (Figure 3 and Figure 4, sample 2, profile 2, Table 1 and Table 2).
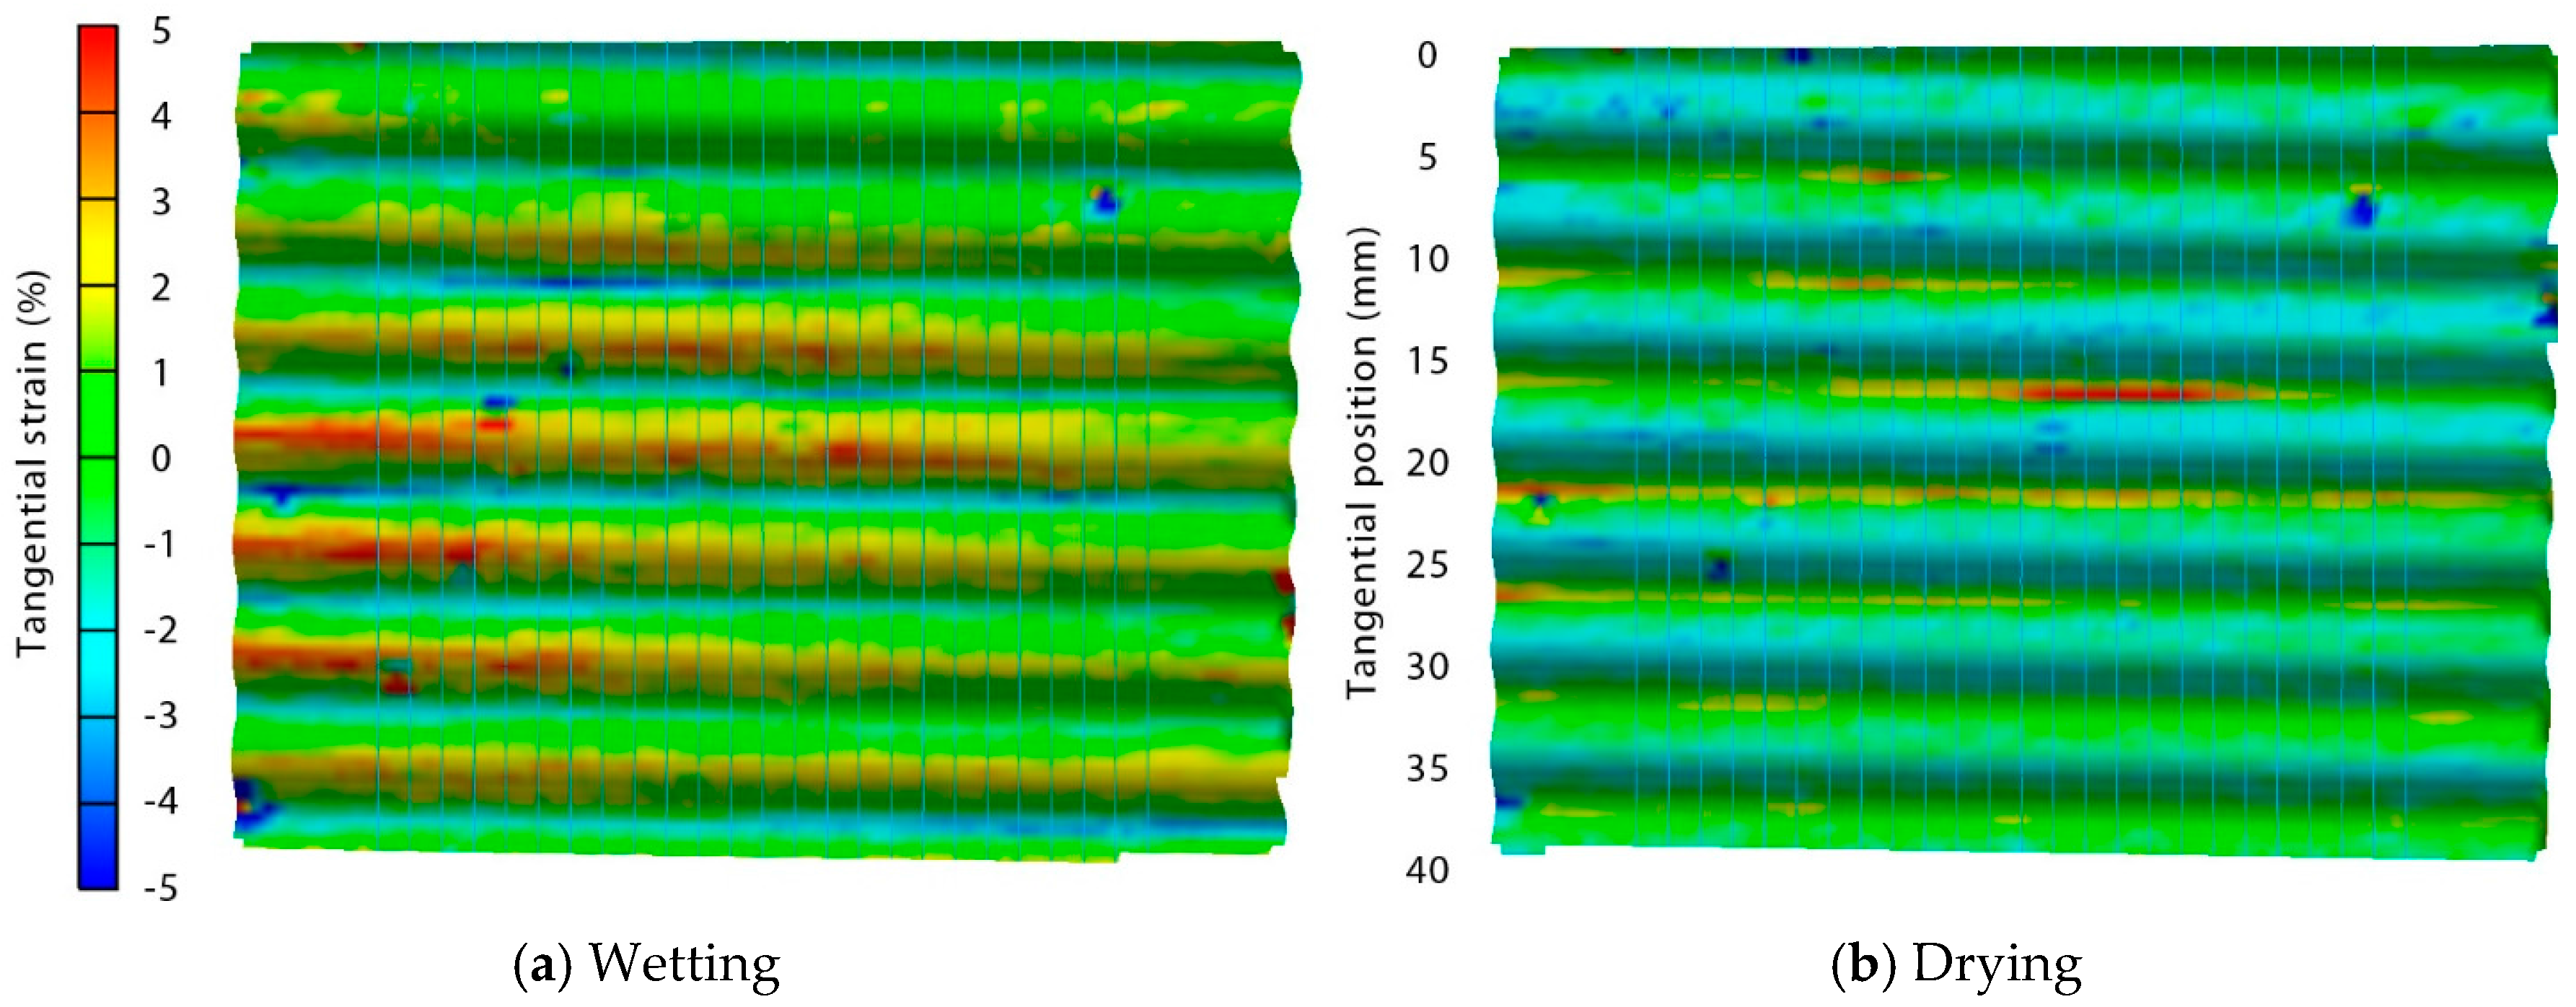
The variation in tangential strain within profiled samples as a result of their surface topography, during moisture cycling can also be observed in Figure 5. This figure is a contour and strain map of the sample (board 2, profile 2, Table 1 and Table 2) whose tangential strains are plotted in Figure 3 and Figure 4. The strain maps in Figure 5 make it easy to see the presence of high negative and positive strains in profile grooves during wetting and drying, respectively. They also show that strains on profile peaks are positive and negative during the wetting and drying phases, respectively. This regular pattern of strains in profiled samples that coincides with the presence of grooves and peaks in samples was not observed in flat samples subjected to wetting and drying. The area of high strain that is 15 mm from the top of the dry sample in Figure 5, was caused by the formation of a check at the base of the groove.
Figure 6 plots the tangential, longitudinal and shear strains in the flat radiata pine deck board (sample 2, Table 1), that is the sister to the ribble and ripple boards whose strains are shown in Figure 2, Figure 3, Figure 4 and Figure 5. Tangential strains during wetting are positive, indicating swelling, and are larger than longitudinal or shear strains. Shear strains are close to zero and longitudinal strains are slightly negative. An area with high tangential strain can be observed on the left-hand side of Figure 6, indicating pronounced surface swelling in this region of the deck board sample.
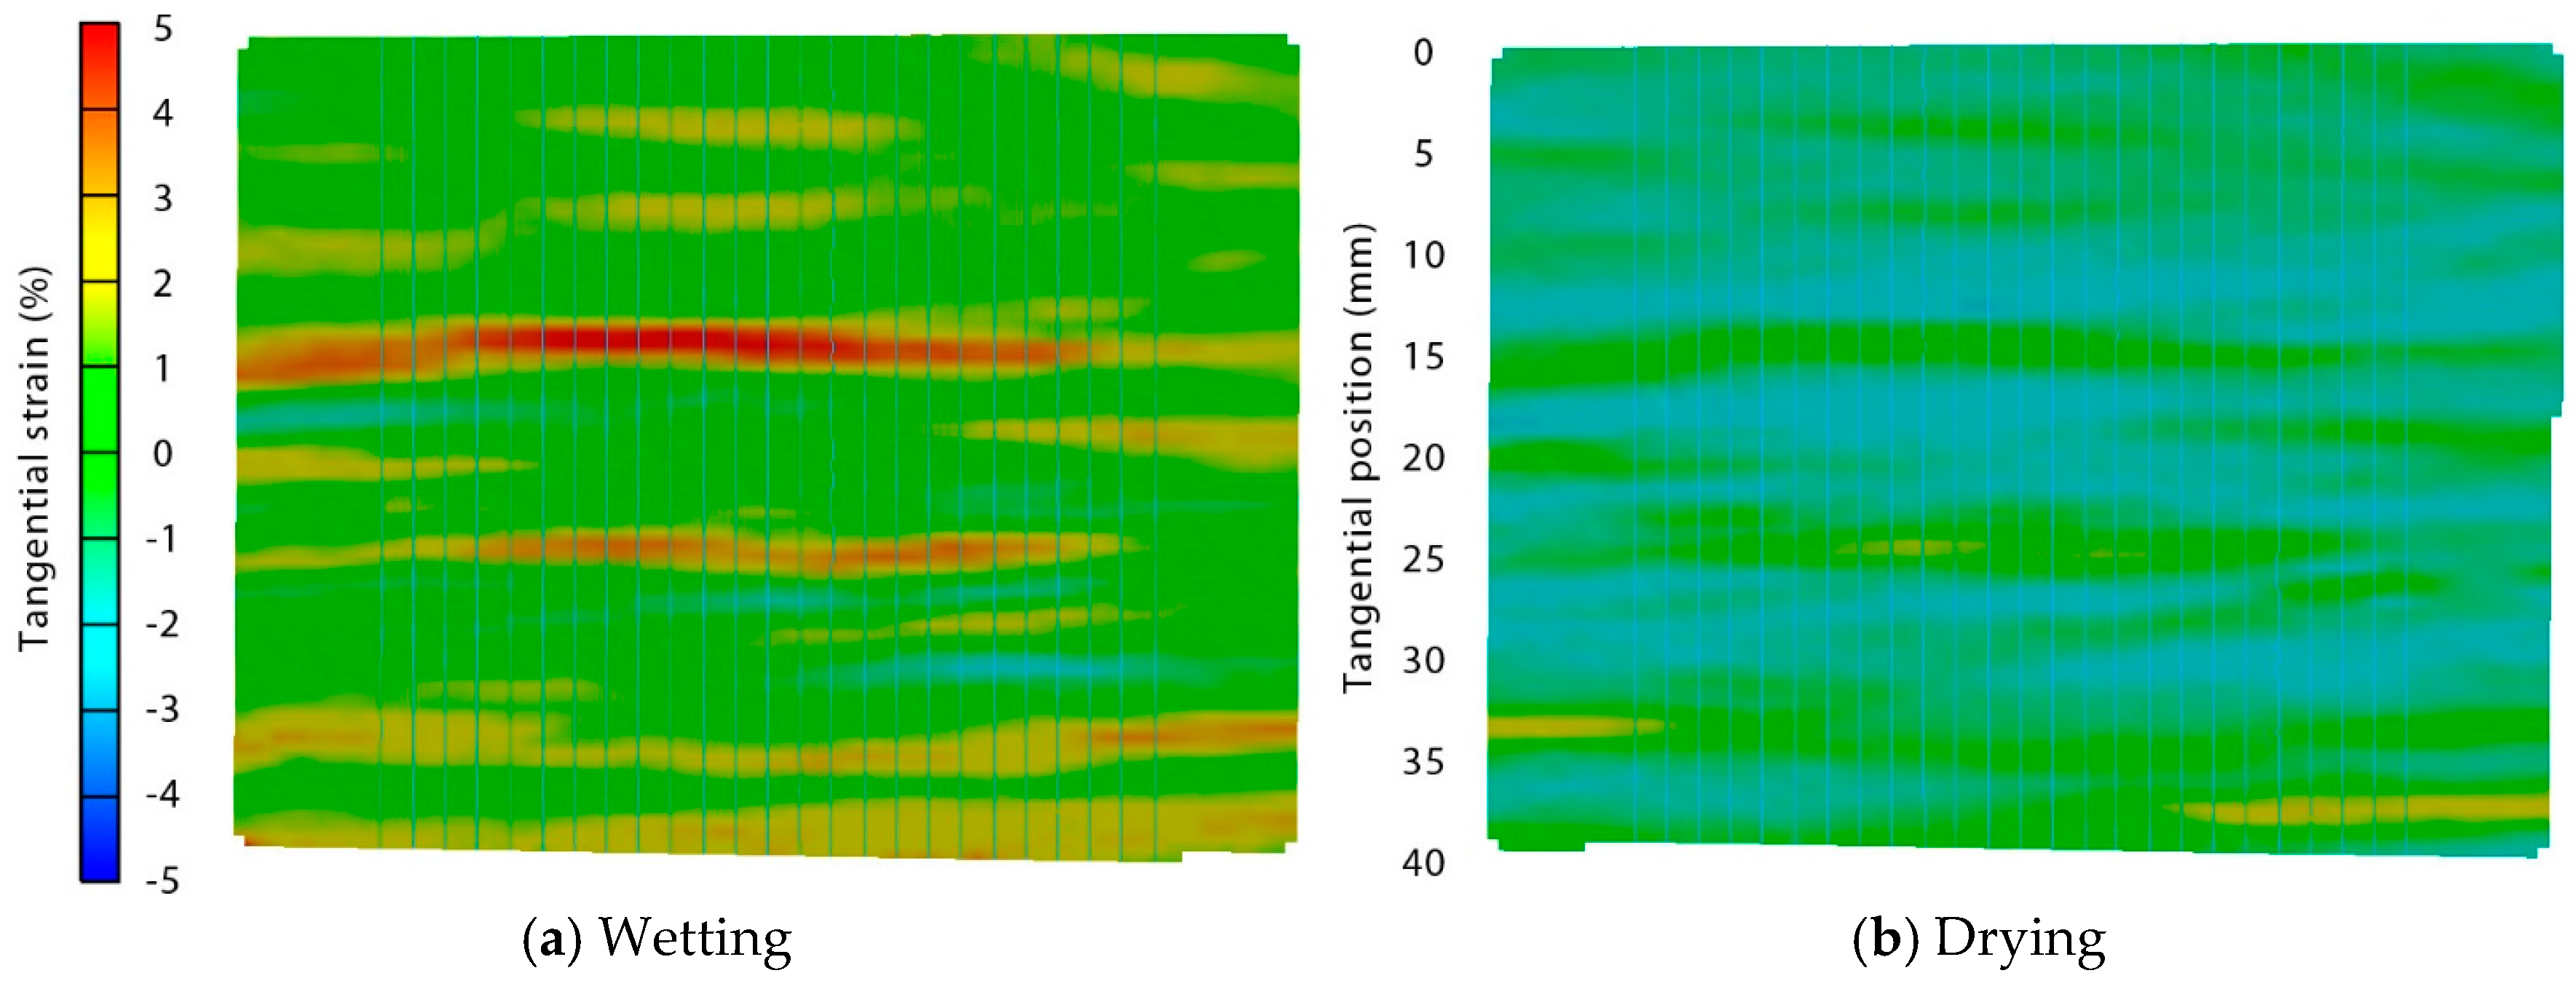
Tangential strains at the flat board surface become negative during drying indicating shrinkage, except for one area in the centre of the board that shows high (+2) positive strain (Figure 6). Longitudinal and shear strains show little change when the board is dried following wetting (Figure 6). Figure 6 indicates that tangential strains in flat deck boards during wetting and drying were heterogeneous. Such heterogeneity is clearer in strain maps of flat samples during the wetting and drying cycle (Figure 7 and Figure 8). Figure 7 shows areas of high positive strain indicating pronounced swelling, and also areas with negative strain, indicating shrinkage, in a flat board (sample 1, Table 1) during wetting. Areas with negative strain are adjacent to areas with high positive strain. During drying no strain reversal occurred, as was observed in profiled samples, but strains generally shift to negative values, although areas that developed high positive strains during wetting remained positive (Figure 7).
The shift from positive (swelling) to negative (shrinkage) strain values in a flat board (sample 2, Table 1) during the wetting and drying cycles can also be seen in Figure 8. In addition, an area of high positive strain can be seen (centre, right) in the image of the sample during the drying phase (Figure 8). This area of high positive strain corresponded to a check that formed soon after the drying phase commenced.
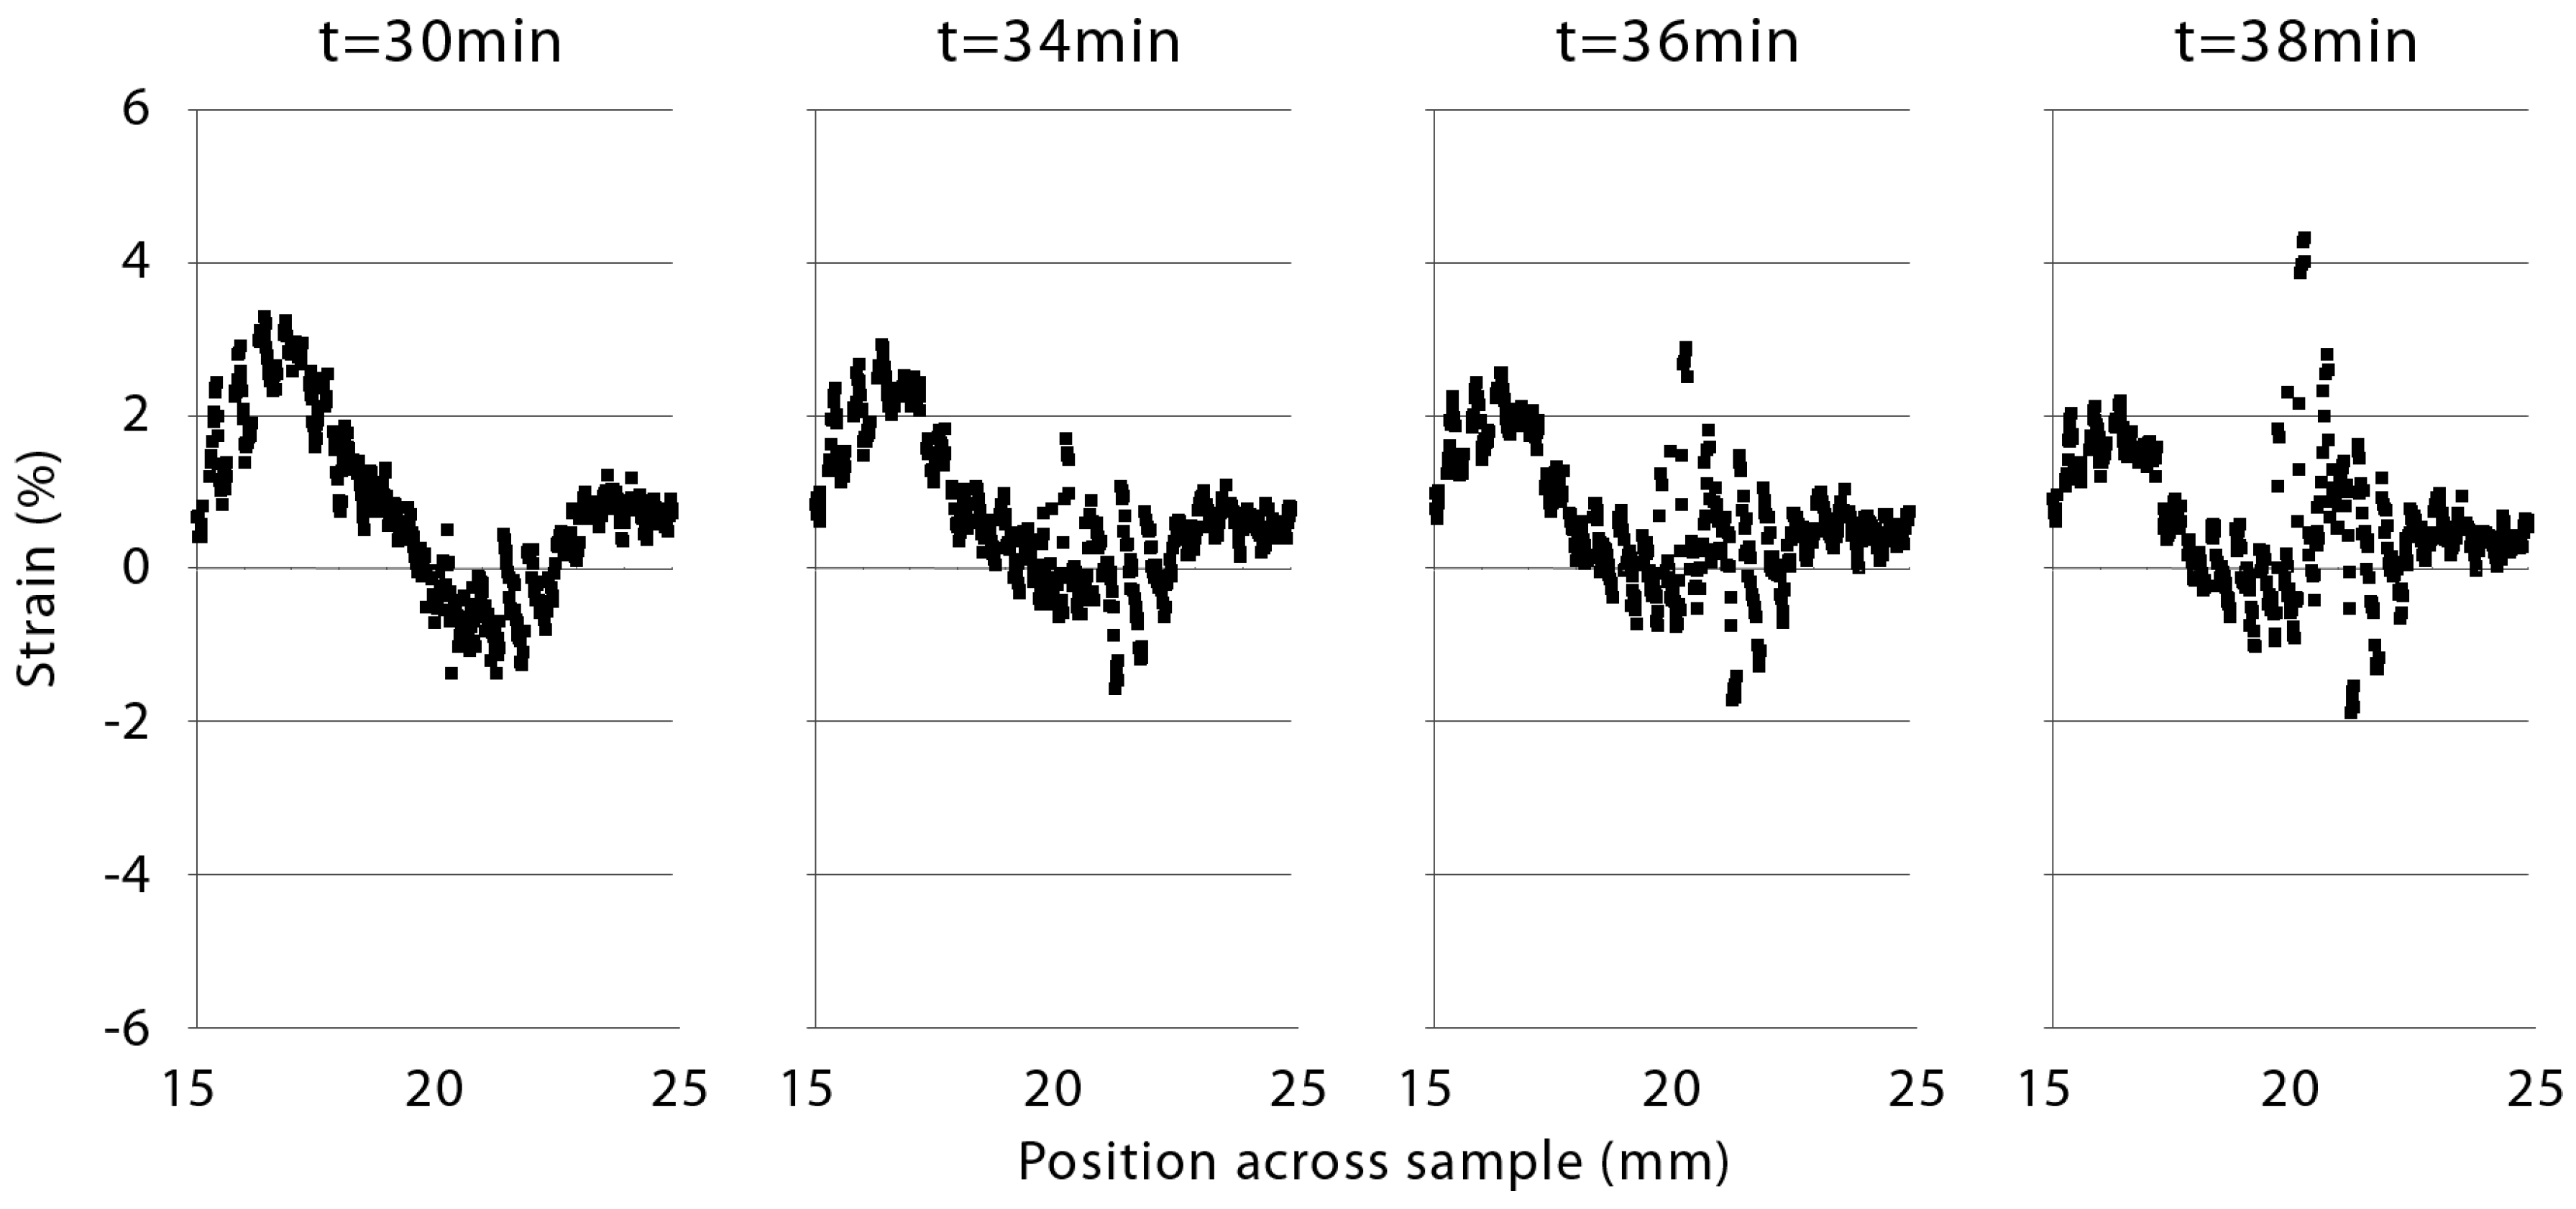
The development of the area of high positive strain in a flat board (sample 2, Table 1) that was associated with the formation of a check (Figure 8) is also shown in Figure 9. The first graph in this figure shows the local strain at the end of the wetting cycle in the area where the check developed (t = 30 min). There is an area of negative strain between two areas of positive strain, creating a sinusoidal strain pattern. After four min of drying (t = 34 min), strains decrease in magnitude, but high positive strains begin to develop in the area that had negative strain during the wetting cycle. These strains continue to increase in magnitude over the next 4 min, resulting in the development of a check (t = 36 min and 38 min). Sinusoidal strain patterns were present in all the flat decking samples that were tested. The boards did not always check, but when they did, checks invariably formed in these areas.
4. Discussion
Our findings confirm our hypothesis that grooves in profiled deck boards concentrate or increase tangential strains when boards are exposed to the drying phase of a wetting and drying cycle. The positive strains that develop within grooves during drying are large enough to cause checking [1]. Hence, our findings help explain why checks develop within grooves of profiled boards exposed to natural weathering, as first noted by Böttcher [4]. However, stresses were smaller (negative) in grooves compared to adjacent peaks during the wetting phase of our test cycle. Furthermore, strains reversed during drying, as noted above. To explain these observations we suggest that during wetting of profiled deck boards, profile peaks swell and compress areas within grooves resulting in negative strains in profile grooves, and positive strains at profile peaks, as we observed. When drying commences, profile peaks shrink and develop negative strains. The shrinkage of profile peaks exerts a tensile forces on profile grooves creating positive strains. If these strains exceed the strength of the wood perpendicular to the grain then a check will develop at the base of the groove.
Positive and negative strains also developed at the surface of flat deck boards exposed to wetting. The areas of negative strain that developed at the surface of flat deck boards during the wetting cycle were invariably adjacent to ones exhibiting high positive strains, suggesting they were produced by local compression of wood, in accord with our suggestion for the development of negative strains in the grooves of profiled deck boards during the wetting cycle. However, the strains did not reverse in flat boards during drying, as was observed at the surface of profiled boards, except in some areas where positive strains developed, which were occasionally associated with the formation of checks. These checks developed within areas that exhibited negative strains during wetting and were adjacent to areas with high positive strain, again in accord with our observation of check formation in profiled deck board samples. Hence, it appears that localized imbalances in moisture-induced surface strains that develop during wetting and drying are responsible for generating the surface tensile forces that cause checks to form. Further research is needed to confirm this hypothesis for other wood species, which, if correct, would explain why water-repellent treatments that restrict moisture ingress into permeable wood tissues, are very effective at restricting the checking of wood [29,30].
Macroscopic (visible) checks that develop at the surface of profiled deck boards are narrower, although not always shorter, than those that develop at the surface of flat deck boards [10,14]. However, profiled deck boards exposed to natural weathering develop numerous microscopic checks (micro-checks) at the base of grooves. For example, Cheng and Evans [14] noted that the percentage of grooves containing micro-checks in profiled amabilis fir (Abies amabilis (Dougl.) Forbes) deck boards exposed to the weather for 6 months varied from 98.6% to 93.0%. Our observations that high tangential strains develop at the base of grooves in profiled deck boards exposed to wetting and drying help explain the occurrence of numerous micro-checks within the grooves of profiled deck boards. These numerous micro-checks may relieve moisture-induced stresses at the surface of profiled deck boards, whereas at the surface of flat deck boards stresses are relieved by larger visible checks. Hence, profiling may be effective at reducing the deleterious effects of checking on the appearance of deck boards because it facilitates the formation of large numbers of micro-checks that are difficult to see, and which provide effective stress relief at the surface of boards.
However, the strains that developed at the surface of profiled deck boards were larger than those that developed at the surface of flat boards. This observation may explain previous observations that profiled amabilis fir deck boards exposed to natural weathering cupped (distorted) more than flat deck boards [14], and also the increased cupping of profiled western red cedar (Thuja plicata Donn ex D. Don) shakes [31] and profiled (striated) plywood cladding exposed outdoors [32]. The cupping of profiled plywood cladding was solved by ‘increasing the thickness of the striated veneer to create a balanced panel, which equalized stresses in opposing veneers’ [33]. The same approach is unsuitable for solid wood decking, but ‘it’s possible that stress relief grooves that are machined into the undersides of some deck boards [34,35] might reduce the tendency of profiled boards to cup when they are exposed outdoors’ [14]. Further research is needed to test whether sub-surface relief grooves can reduce the tendency of profiled deck boards to cup, and also to examine the strains that develop when boards with rib profiles containing very narrow grooves are exposed to wetting and drying.
5. Conclusions
Profiling increased the strains that developed at the surface of radiata pine deck boards exposed to wetting and drying, and profoundly altered their spatial distribution and direction (positive or negative). We propose a mechanism to explain these observations, and also the strains (and checking) that developed at the surface of flat deck boards exposed to wetting and drying. Our results help explain why profiling is effective at reducing the undesirable effects of surface checking on the appearance of deck boards. They also explain why profiling increases the tendency of profiled deck boards to cup when they are exposed to natural weathering. The latter, undesirable effect of profiling may be reduced by machining sub-surface relief grooves in profiled deck boards to balance the high strains that develop at the surface of profiled deck boards. Further research is needed to test this hypothesis, and also to examine the strains that develop when deck boards with rib profiles are exposed to wetting and drying.
Acknowledgments
We thank Natural Science and Engineering Research Council of Canada for financial support (CRDPJ 485007-15); Alan Preston for suggesting profiling as a challenging topic for research, and his helpful insights into the problems caused by the checking of wood decking; Kenneth J. Cheng, Vincent Leung and Lawrence Gunther for technical assistance. Philip D. Evans (P.D.E.) thanks Faculty of Forestry (UBC), FPInnovations, Tolko and Viance for their support of his BC Leadership Chair at the University of British Columbia, and the University of Queensland for an Honorary Professorship in the School of Civil Engineering (Centre for Future Timber Structures), University of Queensland, St Lucia, Queensland, Australia.
Author Contributions
J.M., S.K. and P.D.E. conceived and designed the experiments. J.M. performed all experimental work. P.D.E. wrote the first draft of the paper. All three authors discussed and commented on the results and contributed to the final submitted and published paper.
Conflicts of Interest
The authors declare no conflict of interest and none of the individuals or organizations acknowledged above were involved in the design of our experiment, collection, and interpretation of data or the writing of this paper.
References
- Schniewind, A.P. Mechanism of check formation. For. Prod. J. 1963, 13, 475–480. [Google Scholar]
- Green, C. Synthetic decking takes off. Fine Homebuild. 2005, 172, 44–49. [Google Scholar]
- Wood & Competitive Decking—Demand and Sales Forecasts, Market Share, Market Size, Market Leaders Freedonia Group. Available online: https://www.freedoniagroup.com/Wood-Competitive-Decking.html (accessed on 28 December 2017).
- Böttcher, P. Einfluß verschiedenartiger oberflächenprofilierungen an holz auf die veränderung der wetterbeständigkeit. Holz Roh-Werkst. 1977, 35, 247–251. [Google Scholar]
- Shida, S.; Ono, H.; Mikami, T.; Takahashi, H. Utilization and evaluation of exterior wood. IV. Slipperiness of wood decks for floating piers. Mokuzai Gakkaishi 1992, 38, 835–840. [Google Scholar]
- Cheng, K.J.; Evans, P.D. A note on the surface topography of profiled wood decking. Aust. For. J. 2016, 79, 147–152. [Google Scholar] [CrossRef]
- McFarling, S.M.; Morris, P.I. High Performance Wood Decking. In Proceedings of the Twenty Sixth Annual Meeting Canadian Wood Preservation Association, Toronto, ON, Canada, 25–26 October 2005; Canadian Wood Preservation Association: Campbellville, ON, Canada, 2006; pp. 99–109. [Google Scholar]
- Morris, P.I.; McFarling, S. Field Testing of Wood Products in Canada XVII: High-performance Profiled Wood Decking. In Proceedings of the Twenty Ninth Annual Meeting Canadian Wood Preservation Association, Vancouver, BC, Canada, 28–29 October 2008; Canadian Wood Preservation Association: Campbellville, ON, Canada, 2009; pp. 72–82. [Google Scholar]
- McFarling, S.M.; Morris, P.I.; Knudson, R.M. Extracting greater value from subalpine fir: Profiled decking. For. Prod. J. 2009, 59, 24–28. [Google Scholar]
- Evans, P.D.; Cullis, I.; Morris, P.I. Checking of profiled southern pine and amabilis fir deck boards. For. Prod. J. 2010, 60, 501–507. [Google Scholar] [CrossRef]
- Cheng, K.J.; Evans, P.D. Weathering Performance of White Spruce Decking Treated with Low Molecular Weight Phenol Formaldehyde Resin. In Proceedings of the Eleventh Pacific Rim Bio-based Composites Symposium, Shizuoka, Japan, 28–30 November 2012; Wood Technological Association of Japan: Tokyo, Japan, 2012; pp. 575–577. [Google Scholar]
- Akhtari, M.; Nicholas, D. Effect of profiling and preservative treatments on the weathering characteristics of southern pine deck boards. Eur. J. Wood Wood Prod. 2014, 72, 829–831. [Google Scholar] [CrossRef]
- Akhtari, M.; Nicholas, D. Effect of machined profile, zinc oxide and titanium dioxide particles on checking southern pine deck boards during weathering. IET Nanobiotechol. 2014, 1–4. [Google Scholar] [CrossRef] [PubMed]
- Cheng, K.J.; Evans, P.D. Manufacture of profiled amabilis fir deckboards with reduced susceptibility to surface checking. J. Manuf. Mater. Process. 2018, 2, 7. [Google Scholar] [CrossRef]
- Morris, P.I.; Ingram, J.K. Field Testing of Wood Preservatives in Canada. XI. Nine-year Inspection of the CITW Decking Test. In Proceedings of the Twenty Third Annual Meeting Canadian Wood Preservation Association, Vancouver, BC, Canada, 22–23 October 2002; Canadian Wood Preservation Association: Campbellville, ON, Canada, 2003; pp. 156–169. [Google Scholar]
- Ghosh, S.J.; Srivastava, A. Cracks in steam turbine components. Russ. J. Nondestruct. Test. 2006, 42, 134–146. [Google Scholar] [CrossRef]
- Zink, A.G.; Davidson, R.W.; Hanna, R.B. Strain measurement in wood using a digital image correlation technique. Wood Fiber Sci. 1995, 27, 346–359. [Google Scholar]
- Grédiac, M. The use of full-field measurement methods in composite material characterization: Interest and limitations. Compos. Part A Appl. Sci. Manuf. 2004, 35, 751–761. [Google Scholar] [CrossRef]
- Konnerth, J.; Valla, A.; Gindl, W.; Müller, U. Measurement of strain distribution in timber finger joints. Wood Sci. Technol. 2006, 40, 631–636. [Google Scholar] [CrossRef]
- Peters, W.H.; Ranson, W.F. Digital imaging techniques in experimental stress analysis. Opt. Eng. 1982, 21, 427–431. [Google Scholar] [CrossRef]
- Kang, H.; Muszyński, L.; Milota, M.; Kang, C.; Matsumura, J. Preliminary tests for optically measuring drying strains and check formation in wood. J. Fac. Agric. Kyushu Univ. 2011, 56, 313–316. [Google Scholar]
- Kang, H.; Muszyński, L.; Milota, M. Optical measurement of deformations in drying lumber. Dry. Technol. 2011, 29, 127–134. [Google Scholar] [CrossRef]
- McCormick, N.; Lord, J. Digital image correlation. Mater. Today 2010, 13, 52–54. [Google Scholar] [CrossRef]
- Evans, P.D.; Vollmer, S.; Kim, J.D.W.; Chan, G.; Kraushaar Gibson, S. Improving the performance of clear coatings on wood through the aggregation of marginal gains. Coatings 2016, 6, 66. [Google Scholar] [CrossRef]
- Evans, P.D.; Cullis, I.; Kim, J.D.W.; Leung, L.H.; Hazneza, S.; Heady, R.D. Microstructure and mechanism of grain raising in wood. Coatings 2017, 7, 135. [Google Scholar] [CrossRef]
- Lecompte, D.; Smits, A.; Bossuyt, S.; Sol, H.; Vantomme, J.; Van Hemelrijck, D.; Habraken, A.M. Quality assessment of speckle patterns for digital image correlation. Opt. Laser Eng. 2006, 44, 1132–1145. [Google Scholar] [CrossRef]
- Wengert, E.M. Parameters for Predicting Maximum Surface Temperature of Wood in Exterior Exposure. In United States Department of Agriculture, Forest Service, Forest Products Laboratory, Research Paper FPL-RP 62; Forest Products Laboratory: Madison, WI, USA, 1966; 19p. [Google Scholar]
- Harris, J.M.; Meylan, B.A. The influence of microfibril angle on longitudinal and tangential shrinkage in Pinus radiata. Holzforschung 1965, 19, 144–153. [Google Scholar] [CrossRef]
- Christy, A.G.; Senden, T.J.; Evans, P.D. Automated measurement of checks at wood surfaces. Measurement 2005, 37, 109–118. [Google Scholar] [CrossRef]
- Evans, P.D.; Wingate-Hill, R.; Cunningham, R.B. Wax and oil emulsion additives: How effective are they at improving the performance of preservative-treated wood. For. Prod. J. 2009, 59, 66–70. [Google Scholar]
- Norlander, N.E.; Knowles, R.A. Method and Apparatus for Making Simulated Hand Split Shakes. U.S. Patent 3,512,562, 19 May 1970. [Google Scholar]
- Deskey, D. Plywood Panel. U.S. Patent 2,286,068, 9 June 1942. [Google Scholar]
- Bailey, W.C. Balanced Striated Plywood Panel. U.S. Patent 2,363,927, 28 November 1944. [Google Scholar]
- Nystrom, R. Board for Use in Constructing a Flooring Surface. U.S. Patent 5,474,831, 12 December 1995. [Google Scholar]
- Ratu, R.; Weizenegger, J.; Evans, P.D. Preliminary Observations of the Effect of Kerfing on the Surface Checking and Warping of Flat Sawn Southern Pine Decking. In Proceedings of the Thirty Eighth Annual Meeting of International Research Group on Wood Protection, Jackson Lake Lodge, WY, USA, 20–24 May 2007; IRG/WP 07-20360. International Research Group on Wood Protection: Stockholm, Sweden, 2007; pp. 1–7. [Google Scholar]
Figure 1.
(a) Deck board sample (7) screwed to wooden joists (6), firmly clamped by vices (5) and attached to a galvanized steel frame (4). Halogen lamps (1) and a secondary heat lamp (3) illuminate and heat the sample causing rapid drying following the application of water. A tripod and camera mount (2) held digital image correlation cameras [not shown] in place during wetting and drying of the sample; (b) Cross-sections of profiled samples with ribble (5-2) and ripple profiles (5-4).
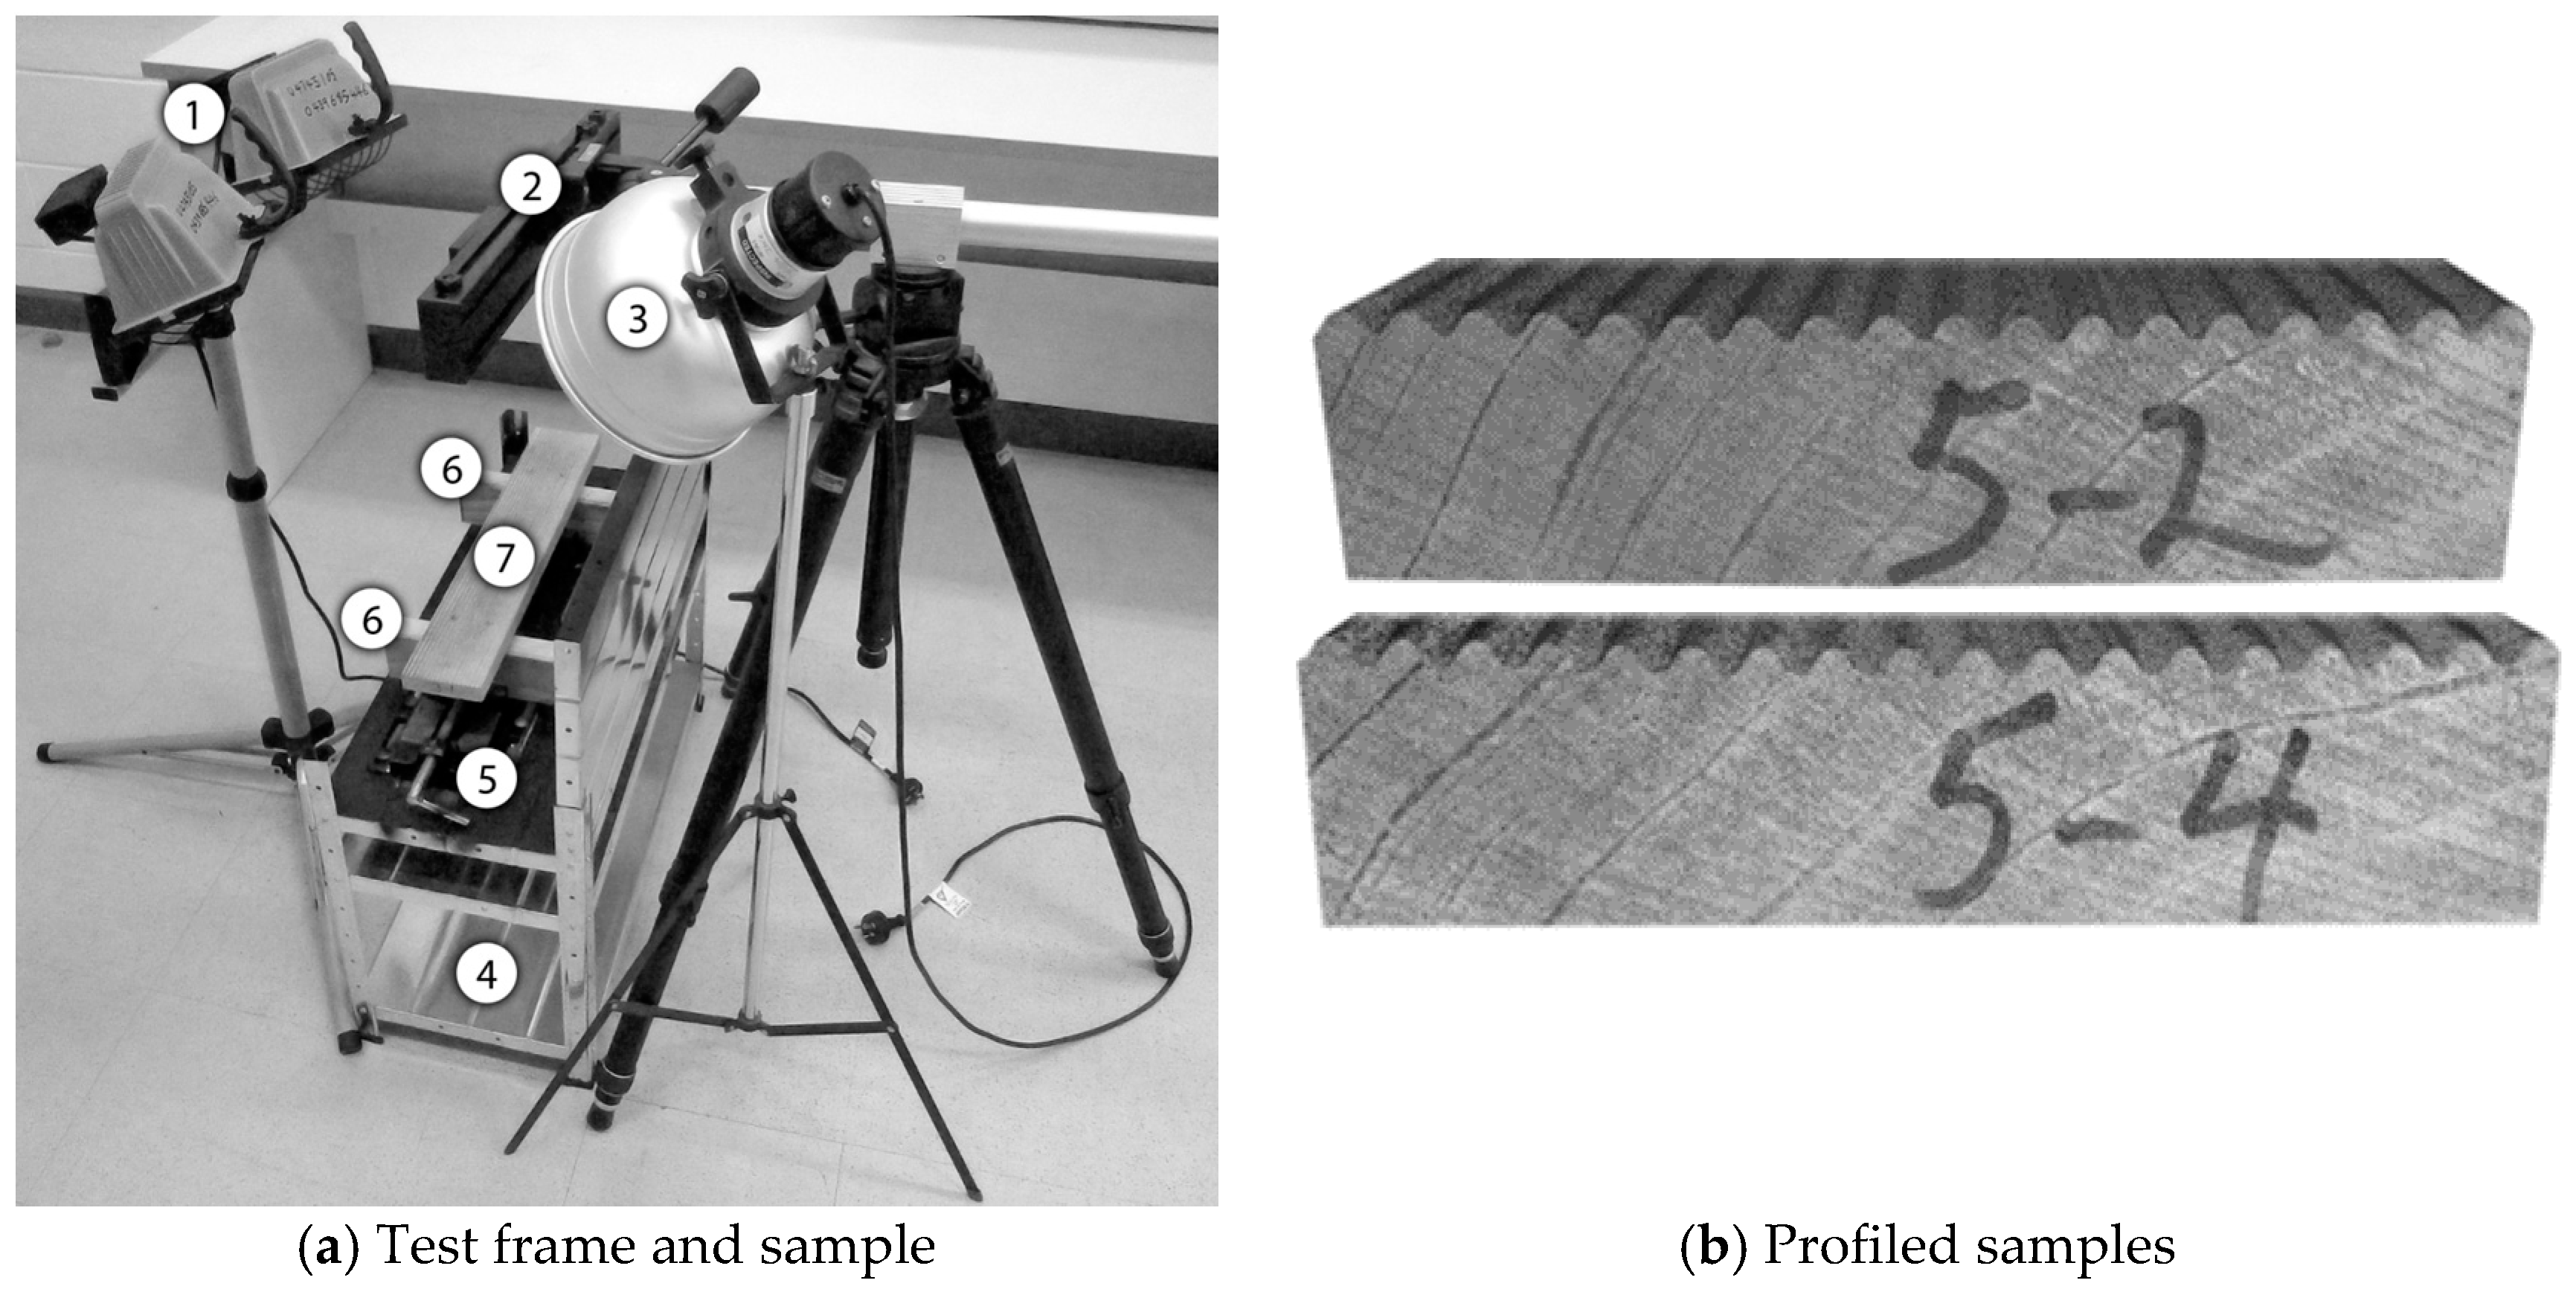
Figure 2.
Tangential, longitudinal and shear strains in a radiata pine board with a ribble profile during wetting and drying. Note that positive or negative (-) strains are superimposed on a cross-section of the profiled surface, and tangential strains are much higher than longitudinal or shear strains.

Figure 3.
Tangential strains in a radiata pine board with a ripple profile during the wetting phase of the test cycle. Note the positive strains in the profile peaks and the negative (-) strains in the profile grooves.
Figure 3.
Tangential strains in a radiata pine board with a ripple profile during the wetting phase of the test cycle. Note the positive strains in the profile peaks and the negative (-) strains in the profile grooves.

Figure 4.
Tangential strains in a radiata pine board with a ripple profile during the drying phase of the test cycle. Note the negative (-) strains in the profile peaks and the high positive strains in the profile grooves.
Figure 4.
Tangential strains in a radiata pine board with a ripple profile during the drying phase of the test cycle. Note the negative (-) strains in the profile peaks and the high positive strains in the profile grooves.

Figure 5.
Contour and tangential strain maps of a radiata pine board with a ripple profile during the wetting and drying phases of the test cycle.
Figure 5.
Contour and tangential strain maps of a radiata pine board with a ripple profile during the wetting and drying phases of the test cycle.

Figure 6.
Tangential, longitudinal and shear strains in a flat unprofiled radiata pine board during wetting and drying. Note tangential strains are greater than longitudinal and shear strains, and there are regions of the board surface during wetting and drying that show high positive strain.
Figure 6.
Tangential, longitudinal and shear strains in a flat unprofiled radiata pine board during wetting and drying. Note tangential strains are greater than longitudinal and shear strains, and there are regions of the board surface during wetting and drying that show high positive strain.
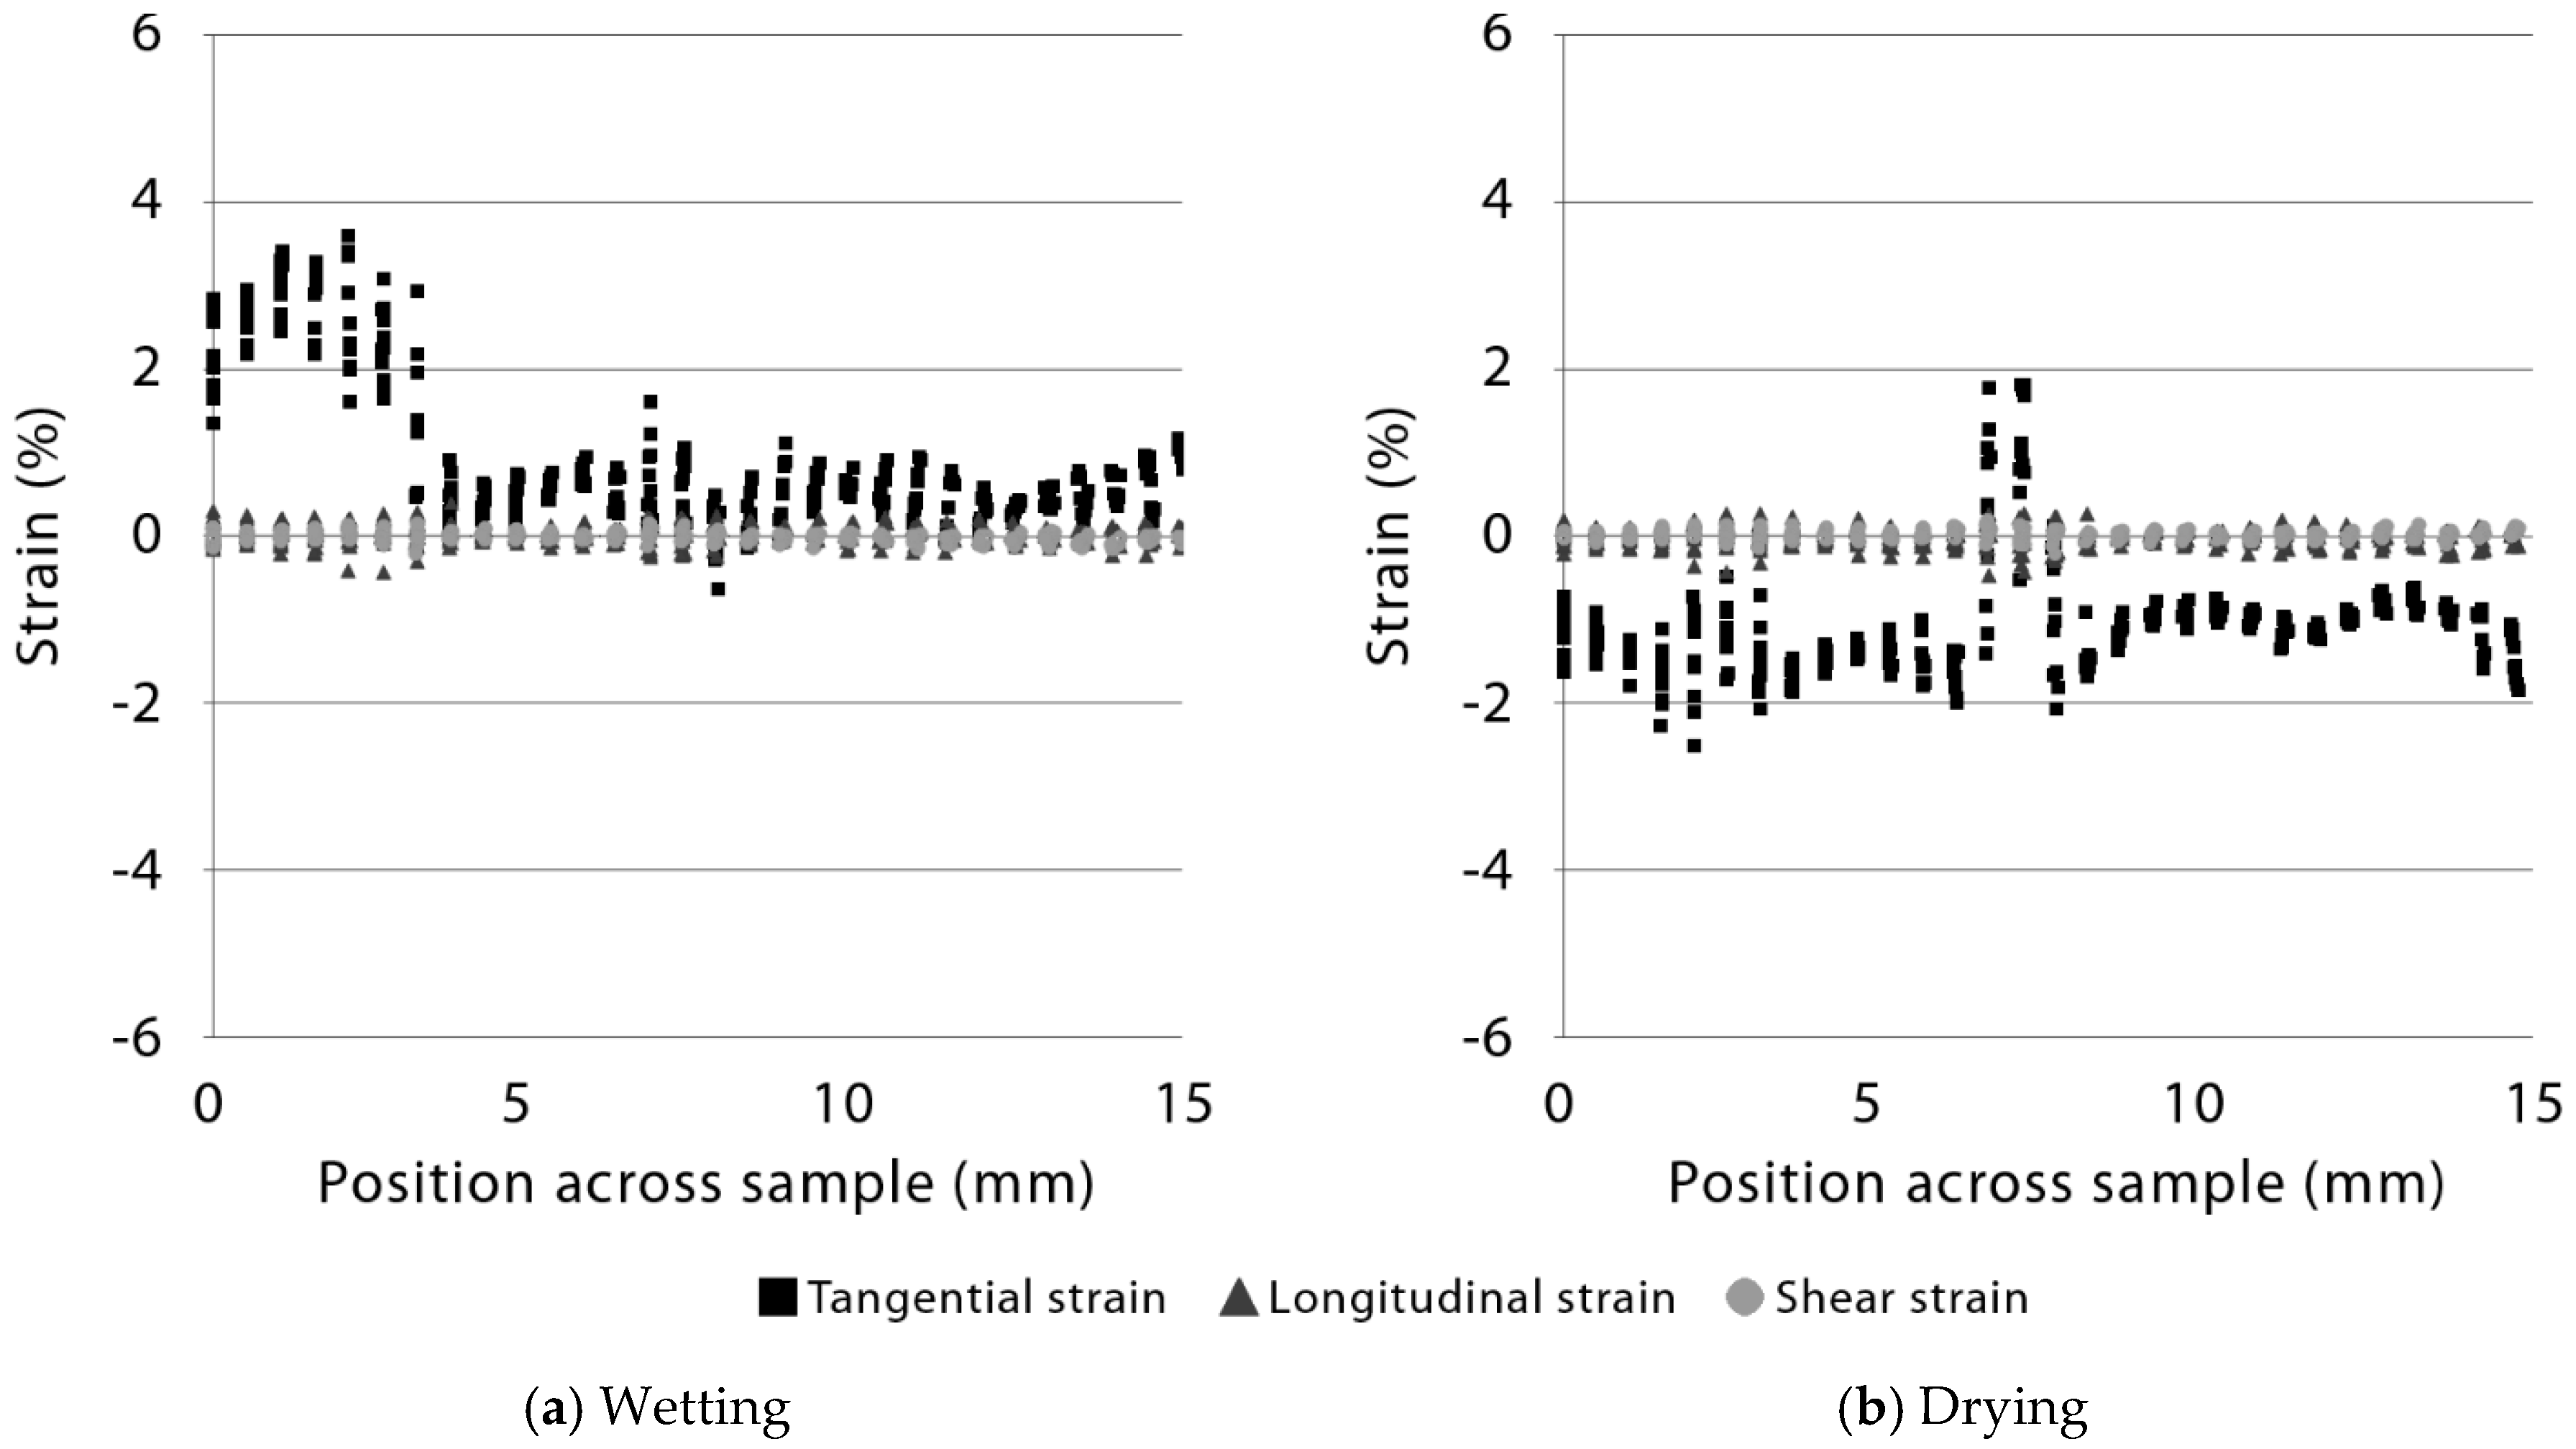
Figure 7.
Tangential strain maps of a flat radiata pine board during the wetting and drying phases of the test cycle. Note the shift from positive to negative (-) strains during the wetting and drying cycle and the presence of areas with negative and positive strains during wetting and drying, respectively.

Figure 8.
Tangential strain maps of a flat radiata pine board during the wetting and drying phases of the test cycle. Note the area with high positive strain (centre right) in the sample during the drying phase of the test cycle.
Figure 8.
Tangential strain maps of a flat radiata pine board during the wetting and drying phases of the test cycle. Note the area with high positive strain (centre right) in the sample during the drying phase of the test cycle.
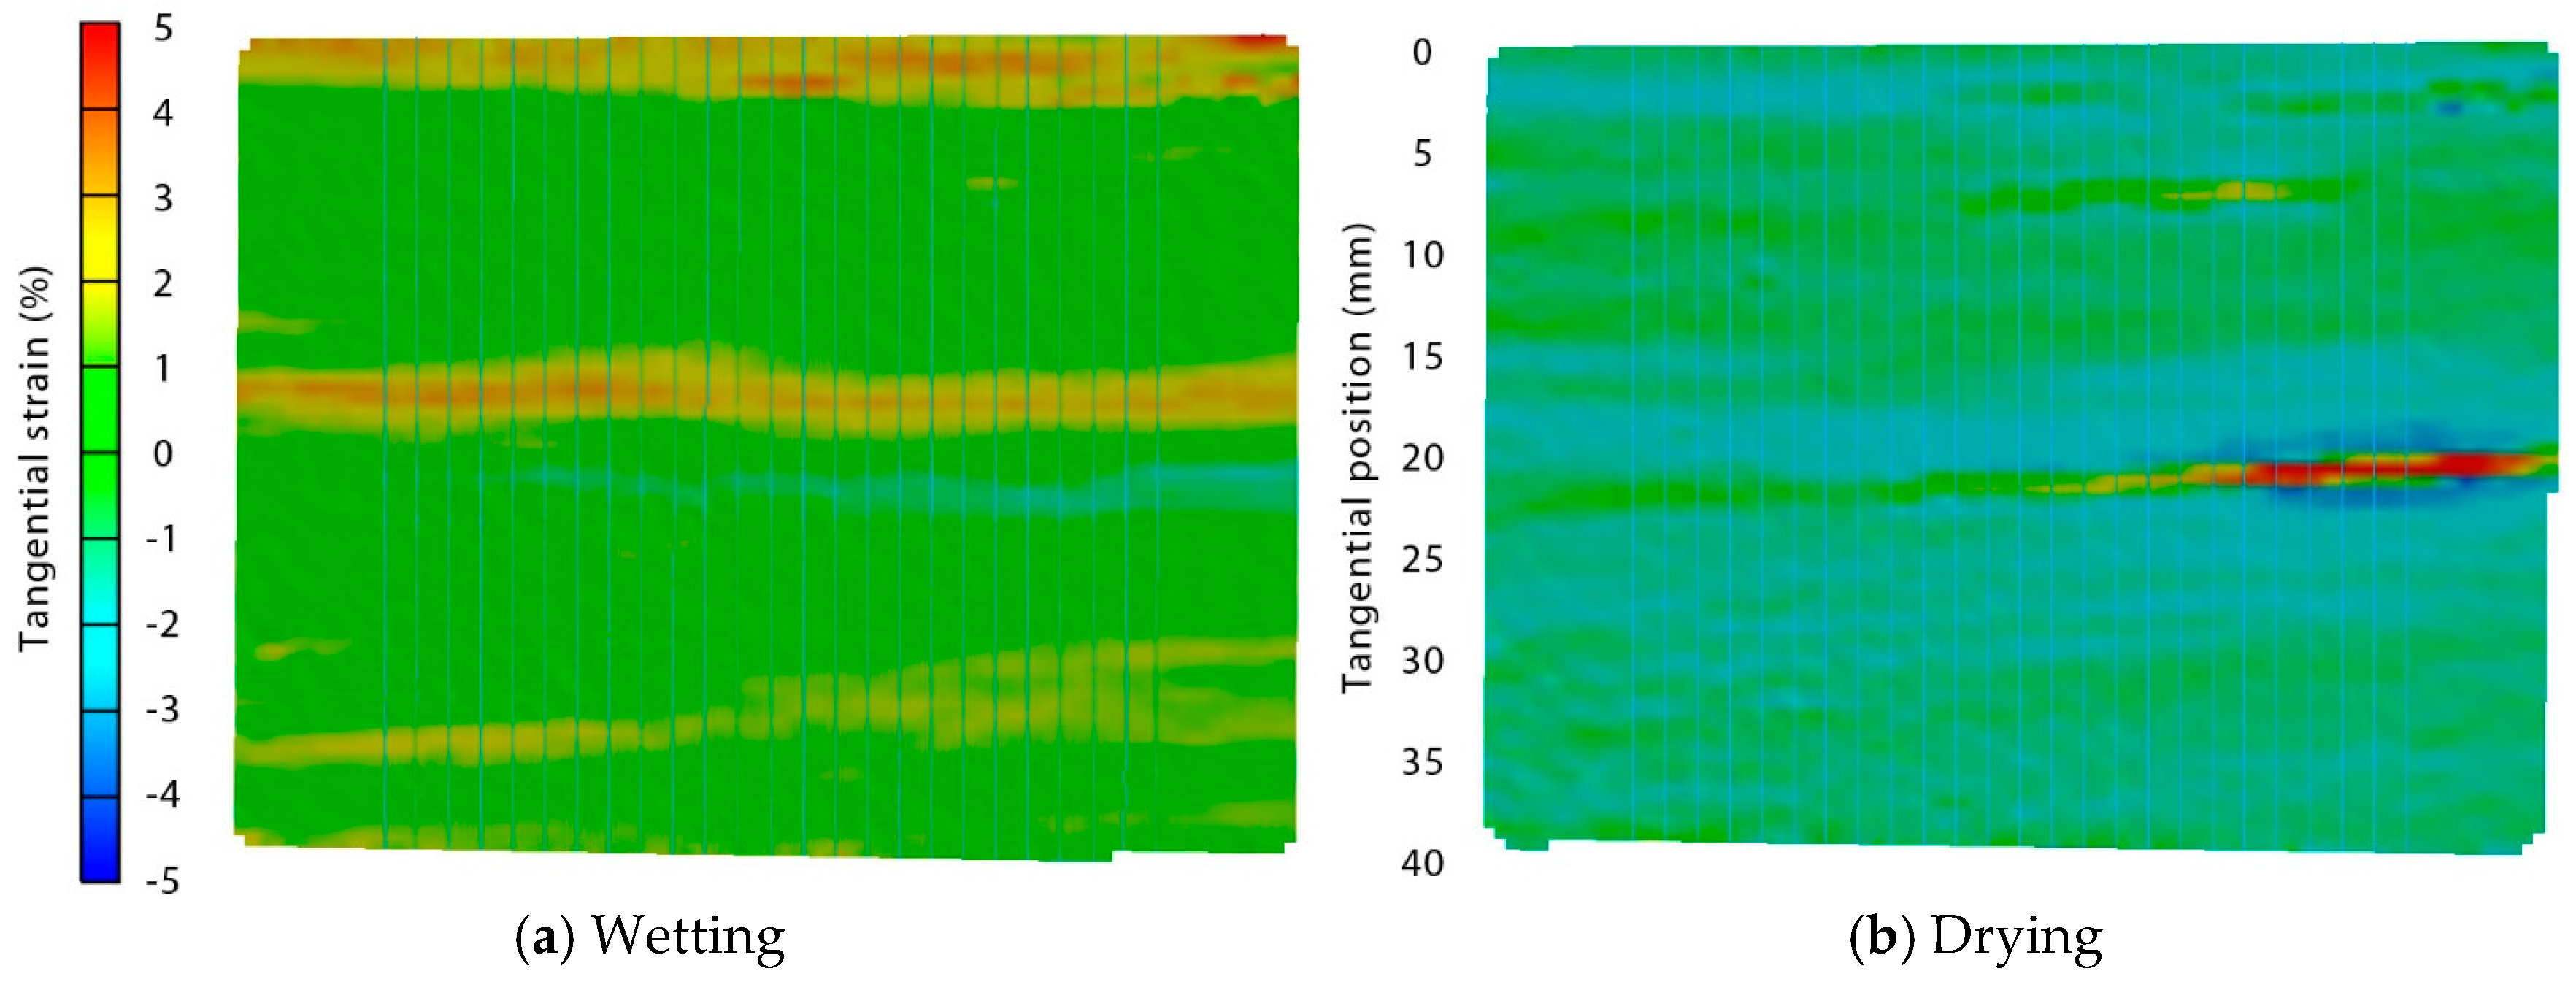
Figure 9.
Tangential strains in part of a flat (unprofiled) radiata pine board that checked during the first part of the drying phase of the test cycle. Note the high positive strain that developed during drying (t > 30 min) in an area that had negative (-) strain at the end of the wetting phase (t = 30 min), and was bordered between areas of positive strain.


Table 1.
Basic density and growth ring widths of specimens cut from parent radiata pine boards that were converted into profiled and flat deck board samples.
Table 1.
Basic density and growth ring widths of specimens cut from parent radiata pine boards that were converted into profiled and flat deck board samples.
| Sample Board Number | Basic Density (kg/m3) 1 | Growth Ring Width (mm) |
|---|---|---|
| 1 | 377 (8.80) | 6.7 |
| 2 | 428 (54.2) | 4.6 |
| 3 | 373 (11.5) | 7.5 |
| 4 | 371 (21.2) | 3.4 |
| 5 | 355 (28.0) | 8.1 |
Table 2.
Dimensions of peak radii (R1), groove radii (R2), peak heights (H) and peak widths (W) of profiled radiata pine deck board samples subjected to wetting and drying.
Table 2.
Dimensions of peak radii (R1), groove radii (R2), peak heights (H) and peak widths (W) of profiled radiata pine deck board samples subjected to wetting and drying.
| Profile Type | R1 (mm) | R2 (mm) | Height (mm) | Width (mm) |  |
| 1, Ribble | 1.3 | 0.65 | 2.0 | 5.0 | |
| 2, Ripple | 1.2 | 1.0 | 2.0 | 5.0 | |
| 3, Flat | - | - | - | - |
© 2018 by the authors. Licensee MDPI, Basel, Switzerland. This article is an open access article distributed under the terms and conditions of the Creative Commons Attribution (CC BY) license (http://creativecommons.org/licenses/by/4.0/).
Share and Cite
MDPI and ACS Style
Mallet, J.; Kalyanasundaram, S.; Evans, P.D. Digital Image Correlation of Strains at Profiled Wood Surfaces Exposed to Wetting and Drying. J. Imaging 2018, 4, 38. https://doi.org/10.3390/jimaging4020038
AMA Style
Mallet J, Kalyanasundaram S, Evans PD. Digital Image Correlation of Strains at Profiled Wood Surfaces Exposed to Wetting and Drying. Journal of Imaging. 2018; 4(2):38. https://doi.org/10.3390/jimaging4020038
Chicago/Turabian StyleMallet, Julian, Shankar Kalyanasundaram, and Philip D. Evans. 2018. "Digital Image Correlation of Strains at Profiled Wood Surfaces Exposed to Wetting and Drying" Journal of Imaging 4, no. 2: 38. https://doi.org/10.3390/jimaging4020038
Note that from the first issue of 2016, this journal uses article numbers instead of page numbers. See further details here.