A Novel Vision-Based Classification System for Explosion Phenomena


Computer Science and Engineering Department, University of Bridgeport, Bridgeport, CT 06604, USA
*
Author to whom correspondence should be addressed.
J. Imaging 2017, 3(2), 14; https://doi.org/10.3390/jimaging3020014
Submission received: 4 October 2016
/
Revised: 10 April 2017
/
Accepted: 10 April 2017
/
Published: 15 April 2017
Abstract
:The need for a proper design and implementation of adequate surveillance system for detecting and categorizing explosion phenomena is nowadays rising as a part of the development planning for risk reduction processes including mitigation and preparedness. In this context, we introduce state-of-the-art explosions classification using pattern recognition techniques. Consequently, we define seven patterns for some of explosion and non-explosion phenomena including: pyroclastic density currents, lava fountains, lava and tephra fallout, nuclear explosions, wildfires, fireworks, and sky clouds. Towards the classification goal, we collected a new dataset of 5327 2D RGB images that are used for training the classifier. Furthermore, in order to achieve high reliability in the proposed explosion classification system and to provide multiple analysis for the monitored phenomena, we propose employing multiple approaches for feature extraction on images including texture features, features in the spatial domain, and features in the transform domain. Texture features are measured on intensity levels using the Principal Component Analysis (PCA) algorithm to obtain the highest 100 eigenvectors and eigenvalues. Moreover, features in the spatial domain are calculated using amplitude features such as the color model; then, PCA is used to reduce vectors’ dimensionality to 100 features. Lastly, features in the transform domain are calculated using Radix-2 Fast Fourier Transform (Radix-2 FFT), and PCA is then employed to extract the highest 100 eigenvectors. In addition, these textures, amplitude and frequency features are combined in an input vector of length 300 which provides a valuable insight into the images under consideration. Accordingly, these features are fed into a combiner to map the input frames to the desired outputs and divide the space into regions or categories. Thus, we propose to employ one-against-one multi-class degree-3 polynomial kernel Support Vector Machine (SVM). The efficiency of the proposed research methodology was evaluated on a totality of 980 frames that were retrieved from multiple YouTube videos. These videos were taken in real outdoor environments for the seven scenarios of the respective defined classes. As a result, we obtained an accuracy of 94.08%, and the total time for categorizing one frame was approximately 0.12 s.
1. Introduction
We define the explosion as a rapid increase in volume, and a release of kinetic energy or potential energy. Kinetic energy includes radiant, electrical, or thermal energy, while potential energy includes nuclear or chemical energy. The explosion generates a blast pressure wave or shock wave, high temperature, and release of gases, in conjunction with loud and sharp sounds caused by the incidents that are associated with the occurrence of each explosion phenomena.
Explosions can be natural disasters such as volcanic eruptions. A volcano is a spectacular event in the life of the earth, and it is proof that the earth is alive, active, and ever-changing. Volcanoes can be classified according to their eruptive style into explosive and effusive eruptions. Typically, explosive eruptions produce Pyroclastic Density Currents (PDCs), which are among the most complex and hazardous volcanic phenomena, while effusive eruptions are dominated by the outpouring of lava onto the ground. Furthermore, some explosive or effusive eruptions produce both lava and tephra fallout. Tephra is a generic term for any airborne pyroclastic materials accumulation [1,2,3,4,5,6,7,8].
On the other hand, critical man-made disasters are nuclear explosions. According to the location of the point of detonation in relation to Ground zero, which is the point on the Earth’s surface closest to the detonation, nuclear explosions can be classified into the following categories: (1) deep underground; (2) shallow underwater; (3) surface; (4) atmospheric, and high altitude nuclear explosions [9,10].
Nowadays, the emphasis on the risk identification as the first and critical step of the risk management process is arising. Hence, the development of technology as well as science will lead to saving lives and properties when they are linked to reliable automatic early warning systems and effective evacuation procedures.
In a large explosive volcanic eruption at which a volcano vents pyroclastic flows and surges, and depending on the location of the volcanic eruption, its consequences can be experienced globally or by an entire hemisphere. Additionally, detecting an explosive volcanic eruption will lead to protecting citizens not only from primary effects of PDCs that are among the deadliest disasters for populations living around the volcano, but also from secondary effects of volcanic eruptions that may trigger in proper conditions lahar, tsunami, and fires. Furthermore, locating the eruption cloud downwind is a necessity as it is crucial to aviation safety [2,11].
Furthermore, unlike some natural disasters such as fires, hurricanes, tsunami, earthquakes, and tornadoes where people can rebuild and repair structure in the location of the phenomenon, lava ejected from an effusive eruption buries agricultural lands, homes, and crops in its path where people are rarely able to use land buried by lava flows and fountains [12].
2. Problem Statement
2.1. Volcanic Eruptions
A volcanic eruption is the earth’s natural mechanism of cooling off and releasing internal pressure and heat. Pressure and heat in the crust of the earth cause rocks to melt and form magma that is stored in a structure called the magma chamber, and it moves onto the earth’s surface through a vent. Therefore, as magma moves up, it loses dissolved gas and bubbles form in it. This is a driving force behind eruptions [13,14,15].
The violence of volcanic eruptions is controlled by two factors including silica content and gas content. As the silica content of magma is increased, the magma gets more viscous and it becomes stickier. Consequently, the stickier the magma is, the more viscous the magma, and the more violent the generated eruption will be, and it becomes more difficult for the gas to escape from magma that is highly viscous. The gas content of the magma is the second factor. Hence, the more gas, the more violent the eruption will be, while the less gas, the less violent the eruption will be [14].
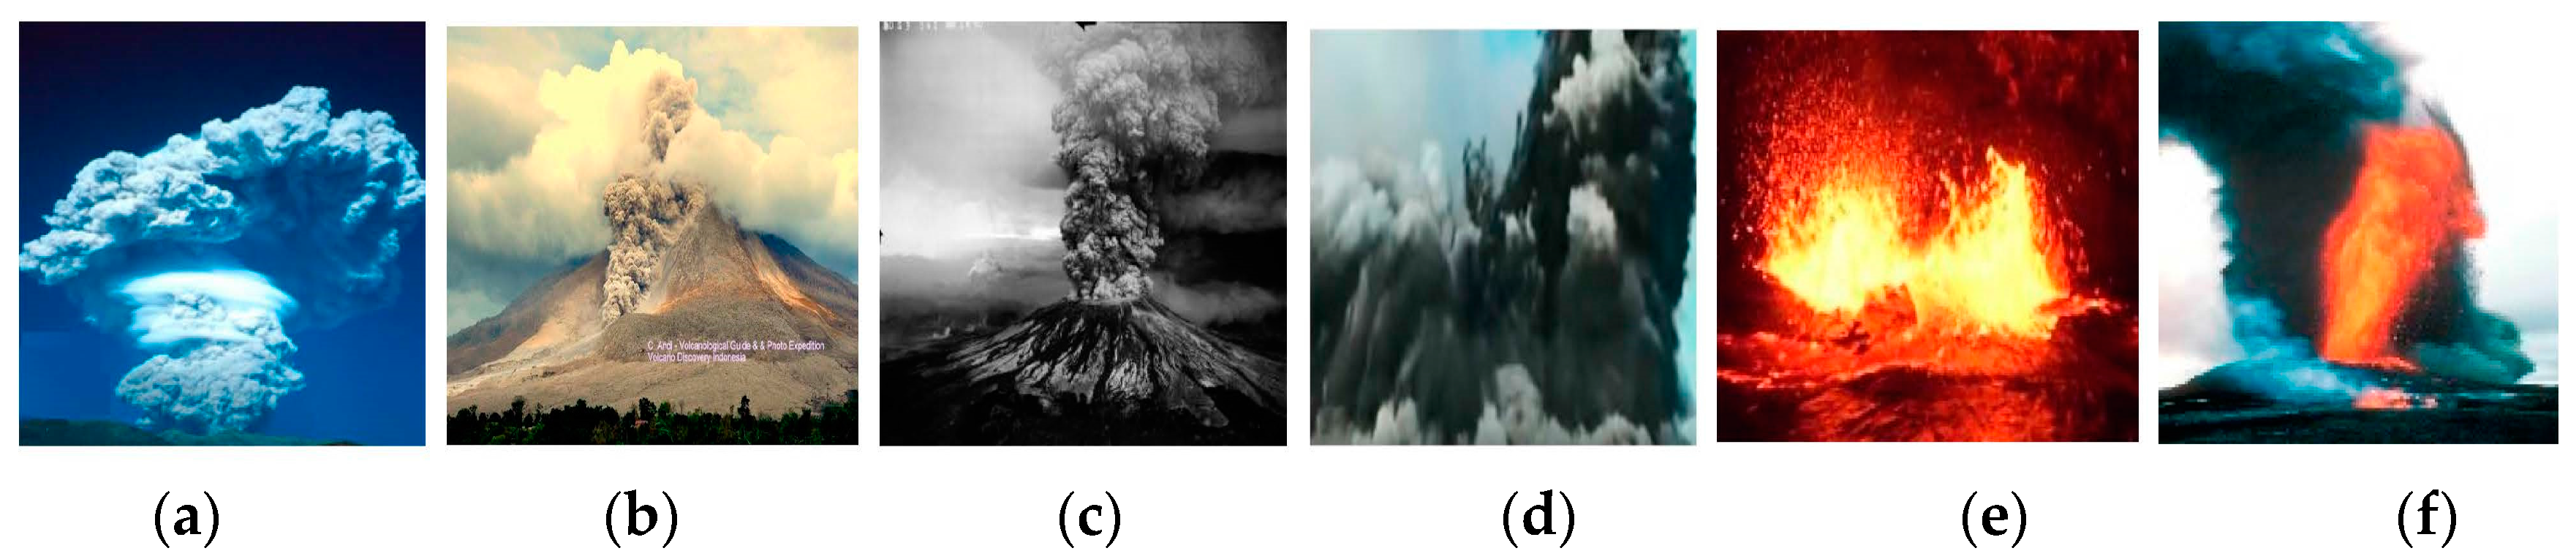
An explosive eruption may produce a Pyroclastic Density Current (PDC) phenomenon which is a moving mixture of hot gases and pyroclastic materials that flow over the ground (gravity-driven deposits that fall down the volcano slopes) [5]. The PDC phenomenon [16] may generate from the collapse of parts of an eruption column following explosive disintegration of magma and rocks in a volcanic conduit (e.g., Figure 1a [17]), or from hot avalanches derived from lava domes (e.g., Figure 1b [18]), or from laterally inclined blasts (e.g., Figure 1c [19]), or when the ejected pyroclastic mixture is unable to mix efficiently with the surrounding atmosphere and spreads laterally (termed the boiling-over regime, e.g., Figure 1d [20]).
On the other hand, effusive eruptions such as a fissure volcano typically generate lava fountains and flows. Lava color depends on its temperature, and the process of turning heat energy into light is called incandescence [21] (e.g., Figure 1e [22]).
Moreover, lava and tephra fallout products can be deposited together directly by explosive or effusive eruptions. Consequently, tephra is a generic term for any airborne pyroclastic accumulation such as: blocks, bombs, cinder/scoria/lapilli, coarse ash, and fine ash (dust), etc. (e.g., Figure 1f [23]).
2.2. Nuclear Explosions
Typically, nuclear explosions including deep underground, shallow underwater, surface, and atmospheric, form a mushroom-shaped cloud. In contrast, the high-altitude explosions form an artificial aurora display with ionized region [9,24]. In this research, our focus will be on identifying nuclear explosions which form a mushroom-shaped cloud.
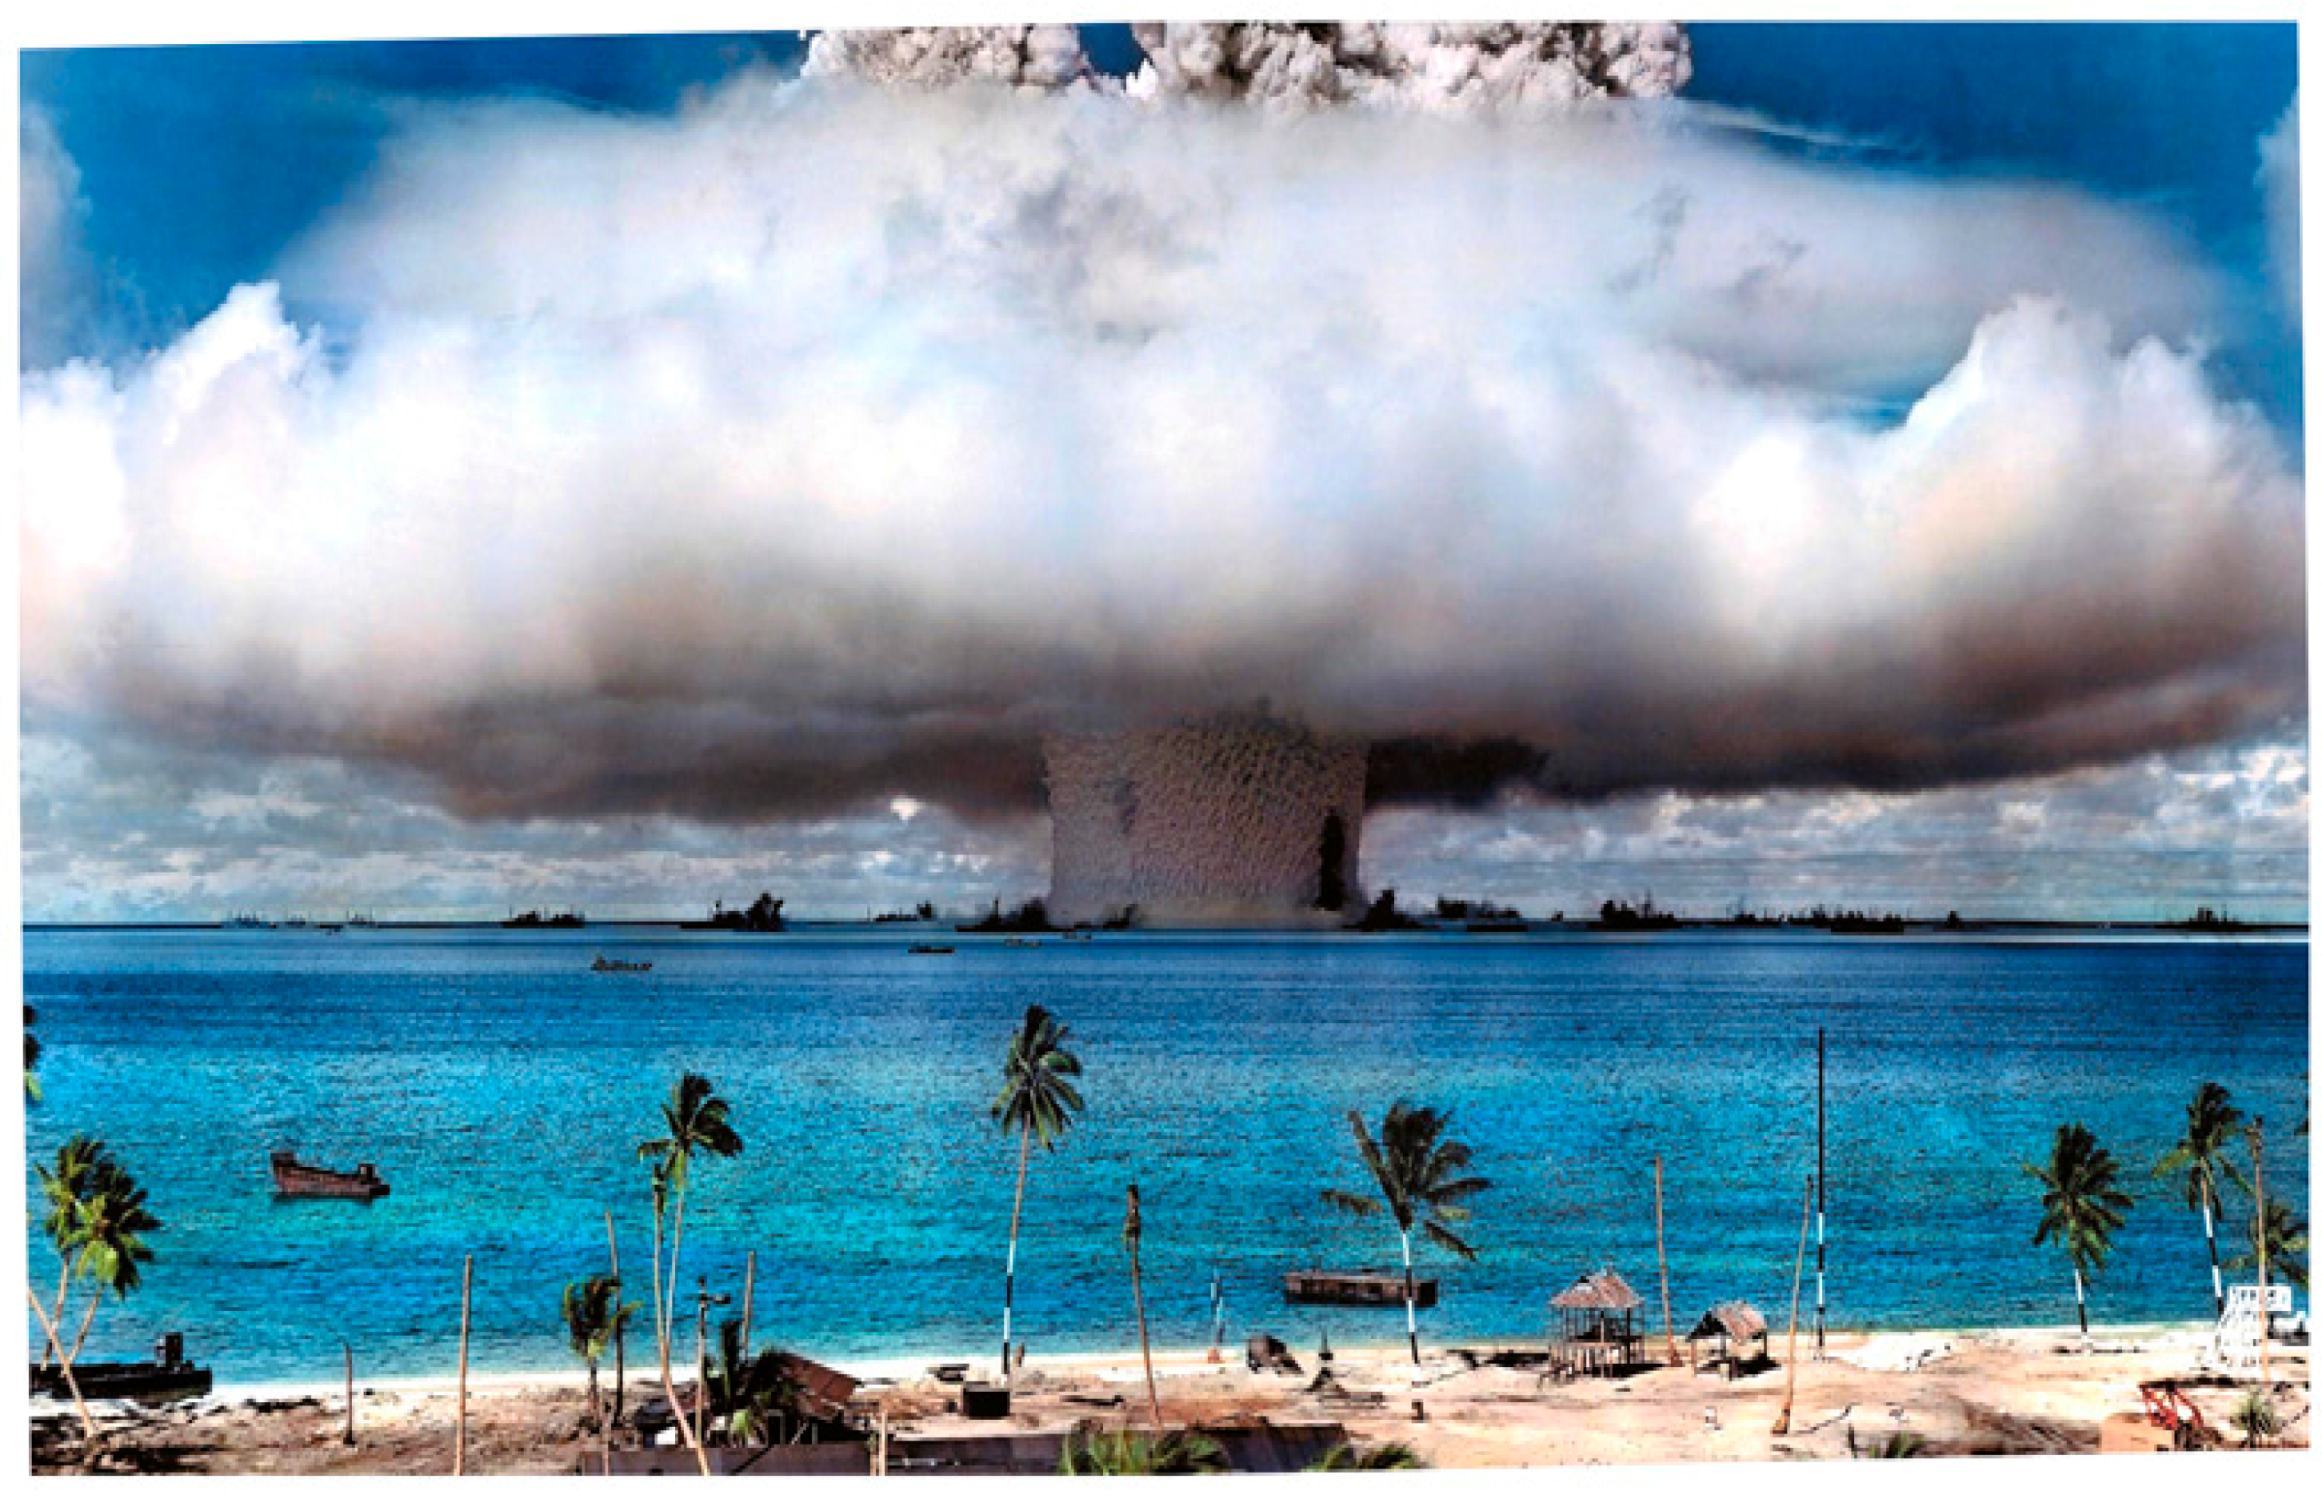
The formation of a nuclear mushroom-shaped cloud can be described through an example of a shallow underwater explosion, the Baker test, which was conducted at Bikini Lagoon in 1946. At the beginning of the explosion, the water near the explosion was illuminated by the fireball formation. However, the water waves caused distortion on the surface of the lagoon that prevented a clear view of the fireball. The hot gas bubble underwater initiates a shock wave. Intersection of the shock wave with the surface produces a slick, which is a ring of darkened water that is rapidly expanding, while the reflection of the water shock wave at the surface causes a crack. A crack is a white circular patch behind the dark region. Then, a spray dome (a column of broken water and spray) is thrown up over the point of burst. The sides of the spray dome become steeper when the water rises. The disturbance created by the underwater burst causes a series of waves to move outward from the center of the explosion across the surface of the lagoon, where the test was conducted. The water flowed into the cavity as the pressure of the bubble was released, which caused the water to be thrown up as a hollow cylinder, or chimney of spray, called the “column/plume”. The radioactive contents of the bubble were vented through the hollow column and formed a cauliflower-shaped cloud at the top in a shallow underwater explosion, which concealed part of the upper portion of the column. It contained some of the fission products, weapon residues, and a large amount of water in droplet form. Figure 2 depicts the mushroom-shaped cloud of the underwater Baker nuclear explosion [25].
2.3. Research Hypothesis
Explosions phenomena under consideration can be characterized from the point of view of image processing as follows:
- (1)
- Pyroclastic Density Currents (PDCs) patterns have color properties that can be white (e.g., Figure 1a), or brown/brownish (e.g., Figure 1b), or dark color ranging from gray to black shades (e.g., Figure 1c,d), have dense cloud shapes, and have multiple manifestation (shapes) including: vertical column, laterally spread, avalanches which are generated by lava dome and moving downslope of the volcano, and some volcanic eruptions can produce natural mushroom clouds under the force of gravity.
- (2)
- Lava fountains patterns have a luminous region of the image, and the color of the luminous region depends on the temperature of the lava during the eruption. Therefore, lava may glow golden yellow 1090 °C), orange 900 °C), bright cherry red 700 °C), dull red 600 °C), or lowest visible red 475 °C) [21].
- (3)
- Lava and tephra fallout patterns have a luminous region (lava) and non-luminous region of the image (tephra), and the color of lava is based on its temperature as explained in point 2. In addition, the color of tephra including blocks, bombs, cinder/scoria/lapilli, Pele’s tears, and Pele’s hair, coarse ash, and fine ash, etc. will be variable (light or dark colors) based on the type of pyroclastic materials that are being ejected during the eruption.
- (4)
- Nuclear explosions patterns have five properties. First, the color property where the initial color of the mushroom cloud of a nuclear expulsion is red/reddish. When the fireball cools, water condensation leads to the white color characteristic of the explosion cloud [9] and, secondly, growth of the nuclear mushroom-shaped cloud, where it keeps rising until it reaches its maximum height. Third, the shape which can be either mushroom-shaped cloud (our focus in this research), or artificial aurora display with ionized region in case of space explosions). Fourth, the luminous region of the image at which a luminous fireball can be viewed as flash or light from hundreds of miles away for about 10 s, and then it is no longer luminous. Thus, the non-luminous growing cloud appears for approximately 1–14 min, and fifth, the orientation where the mushroom-shaped cloud has a single orientation.
In this research, we contribute the design and implementation of a novel vision-based surveillance system for explosion phenomena using pattern recognition techniques including feature extraction approaches and a classification technique. Hence, supervised learning is used to map the input frames to the desired outputs and divide the space into regions or categories.
Consequently, we define seven patterns for some explosion and non-explosion phenomena including: pyroclastic density currents, lava fountains, lava and tephra fallout, nuclear explosions, wildfires, fireworks, and, sky clouds. Towards the classification goal, we collected a new dataset of 5327 2D RGB images, which are used for training the classifier. Since we do not have access to explosion zones for testing the classifier and showing that the system can be applied in reality, we evaluated the proposed research methodology on video sequences that were downloaded from the YouTube website. These videos were taken in real outdoor environments for the seven scenarios of the respective defined classes.
The objectives of employing feature extraction approaches and a classification technique in the proposed framework are twofold. First, compute features which have the most relevant information that characterize explosion phenomena from the input image data, which will result in reducing the computational cost. This factor is often considered as the challenge to perform the desired classification task of any application. Second, employ a classifier to categorize those phenomena and evaluate the performance of the developed system.
In order to achieve high reliability of the explosion detection and classification system, we propose developing a system that has the following characteristics: first, an explosion event is represented by different feature sets or classes. These discriminative features obtained using our proposed research methodology are invariant in terms of translation, illumination, rotation, and scale. Second, it is processed by multiple types of analysis such as texture analysis, spatial (spectral) analysis, and frequency analysis. Third, it provides different views or interpretations for the same scene of an explosion or non-explosion phenomena under consideration in this research, and lastly, combining texture, amplitude and frequency features provides a valuable insight into the images under consideration.
As important as it is in practice, installation of such a system for detecting and categorizing explosion phenomena at early stages would be valuable, and would play a significant role by providing rapid emergency alerts not only to notify people about threats to their safety once an unexpected explosion event occurred, but also to help community organizations and directors provide assessment for civilians and explosion victims in a minimal time.
3. Related Work
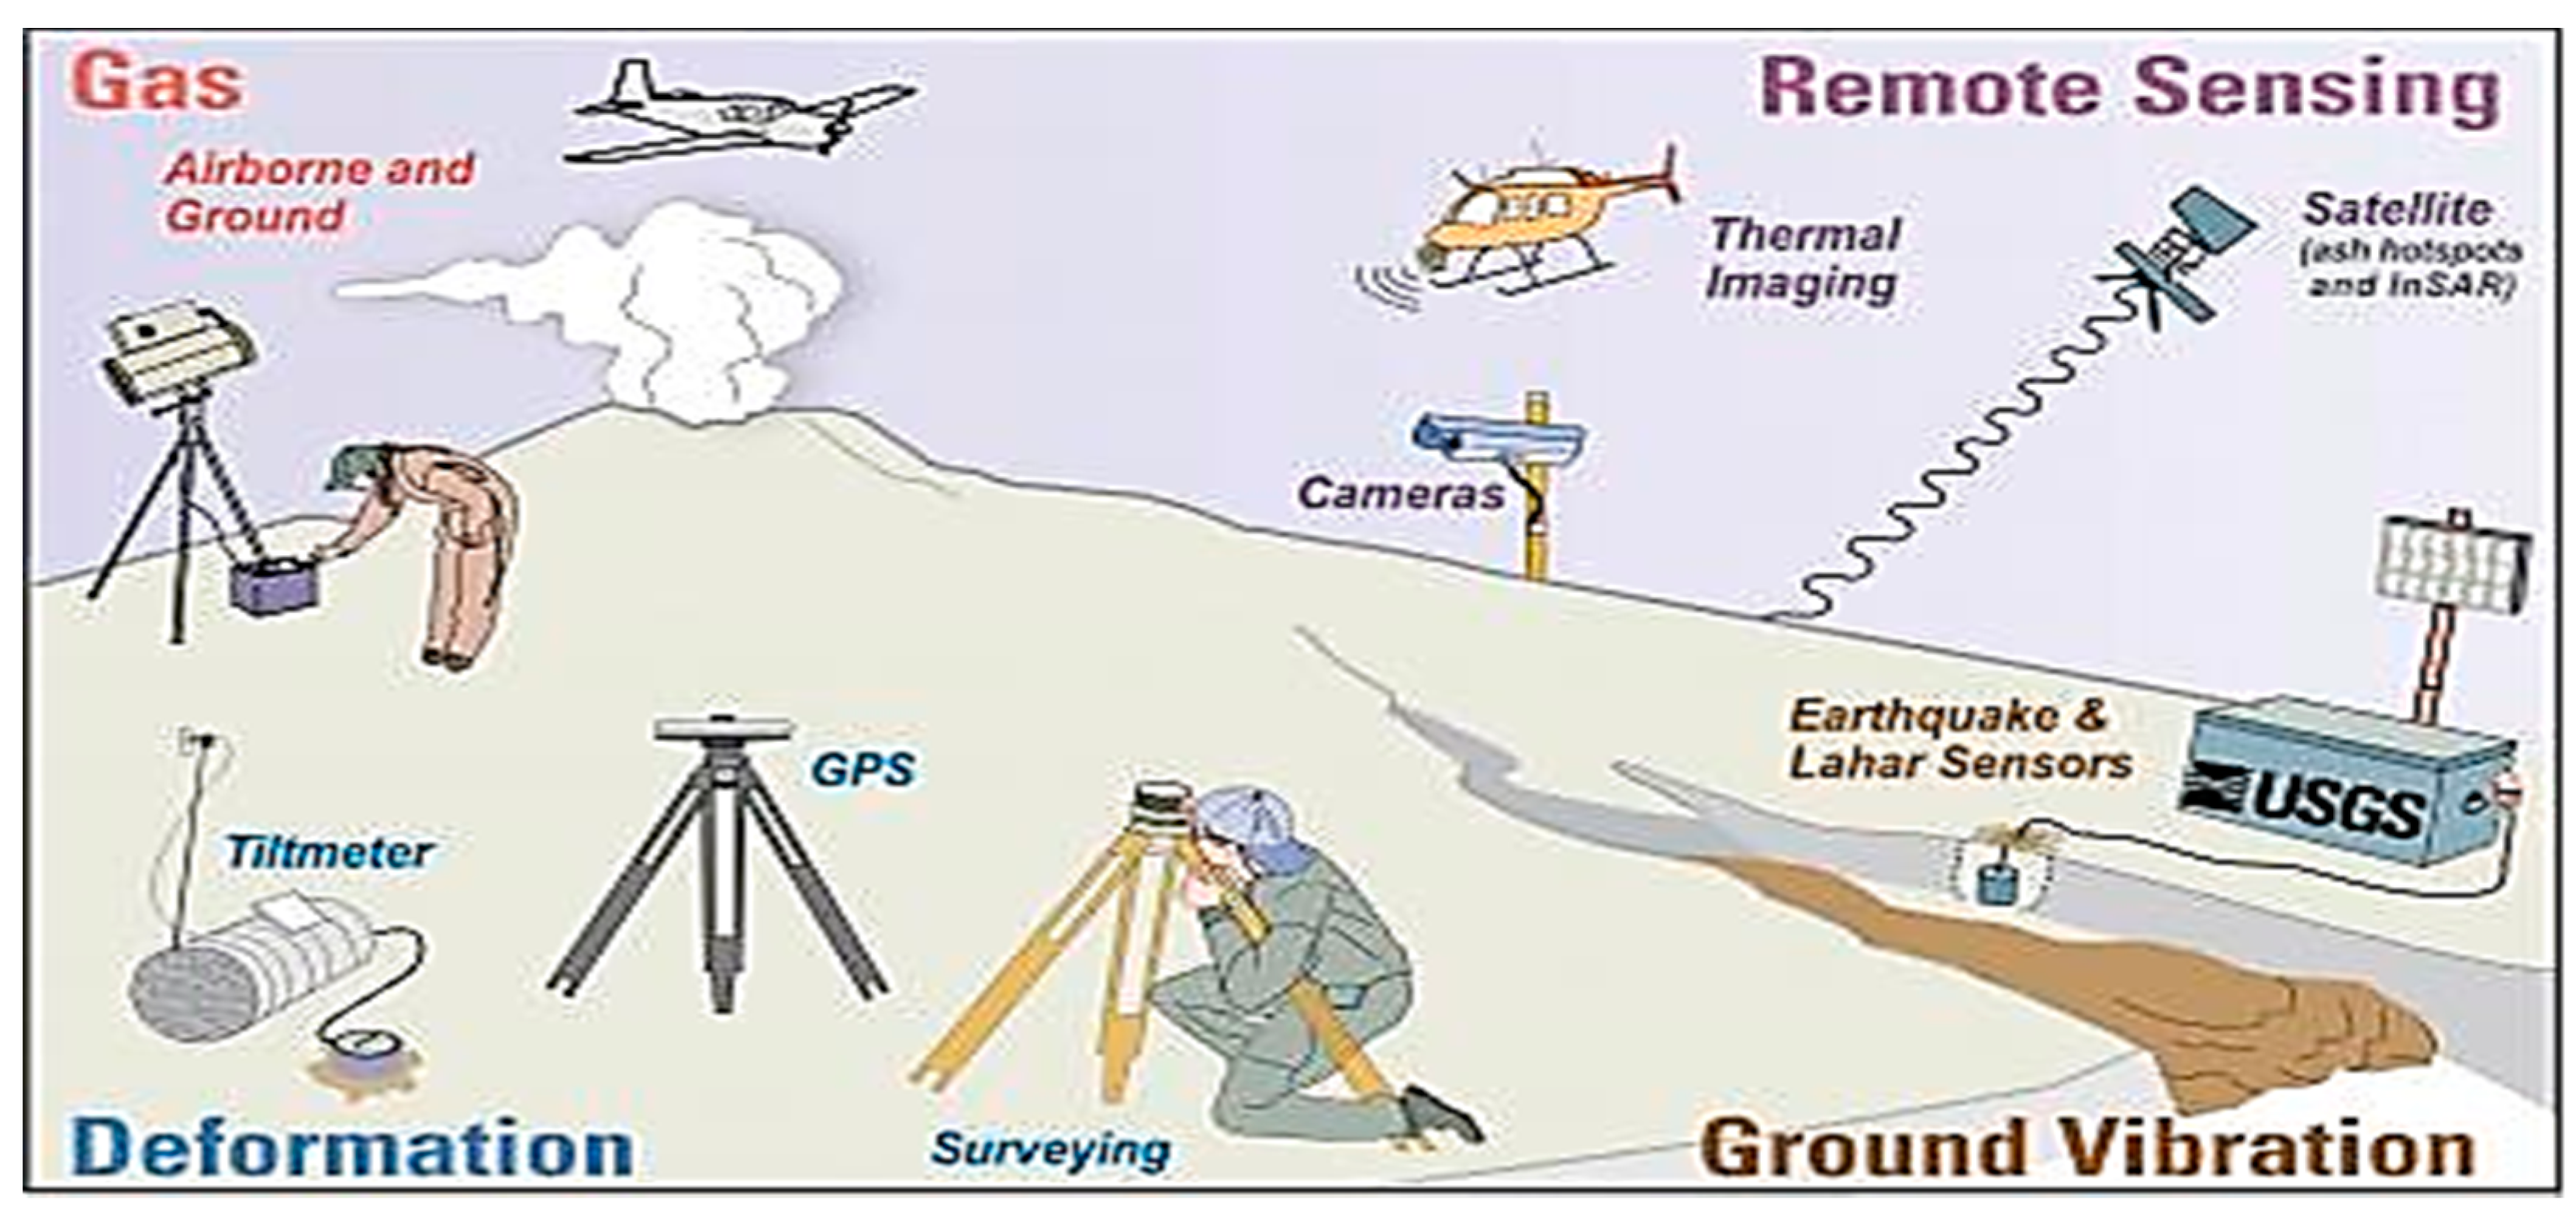
Several projects are being conducted by U.S. Geological Survey (USGS) in the United States on monitoring volcanic eruptions [27,28,29,30]. As seen in Figure 3, monitoring of volcanic eruptions is accomplished using some important techniques as follows: (1) detecting volcanic tremor (harmonic tremor); (2) hydrologic monitoring; (3) gas emission; (4) temperature measurements using thermocouples, Thermal Infrared Radiation (TIR) video cameras, and infrared satellite sensors); (5) satellite remote sensing such as Moderate Resolution Imaging Spectroradiometer (MODIS); and, lastly, (6) monitoring volcano ground deformation by using: Electronic Distance Meter (EDM), Tiltmeter, Global Positioning System (GPS), and Interferometric Synthetic Aperture Radar (InSAR) images.
In addition, Langer et al. applied SVM and neural network to classify volcanic tremor (seismic waves) patterns [31]. Furthermore, Iyer et al. proposed a classification system based on extracting unique cepstral features from a volcano’s infrasonic signature, and feeding these features to the Radial Basis Function Neural Network [32]. Moreover, Picchiani et al. used a single layer neural network to classify ash clouds of MODIS images in the Thermal InfraRed (TIR) spectral [33]. Furthermore, Tan et al. proposed a Bayesian detection algorithm and a near-optimal sensor selection algorithm to detect earthquake events and timing using wireless sensor networks [34].
On the other hand, Dickinson and Tamarkin stated that there are various existing detection techniques for nuclear explosions conducting in the air (atmospheric) and in the space (high altitude) including: (1) acoustic; (2) debris sampling; (3) radio flash or electromagnetic pulse (EMP); (4) satellites which use instruments to measure radiation from a nuclear detonation, such as X-rays, gamma-rays, neutrons); (5) atmospheric fluorescence; (6) radio techniques which include very low frequency (VLF), low frequency (LF), high frequency (HF), radio sounders, cosmic noise (Riometer); (7) magnetic telluric; and (8) sunlight resonance scatter from debris [35]. In addition, USArray, a component of EarthScope, is a program to deploy a dense network of seismographic stations across United States. USArray consists of 400 broadband stations in a Transportable Array (TA) in a grid of locations with roughly 70 spacing. Installation of TA is useful as it will lead to acquiring and analyzing data about abnormal seismic events, which may be produced by underground nuclear explosion on nearby areas [36].
In this paper, we are the first to address a multi-class classification for explosion phenomena as it is still an unsolved problem in the field of pattern recognition on 2D RGB images. We propose a novel framework design for categorizing explosion phenomena. The novelty of this framework depends on the following factors: defining seven patterns, representing explosions phenomena using multiple discriminative descriptors including texture features, amplitude features using color model, and frequency features using Radix-2 FFT, calculating the most significant 100 eigenvectors and eigenvalues for each feature class, combining these features in an input vector, and, lastly, employing a multi-class polynomial kernel SVM of degree 3 to maximize the margin between the data points and the decision boundary for a proper classification.
4. Dataset
We define seven pattern classes for which each class has patterns that share common properties. Explosion phenomena include the following classes (pyroclastic density currents (PDC), lava fountains (LF), lava and tephra fallout (LT), nuclear mushroom clouds (NC), while non-explosion phenomena include (wildfires (WF), fireworks (F), and, sky clouds (SC)). The classification criteria for volcanic eruptions is the eruptive style that involves material ejected during the eruption. In contrast, we identify the nuclear explosions according to the typical mushroom cloud. Thus, we are not classifying space explosions. Table 1 illustrates the number of images in each category of explosion and non-explosion phenomena that are used to design the classifier in the learning phase. The totality of images in our training dataset is 5327.
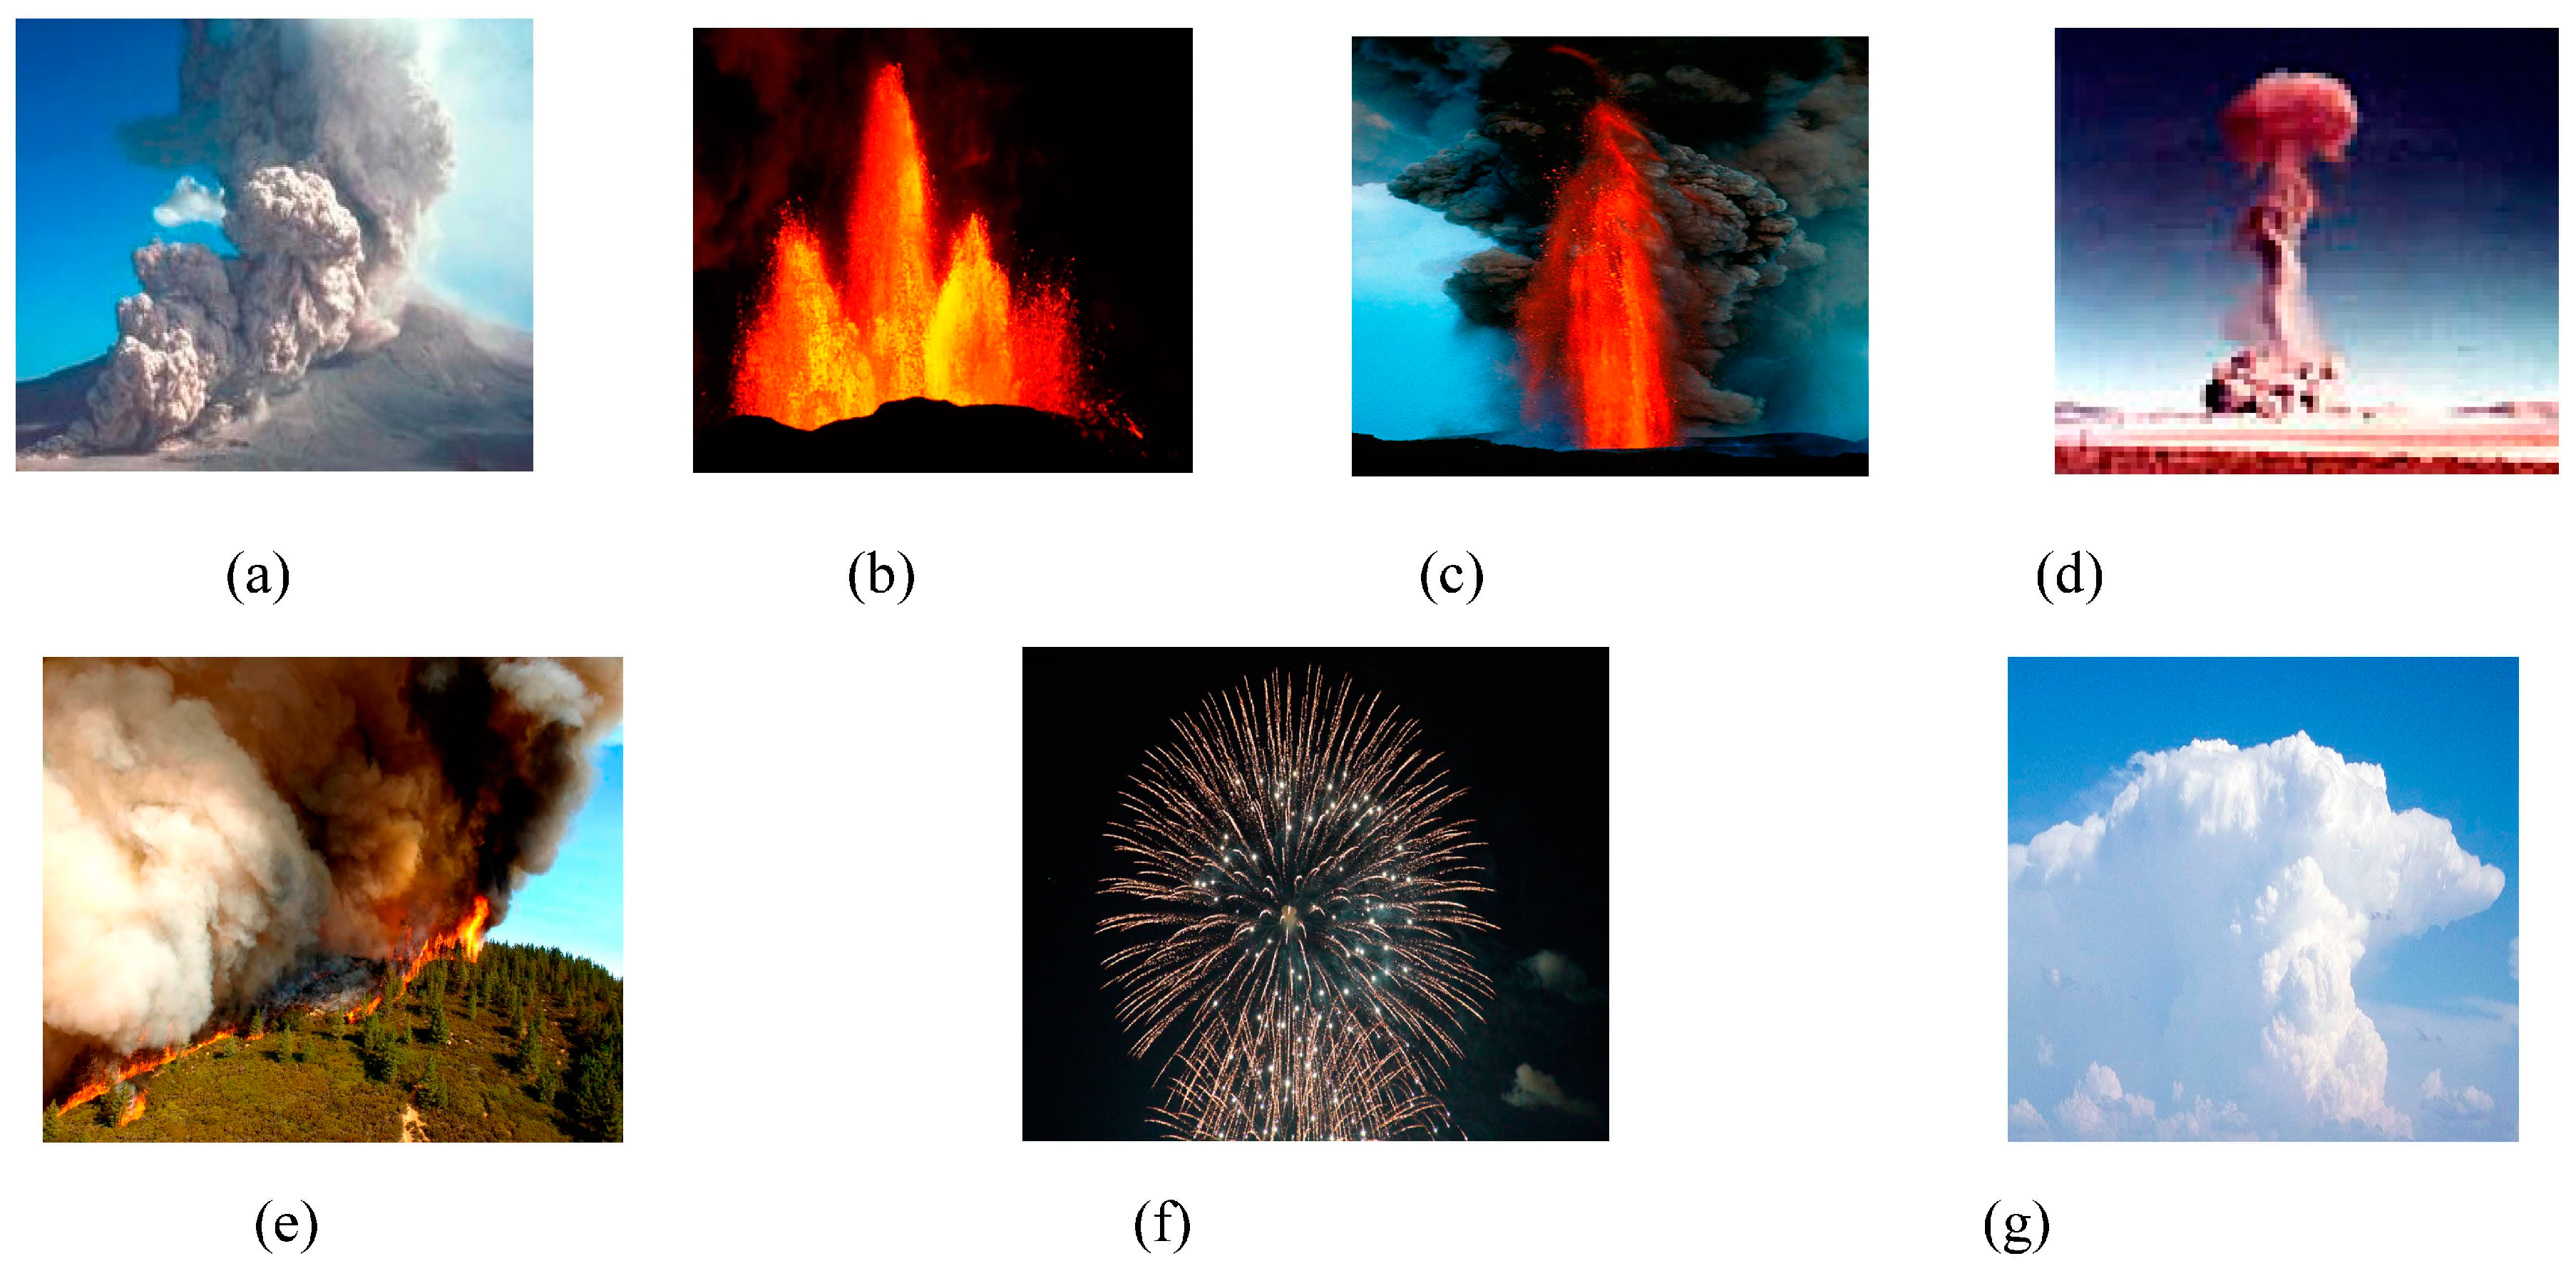
Towards the classification goal, there was a need for a large dataset. However, there is a lack of public databases on explosion phenomena under consideration in this study. Therefore, we had to collect our own dataset. Furthermore, explosion or non-explosion areas in each image were cropped manually, and stored using JPEG file format. Figure 4 depicts samples of our datasets. Consequently, images of the dataset that were used to train the classifier were downloaded from different resources during 2014–2016. Some of these resources are as follows: USGS website [37], National Oceanic and Atmospheric Administration (NOAA/NGDC) website [38], blogs [39], Volcano Adventures website [40], Exploratorium [41], Trinity Atomic website [24], and Wikimedia Commons [42]. On the other hand, multiple videos were downloaded from the YouTube website for testing phase [43,44,45,46,47]. The number of retrieved frames of video sequences for each category was 140 frames. Hence, the totality of our testing set is 980 samples.
5. Proposed Research Methodology
The proposed detection and classification system operates in four steps: gathering observations, preprocessing, training (learning), and testing (classification). The following factors were taken into consideration when the system was designed and implemented: (1) selection of the transducer; (2) definition of pattern classes; (3) pattern representation; (4) feature extraction methodologies; (5) classifier design and learning; and (6) selection of training and test samples.
5.1. Design of the Proposed Framework
5.1.1. Preprocessing
During the preprocessing step, 2D RGB images are resized to pixels. Moreover, in order to calculate PCA feature class and Radix-2 FFT feature, each image is converted to a gray scale vector of 8-bit intensity values.
5.1.2. Feature Extraction
A. Principal Component Analysis
The Principal Component Analysis (PCA) algorithm is a mathematical approach that projects the high-dimensional data onto a low-dimensional space. The reason for reducing the dimensions is that we can focus on those dimensions where there is a high difference between images in our dataset (i.e., high variance). Hence, in order to represent each sample using the most significant 100 basis vectors, the PCA algorithm is employed, and its steps during training (learning) are as follows [52]:
- (1)
- Obtain images for training phases where and represent each image as a vector .
- (2)
- Find the average vector.
- (3)
- Find the mean adjusted vector for every image vector , by subtracting the average vector from each sample, and then assemble all data samples in a mean adjusted matrix.
- (4)
- Compute the covariance matrix C.
- (5)
- Calculate the eigenvectors and eigenvalues ) of the computed covariance matrix C. After computing the eigenvalues, we will sort the eigenvalues ) by magnitude, and we will only keep the highest 100 eigenvalues and discard the rest.
- (6)
- Compute the basis vectors. Thus, from the previous step, we have 100 eigenvectors . These vectors will be assembled into an eigenvector matrix (EV). Then, we will multiply EV by the mean adjusted matrix computed in step 3 to form the basis vectors.
- (7)
- Describe each sample using a linear combination of basis vectors.
Basis vectors have a magnitude of 1, and they are mutually orthogonal, meaning that the inner product of any two vectors will produce zero. This also can be described as there is angle between any two vectors in the eigenspace. These 100 features are invariant in terms of translation, illumination, and scale.
During the testing phase, each test image is resized to pixels and then converted to a vector of size pixels. After that, the average image from the training process is subtracted from each test sample, resulting in the mean adjusted image. Consequently, the mean adjusted image of each sample gets projected on the eigenspace of 100 significant eigenvectors. Figure 5 summarizes steps of the PCA algorithm during training (learning).
B. Features in the spatial domain: amplitude features
Color is one of the physical properties of explosion and non-explosion phenomena, as it depends on the temperature and the composition of each phenomenon of the proposed application.
Amplitude (spectral) features in the proposed framework are extracted by linear transformation of bitmap pixel component intensities to color space [53]. represents color as luminance component , and chrominance components which is blue minus luma (B − Y), and which is red minus luma (R − Y).
The choice of the appropriate color model depends on the target application and the effectiveness of the color transformation algorithm. Calculating of an image is more efficient than because the human eye is more sensitive to change in brightness than change in color. color space can be described as an illumination dependent color model. To overcome this disadvantage of , is used [54].
We implemented the following formula that describes the conversion of color space into color space according to ITU-R BT.601 [53]:
where 8-bit representation of each component of is specified by the recommendation 601, and , , and . has an excursion of and an offset of , placing black at code 16 and white at code 235, while have excursions of and offset of .
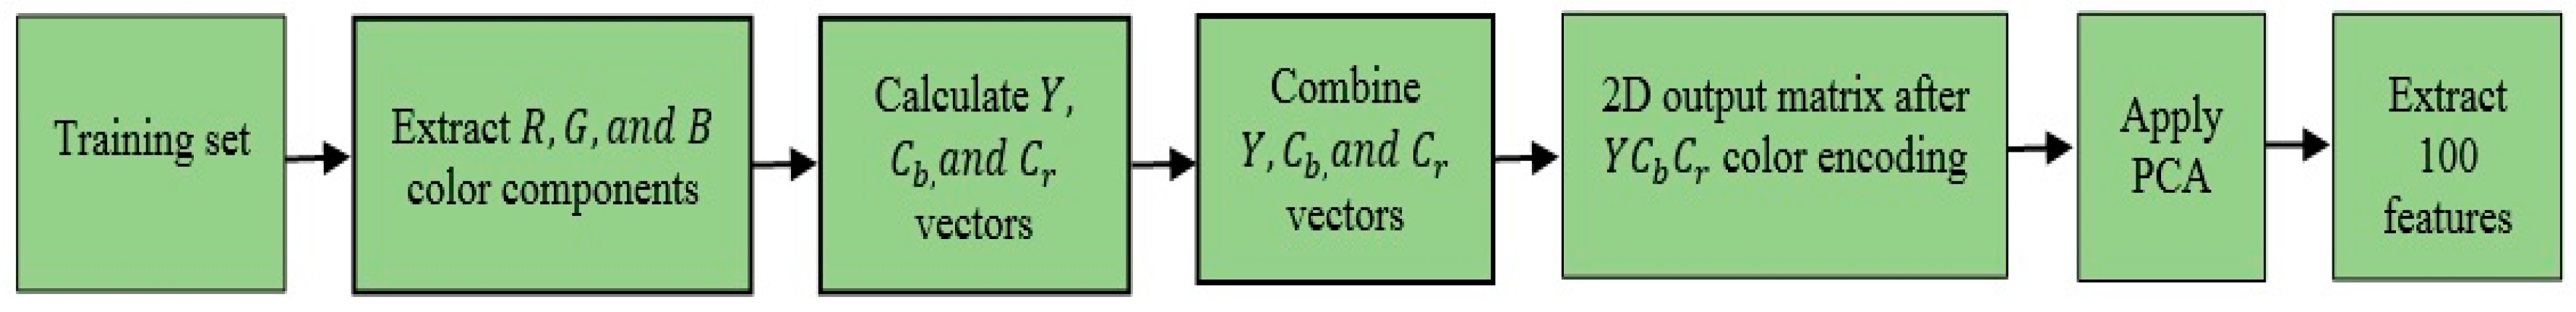
After we represent samples of the training set using the color model, the dimension of the 2D training matrix will be . Then, we apply PCA to extract the 100 most significant eigenvectors and eigenvalues. The 2D components matrix for the training phase is of dimensions , whereas the components matrix for testing 140 samples is of dimensions As seen in Figure 6, the block diagram shows the proposed algorithm in the time domain.
C. Features in the transform domain
In the proposed framework, features in the transform domain are calculated using the Radix-2 FFT algorithm. Radix-2 is a mathematical mechanism used to convert a spatial-domain image representation into a frequency-domain representation. It decomposes the image into a weighted sum of complex exponential functions called spectral components. The weighted terms at each frequency are the complex amplitude and phase. The discrete definition of Radix-2 FFT is given as follows [55]:
- (1)
- Perform a time-domain decomposition using a bit-reversal sorting algorithm to transform the input spatial image into a bit-reverse order array, and there are stages needed for this decomposition.
- (2)
- A two-dimensional FFT can be executed as two one-dimensional FFT in sequence where 1D FFT is performed across all rows, replacing each row with its transform. Then, 1D FFT is performed across all columns, replacing each column with its transform.
- (3)
- Combine the N frequency spectra in the correct reverse order at which the decomposition in the time domain was achieved. This step involves calculation of the core computational module of base-2-domain FFT algorithm, which is called a butterfly operation.
After converting samples of the training set from the spatial domain into the frequency domain, the dimension of the 2D training matrix will be . Then, we apply the PCA algorithm to extract the 100 most significant eigenvectors and eigenvalues, hence removing the noise. The components matrix for the training phase is of dimensions , and the dimensions of the components matrix for testing 140 samples is . Figure 7 depicts a block diagram for extracting the 100 highest eigenvectors after employing the Radix-2 FFT algorithm.
Advantages of using Radix-2 FFT are as follows:
- (1)
- Spectral analysis of the image using Radix-2 FFT reveals a significant amount of information about the geometric structure of 2D spatial images due to the use of orthogonal basis functions. Consequently, representing an image in the transform domain has a larger range than in the spatial domain.
- (2)
- An image can contain high-frequency components if its gray levels (intensity values) are changing rapidly, or low-frequency components if its gray levels are changing slowly over the image space. For detecting such a change, Radix-2 FFT can be efficiently applied.
5.1.3. One-against-One Multi-Class Support Vector Classification
Support Vector Machine (SVM) is a supervised classification technique, and it is basically a binary classification method. It maximizes the margin between the data points and the decision boundary. The functions that are used to project the data from the input space to the feature space are called kernels. Accordingly, after employing different SVM kernels, we find that polynomial kernel of degree 3 is the appropriate kernel for classifying multiple phenomena in our target application. Degree-3 polynomial kernel SVM is defined as follows:
where = 3 are kernel parameters [58].
Even though the figure above describes a binary SVM classifier, multiple machines can be constructed to deal with a multi-class case [59]. Consequently, one common strategy for SVM that can handle a multi-class categorization for the proposed application is the one-against-one technique, which constructs a machine for each pair of classes during the training process, resulting in machines, where classes, and machines. In addition, the kernel is polynomial of degree 3, the number of training samples is 5327, and the length of the input vector is as same as the number of extracted features (300 features), such that values of input vectors are normalized between [–1,1].
Training SVM requires the solution of a very large quadratic programming (QP) optimization problem. The QP problem is solved by using the Sequential Minimal Optimization (SMO) learning algorithm [60].
For the testing phase, the number of testing samples in each experiment is 140, and the length of the input vector is 300. The classification of test samples is done according to the maximum voting, at which each SVM votes for one class. Consequently, a sample is classified as it belongs to class whose decision function produces the largest value. The formula is given as follows:
6. Experimental Results and Discussion
The classification system was implemented using C# language under the Microsoft Net framework 4.6 (Microsoft Corporation, New York, NY, USA). It was also operating on a workstation with an Intel(R) Core(TM) i7 CPU at 3.20 GHz, RAM (20.0 GB), and 64-bit OS (Dell Inc., Round Rock, TX, USA).
The classification system operates in two phases: training and testing. As seen in Table 1, the dataset of 5327 samples was used for training the multi-class degree-3 polynomial kernel SVM classifier. For testing phase of the classification system, we extracted seven videos from multiple videos, which are available on YouTube, as stated in Section 4. The extracted videos were saved using MPEG file format, and their resolution was 720 × 480 pixels at 29 frames per second (fps). These videos were converted to frames and saved using JPEG file format. Since the length of the extracted videos is varied, the max number of test samples for each category was determined based on the length of the shortest video among them for consistency. Accordingly, the first 140 frames of each video were used for testing the proposed classification methodology. Theses frames were resized to 64 × 64 pixels. Figure 8 displays some of the retrieved video sequences for the seven categories under consideration.
During the testing phase of the classification system, each frame was defined by 100 features after extracting texture features using the PCA algorithm, 100 features after applying + PCA, and, lastly, 100 features after applying Radix-2 FFT + PCA. Furthermore, these 300 features were combined into one input vector, and then passed to a degree-3 polynomial kernel SVM classifier and assigned to a specific category. Accuracy of the classification system was computed using the following formula:
where and are the number of true positive, true negative, false positive, and false negative cases, respectively. Table 2 illustrates details of videos of the seven classes under consideration as well as a comparison between patterns of the proposed classification system in terms of accuracy (classification rate).
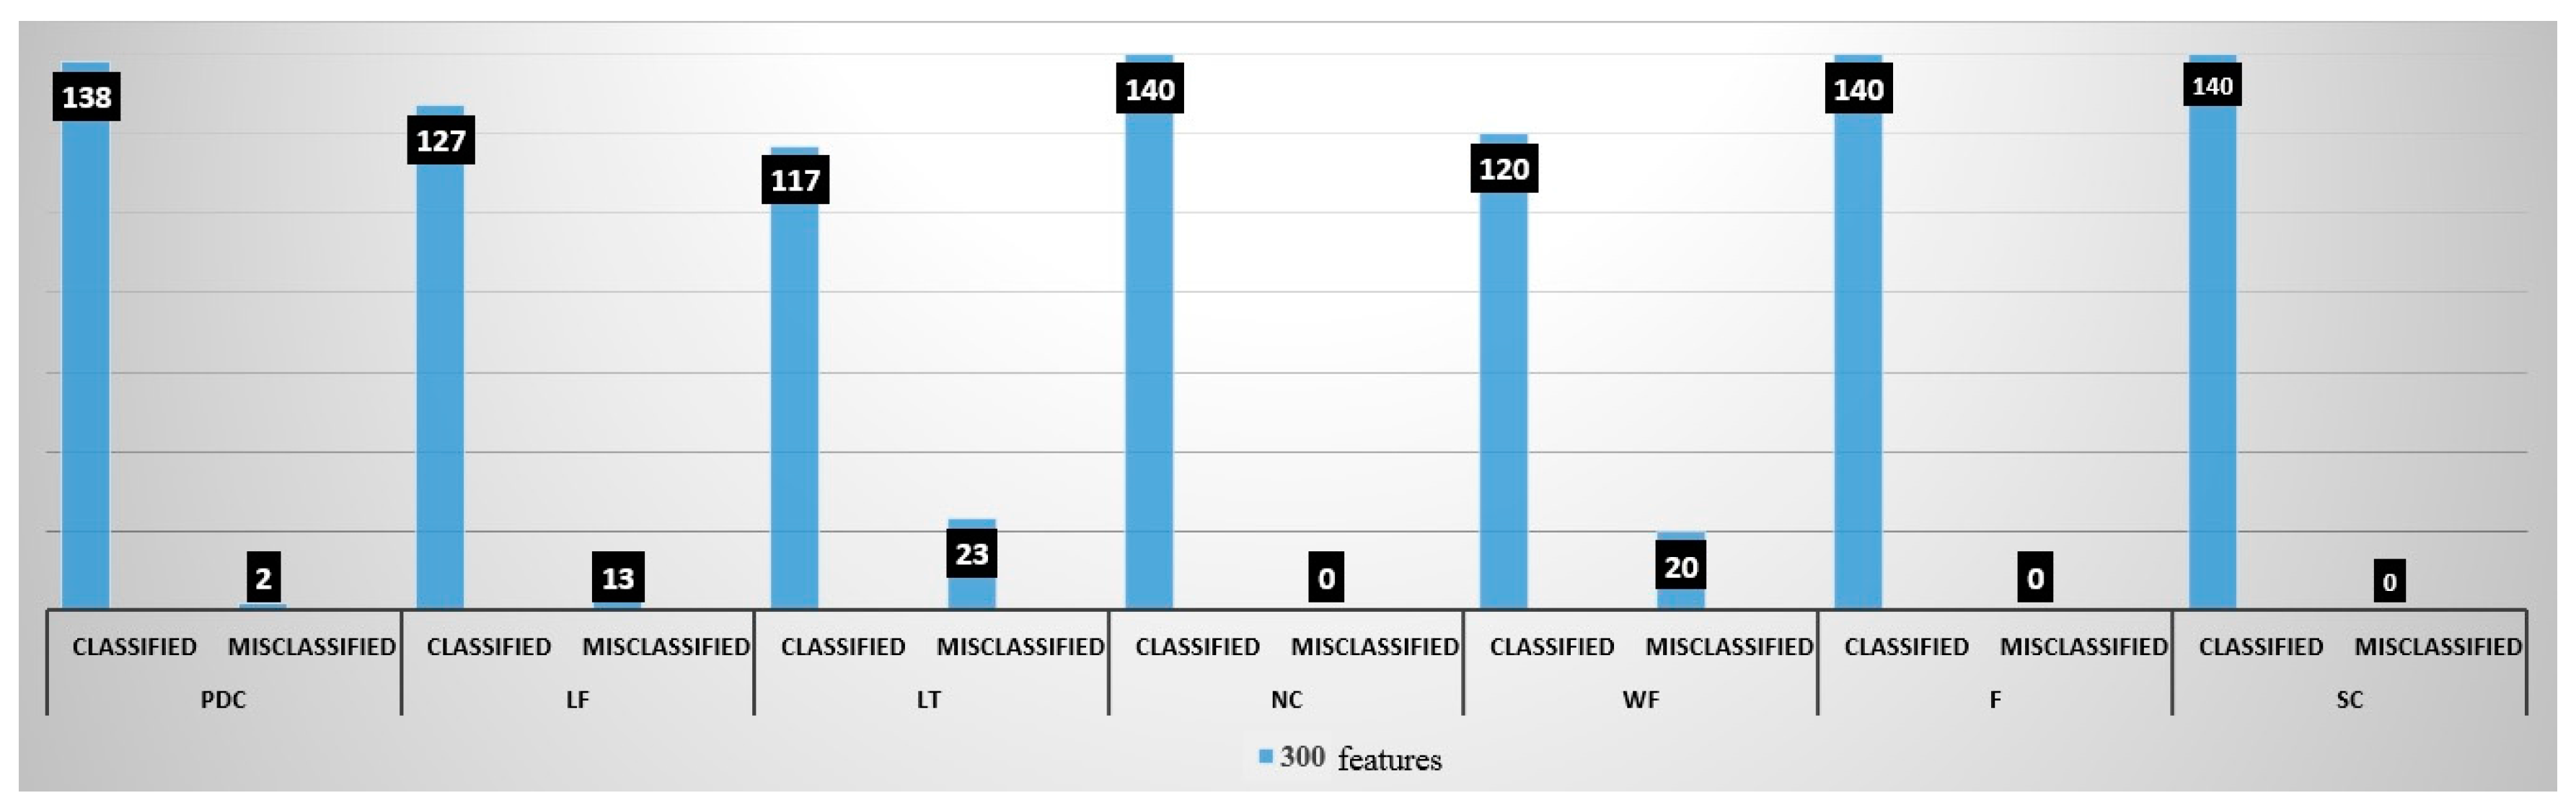
The proposed explosion categorization system achieved 94.08% accuracy, where NC, F, and SC samples were classified correctly with 100% accuracy, followed by PDC, LF, WF, and LT, which achieved 98.57%, 90.71%, 85.71%, and 83.57%, respectively. Hence, results indicate that the design of the proposed system is effective. However, LT and WF phenomena are complex.
Figure 9 depicts a chart of classified versus misclassified input test sets of 140 samples for each category of the proposed application. Out of 140 frames of each testing set, 2, 13, 23, and 20, were misclassified for PDC, LF, LT, and WF, respectively. In contrast, all frames of NC, F, and SC testing sets were classified correctly.
Table 3 demonstrates the confusion matrix for multi-class degree-3 polynomial kernel SVM classifier where testing samples of 140 for each category are represented by 300 features.
Nevertheless, data of images are complex. In this view, the LT category is a combination of lava and tephra fallout products, which deposited together directly by an effusive eruption in this example. The display of some LT scenes results in misclassified samples among PDC and LF. Likewise, due to the luminous region (lava) which is similar to the flame, and non-luminous region of the image (tephra) which is similar to the dark smoke, some LT scenes were misclassified as WF.
Moreover, WF is also a complex category; the video we played displays a wildfire that occurred during the day and another during the night. Wildfire produce flames (luminous region) during the flaming stage of the combustion process, and smoke (flameless region) during smoldering combustion (non-flaming stage of fire). Flames of wildfires typically glow red then orange and then transmitting to yellow. Then, hot flaming combustion transfers more fuel (wood) into carbon compounds that formed into tiny elements. These particles absorb light, which makes them appear as gray to black smoke. On the other hand, smoldering combustion typically reflects light, producing a white color appearance from the smoke. Thus, wildfire may generate white smoke. As a result, some of the WF samples were classified as if they belong to PDC, LF, and F.
In addition, a few PDC samples were misclassified as LT because of the non-luminosity property they both share. Furthermore, some lava samples were classified as if they belong to the fireworks class due to its luminosity property that both categories share. In particular, the video displays a lava fountain that was venting during the night. Luminosity of lava is related to its color (physical property), which indicates the composition and temperature. On the other hand, light from the fireworks is due to the chemical reactions of metal salts. In a consequence, once fireworks are ignited by lighter or a match, the energy absorbed by an atom of a metal salt reorganizes its electrons from their lowest-energy state, which is called the ground state, up to a higher-energy state that is called an excited state. The excess energy of the excited state is released as a light that has a specific color to be displayed as ignitable shapes.
One reason for the success of a multi-class degree-3 polynomial kernel SVM classifier as a kernel-based method is that the kernel function takes relationships that are implicit in the data and makes them explicit. Hence, the result being that the categorization of patterns takes place more easily [61].
In addition, we analyze the time needed to classify one frame during the testing phase. Thus, we divide the total time frame into three stages as follows: (1) the time consumed for extracting 300 features of one frame; (2) the time utilized to pass one frame to the SVM classifier; and (3) the classification time that was required to assign the frame into a specific category. Table 4 illustrates corresponding details regarding testing time. As a result, the total execution time for testing one frame is approximately 0.12 s.
7. Conclusions
In this research, we addressed a new problem in the pattern recognition field, a vision-based classification system for explosion phenomena associated with a new training dataset of 5327 images for some of explosions and non-explosions phenomena including: pyroclastic density currents, lava fountains, lava and tephra fallout, nuclear explosions, wildfires, fireworks, and, sky clouds.
Furthermore, we proposed employing the following approaches for feature extraction: texture, amplitude and frequency features. Then, a PCA algorithm was employed to extract the 100 most significant eigenvectors and eigenvalues for each feature class. Moreover, combining the measured features in an input vector is essential because it provides multiple analysis, views, and interpretations for explosion classification images. Hence, a valuable insight of explosion scenes is accomplished. Consequently, an input vector of 300 features is fed to a multi-class polynomial kernel SVM of degree 3. This proposed research methodology was evaluated on 980 frames of video sequences for seven scenarios of explosions and non-explosions phenomena, at which each category includes 140 frames for testing. Results show that a high classification rate of 94.08% was achieved to classify 980 frames. In addition, a reasonable execution time of 0.12 s was accomplished to categorize one frame during the testing phase.
We conclude that installation of such a system will lead to mitigating explosion disasters’ impact to the level that people can still survive, and minimize encounters.
For future work, we plan to employ a deep learning multi-layer neural network trained with a back propagation algorithm, and a convolutional deep learning neural network in order to improve the classification accuracy.
We also plan to implement a classification system based on extracting thermal descriptors from thermal infrared images of the seven classes under consideration in this research.
Author Contributions
This research paper is part of Sumaya Abusaleh’s Ph.D. dissertation. Ausif Mahmood and Khaled Elleithy were the advisor and co-advisor, respectively. Sarosh Patel is a member of the dissertation committee. Sumaya Abusaleh proposed the idea, collected the training dataset during 2014–2016, developed the classification system, performed the experiments, analyzed the results, and wrote the paper. Extensive discussion during the design and implementation of the proposed framework to determine the best approach for the classification system, and evaluation matrices were done over the past year by Sumaya Abusaleh, Ausif Mahmood, Khaled Elleithy, and Sarosh Patel.
Conflicts of Interest
The authors declare no conflict of interest.
References
- AlChE Staff, Center for Chemical Process Safety (CCPS) Staff. Guidelines for Evaluating Process Plant Buildings for External Explosions and Fires. Appendix A—Explosion and Fire Phenomena and Effects; American Institute of Chemical Engineers, John Wiley & Sons, Inc.: Hoboken, NJ, USA, 1996. [Google Scholar]
- Self, S. The effects and consequences of very large explosive volcanic eruptions. Philos. Trans. R. Soc. Lond. A: Math. Phys. Eng. Sci. 2006, 364, 2073–2097. [Google Scholar] [CrossRef] [PubMed]
- Bogoyavlenskaya, G.E.; Braitseva, O.A.; Melekestsev, I.V.; Kiriyanov, V.Y.; Miller, C.D. Catastrophic eruptions of the directed-blast type at Mount St. Helens, Bezymianny and Shiveluch volcanoes. J. Geodyn. 1985, 3, 189–218. [Google Scholar] [CrossRef]
- Nairn, I.A.; Self, S. Explosive eruptions and pyroclastic avalanches from Ngauruhoe in February 1975. J. Volcanol. Geother. Res. 1978, 3, 39–60. [Google Scholar] [CrossRef]
- Pipkin, B.; Trent, D.D.; Hazlett, R.; Bierman, P. Geology and the Environment, 6th ed.; Brooks/Cole-Cengage Learning: Belmont, CA, USA, 2010. [Google Scholar]
- Volcano Hazards Program, U.S. Department of the Interior—U.S. Geological Survey. Glossary-Effusive Eruption, Modified on 10 July 2015. Available online: https://volcanoes.usgs.gov/vsc/glossary/effusive_eruption.html (accessed on 24 September 2016).
- U.S. Department of the Interior—USGS, Volcano Hazards Program-Glossary-Tephra, Modified on 19 September 2013. Available online: http://volcanoes.usgs.gov/vsc/glossary/tephra.html (accessed on 24 September 2016).
- How Volcanoes Work, Tephra and Pyroclastic Rocks. Available online: http://www.geology.sdsu.edu/how_volcanoes_work/Tephra.html (accessed on 24 September 2016).
- Craig, P.P.; Jungerman, J.A. Nuclear Arms Race: Technology and Society, 2nd ed.; University of California; McGraw-Hill: Davis, CA, USA, 1990. [Google Scholar]
- Lindgen, N. Earthquake or explosion? IEEE Spectr. 1966, 3, 66–75. [Google Scholar] [CrossRef]
- National Geographic Society. Volcanic Ash. Available online: http://education.nationalgeographic.com/encyclopedia/volcanic-ash/ (accessed on 8 March 2017).
- Volcano Hazards Program. U.S. Department of the Interior—U.S. Geological Survey. Lava Flows and Their Effects, Modified on 24 May 2010. Available online: http://volcanoes.usgs.gov/hazards/lava/ (accessed on 24 September 2016).
- Lopes, R. The Volcano Adventure Guide; Cambridge University Press: Cambridge, UK, 2005. [Google Scholar]
- Gyakum, J.; Stix, J. Natural Disasters, McGill University on EDX, Montreal, Canada, Free Online Course Conducted on 14 January–11 April 2015. Available online: https://courses.edx.org (accessed on 11 April 2017).
- Spellman, F.R. Geography for Nongeographers; Government Institutes; The Scarecrow Press, Inc.: Lanham, MD, USA; Toronto, ON, Canada; Plymouth, UK, 2010. [Google Scholar]
- Branney, M.J.; Kokelaar, P. Pyroclastic Density Currents and the Sedimentation of Ignimbrites; The Geological Society of London: London, UK, 2002. [Google Scholar]
- Volcano Hazards Program, U.S. Department of the Interior—U.S. Geological Survey. Glossary—Eruption Column, Modified on 28 July 2015. Available online: http://volcanoes.usgs.gov/vsc/glossary/eruption_column.html (accessed on 24 September 2016).
- Pfeiffer, T. Volcano Discovery. Available online: https://www.volcano-adventures.com/tours/eruption-special/sinabung.html (accessed on 8 March 2017).
- Volcano Hazards Program, U.S. Department of the Interior—U.S. Geological Survey. Mount St. Helens, Modified on 27 August 2015. Available online: https://volcanoes.usgs.gov/volcanoes/st_helens/st_helens_geo_hist_99.html (accessed on 28 February 2017).
- TVNZ One News—Undersea Volcano Eruption 09 [Tonga], Uploaded on 19 March 2009. Available online: https://www.youtube.com/watch?v=B1tjIihHgco (accessed on 8 March 2017).
- Seach, J. Volcano Live, Lava Colour|John Seach. Available online: http://www.volcanolive.com/lava2.html (accessed on 22 March 2017).
- U.S. Department of the Interior—USGS, Hawaiian Volcano Observatory. Available online: http://hvo.wr.usgs.gov/multimedia/index.php?newSearch=true&display=custom&volcano=1&resultsPerPage=20 (accessed on 11 June 2016).
- Tilling, R.; Heliker, C.; Swanson, D. Eruptions of Hawaiian Volcanoes—Past, Present, and Future. General Information Product 117, 2nd ed.; U.S. Department of the Interior, U.S. Geological Survey: Reston, VA, USA, 2010.
- Trinity Atomic Web Site. Gallery of Test Photos, 1995–2003. Available online: http://www.abomb1.org/testpix/index.html (accessed on 24 September 2016).
- Operation Crossroads 1946. Available online: http://nuclearweaponarchive.org/Usa/Tests/Crossrd.html (accessed on 20 April 2014).
- The National Security Archive—The George Washington University. The Atomic Tests at Bikini Atoll. July 1946. Available online: http://nsarchive.gwu.edu/nukevault/ebb553–70th-anniversary-of-Crossroads-atomic-tests/#photos (accessed on 28 February 2017).
- Wicander, R.; Monroe, J.S. Essentials of Physical Geology, 5th ed.; Brooks/Cole-Cengage Learning: Belmont, CA, USA, 2009; pp. 128–130. [Google Scholar]
- U.S. Department of the Interior—USGS, Volcano Hazards Program. Monitoring Volcano Ground Deformation, Modified on 29 December 2009. Available online: https://volcanoes.usgs.gov/activity/methods/index.php (accessed on 24 September 2016).
- U.S. Department of the Interior—USGS, Volcano Hazards Program. Temperatures at the Surface Reflect Temperatures Below the Ground, Modified on 7 January 2016. Available online: https://volcanoes.usgs.gov/vhp/thermal.html (accessed 24 September 2016).
- Moran, S.C.; Freymueller, J.T.; Lahusen, R.G.; Mcgee, K.A.; Poland, M.P.; Power, J.A.; Schmidt, D.A.; Schneider, D.J.; Stephens, G.; Werner, C.A.; et al. Instrumentation Recommendations for Volcano Monitoring at U.S. Volcanoes under the National Volcano Early Warning System; Scientific Investigation Report 2008–5114; Department of the Interior—USGS: Reston, VA, USA, 2008.
- Langer, H.; Falsaperla, S.; Masotti, M.; Campanini, R.; Spampinato, S.; Messina, A. Synopsis of supervised and unsupervised pattern classification techniques applied to volcanic tremor data at Mt Etna, Italy. Geophys. J. Int. 2009, 178, 1132–1144. [Google Scholar] [CrossRef]
- Iyer, A.S.; Ham, F.M.; Garces, M.A. Neural classification of infrasonic signals associated with hazardous volcanic eruptions. In Proceedings of the IEEE International Joint Conference on Neural Networks, San Jose, CA, USA, 31 July–5 August 2011; pp. 336–341. [Google Scholar]
- Picchiani, M.; Chini, M.; Corradini, S.; Merucci, L.; Sellitto, P.; Del Frate, F.; Stramondo, S. Volcanic ash detection and retrievals using MODIS data by means of neural networks. Atmos. Meas. Tech. 2011, 4, 2619–2631. [Google Scholar] [CrossRef]
- Tan, R.; Xing, G.; Chen, J.; Song, W.Z.; Huang, R. Fusion-based volcanic earthquake detection and timing in wireless sensor networks. ACM Trans. Sens. Netw. 2013, 9, 1–25. [Google Scholar] [CrossRef]
- Dickinson, H.; Tamarkin, P. Systems for the Detection and Identification of Nuclear Explosions in the Atmosphere and in Space. Proc. IEEE 1965, 53, 1921–1934. [Google Scholar] [CrossRef]
- Ammon, C.J.; Lay, T. USArray Data Quality. In Nuclear Test Illuminates; EOS, Transaction American Geophysical Union, Wiley Online Library, 2007; Volume 88, No. 4; pp. 37–52. Available online: http://onlinelibrary.wiley.com/doi/10.1029/2007EO040001/pdf (accessed on 15 April 2017).
- U.S. Geological Survey. Available online: https://www.usgs.gov/ (accessed on 1 January 2017).
- Department of Commerce, National Oceanic and Atmospheric Administration, National Weather Service. Ten Basic Cloud Types, Updated on 14 March 2013. Available online: http://www.srh.noaa.gov/srh/jetstream/clouds/cloudwise/types.html (accessed on 24 September 2016).
- Onet.Blog. Copyright 1996–2016. Available online: http://wulkany-niszczycielska-sila.blog.onet.pl/page/2/ (accessed on 24 September 2016).
- Pfeiffer, T. Volcano Adventures. Available online: https://www.volcano-adventures.com/travel/photos.html (accessed on 1 January 2017).
- Hipschman, R. Exploratorium. Full-Spectrum Science with Ron Hipschman: Fireworks. Available online: http://www.exploratorium.edu/visit/calendar/fullspectrum-science-ron-hipschman-fireworks-june-22-2014 (accessed on 24 September 2016).
- Wikimedia Commons. Available online: https://commons.wikimedia.org/wiki/Main_Page (accessed on 1 January 2017).
- Storm (HQ) Volcano Eruption (Vivaldi Techno) Vanessa Mae Violin Full HD Music Song Vídeo Remix 2013, Published on 7 April 2013. Available online: https://www.youtube.com/watch?v=lj6ZGGBy-R8 (accessed on 1 January 2017).
- The Nuclear Cannon (Upshot-Knothole—Grable), Published on 1 February 2013. Available online: https://www.youtube.com/watch?v=BECOQuQC0vQ (accessed on 1 January 2017).
- Texas Wildfires 2011 (Worst in TX History), Uploaded on 7 September 2011. Available online: https://www.youtube.com/watch?v=pqr2DNaMLiQ (accessed on 1 January 2017).
- The Worst Neighbors from Hell Presents the Best Fireworks Display July 4th, 2016, Published on 4 July 2016. Available online: https://www.youtube.com/watch?v=6qO6TFUp5C0 (accessed on 1 January 2017).
- Deep Blue Sky—Clouds Timelapse—Free Footage—Full HD 1080p, Published on 18 April 2016. Available online: https://www.youtube.com/watch?v=3pD88QLP1AM (accessed on 1 January 2017).
- U.S. Department of the Interior—USGS, Volcano Hazards Program. Pyroclastic Flows Move Fast and Destroy Everything in Their Path, Modified on 12 February 2016. Available online: https://volcanoes.usgs.gov/vhp/pyroclastic_flows.html (accessed on 24 September 2016).
- Joschenbacher. File: Fissure Eruption in Holurhraun (Iceland), 13 September 2014. JPG, Uploaded on 24 September 2014. Available online: https://commons.wikimedia.org/wiki/File:Fissure_eruption_in_Holurhraun_(Iceland),_13._September_2014.JPG (accessed on 8 March 2017).
- Pfeiffer, T. Volcano Discovery. Available online: http://www.decadevolcano.net/photos/etna0701_1.htm (accessed on 24 September 2016).
- Newman, J. Wikimedia Commons. File; Zaca3.jpg, Uploaded on 17 October 2007. Available online: https://commons.wikimedia.org/wiki/File:Zaca3.jpg (accessed on 1 January 2017).
- Turk, M.; Pentland, A. Eigenfaces for Recognition. J. Cogn. Neurosci. 1991, 3, 71–86. [Google Scholar] [CrossRef] [PubMed]
- Jack, K. Video Demystified: A Handbook for the Digital Engineer, 3rd ed.; LLH Technology Publishing: Eagle Rock, VA, USA, 2001. [Google Scholar]
- Payette, B. Color Space Convertor: R’G’B’ to Y’CbCr, Xilinx, XAPP637 (v1.0). 2002; Available online: http://application-notes.digchip.com/077/77-42796.pdf (accessed on 11 April 2017).
- Nagabhushana, S. Computer Vision and Image Processing, 1st ed.; New Age International (P) Ltd.: New Delhi, India, 2005. [Google Scholar]
- Proakis, J.G.; Manolakis, D.G. Digital Signal Processing: Principles, Algorithms, and Applications, 3rd ed.; Prentice Hall, Inc: Upper Saddle River, NJ, USA, 1996. [Google Scholar]
- Smith, S.W. The Scientist and Engineer’s Guide to Digital Signal Processing, Chapter 12: The Fast Fourier Transform, Copyright 1997–2011. California Technical Publishing: San Diego, CA, USA; Available online: http://www.dspguide.com/ch12.htm (accessed on 11 April 2017).
- Hsu, C.W.; Chang, C.C.; Lin, C.J. A Practical Guide to Support Vector Classification. 2010. Available online: http://www.csie.ntu.edu.tw/~cjlin/papers/guide/guide.pdf (accessed on 11 April 2017).
- Burges, C.J.C. A Tutorial on Support Vector Machines for Pattern Recognition, Data Mining and Knowledge Discovery; Kluwer Academic Publishers: Hingham, MA, USA, 1998; Volume 2, pp. 121–167. [Google Scholar]
- Platt, J.C. Fast training of support vector machines using sequential minimal optimization. In Advances in Kernel Methods—Support Vector Learning; Scholkopf, B., Burges, C.J.C., Smola, A.J., Eds.; MIT Press: Cambridge, MA, USA, 1998. [Google Scholar]
- Diosan, L.; Oltean, M.; Rogozan, A.; Pecuchet, J.P. Genetically Designed Multiple-Kernels for Improving the SVM Performance. In Proceedings of the 9th Annual Conference on Genetic and Evolutionary Computation (GECCO’07), London, UK, 7–11 July 2007; p. 1873. [Google Scholar]
Figure 1.
(a) steam-driven eruption column of Guagua Pichincha, 10 km west of Quito, Ecuador, on 7 October 1999 (photo credit: Department of the Interior/U.S. Geological Survey) [17]; (b) collapse of a lava dome generates pyroclastic flows on Sinabung volcano, Sumatra, Indonesia, in 2013 (photo credit: Tom Pfeiffer/www.VolcanoDiscovery.com) [18]; (c) PDC generated by a lateral blast during the main eruption of Mount Saint Helens, Washington State, USA, on 18 August 1980 (photo credit: Department of the Interior/U.S. Geological Survey) [19]; (d) boiling over-based PDC generation mechanism from an undersea volcano erupted off the coast of Tonga, on 18 March 2009 (photo credit: the image was extracted from a video on YouTube website) [20]; (e) lava lake in Halema’uma’u crater, at the summit of Kilauea volcano, on 26 May 2016 (photo credit: Department of the Interior/U.S. Geological Survey) [22]; and (f) lava and tephra fallout from the Eruption of Pu‘u ‘Ö‘ö, Kilauea, Hawaii, in 1984, tephra fallout in this example is a combination of cinder, Pele’s tears, and Pele’s hair (photo credit: Department of the Interior/U.S. Geological Survey) [23].

Figure 2.
Mushroom-shaped cloud of the underwater Baker nuclear explosion in 1946 (photo courtesy of National Nuclear Security Administration/Nevada Field Office) [26].
Figure 2.
Mushroom-shaped cloud of the underwater Baker nuclear explosion in 1946 (photo courtesy of National Nuclear Security Administration/Nevada Field Office) [26].

Figure 3.
Volcanic monitoring techniques which are employed by the USGS Volcano Hazards Program (photo credit: Department of the Interior/U.S. Geological Survey) [28].
Figure 3.
Volcanic monitoring techniques which are employed by the USGS Volcano Hazards Program (photo credit: Department of the Interior/U.S. Geological Survey) [28].

Figure 4.
(a) pyroclastic density current (photo credit: Department of the Interior/U.S. Geological Survey) [48]; (b) lava fountain (photo credit: Joschenbacher, Wikimedia Commons) [49]; (c) lava and tephra fallout (photo credit: Tom Pfeiffer/www.VolcanoDiscovery.com) [50]; (d) nuclear mushroom cloud (photo credit: Trinity atomic website) [24]; (e) wildfire (photo credit: John Newman, Wikimedia Commons) [51]; (f) fireworks (photo credit: Ron Hipschman, Exploratorium, www.exploratorium.edu) [41]; (g) sky cloud (photo credit: National Weather Service, National Oceanic and Atmospheric Administration) [38].

Figure 5.
Steps of the PCA algorithm during training (learning).
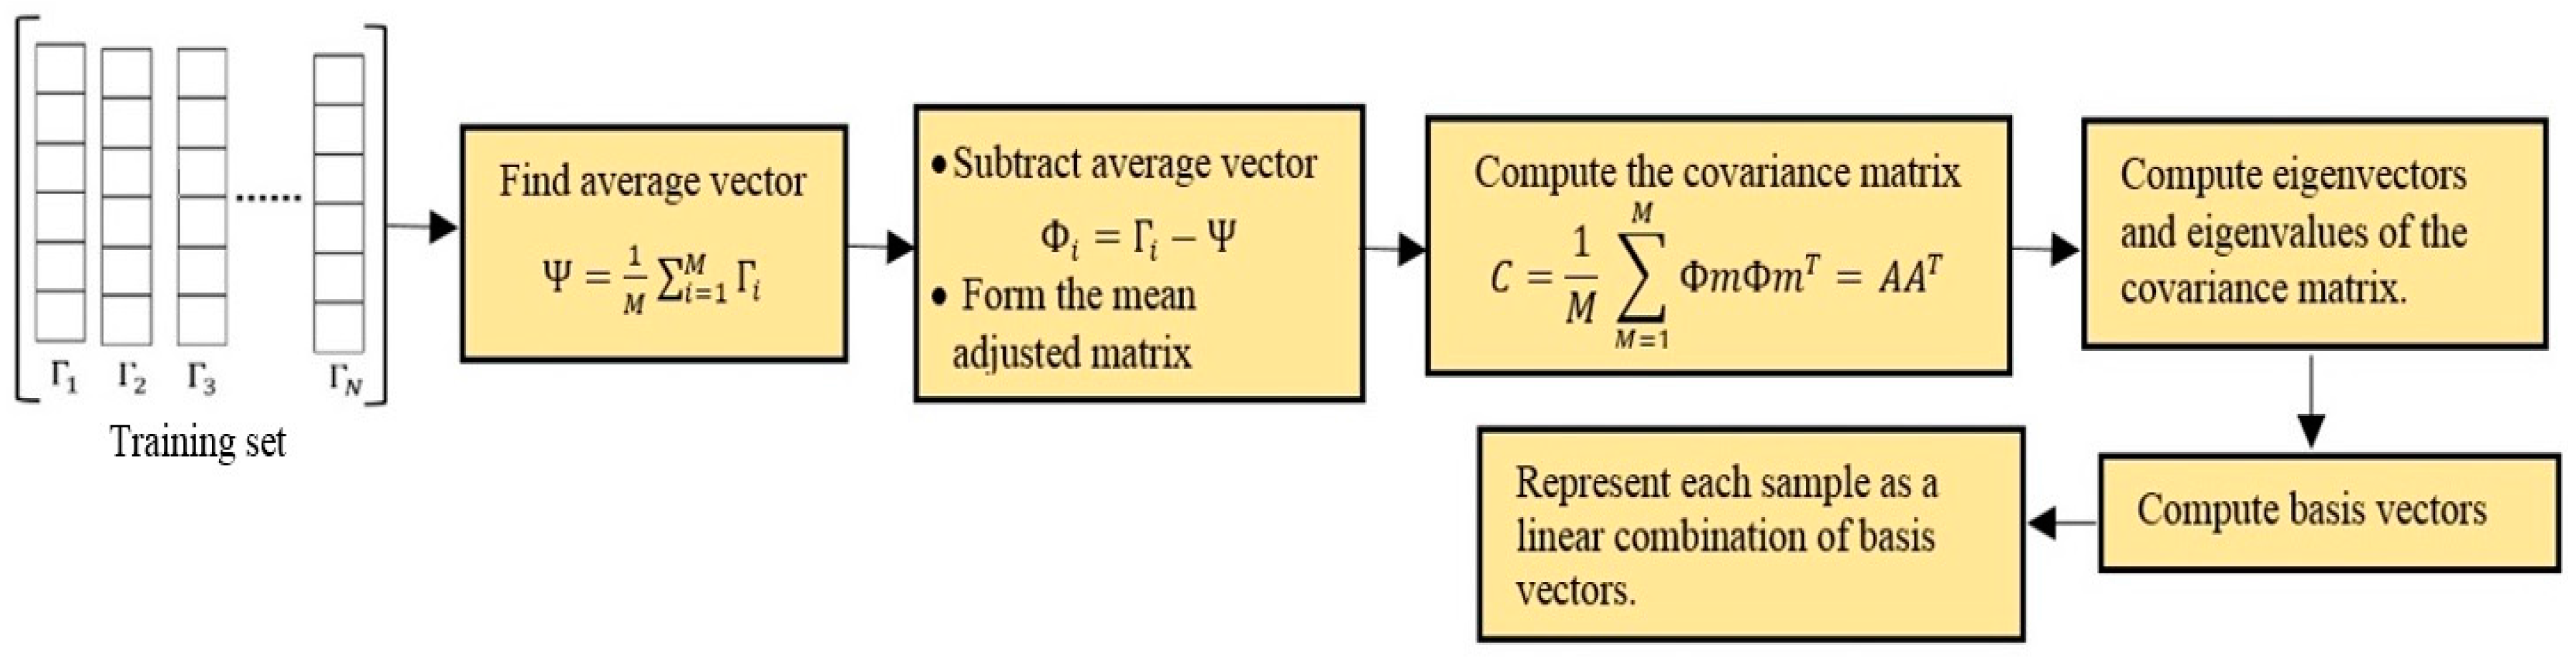
Figure 6.
Block diagram for extracting the highest 100 eigenvectors after employing time domain encoding schema.
Figure 6.
Block diagram for extracting the highest 100 eigenvectors after employing time domain encoding schema.

Figure 7.
Block diagram for extracting the highest 100 eigenvectors after employing Radix-2 FFT algorithm.
Figure 7.
Block diagram for extracting the highest 100 eigenvectors after employing Radix-2 FFT algorithm.
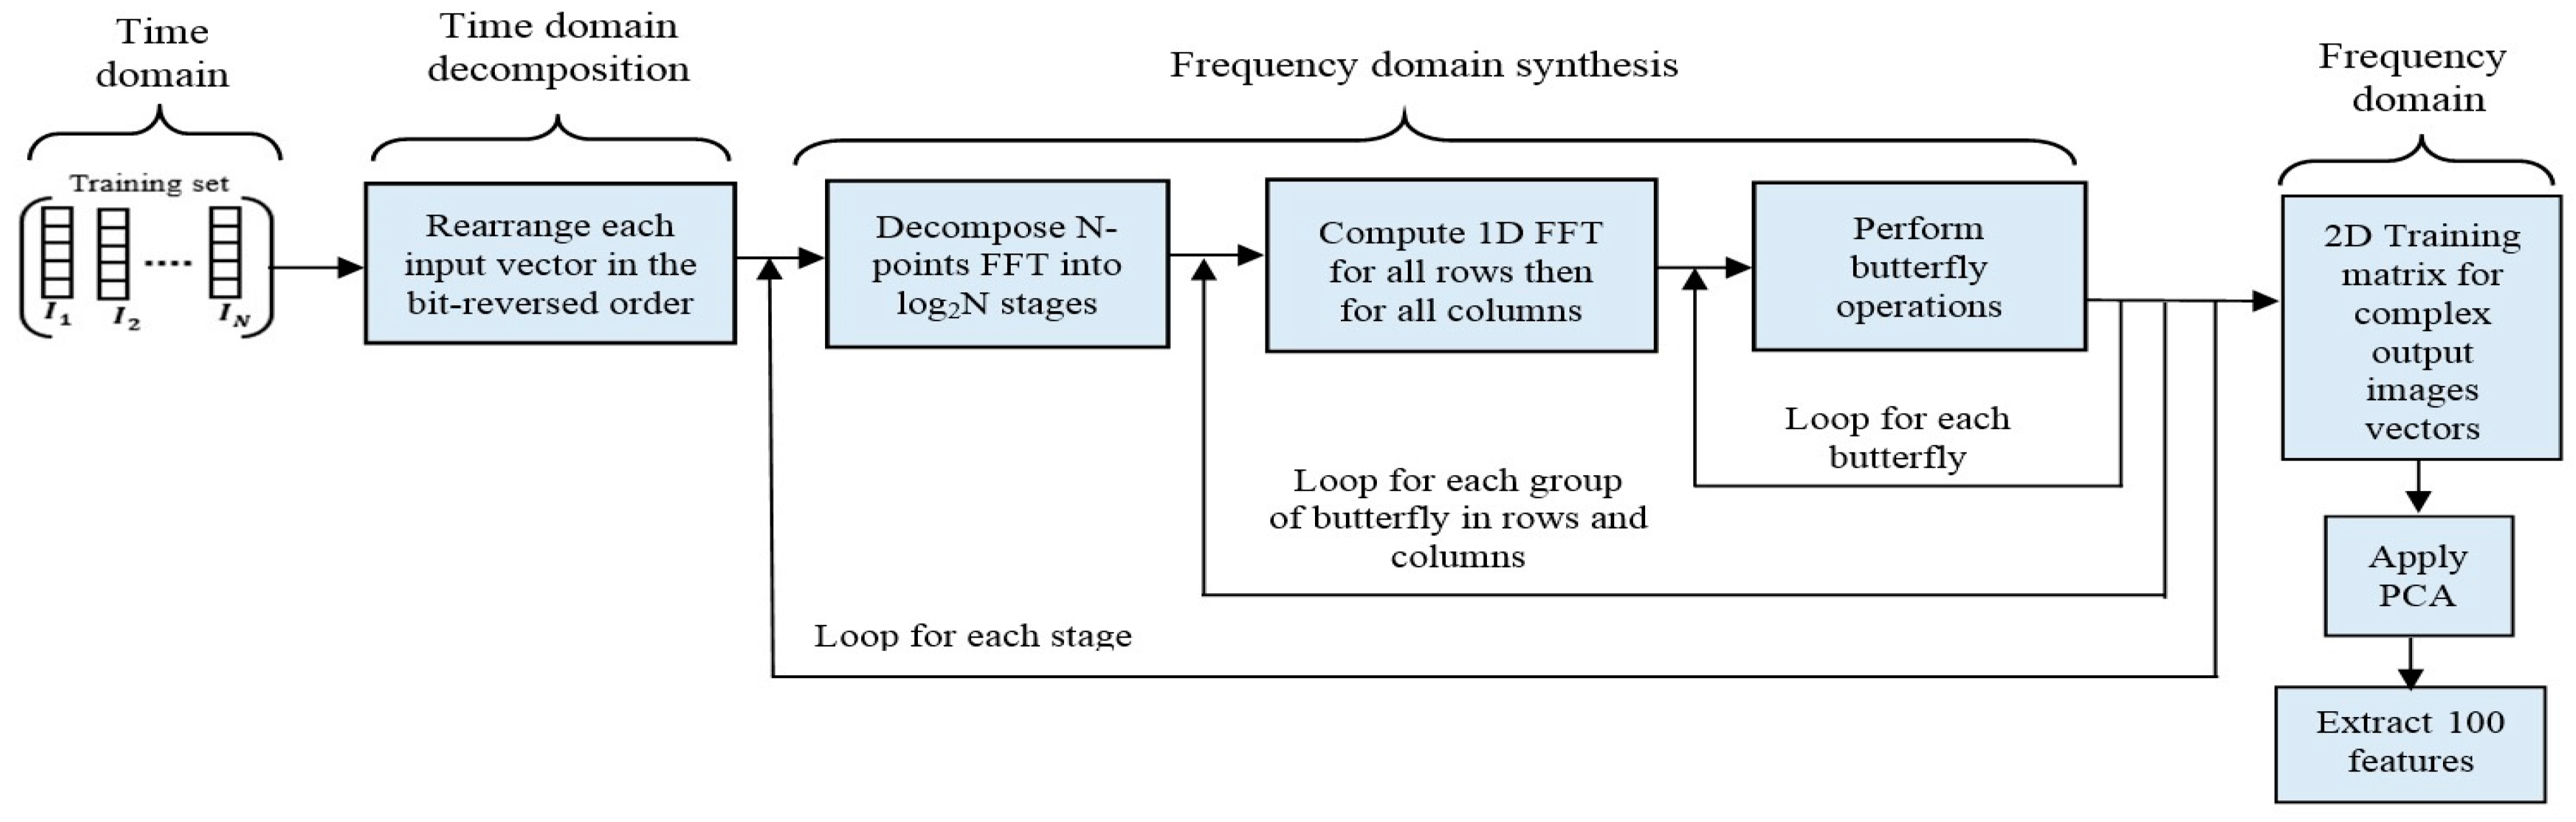
Figure 8.
Some samples of retrieved video sequences in the testing set.
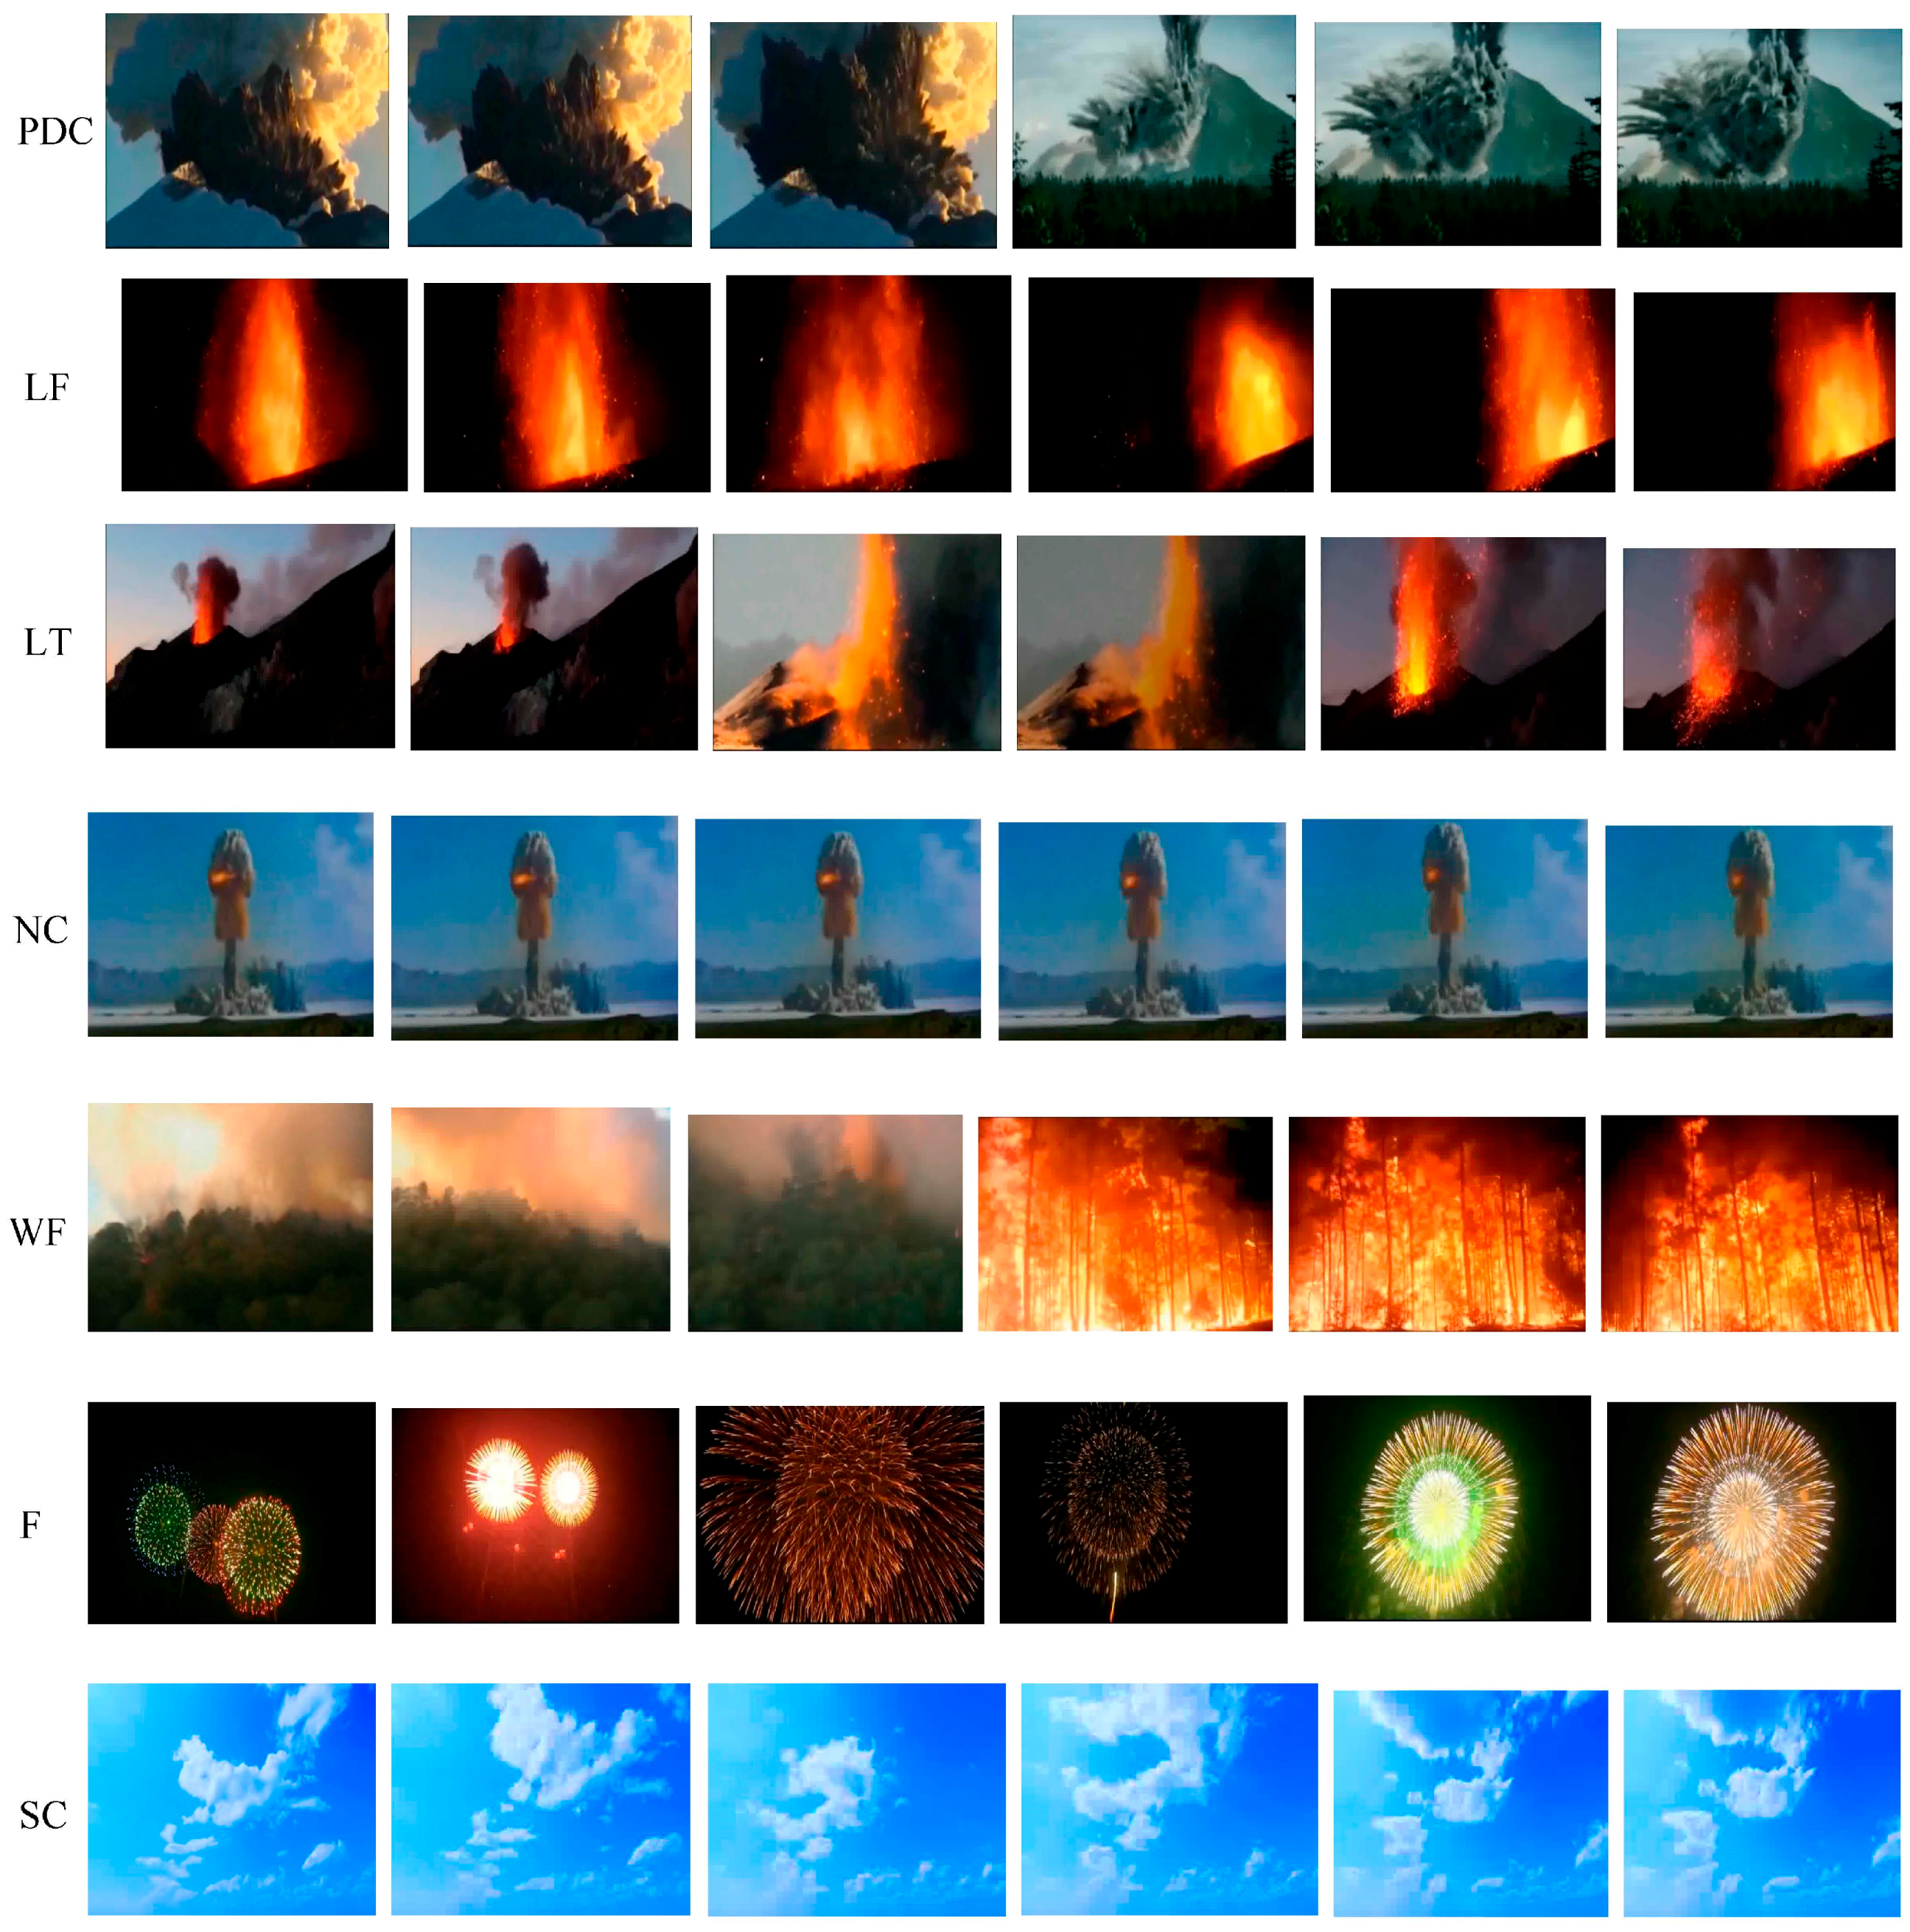
Figure 9.
Chart of classified versus misclassified samples of the 980 testing set.


Table 1.
Categories of our dataset.
| Category | Number of Images | |
|---|---|---|
| Explosion | Pyroclastic density currents (PDC) | 1522 |
| Lava fountains (LF) | 966 | |
| Lava and tephra fallout (LT) | 346 | |
| Nuclear mushroom clouds (NC) | 394 | |
| Non-explosion | Wildfires (WF) | 625 |
| Fireworks (F) | 980 | |
| Sky clouds (SC) | 494 | |
| Total | 5327 | |
Table 2.
Comparison between patterns in terms of accuracy.
| Category | Frame Rate | Resolution of Video Sequences | Number of Retrieved Frames for Testing | Frames Resized During Preprocessing | Features Input Vector | Accuracy |
|---|---|---|---|---|---|---|
| Video 1—PDC | 29 fps | 720 × 480 | 140 | 64 × 64 | 300 | 98.57% |
| Video 2—LF | 29 fps | 720 × 480 | 140 | 64 × 64 | 300 | 90.71% |
| Video 3—LT | 29 fps | 720 × 480 | 140 | 64 × 64 | 300 | 83.57% |
| Video 4—NC | 29 fps | 720 × 480 | 140 | 64 × 64 | 300 | 100% |
| Video 5—WF | 29 fps | 720 × 480 | 140 | 64 × 64 | 300 | 85.71% |
| Video 6—F | 29 fps | 720 × 480 | 140 | 64 × 64 | 300 | 100% |
| Video 7—SC | 29 fps | 720 × 480 | 140 | 64 × 64 | 300 | 100% |
Table 3.
Confusion matrix for multi-class degree-3 polynomial kernel SVM classifier.
| Actual | Predicted Results | ||||||
|---|---|---|---|---|---|---|---|
| PDC | LF | LT | NC | WF | F | SC | |
| PDC (140) | 138 | 0 | 2 | 0 | 0 | 0 | 0 |
| LF (140) | 0 | 127 | 0 | 0 | 0 | 13 | 0 |
| LT (140) | 10 | 8 | 117 | 0 | 5 | 0 | 0 |
| NC (140) | 0 | 0 | 0 | 140 | 0 | 0 | 0 |
| WF (140) | 5 | 9 | 0 | 0 | 120 | 6 | 0 |
| F (140) | 0 | 0 | 0 | 0 | 0 | 140 | 0 |
| SC (140) | 0 | 0 | 0 | 0 | 0 | 0 | 140 |
Table 4.
Time analysis in seconds for testing one frame.
| Phase | Time in Seconds |
|---|---|
| Time for extracting 300 features | 0.073 |
| Time to pass 1 frame to the classifier | 0.001 |
| Classification time | 0.046 |
| Total time | ≈0.12 |
© 2017 by the authors. Licensee MDPI, Basel, Switzerland. This article is an open access article distributed under the terms and conditions of the Creative Commons Attribution (CC BY) license (http://creativecommons.org/licenses/by/4.0/).
Share and Cite
MDPI and ACS Style
Abusaleh, S.; Mahmood, A.; Elleithy, K.; Patel, S. A Novel Vision-Based Classification System for Explosion Phenomena. J. Imaging 2017, 3, 14. https://doi.org/10.3390/jimaging3020014
AMA Style
Abusaleh S, Mahmood A, Elleithy K, Patel S. A Novel Vision-Based Classification System for Explosion Phenomena. Journal of Imaging. 2017; 3(2):14. https://doi.org/10.3390/jimaging3020014
Chicago/Turabian StyleAbusaleh, Sumaya, Ausif Mahmood, Khaled Elleithy, and Sarosh Patel. 2017. "A Novel Vision-Based Classification System for Explosion Phenomena" Journal of Imaging 3, no. 2: 14. https://doi.org/10.3390/jimaging3020014
Note that from the first issue of 2016, this journal uses article numbers instead of page numbers. See further details here.