Article

Thermogravimetric Investigation of the Lead Volatilization from Waste Cathode-Ray Tube Glass

Graduate School of Environmental Studies, Tohoku University, Aramaki Aza Aoba 6-6-07 Aoba-ku, Sendai 980-8579, Japan
*
Authors to whom correspondence should be addressed.
Recycling 2016, 1(1), 111-121; https://doi.org/10.3390/recycling1010111
Submission received: 21 December 2015 / Accepted: 3 February 2016 / Published: 6 February 2016

Abstract

:
The treatment of lead-containing cathode-ray tube (CRT) glass is an important environmental issue. One approach is the removal of lead by chloride volatilization. In the present work, the reaction of CRT glass with PVC as the chlorinating agent and Ca(OH)2 as the chlorine absorber was investigated by thermogravimetric analysis (TGA) in air. Seven reaction steps occurring at different temperatures were identified as dehydrochlorination of PVC/HCl absorption, CO2 absorption, Ca(OH)2 dehydration, PVC derived char oxidation, PbCl2 formation and volatilization, CaCO3 decarbonation, and CaCl2 volatilization. Kinetic analysis of the PbCl2 volatilization showed that the reaction of CRT glass during TGA resembles that of amorphous PbSiO4, while the reaction in the tube reactor was similar to that of crystalline PbSiO4. Crystallization accelerates PbCl2 volatilization, and it might be advantageous for lead removal to crystallize the glass deliberately before or during treatment in order to reduce processing time and increase efficiency.

1. Introduction

For decades, cathode-ray tubes (CRT) were an essential component of television sets and affected the appearance of living rooms globally. The desire for flat screens has resulted in the rapid disposal of old CRT televisions. About 20 million CRTs are disposed of each year in the USA alone and are either recycled into new CRT glass or other secondary materials [1]. Now that CRT technology is obsolete, however, other treatment methods must be found. Landfilling is not recommended, since these highly leaded materials pose an environmental threat. Moreover, even if lead usage is questionable as a result of its toxicological properties, lead is still of economic interest, and lead mining causes serious environmental problems [2,3]. For this purpose, lead recovery may help to reduce environmental burden.
Among the methods used for lead removal [4,5,6], the volatilization of lead chloride (PbCl2) recently showed promising results [7,8,9]. By the addition of a chlorination agent (i.e., CaCl2, NaCl, poly(vinyl chloride) (PVC)), lead is separated from the glass matrix as PbCl2. The boiling point of 950 °C allows the volatilization of PbCl2 within an acceptable temperature range. Up to 99.8% of the lead can be separated from the glass at 1000 °C.
The volatilization of PbCl2 is of interest in various fields. Previously, it was observed as an unwanted effect during the incineration of sewage sludge [10], municipal waste [11,12], and plastic materials [13,14]. Lead present in the waste is volatilized in the presence of chlorine sources and released into the environment, if not recovered as fly ash. However, the same effect can be used for detoxification of heavy-metal contaminated materials such as contaminated soil [15], and ashes from the incineration of sewage sludge [16] and municipal waste [17,18,19,20,21]. It has also been used for the separation of lead from galena ore [22], iron in electric arc furnace dust [23,24], and from cement during cement sintering [25]. All of these examples show not only the environmental significance, but also the economic impact that this process implies.
Various works were carried out to investigate the mechanism of lead volatilization. It was shown that moisture [26,27] and oxygen [28,29,30] in the atmosphere reduced the volatility of lead because of the transformation of PbCl2 into PbO. Yu et al. [27] developed a pore diffusion model for the vaporization of heavy metals from porous ash particles. Haiying et al. [31] and Wang et al. [32] identified the different steps that occur in fly ash during the volatilization of heavy metals by differential thermal analysis (DTA) and thermogravimetric analysis (TGA). Kinetic data sets were obtained from different materials, with lead volatilization values between 133 and 175 kJ·mol−1 [18,24,33]. However, none of these results can be applied to a glassy material like CRT glass, with its smooth surface and low melting point.
Previously, we investigated the removal of lead from CRT glass using CaCl2 and NaCl [8] and the combination of PVC and Ca(OH)2 [9]. This time, we want to shed light on the reactions that result in lead volatilization and compare them with those observed in crystalline and amorphous PbSiO3.

2. Experimental Section

2.1. Materials

The CRT funnel glass used in this work was described previously [9]. The PbO and SiO2 contents were 27.9 and 54.4 wt%, respectively, corresponding to a molar SiO2/PbO ratio of 7.24. The remainder consisted mainly of K2O, CaO, MgO, and Al2O3. The material was ground and sieved, and the fraction with a particle size below 106 µm was used. The sample did not contain any chloride. Therefore, PVC, with a polymerization degree of 1000 ± 40 and a chlorine content of 57 wt%, and CaCl2, both derived from Kanto Chemicals, were used as chlorine sources. All other chemicals were purchased from Kanto Chemicals as well. Except PVC, the chemicals used for TGA were dried before use under vacuum at 80 °C.
Amorphous PbSiO3 was prepared by annealing 10 g of PbO with 2.692 g of SiO2 for 3 h at 800 °C in a muffle furnace. For the preparation of crystalline PbSiO3, the same amount was annealed for 17 h at 720 °C [34]. The composition derived from inductive-coupled-plasma atom emission spectroscopy (ICP-AES) (Seiko SPS7800, Tokyo, Japan) is presented in Table S1, and the X-ray diffraction (XRD) (Rigaku RINT 200 VHF, Tokyo, Japan) spectra are presented in Figure S1 in the supplementary material.

2.2. Thermogravimetric Analysis

TGA was performed using a Seiko Instrument TG/DTA6200. For the analysis of the reaction pathway, a 10 mg sample consisting of 28.9 wt% CRT glass, 32.5 wt% PVC, and 38.6 wt% Ca(OH)2 (molar Cl/Pb ratio: 14.4, molar Ca/Cl ratio: 1.0) placed in a Pt-crucible was heated at a constant rate of 4 °C·min−1 from 50 to 1000 °C in artificial air at a flow rate of 150 mL·min−1. For comparison, the TGA of PVC, Ca(OH)2, CaCO3, CaCl2, PbO, and PbCl2 were recorded under the same conditions.
For the isothermal runs, the same sample and conditions were used. Additionally, experiments were performed in which CRT glass was replaced by PbSiO3, either crystalline or amorphous. Isothermal runs were conducted between 580 and 640 °C. The sample was heated from ambient temperature at a rate of 50 °C·min−1 to a temperature 20 °C below the desired temperature. Then, the heating rate was reduced to 10 °C·min−1 to avoid overheating of the sample. The CRT glass was heated to the desired temperature at a rate of 4 °C·min−1 in order to prevent reactions related to the degradation of PVC and Ca(OH)2 from interfering with the lead volatilization.

2.3. Tube Reactor Experiments

Experiments in the tube reactor were carried out as previously described [9]. Samples of the same composition mentioned above were treated at 600, 700, 800, 900, and 1000 °C using an alumina boat in a quartz glass tube reactor. The lead content was determined by ICP-AES after dissolving the residue in a mixture of conc. nitric acid, fluoric acid (46 wt% HF in water), and H2O2 [8].

2.4. Kinetic Investigation

The activation energy (EA) and the pre-exponential factor (A) were derived from the Arrhenius equation:
ln k = ln A E A R T
with R being the gas constant (8.3144 J mol−1 · K−1). The rate constant (k) at a given temperature (T) was derived from:
g ( X ) = k t
The time (t) was plotted against the function g(X), where X is the conversion, and k was obtained as the slope. The correlation coefficients derived from Equation (2) were used to decide the reaction model. The function g(X) for common reaction models was taken from Grause et al. [35] (see Table S2). A selection of reaction models mentioned later in the text is given in Table S2.

3. Results and Discussion

The purpose of this work was to investigate the reaction mechanism of lead volatilization in the presence of PVC and Ca(OH)2. At first, each step of the process was identified using TGA. After that, the kinetics of lead volatilization was examined by isothermal experiments using TGA and a quartz glass tube reactor.

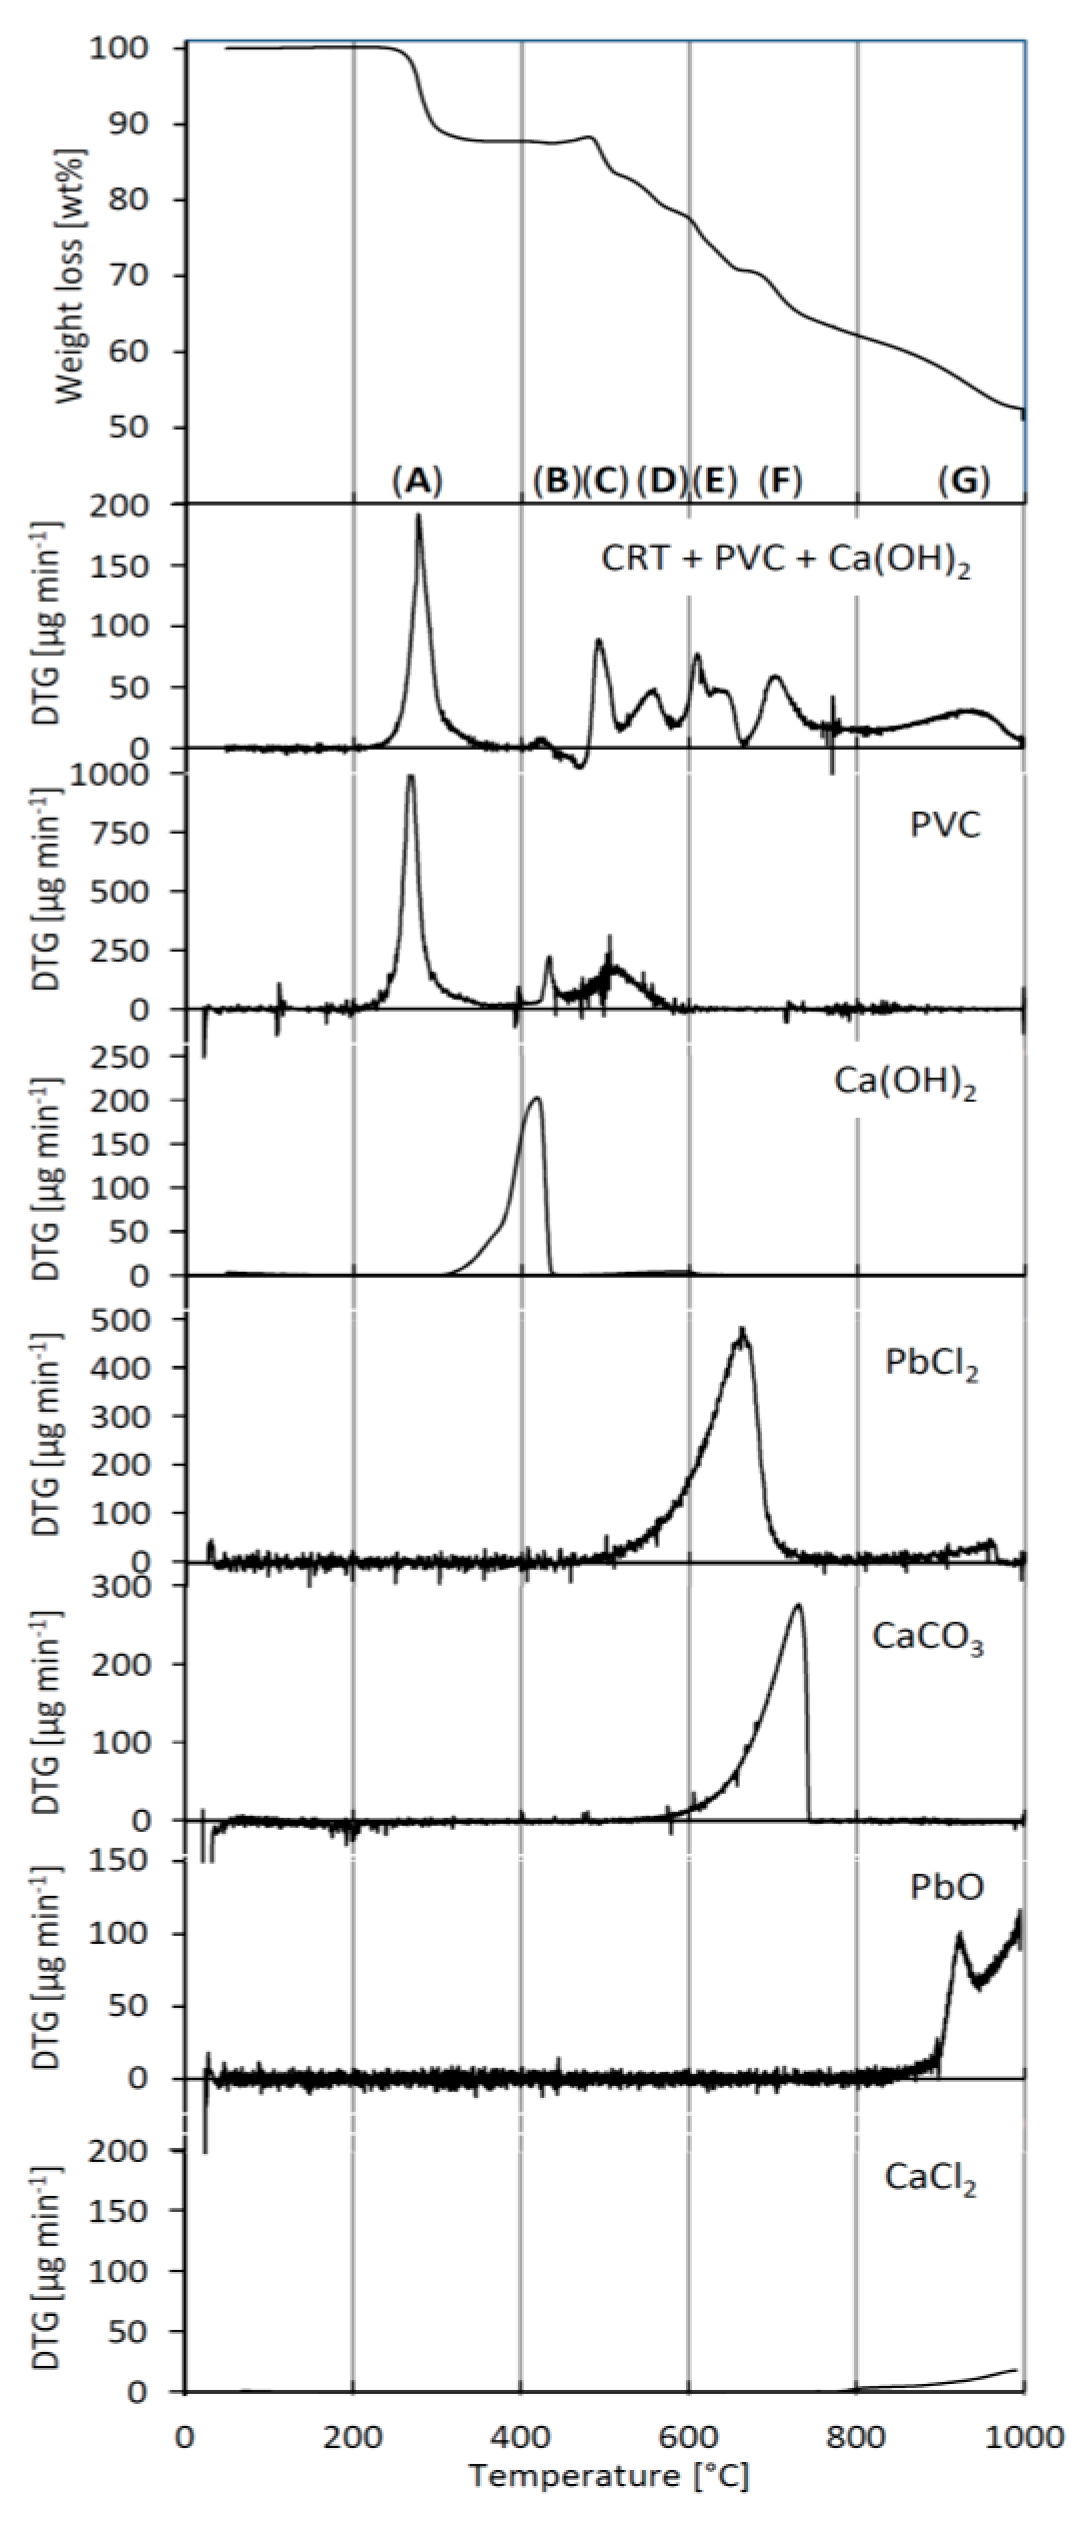
3.1. Identification of Reaction Steps

In order to identify the different processes that might occur during the reaction of CRT glass with Ca(OH)2 and PVC, the weight loss of the sample mixture was determined using TGA and was compared with those of pure compounds (Figure 1). In accordance with the dispersity of the sample, various weight loss steps were observed. Since only reactions that result in weight loss were detected, those that do not influence the sample weight, such as the reaction between CaCl2 and PbO, were not directly observed.
The reduction of the sample mass began with the evolution of HCl by the dehydrochlorination of PVC. The derivative thermogravimetric (DTG) curves of the CRT glass sample and the pure PVC sample show peaked at 277 and 267 °C, respectively. A weight loss of 12.5 wt% was observed for the CRT glass sample. The absorption of HCl by Ca(OH)2 resulted in the loss of water:
Ca(OH)2 + 2 HCl → CaCl2 + 2 H2O
Between 435 and 479 °C, the sample weight rose by 0.8 wt% by the uptake of oxygen from the artificial air atmosphere. This behavior was not observed during the degradation of any other reference sample, suggesting that a combination of several compounds was involved. Around the same temperature that the weight of the CRT sample increased, the pure PVC sample showed a peak (DTG maximum: 434 °C) assigned to the combustion of hydrocarbons derived from the degraded PVC polyene backbone (CH) [36].
4 (CH) + 5 O2 → 4 CO2 + 2 H2O
In the case of the CRT sample, Ca(OH)2 acted as an absorber for CO2 from the reaction of PVC with oxygen, and, as a result, the fixed oxygen increased the weight of the sample:
Ca(OH)2 + CO2 → CaCO3 + H2O
Simultaneous with the CO2 uptake, the dehydration of Ca(OH)2 occurred:
Ca(OH)2 → CaO + H2O
From the DTG of Ca(OH)2, a peak maximum at 450 °C was observed. The simultaneous CO2 uptake caused the peak in the CRT sample to shift to 492 °C. Between 520 and 590 °C, the subsequent oxidation of the dehydrochlorinated PVC occurred with DTG peaks for the CRT and the PVC samples at 556 and 523 °C, respectively. Additionally, in this region, CO2 absorption might have occurred:
CaO + CO2 → CaCO3
Figure 1. TGA and DTG of CRT glass mixed with PVC and Ca(OH)2, DTG of pure samples of PVC, Ca(OH)2, PbCl2, CaCO3, PbO, and CaCl2. Numbers in circles indicate different reaction steps: (A) dehydrochlorination of PVC, (B) carbonation of Ca(OH)2, (C) dehydration of Ca(OH)2, (D) oxidation of PVC derived char, (E) volatilization of PbCl2, (F) decarbonation of CaCO3, (G) volatilization of CaCl2.
Recycling 01 00111 g001
Between 590 and 670 °C, the reaction of CaCl2 with lead glass and the subsequent volatilization of PbCl2 occurred:
PbSiO3 + CaCl2 → CaSiO3 + PbCl2
The region was marked by a sharp peak and a shoulder at the high temperature side. The sharp peak indicated the volatilization of PbCl2 that was already formed by reaction Equation (6) at lower temperatures. Since the volatilization of pure PbCl2 started at about 550 °C (5 wt% weight loss), it can be assumed that the vapor pressure was sufficiently high for the vaporization of PbCl2 from the CRT sample. The shoulder indicated that the formation of PbCl2 continued until the end of this temperature region, with the steady release of PbCl2 into the gas phase. The volatilization of PbCl2 followed the decarbonation of CaCO3 at a DTG peak temperature of 704 °C compared with 731 °C of pure CaCO3. The last step of weight loss in the investigated temperature range was caused by the volatilization of CaCl2. The volatilization of PbO occurred in the same temperature range as that of CaCl2. However, because of the high absorption ratio of chloride by Ca(OH)2, it can be assumed that most of the lead evaporated earlier as PbCl2, since the evolution of PbO seems to be negligible.

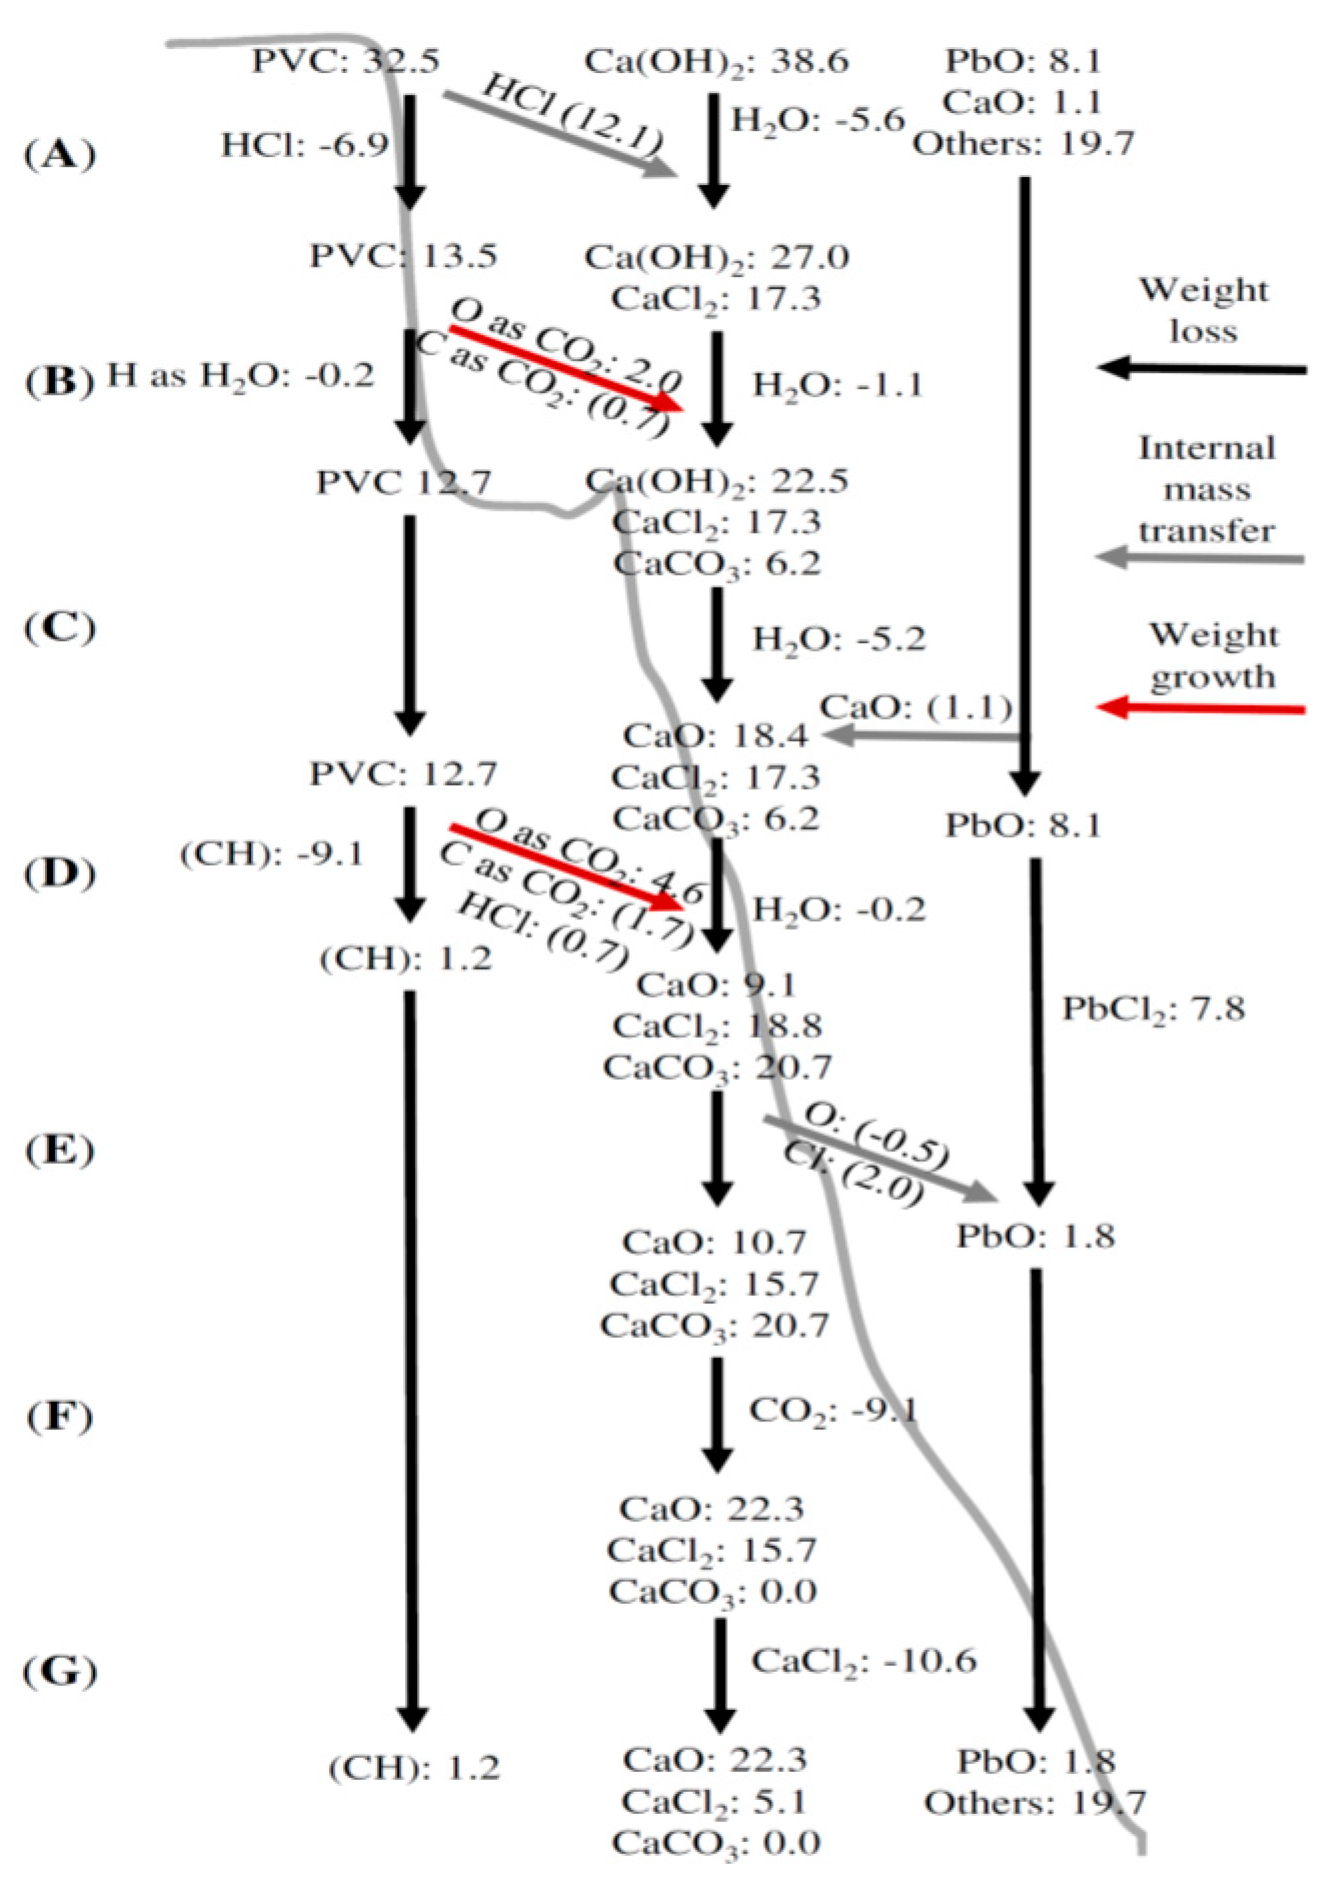
3.2. TGA Mass Balance

From the processes introduced above, we attempted to develop a mass balance (Figure 2). During the first degradation step, PVC released HCl, which was partly absorbed by Ca(OH)2, and, as a result, H2O was released instead. The calculations show that the complete absorption of the HCl would not have left enough Ca(OH)2 to explain the dehydration in step (C). Therefore, the best correlation with the experimental results were achieved with the assumption that 96% of the chlorine was released from PVC and 64% of the resulting HCl was absorbed by Ca(OH)2.
Figure 2. Mass balance of the lead volatilization. The black arrows describe weight loss, the gray arrows describe mass transfer from one sample fraction to another, and the red arrows describe the rising weight. The numbers next to the arrows refer to weight changes and the numbers between the arrows refer to the actual weight in wt%.
Recycling 01 00111 g002
Step (B) included the partial combustion of PVC. The resulting CO2 had to be completely absorbed by Ca(OH)2 in order to provide the necessary increase in weight. Weight loss by hydrocarbons and free CO2 must have been compensated by the additional absorption of CO2. The result otherwise would have been a lack of Ca(OH)2 and an insufficient amount of water during dehydration. The remaining Ca(OH)2 was completely dehydrated during step (C).
Step (D) included the combustion of the remaining dehydrochlorinated PVC. It is assumed that the residual chlorine was absorbed by CaO, resulting, together with the HCl absorption in step (A), in a total HCl absorption of 68%. About 17% of the carbon released during this step had to be absorbed as CO2 in order to obtain the CaCO3 required for the decarbonation in step (F). The weight loss observed in step (D) is insufficient to account for the complete degradation of PVC. About 1.2 wt% of the initial sample weight remained as dehydrochlorinated PVC or char.
Step (E) comprises the evolution of PbCl2. The chloride required for this step was provided by CaCl2, which was converted to CaO. The weight loss in this step is insufficient to account for the complete removal of lead as PbCl2, and 1.8 wt% remained in the sample as PbO. The complete decarbonation of CaCO3 was achieved in step (F), and a substantial loss of CaCl2 was observed in step (G). Alternatively, the remaining lead and dehydrochlorinated PVC might have been volatilized in this step.
The residue consisted mainly of calcium compounds and compounds that were barely altered during this thermal process (others: 19.7%). Some carbon and lead might have remained as well, although this was not observed in previous experiments and might have been the result of the assumptions made during the calculation. Carbon might have been burnt completely in air during a later degradation step. Lead chloride might have been volatilized at higher temperatures as well. Alternatively, the reduction of lead might have occurred in the presence of carbon sources:
PbO + C → Pb CO
However, this scenario is unlikely to have occurred in an air atmosphere. What is more likely is the volatilization of carbon and PbCl2 at the expense of CaCl2.

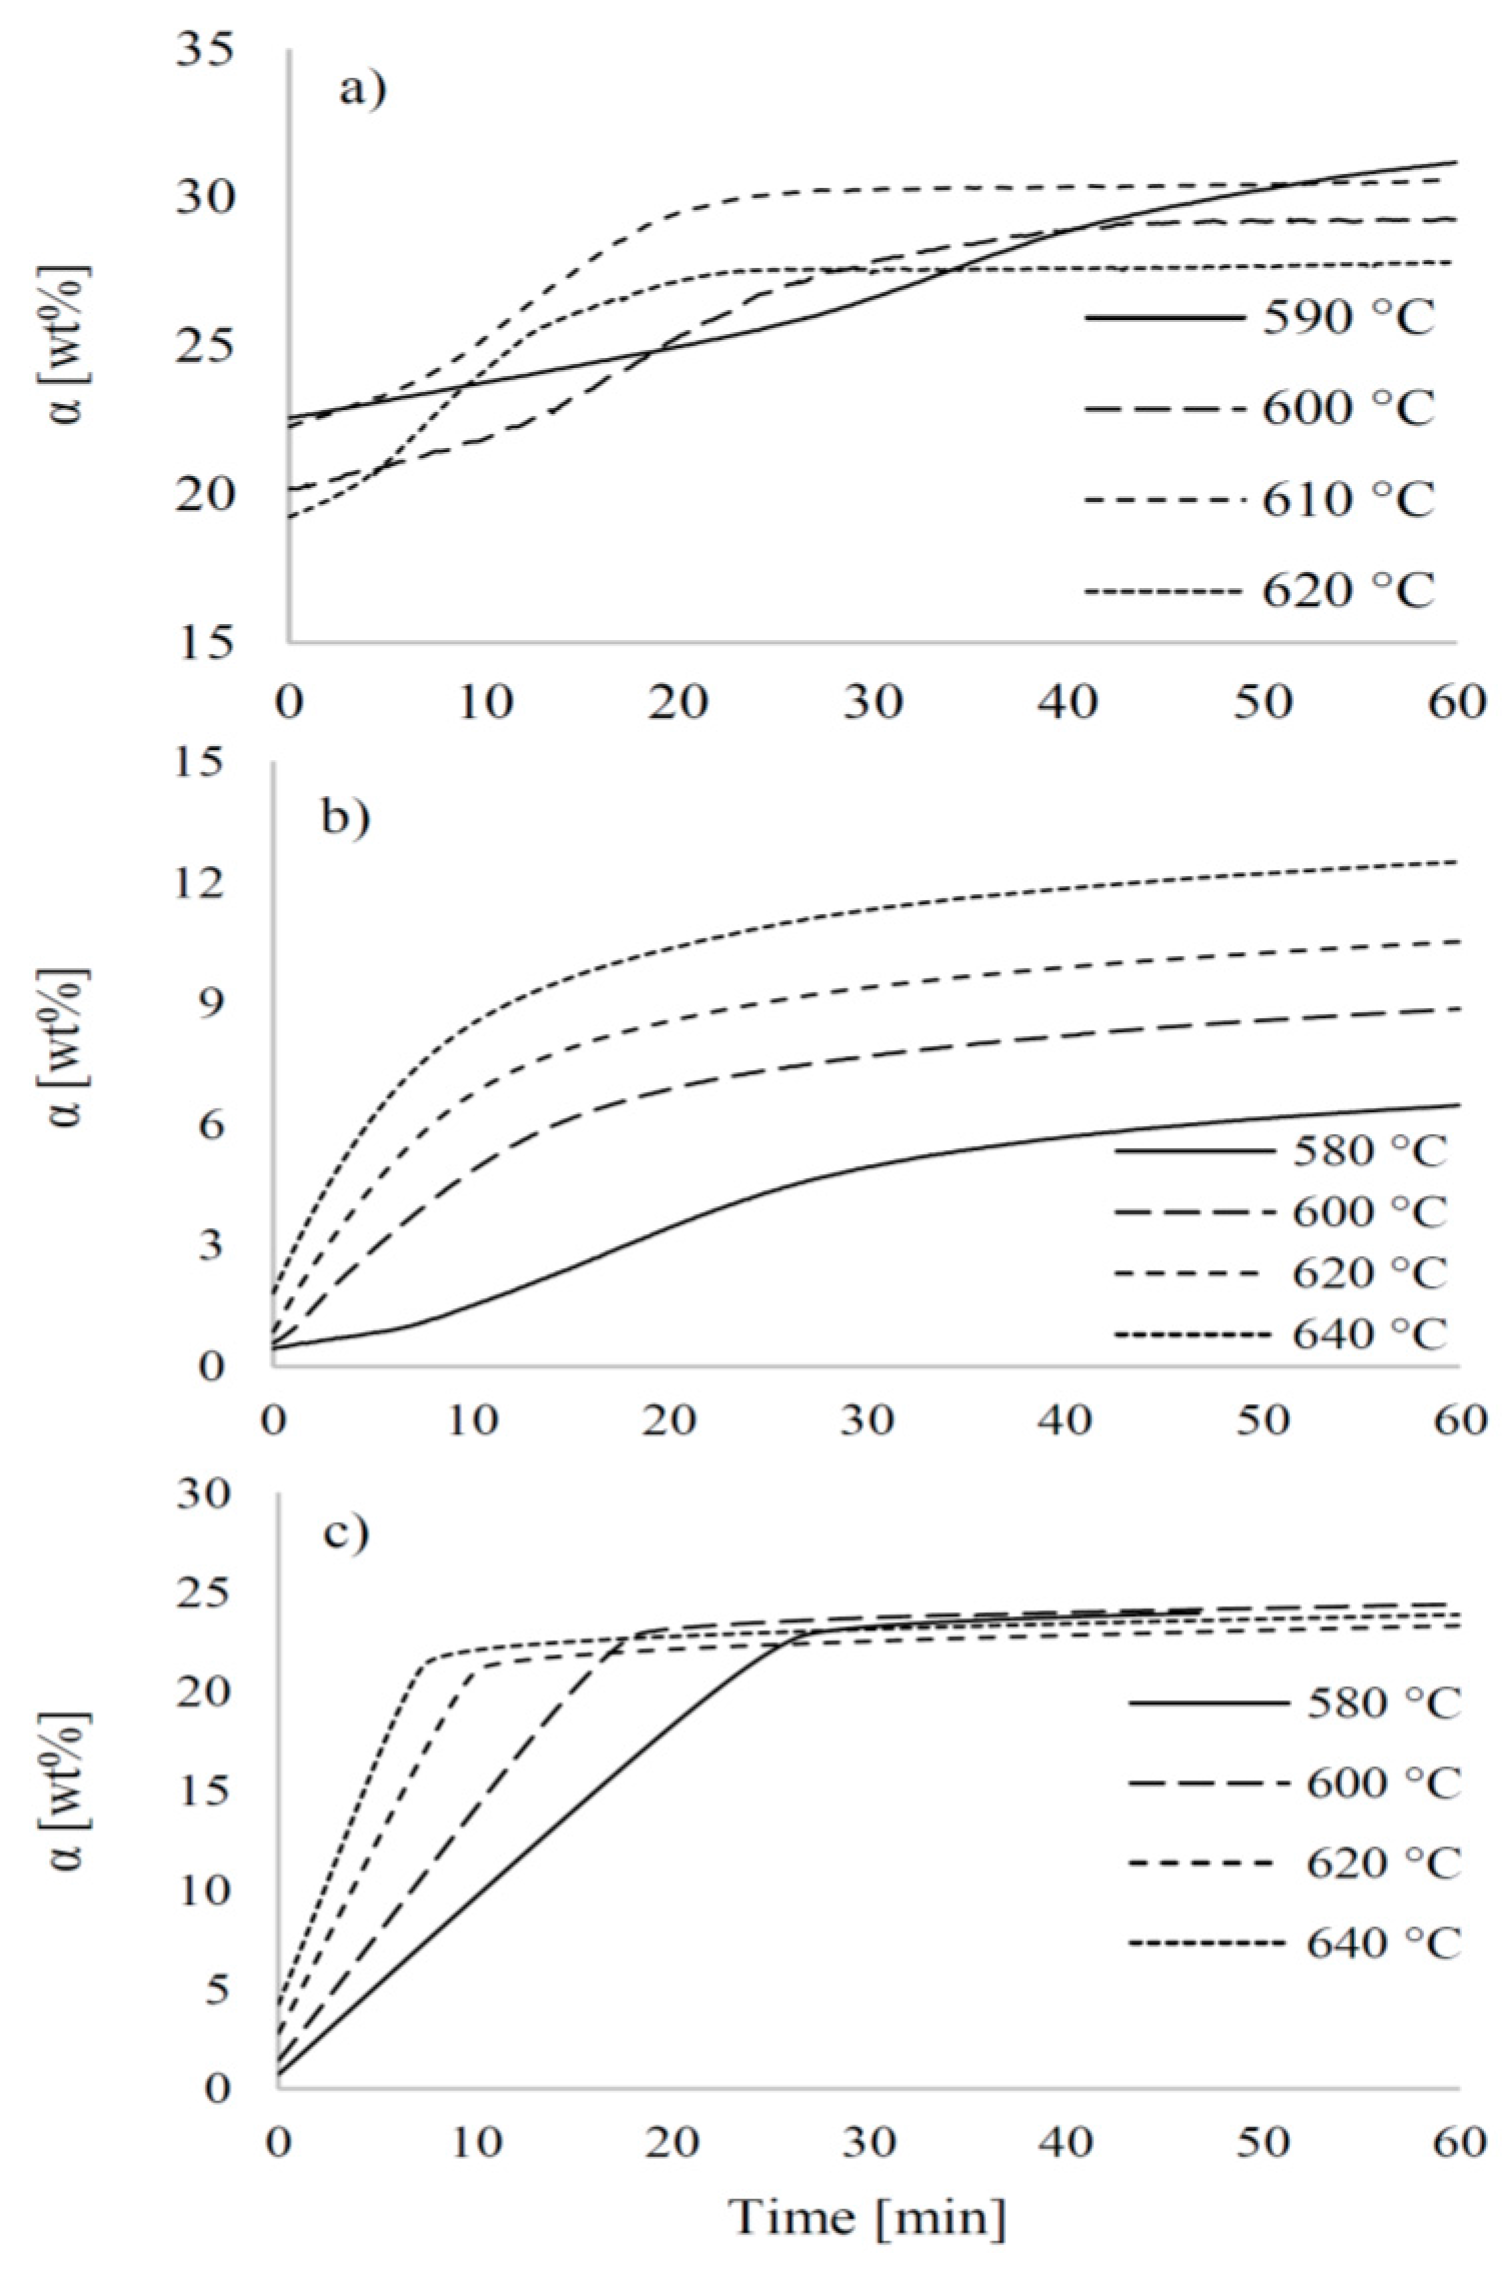
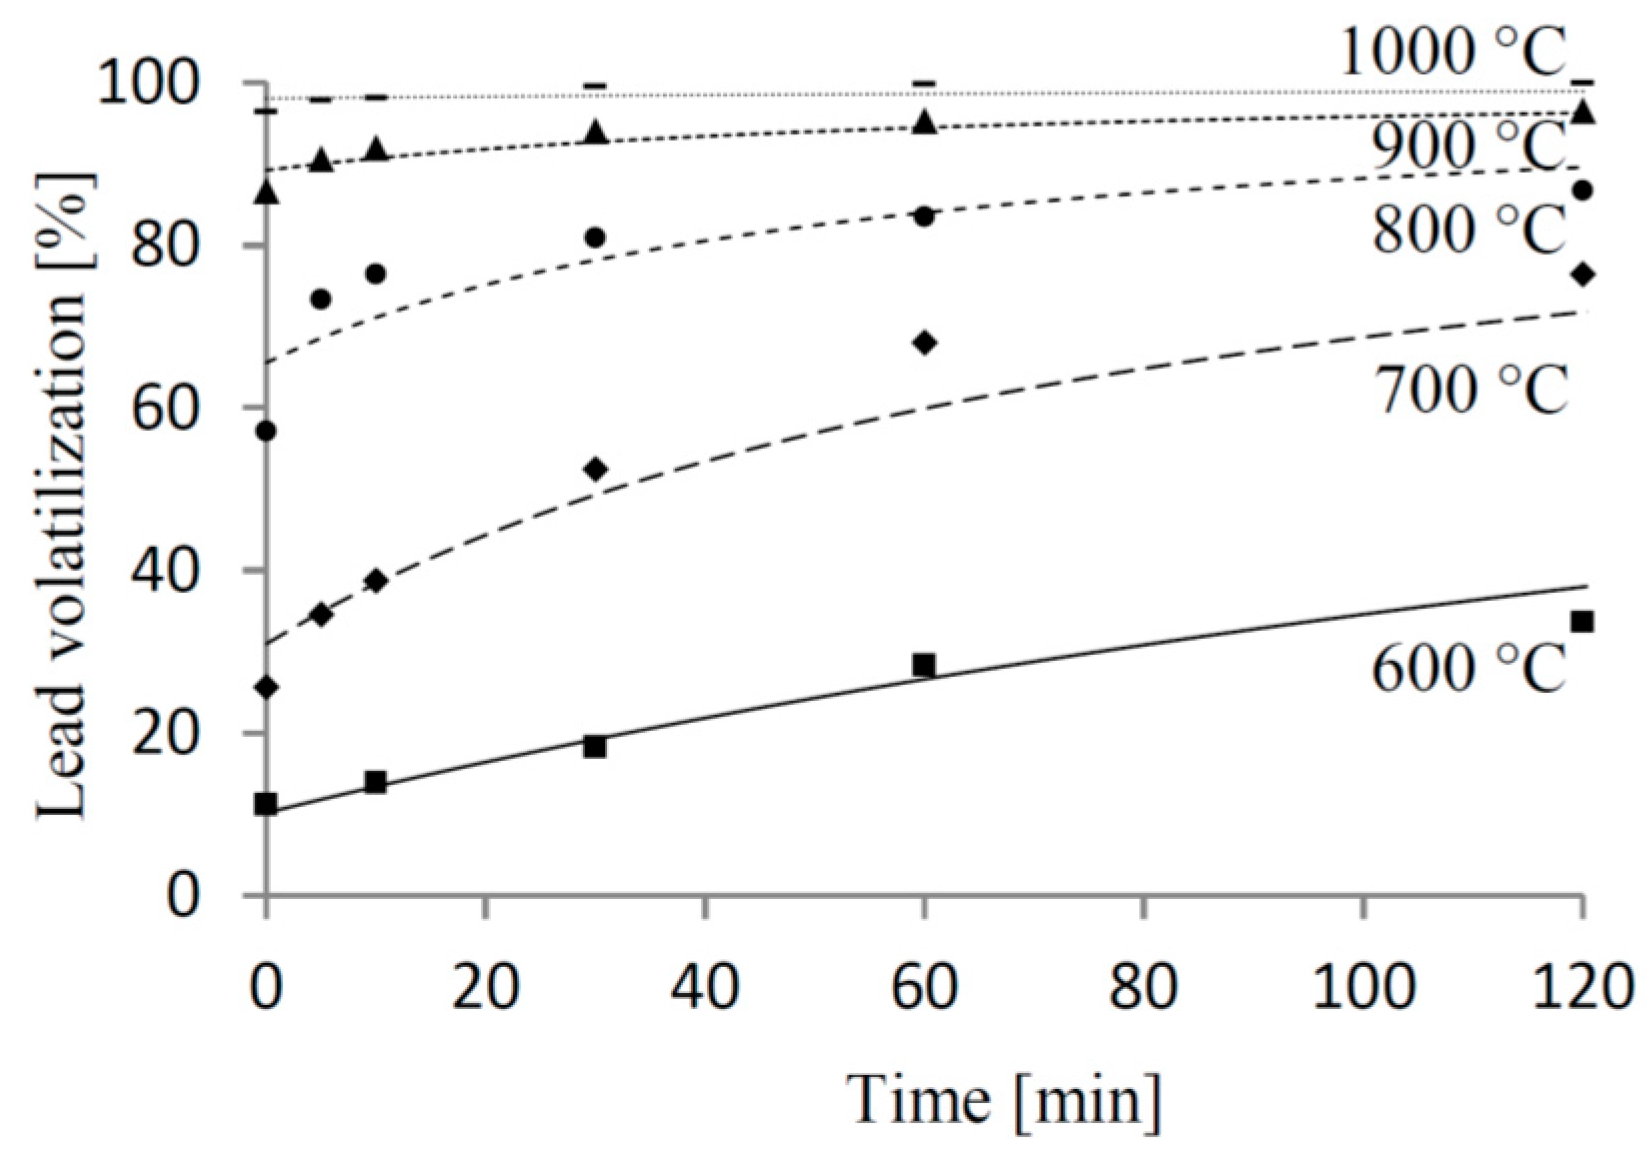
3.3. Kinetic Parameters

Kinetic parameters were determined by TGA for CRT glass mixed with Ca(OH)2 and PVC and for crystalline and amorphous PbSiO3, both mixed with CaCl2. The results were compared with those from CRT glass mixed with Ca(OH)2 and PVC obtained in a quartz glass tube reactor, taking into account the impact of the sample size of this inhomogeneous material (Table 1). As discussed above, certain reactions occurred within a defined temperature range in the sample mixture. For this reason, experiments were carried out in isothermal mode. The sample consisting of CRT glass, Ca(OH)2, and PVC was heated to the desired temperature at a low rate of 4 °C·min−1 in order to remove volatile compounds that could interfere with the volatilization of PbCl2. The upper temperature limit was defined by the decarbonation of CaCO3.
Table 1. Comparison of kinetic data.
SampleReaction StepEA [kJ·mol−1]A [min−1]Model
CRT (TGA)Step 1204–220-A3,A4,P2,P3,P4
Step 2180-D2,D3,D4
CRT (tube reactor) 1014770F2
Amorphous PbSiO4Step 1--A2,A3,P2,P3
Step 2190-D1,D2,D3,D4
1732.1 × 107P2/3
Crystalline PbSiO4 1164.0 × 104R3
1171.5 × 105F1
Despite the slow heating rate, the TGA curve of the CRT glass sample shows an irregular behavior caused by the inhomogeneity of the sample (Figure 3a). The sample treated at 590 °C had the highest weight loss when the desired temperature was reached; the lowest weight loss was observed at 620 °C. At least two steps were present. Determination of the kinetic model showed high uncertainty caused by the very narrow range in which correlation coefficients for certain kinetic models were obtained. The highest certainty might have been related to the kinetic models A3, A4 (Avrami-Erofeev) and P2, P3, P4 (power law) with activation energies between 204 and 220 kJ·mol−1. The kinetic models, A3 and A4, are assumed to be meaningful, since they can describe the nucleation of gas bubbles in a glass melt as the predominant process. After this first stage, the reaction rate accelerated and probably became diffusion-controlled with an activation energy of about 180 kJ·mol−1. The change was accompanied by a rising volatilization rate as the decreasing activation energy implies. It can be assumed that the change in the reaction model was caused by changes in physical properties such as crystallization. Bubbles are commonly formed in melts when other transport mechanisms are unable to provide the mass transport required by gas evolution. The loss of lead and the rising Ca-content destabilized the glass to the point at which the glass crystallizes. At this point, nucleation stopped, caused by the low flexibility of the matrix. However, the higher rigidity of crystals also enabled the opening of cracks, gaps and pores, as well as a faster transport of gaseous products by diffusion. The crystallization of the melt might have been induced by the formation of calcium silicates, as previously observed [9].
In order to shed light on the processes involved, the PbCl2 volatilization from pure PbSiO3 glass and crystalline PbSiO3 in the presence of CaCl2 was investigated (Figure 3b,c). Both samples were heated rapidly from ambient to the desired temperature, since competitive reactions were not expected. The TGA plots of both amorphous and crystalline PbSiO3 showed a behavior independent from the target temperature. From the amorphous form, two steps were identified. The first step was only observed at the lowest temperature of 580 °C, which did not allow the calculation of a kinetic data set. However, it became clear that at 580 °C the first 8 min are represented best by the kinetic models of A2, A3 or P2, P3, which is close to the findings from the CRT glass sample. After this initial step, the volatilization rate accelerated and the reaction became diffusion-controlled with an activation energy of about 190 kJ·mol−1. Regression factors of each of the four diffusion models applied were very close and a decision could not be made. Nevertheless, the results obtained from amorphous PbSiO3 support the findings from CRT-glass. As an alternative to a diffusion-controlled mechanism, the power law, P2/3, might be considered, with EA = 173 kJ·mol−1 and A = 2.1 × 10⁷ min−1.
The volatilization of PbCl2 differed significantly when crystalline PbSiO3 is used. The volatilization rate increased by a factor of three, and after one hour the weight loss reached 24 wt% independent of the temperature, compared with 12.5 wt% at the highest temperature of 640 °C for amorphous PbSiO3. This behavior shows the positive effect of crystallinity on lead removal as mentioned above. It was determined that PbCl2 volatilization proceeds as a phase-boundary controlled reaction (R3: EA = 116 kJ·mol−1, A = 4.0 × 10⁴ min−1) or as a first order reaction (F1: EA = 117 kJ·mol−1, A = 1.3 × 10⁵ min−1).
The kinetic investigation in the tube reactor was carried out isothermally at temperatures from 600 to 1000 °C (Figure 4). The best fit was achieved in the temperature range between 600 and 900 °C for a second-order reaction (F2), with EA = 101 kJ·mol−1 and A = 4770 min−1. These values differ considerably from those derived from TGA, which might be the result of different sample holders. The coarse surface of the alumina boat used in the tube reactor might have provided crystal nuclei at the glass boundary, which might not have been present at the smooth surface of the Pt-crucibles used for TGA. The presence of additional crystallites might have caused an accelerated crystallization of the amorphous phase.
Figure 3. Weight loss (α) during TGA under isothermal conditions: (a) CRT-Ca(OH)2-PVC; (b) amorphous PbSiO3-CaCl2; (c) crystalline PbSiO3-CaCl2.
Recycling 01 00111 g003
Figure 4. Isothermal lead volatilization from CRT glass mixed with Ca(OH)2 and PVC: experimental (symbols) and calculated (lines).
Recycling 01 00111 g004

4. Conclusions

The lead volatilization from CRT glass in the presence of PVC and Ca(OH)2 was investigated using TGA and a tube reactor. The reaction proceeded in 7 steps: PVC dehydrochlorination/HCl absorption, CO2 absorption, Ca(OH)2 dehydration, PbCl2 volatilization, CaCO3 decarbonation, and CaCl2 volatilization. About 68% of the chloride was absorbed by Ca(OH)2 and CaO, providing the chloride required for the volatilization of PbCl2. It can be assumed that lead and PVC were completely volatilized. However, a large amount of CaCl2 was also evaporated.
Volatilization of PbCl2 from amorphous and crystalline PbSiO4 showed strong differences in their kinetics. Volatilization of lead from crystalline PbSiO4 was enhanced, resulting in a reduced activation energy. The activation energy observed from the volatilization of PbCl2 in the tube reactor was found to be even lower, suggesting crystallization of the glass during the process. The PbCl2 volatilization from CRT glass strongly resembled that from amorphous PbSiO4, which might have been caused by the choice of sample vessel.
The results show that PbCl2 volatilization from crystalline samples occurs faster than from amorphous samples. Furthermore, higher volatilization ratios are achieved from crystalline material compared with amorphous material. Consequently, it might be advantageous to crystallize CRT glass immediately before or during treatment in order to obtain the highest amount of PbCl2 volatilization in the shortest time.

Supplementary Materials

Table S1 contains the information about the ratio of PbO and SiO2 in the prepared amorphous and crystalline PbSiO3 samples. Figure S1 shows the corresponding XRD. Table S2 lists the reaction models tested in Section 3.3 Kinetic parameters.

Acknowledgments

This research was partially supported by the Japanese Ministry of the Environment, Environment Research and Technology Development Fund, 3K113008, 2013. Furthermore, it was partly conducted by the Division of Multidisciplinary Research on the Circulation of Waste Resources endowed by the Sendai Environmental Development Co., Ltd, Sendai, Japan.

Author contributions

Guido Grause and Toshiaki Yoshioka conceived and designed the experiments. Kenshi Takahashi performed the experiments. Kenshi Takahashi and Guido Grause analyzed the data. Guido Grause wrote the paper.

Conflicts of Interest

The authors declare no conflict of interest.

References

  1. Pant, D.; Singh, P. Pollution due to hazardous glass waste. Environ. Sci. Pollut. Res. 2014, 21, 2414–2436. [Google Scholar] [CrossRef] [PubMed]
  2. Csavina, J.; Taylor, M.P.; Félix, O.; Rine, K.P.; Eduardo Sáez, A.; Betterton, E.A. Size-resolved dust and aerosol contaminants associated with copper and lead smelting emissions: Implications for emission management and human health. Sci. Total Environ. 2014, 493, 750–756. [Google Scholar] [CrossRef] [PubMed]
  3. Taylor, M.P.; Davies, P.J.; Kristensen, L.J.; Csavina, J.L. Licenced to pollute but not to poison: The ineffectiveness of regulatory authorities at protecting public health from atmospheric arsenic, lead and other contaminants resulting from mining and smelting operations. Aeolian Res. 2014, 14, 35–52. [Google Scholar] [CrossRef]
  4. Chen, M.; Zhang, F.-S.; Zhu, J. Lead recovery and the feasibility of foam glass production from funnel glass of dismantled cathode ray tube through pyrovacuum process. J. Hazard. Mater. 2009, 161, 1109–1113. [Google Scholar] [CrossRef] [PubMed]
  5. Okada, T.; Inano, H.; Hiroyoshi, N. Recovery and immobilization of lead in cathode ray tube funnel glass by a combination of reductive and oxidative melting processes. J. Soc. Inf. Disp. 2012, 20, 508–516. [Google Scholar] [CrossRef]
  6. Yuan, W.; Li, J.; Zhang, Q.; Saito, F. Innovated application of mechanical activation to separate lead from scrap cathode ray tube funnel glass. Environ. Sci. Technol. 2012, 46, 4109–4114. [Google Scholar] [CrossRef] [PubMed]
  7. Erzat, A.; Zhang, F.-S. Evaluation of lead recovery efficiency from waste CRT funnel glass by chlorinating volatilization process. Environ. Technol. 2014, 35, 2774–2780. [Google Scholar] [CrossRef] [PubMed]
  8. Grause, G.; Yamamoto, N.; Kameda, T.; Yoshioka, T. Removal of lead from cathode ray tube funnel glass by chloride volatilization. Int. J. Environ. Sci. Technol. 2014, 11, 959–966. [Google Scholar] [CrossRef]
  9. Grause, G.; Takahashi, K.; Kameda, T.; Yoshioka, T. Lead removal from cathode ray tube glass by the action of calcium hydroxide and poly(vinyl chloride). Thermochim. Acta 2014, 596, 49–55. [Google Scholar] [CrossRef]
  10. Liu, J.; Fu, J.; Ning, X.A.; Sun, S.; Wang, Y.; Xie, W.; Huang, S.; Zhong, S. An experimental and thermodynamic equilibrium investigation of the Pb, Zn, Cr, Cu, Mn and Ni partitioning during sewage sludge incineration. J. Environ.Sci. 2015, 35, 43–54. [Google Scholar] [CrossRef] [PubMed]
  11. Osada, S.; Kuchar, D.; Matsuda, H. Effect of chlorine on volatilization of Na, K, Pb, and Zn compounds from municipal solid waste during gasification and melting in a shaft-type furnace. J. Mater. Cycles Waste Manag. 2009, 11, 367–375. [Google Scholar] [CrossRef]
  12. Yu, J.; Sun, L.; Wang, B.; Qiao, Y.; Xiang, J.; Hu, S.; Yao, H. Study on the behavior of heavy metals during thermal treatment of municipal solid waste (MSW) components. Environ. Sci. Pollut. Res. 2015, 23, 253–265. [Google Scholar] [CrossRef] [PubMed]
  13. Chen, C.N.; Yang, W.F. Metal volatility during plastic combustion. J. Environ. Sci. Health A 1998, 33, 783–799. [Google Scholar] [CrossRef]
  14. Rio, S.; Verwilghen, C.; Ramaroson, J.; Nzihou, A.; Sharrock, P. Heavy metal vaporization and abatement during thermal treatment of modified wastes. J. Hazard. Mater. 2007, 148, 521–528. [Google Scholar] [CrossRef] [PubMed]
  15. Ho, T.C.; Lee, H.T.; Shiao, C.C.; Hopper, J.R.; Bostick, W.D. Metal behavior during fluidized bed thermal treatment of soil. Waste Manag. 1995, 15, 325–334. [Google Scholar] [CrossRef]
  16. Nowak, B.; Aschenbrenner, P.; Winter, F. Heavy metal removal from sewage sludge ash and municipal solid waste fly ash—A comparison. Fuel Process. Technol. 2013, 105, 195–201. [Google Scholar] [CrossRef]
  17. Chan, C.C.Y.; Kirk, D.W. Behaviour of metals under the conditions of roasting MSW incinerator fly ash with chlorinating agents. J. Hazard. Mater. 1999, 64, 75–89. [Google Scholar] [CrossRef]
  18. Jakob, A.; Stucki, S.; Struis, R.P.W.J. Complete heavy metal removal from fly ash by heat treatment: Influence of chlorides on evaporation rates. Environ. Sci. Technol. 1996, 30, 3275–3283. [Google Scholar] [CrossRef]
  19. Matsuno, M.; Tomoda, K.; Nakamura, T. Volatilization mechanism of Pb from fly ash in municipal waste incinerator. Mater. Trans. 2003, 44, 2481–2488. [Google Scholar] [CrossRef]
  20. Okada, T.; Tomikawa, H. Effects of chemical composition of fly ash on efficiency of metal separation in ash-melting of municipal solid waste. Waste Manag. 2013, 33, 605–614. [Google Scholar] [CrossRef] [PubMed]
  21. Wu, S.; Xu, Y.; Sun, J.; Cao, Z.; Zhou, J.; Pan, Y.; Qian, G. Inhibiting evaporation of heavy metal by controlling its chemical speciation in MSWI fly ash. Fuel 2015, 158, 764–769. [Google Scholar] [CrossRef]
  22. Luengos, M.A.; Ambrosio, E.; Bohé, A.E.; Pasquevich, D.M. Thermal behavior of galena ore in chlorine atmospheres. J. Therm. Anal. Calorim. 2000, 59, 775–789. [Google Scholar] [CrossRef]
  23. Lee, G.-S.; Song, Y.J. Recycling eaf dust by heat treatment with PVC. Miner. Eng. 2007, 20, 739–746. [Google Scholar] [CrossRef]
  24. Yoo, J.-M.; Kim, B.-S.; Lee, J.; Kim, M.-S.; Nam, C.-W. Kinetics of the volatilization removal of lead in electric arc furnace dust. Mater. Trans. 2005, 46, 323–328. [Google Scholar] [CrossRef]
  25. Cong, J.; Yan, D.; Li, L.; Cui, J.; Jiang, X.; Yu, H.; Wang, Q. Volatilization of heavy metals (As, Pb, Cd) during co-processing in cement kilns. Environ. Eng. Sci. 2015, 32, 425–435. [Google Scholar] [CrossRef]
  26. Wu, Z.F.; Su, Y.Y.; Zhao, Y.Q. Transfer characteristics of heavy metal Pb in municipal solid waste incineration. Adv. Mater. Res. 2014, 864–867, 2001–2006. [Google Scholar] [CrossRef]
  27. Yu, J.; Sun, L.; Xiang, J.; Hu, S.; Su, S. Kinetic vaporization of heavy metals during fluidized bed thermal treatment of municipal solid waste. Waste Manag. 2013, 33, 340–346. [Google Scholar] [CrossRef] [PubMed]
  28. Wang, X.-T.; Xu, B.; Zhao, D.-N.; Jin, B.-S. Experimental analysis of heavy metals behavior during melting process of fly ashes from MSWI under different atmospheres. In Proceedings of the 2010 4th International Conference on Bioinformatics and Biomedical Engineering (iCBBE), Chengdu, China, 18–20 June 2010.
  29. Fraissler, G.; Jöller, M.; Brunner, T.; Obernberger, I. Influence of dry and humid gaseous atmosphere on the thermal decomposition of calcium chloride and its impact on the remove of heavy metals by chlorination. Chem. Eng. Process. Process Intensif. 2009, 48, 380–388. [Google Scholar] [CrossRef]
  30. Yu, J.; Sun, L.; Xiang, J.; Hu, S.; Su, S.; Qiu, J. Vaporization of heavy metals during thermal treatment of model solid waste in a fluidized bed incinerator. Chemosphere 2012, 86, 1122–1126. [Google Scholar] [CrossRef] [PubMed]
  31. Haiying, Z.; Youcai, Z.; Jingyu, Q. Thermal characterization of fly ash from one municipal solid waste incinerator (MSWI) in Shanghai. Process Saf. Environ. Protect. 2010, 88, 269–275. [Google Scholar] [CrossRef]
  32. Wang, S.-J.; Zhang, H.; Shao, L.-M.; Liu, S.-M.; He, P.-J. Thermochemical reaction mechanism of lead oxide with poly(vinyl chloride) in waste thermal treatment. Chemosphere 2014, 117, 353–359. [Google Scholar] [CrossRef] [PubMed]
  33. Falcoz, Q.; Gauthier, D.; Abanades, S.; Flamant, G.; Patisson, F. Kinetic rate laws of Cd, Pb, and Zn vaporization during municipal solid waste incineration. Environ. Sci. Technol. 2009, 43, 2184–2189. [Google Scholar] [CrossRef] [PubMed]
  34. Bessada, C.; Massiot, D.; Coutures, J.; Douy, A.; Coutures, J.P.; Taulelle, F. 29Si MAS-NMR in lead silicates. J. Non-Cryst. Solids 1994, 168, 76–85. [Google Scholar] [CrossRef]
  35. Grause, G.; Ishibashi, J.; Kameda, T.; Bhaskar, T.; Yoshioka, T. Kinetic studies of the decomposition of flame retardant containing high-impact polystyrene. Polym. Degrad. Stab. 2010, 95, 1129–1137. [Google Scholar] [CrossRef]
  36. Aracil, I.; Font, R.; Conesa, J.A. Thermo-oxidative decomposition of polyvinyl chloride. J. Anal. Appl. Pyrolysis 2005, 74, 215–223. [Google Scholar] [CrossRef]

