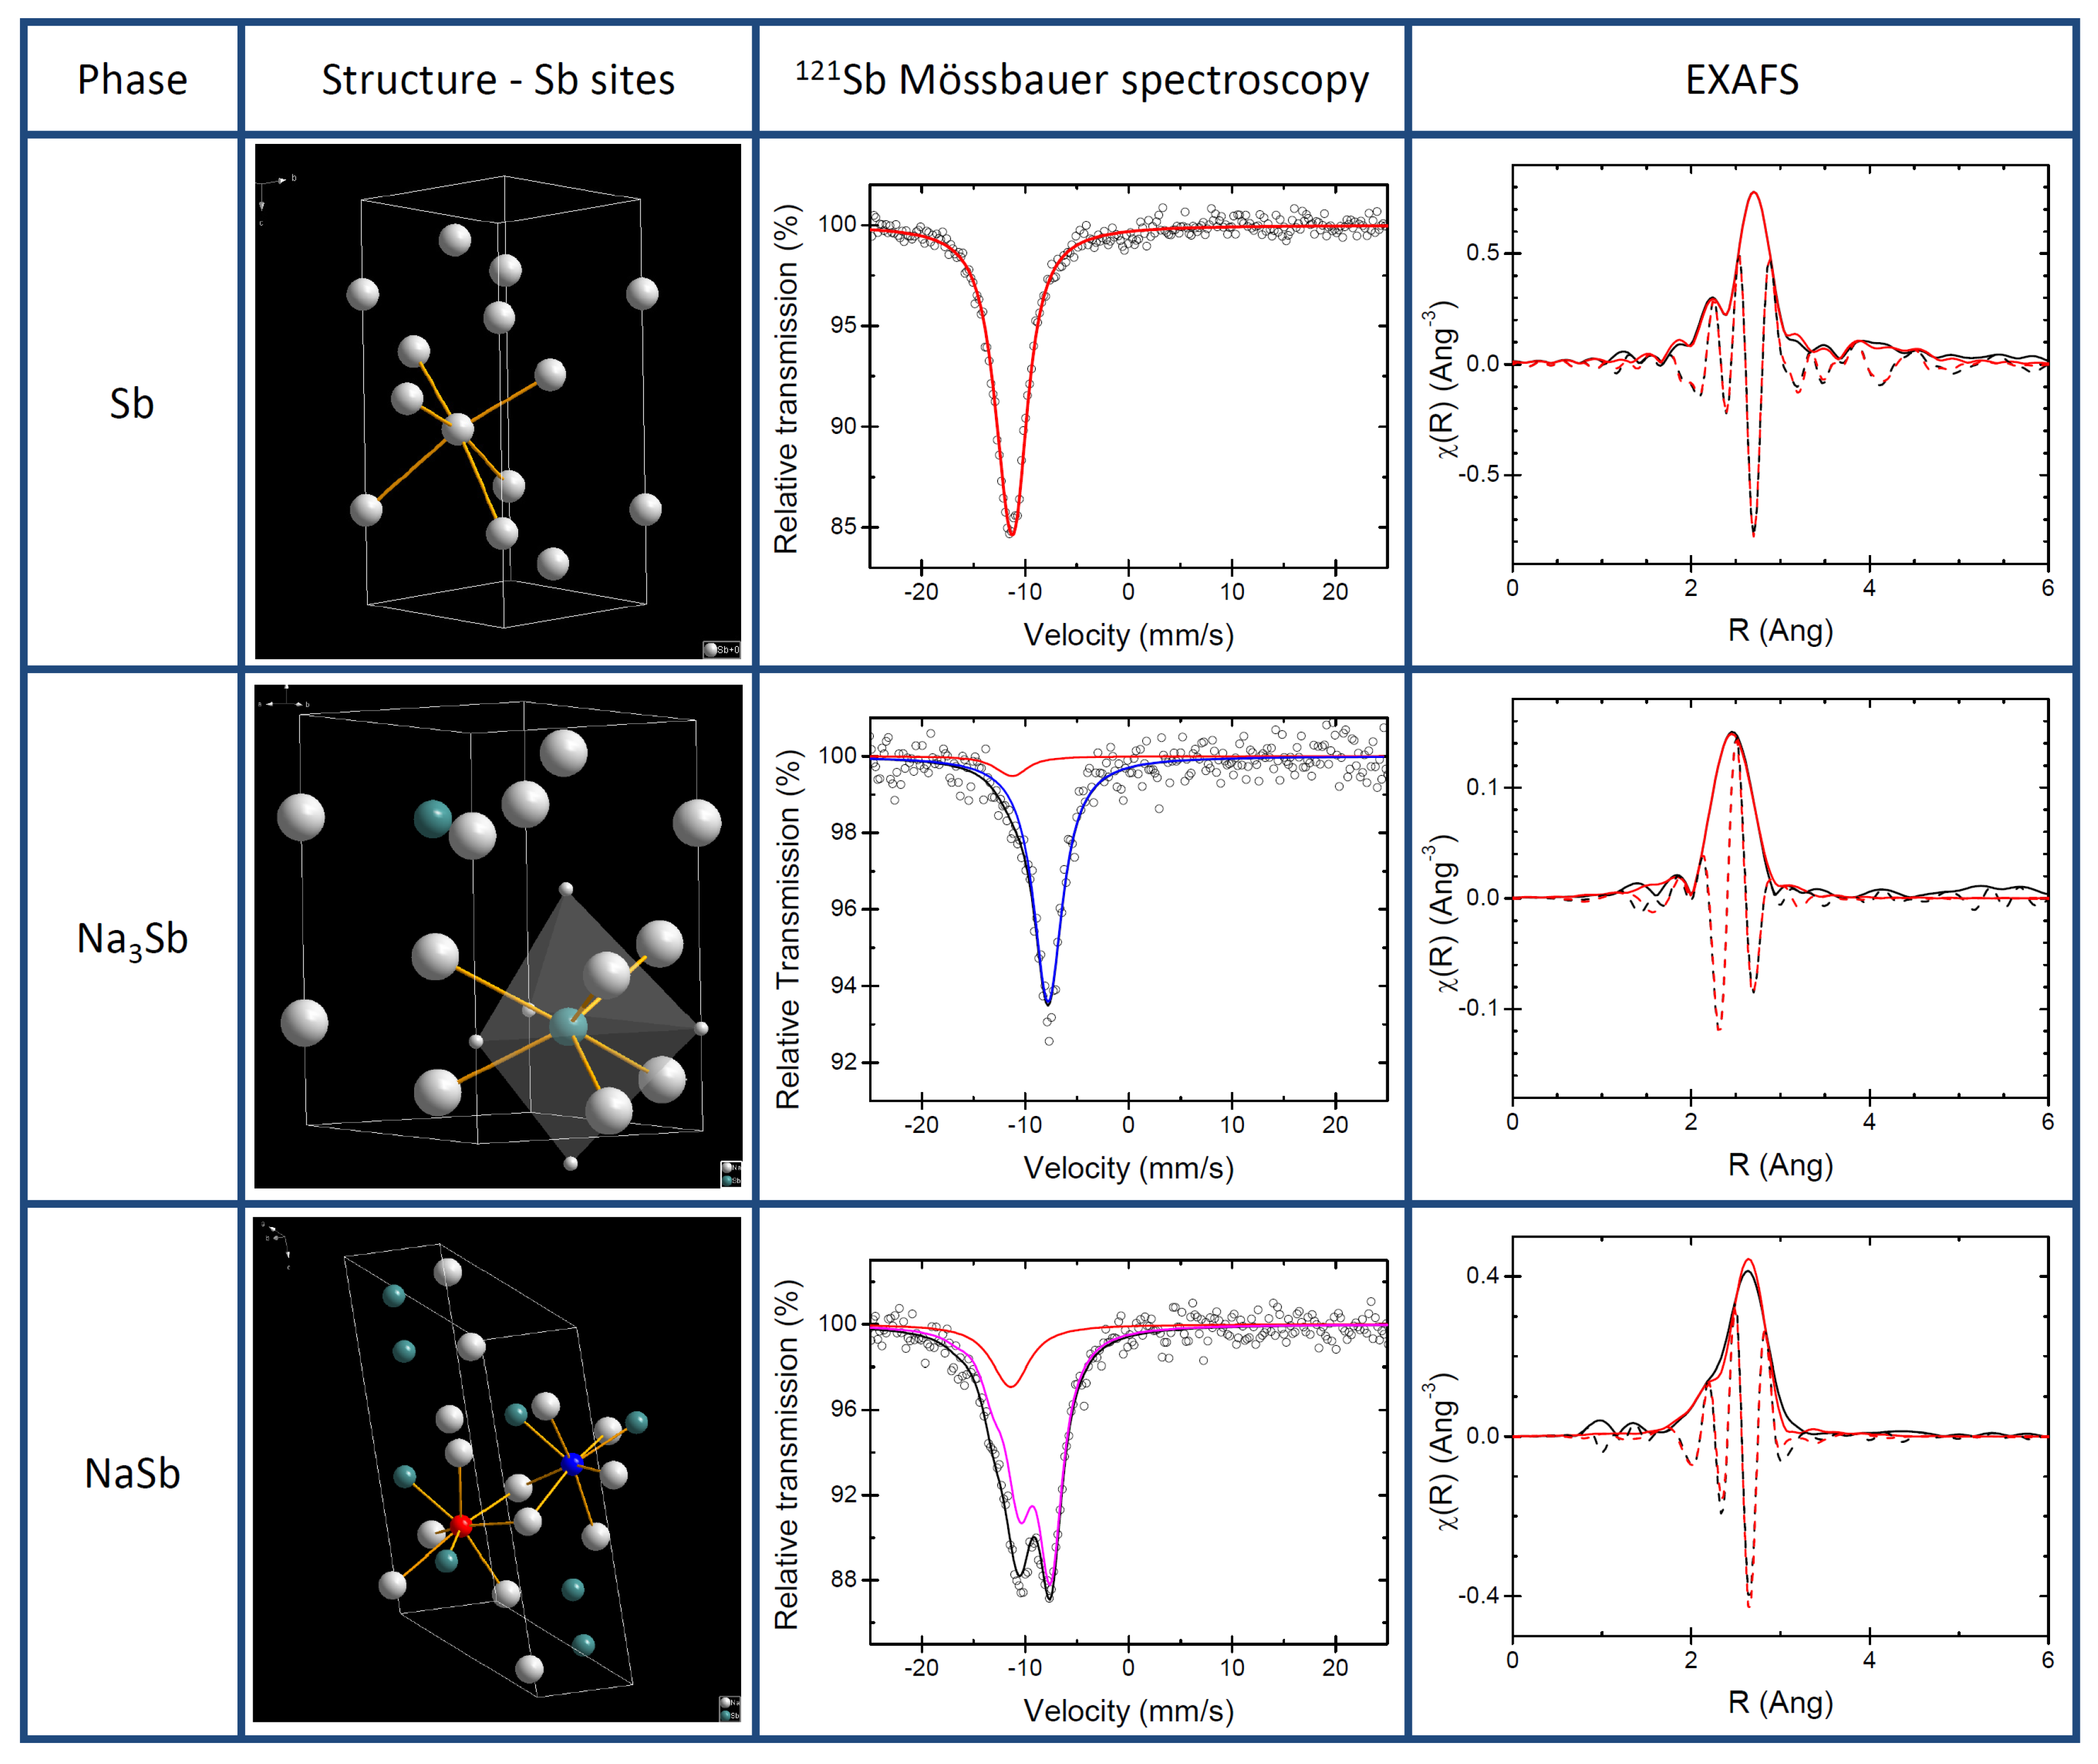
3.1. Pure Sb and Na-Sb Intermetallics
The structures of pure antimony and of the two known Na-Sb intermetallics (i.e., NaSb and hexagonal Na
Sb) are shown in
Figure 1 together with their respective experimental XAS and
Sb Mössbauer spectroscopy signatures. The XRD patterns (see
Supplementary Materials) were successfully refined in the expected
(cell parameters
a=
b=5.35(6) Å, and
c=9.49(2) Å) and
(cell parameters
a=6.78(7) Å,
b=6.33(6) Å,
c=12.47(2) Å and
=117.51(4)
) space groups for Na
Sb and NaSb, respectively, in very good agreement with the structures reported in the Na-Sb phase diagram and with previous reported theoretical calculations [
6,
10,
27,
28].
The
Sb Mössbauer spectrum of Sb collected at 78 K was fitted using a quadrupole split component, which provided an isomer shift of −11.42(3) mm s
and a small quadrupole splitting of 4.3(8) mm s
, (see
Table 1) in agreement with published data and with the slightly distorted octahedral Sb site in Sb metal [
24].
The best fit of the spectrum of Na
Sb gives an isomer shift of −7.74(4) mm s
and no quadrupole splitting, in good agreement with calculated IS (
) of −7.39 mm s
and weak QS (
) of −1.23 mm s
(see
Table 2). These results are in line with the high symmetry of the Sb site in the refined structure of Na
Sb. In this structure, in fact, the Sb atom is at the centre of two interpenetrating Na polyhedra, a five-fold trigonal bipyramid and six-fold prism (cf.
Figure 1). A small amount of Sb metal impurity (about 10% of the total resonance area) is also detected by
Sb Mössbauer spectroscopy. In contrast to Sb and Na
Sb, the structure of NaSb contains two distinct Sb sites. These sites, however, are quite similar: in both of them the Sb atom is at the centre of a distorted polyhedron of 2 Sb and 5 Na atoms. Such complex coordination produces a rather large splitting, which is visible in the Mössbauer spectrum (cf.
Figure 1). The fitting provides a QS of −17.5(4) mm s
, as well as an IS of −9.24(6) mm s
. Also in this case, the Mössbauer spectrum cannot be fitted without including minor amounts of Sb metal, about 15% of the total resonance area. Such minor amounts of Sb metal are actually not detected in the XRD patterns of both intermetallics, indicating that this unreacted Sb is most probably amorphous. This small amount of Sb had only a minor impact on hyperfine parameters as the calculated hyperfine parameters of pure NaSb enabled us to calculate two akin values of IS −8.99 and −9.36 mm s
and QS of 17.7 and 17.6 mm s
in line of the experimental result and thus confirming the similarity of the two Sb sites. In short, the two sites of NaSb are so similar that they cannot be discriminated by
Sb Mössbauer spectroscopy, and the use of a single quadrupole split component with an average isomer shift is largely sufficient to fit its experimental spectrum.
It should be noticed that the robustness of regression procedure regarding the use of several compounds with different Sb environment and oxidation states as well as the fairly good correlation coefficient of 0.98 obtained for the isomer shift and 0.84 for the quadrupole splitting comfort the reliability of the theoretical results. Moreover, the calculated
Sb quadrupole moment of −67.4 fm
agrees well with the previously published value of −66.9 fm
, which further corroborates the excellent agreement of experimental data and theoretical calculations [
25] Therefore, and contrarily to previous published results on
Fe, the B3LYP functional leads to a fairly good correlation even for quadrupole splitting and as good as the classical GGA functional. To the best of our knowledge, this is the first use of hybrid functionals for the extraction of the hyperfine parameters of
Sb.
In a recent paper by Baggetto et al., two peaks occurring at about −11.2 and −8.0 mm s
in a spectrum of partially sodiated Sb were attributed to the two Sb lattice sites in the crystal structure of NaSb [
8]. On the basis of our findings, however, it is now clear that this interpretation is not correct, and that the two peaks are rather due to a quadrupole split component created by the largely asymmetric coordination of the Sb centres. Taking into account the intrinsic resolution of
Sb Mössbauer spectroscopy and the results of the ab initio Mössbauer simulations, it is clear that the high similarity of the coordination environment of the two Sb lattice sites in NaSb makes them virtually indistinguishable in the spectrum.
The EXAFS spectrum of pure antimony can be easily and almost perfectly fitted starting from the well-known structure of Sb metal, using the first 4 Sb-Sb nearest neighbour shells around the Sb centre (cf.
Table 3 ). In this case, relatively low Debye-Waller factors are observed for all shells after the first one. The value of S
obtained from this fit was used for the fitting of the two Na-Sb intermetallics. The first four nearest neighbour shells were used also in the fitting of NaSb, namely one Sb-Sb shell and three Sb-Na shells. Also in this case, an almost perfect fit is obtained with very high Debye-Waller factors for the three Na-Sb shells. It must be noticed that the small amount of amorphous Sb detected in the
Sb Mössbauer spectrum of NaSb could not be observed in the EXAFS data. This is likely due to both its low amount and to the very similar Sb-Sb bond length expected for the first coordination shell in both Sb metal and NaSb (cf.
Table 3).
Conversely, the EXAFS spectrum of NaSb cannot be fitted by using simply Na-Sb nearest neighbours. In this case, the addition of a noticeable fraction of Sb (slightly less than 20% of the spectrum) is necessary, the Sb-Sb contribution totally dominating in intensity the EXAFS spectrum at high values of k. In addition to this Sb-Sb contribution, the remainder of the spectrum is fitted rather satisfactorily using the first three Sb-Na shells (11 nearest neighbours) typical of the mixed trigonal bipyramidal-prismatic coordination sphere of the Sb centre. The third shell, corresponding to the prismatic coordination, has however a very large Debye-Waller factor, in line with a relatively low-ordered structure.
3.2. The Electrochemical Reaction of Sb with Na: Spectroscopic Results
In our previous work [
5],
operando XRD depicted that the reaction of Na with Sb is accompanied by a general amorphisation, and that the formation of Na
Sb becomes evident only at the end of the sodiation process. Furthermore, it was shown that two different Na
Sb polymorphs grow out of the amorphous intermediate which is dominant in the middle of the process, the hexagonal form being commonly obtained from the reaction of the two metals, and a cubic phase known to be stable only at high pressures [
29].
The following desodiation of Na
Sb, on the other hand, produces a totally amorphous phase, XRD becoming totally useless for its identification. This desodiated species can be sodiated again, leading to the gradual reformation of crystallised hexagonal as well as cubic Na
Sb. It is important to stress that such relatively simple mechanism from the point of view of XRD (one phase disappearing) is characterized by a relatively complicate electrochemical signature: if one looks at its derivative signal, one expects a relatively complex process with at least three intermediate steps [
5]. Given the relatively limited information obtained by XRD due to the general amorphisation of the system, additional local-range techniques, i.e.,
operando XAS and ex situ
Sb Mössbauer spectroscopy, were employed to better understand the sodiation/desodiation mechanism. Unfortunately,
Sb Mössbauer spectroscopy cannot be applied in the
operando configuration due to the relatively high energy of the
-ray transition of
Sb, which produces very low Lamb-Mössbauer factors at room temperature for the Sb nuclei in the Sb-containing phases.
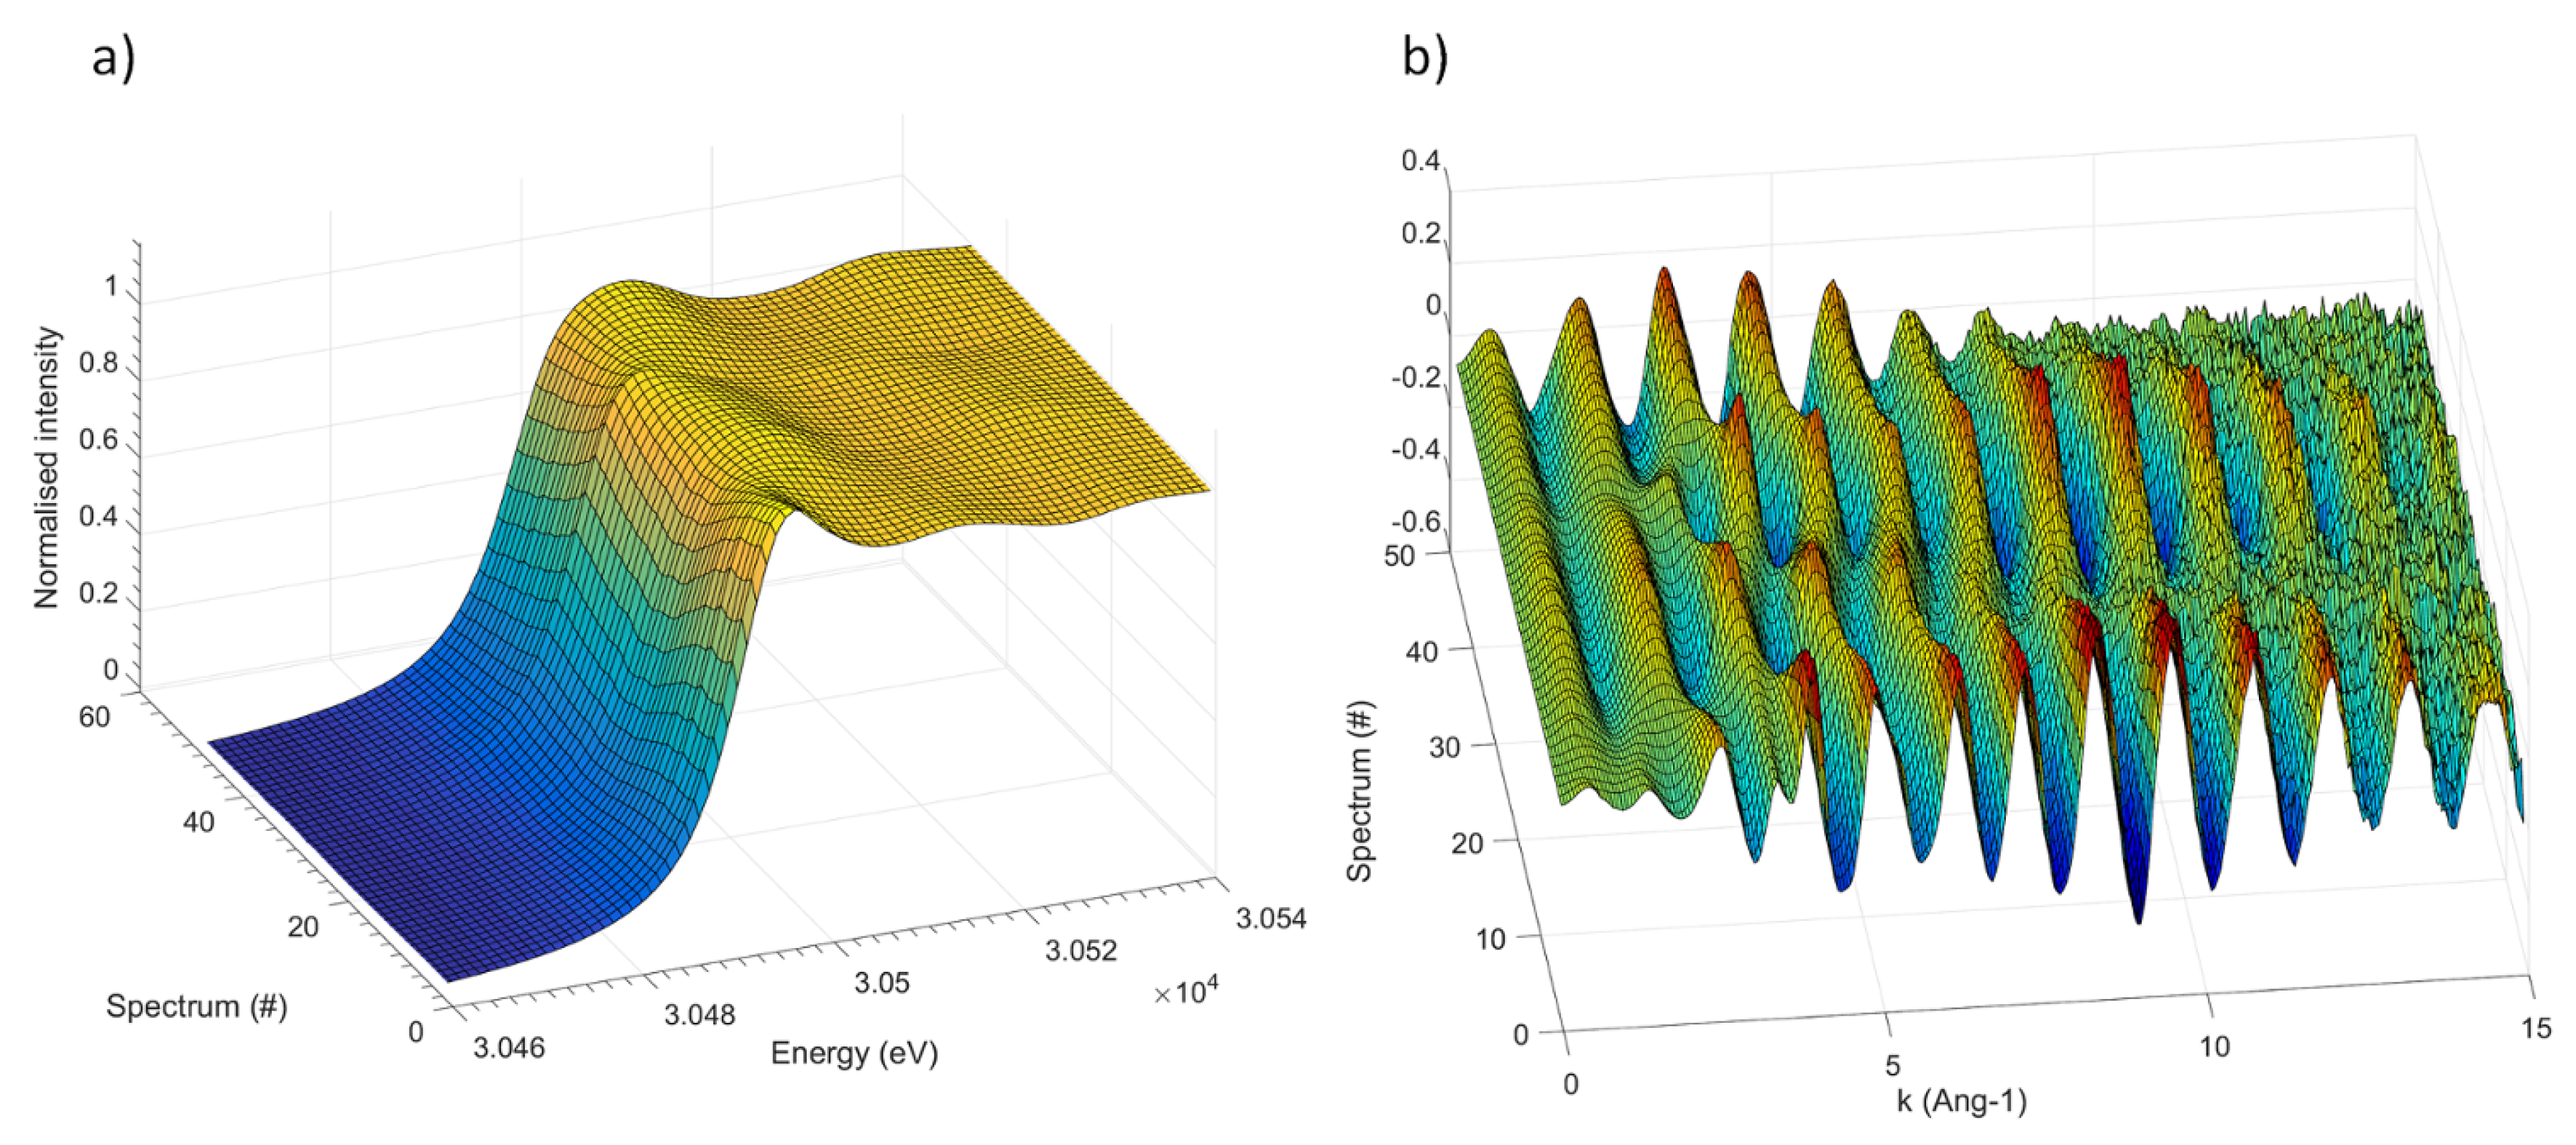
The
operando Sb K-edge XAS spectra (XANES and EXAFS portions) collected during the first three electrochemical processes (sodiation/desodiation/sodiation) are shown in
Figure 2 (see
Supplementary Materials for the corresponding electrochemical cycling curve.) Even though the absorption edge shifts noticeably during the different electrochemical processes, its features are rather broad and badly defined, and its overall shape varies only slightly. This result is somehow expected, since the very high energy of the absorption K-edge of Sb is connected to a very short lifetime of the core hole, resulting in a low energy resolution of the absorption edge. Consequently, the XANES part (shown in
Figure 2a) of the spectrum bears only negligible small information and is hence of little use for the identification of the different species formed during the electrochemical process.
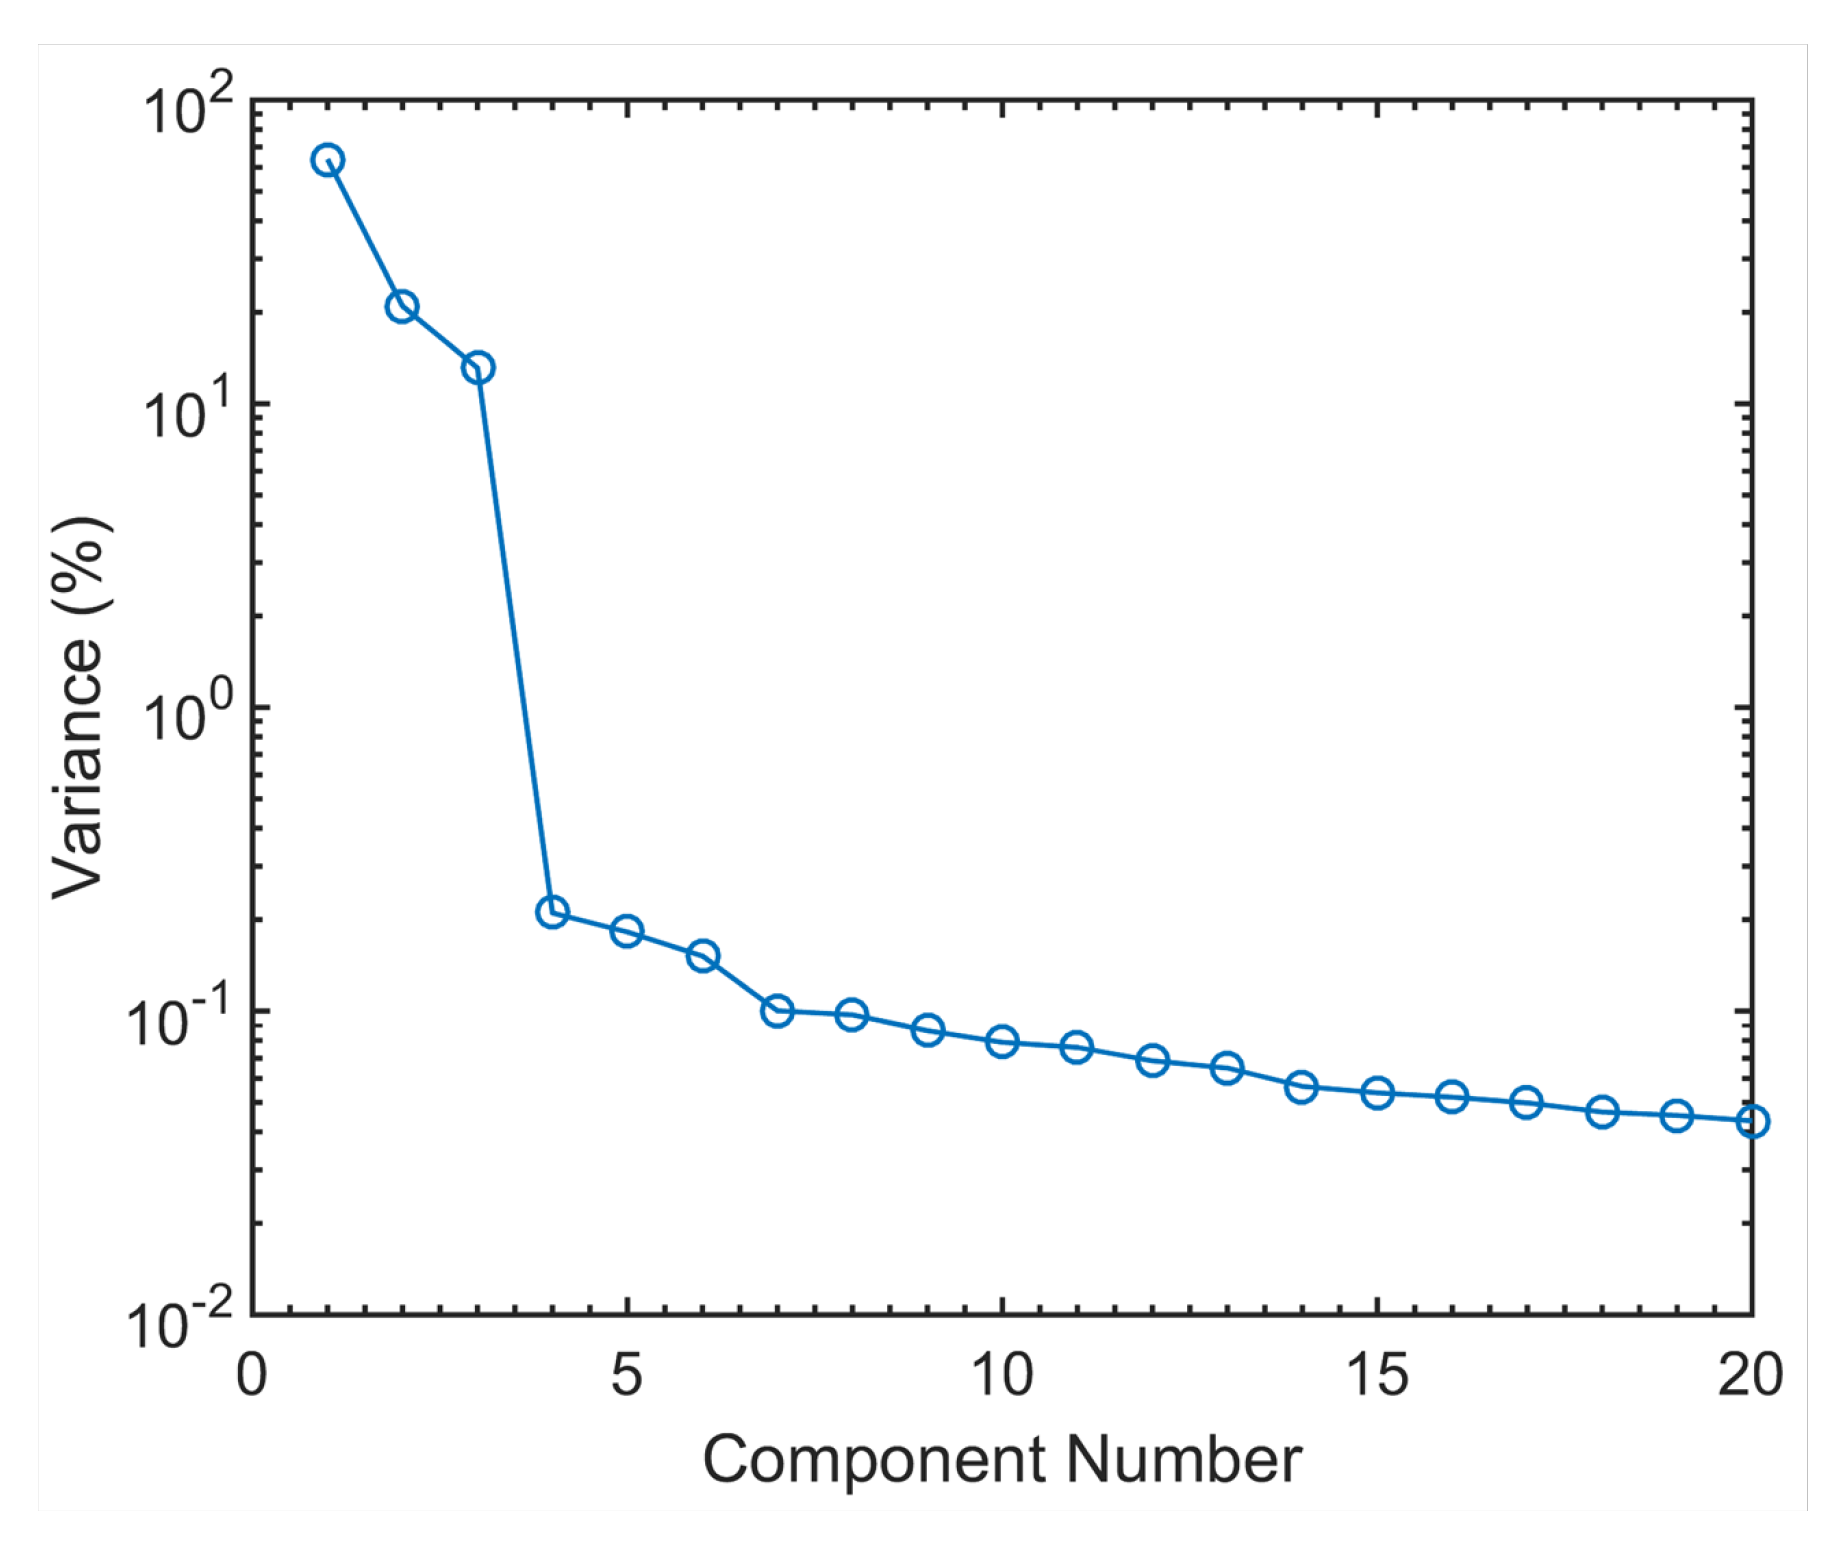
On the other hand, the oscillation of the EXAFS part are rather intense and visible up to
Å
, and can thus be used to describe the average coordination around the Sb centres. In order to avoid an over-interpretation of the experimental data, and to extract the maximum amount of useful information contained in the
operando spectra, a principal component analysis (PCA) was performed on the whole set of the EXAFS data. Since the XANES part is varying very little during the process, the differences between the principal components are concentrated in the EXAFS region. The variance plot obtained (
Figure 3) shows rather clearly that about 98% of the variance of the EXAFS spectra can be described by three principal components, the residual part can be attributed to the experimental noise. A visualisation of the shape of the principal components and of the respective scores (see details in the
Supplementary Materials) support this hypothesis, with both shape and evolution of the first three components varying gradually through the different processes, and those of the following ones changing in a totally hectic way.
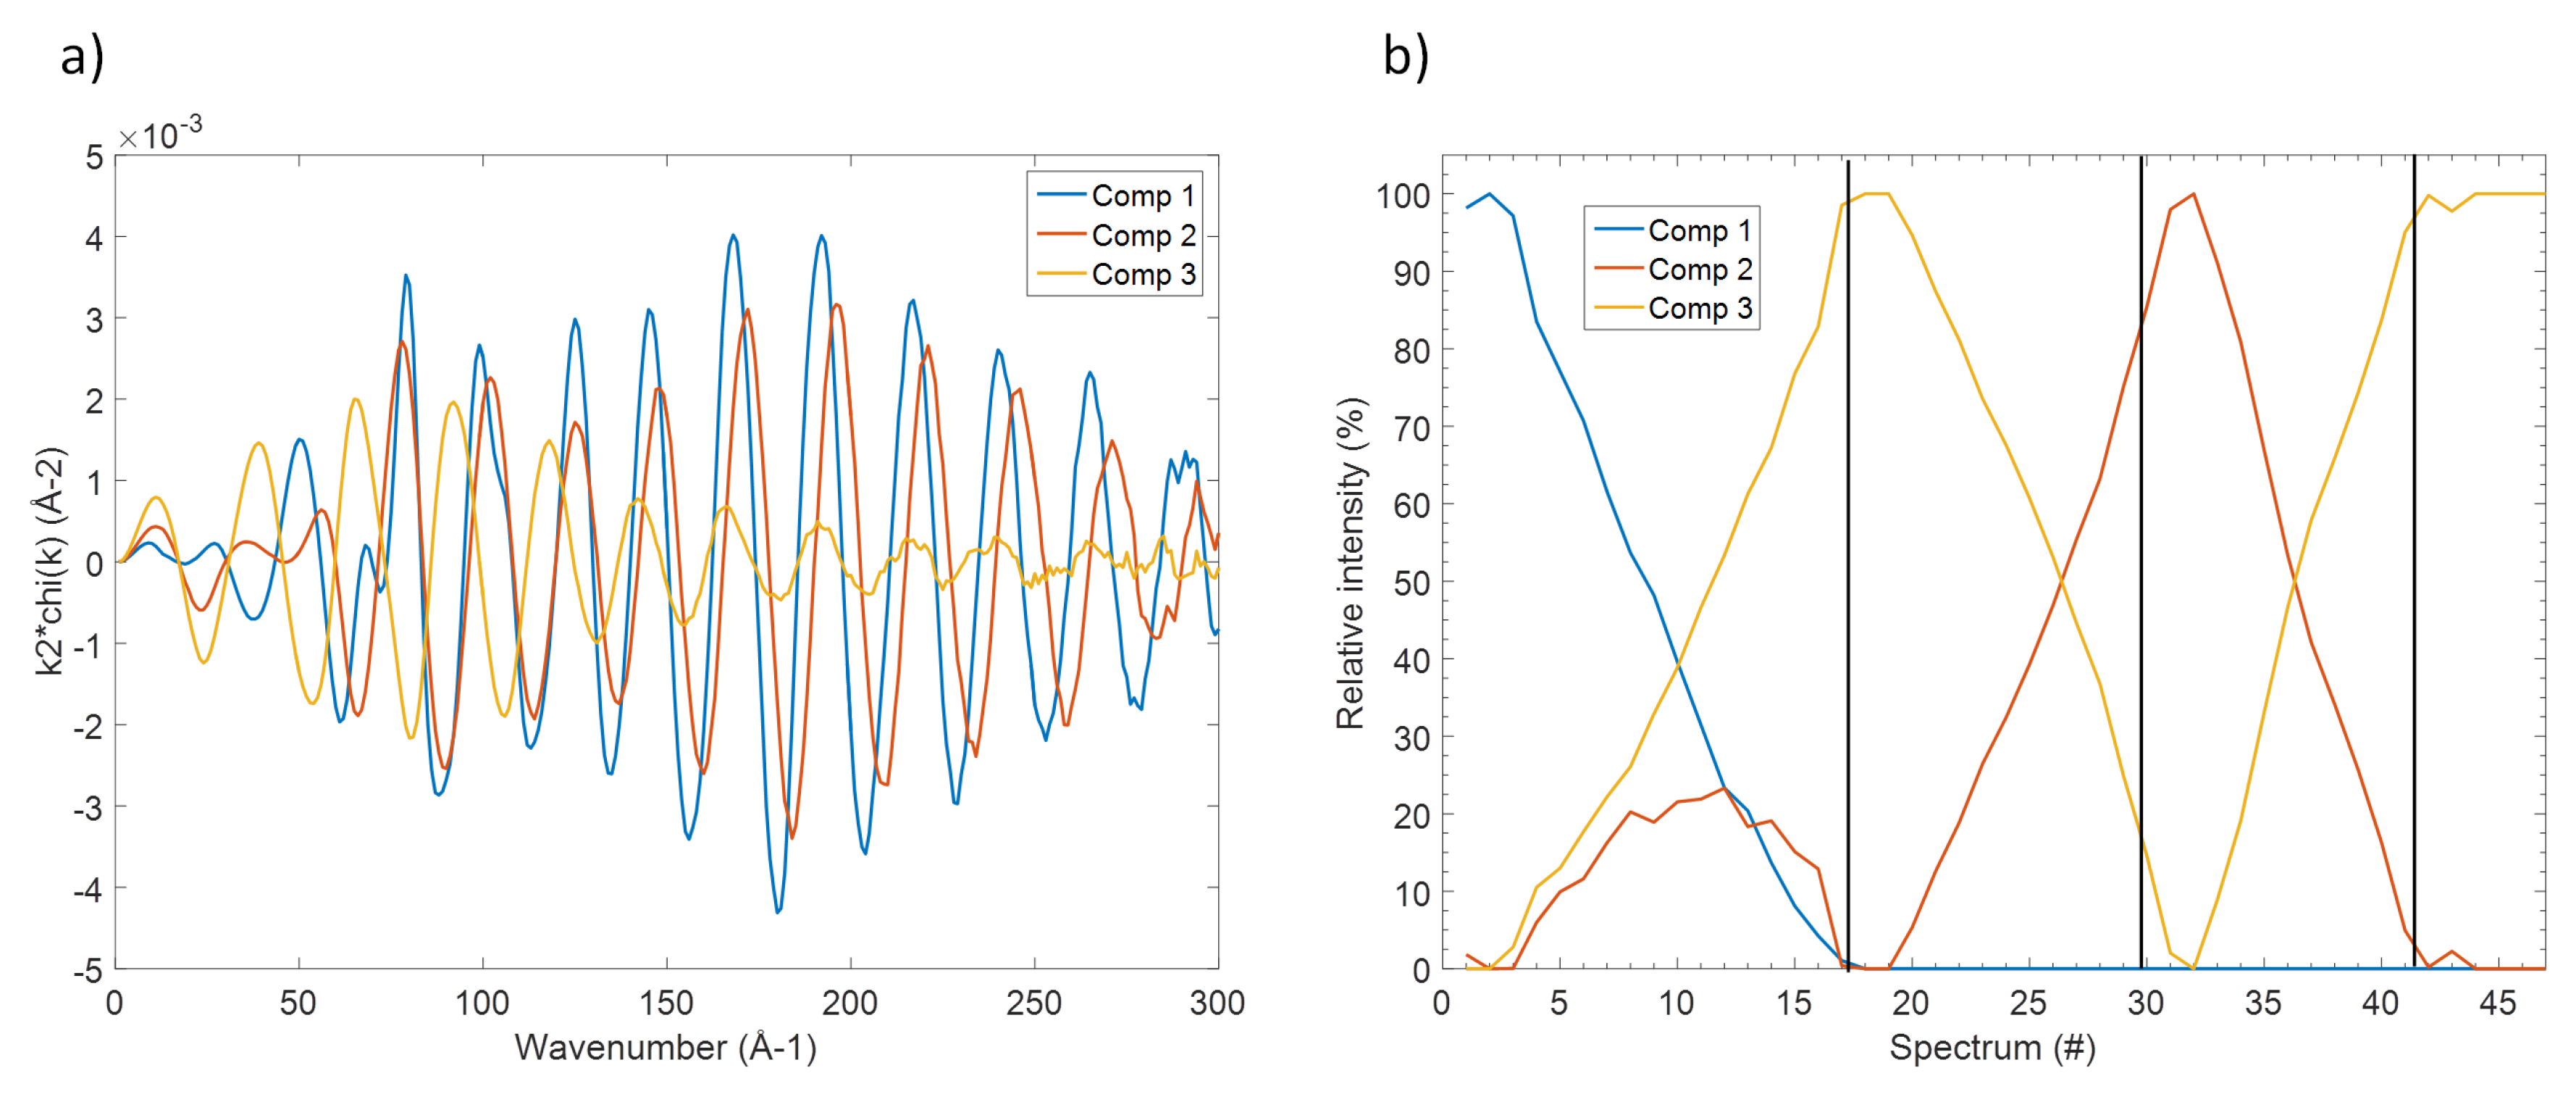
Even though the so-obtained principal components are only orthogonal mathematical functions and not real EXAFS spectra, their determination reveals the number of independent spectral components that can be used to fit the whole set of experimental data. Several methodologies are then available to reconstruct the corresponding real EXAFS components as well as their evolution. In this case, the MCR-ALS analysis was used [
18,
19] producing the three EXAFS spectra shown in
Figure 4 together with their evolution along the different electrochemical processes. These components correspond perfectly to specific spectra measured along the in situ measurements, in line with their observed evolution (see also
Supplementary Materials section): component 1, for instance, is practically identical to the spectrum of pristine Sb. On the other hand, component 2 resembles perfectly the spectrum obtained at the end of the charge process, corresponding to the fully desodiated electrode, whereas component 3 is identical to spectrum obtained at the end of the first discharge, i.e., to full sodiation.
These reconstructed spectra were then fitted in the traditional way, starting from the known structures of Sb metal and hexagonal Na
Sb (vide supra). The results of the fit are reported in
Table 4. While the fitting of Component 1 is trivial and identical to that of pristine Sb presented above, Component 2 can be fitted by using solely the first coordination shells of Sb metal, with a significant decrease of the average Sb-Sb distance and of the coordination number but without noticeably varying the Debye-Waller factor. The presence of only one tri-coordinated Sb-Sb shell with a Sb-Sb interatomic distance lower than in Sb metal bears resemblance to the long known structure of the amorphous “explosive antimony”, synthesised by Krebs et al. by electrolysis of antimony chloride [
30] The proposed structural model for this phase is based on a disordered network of antimony, where all antimony atoms are bonded to three other ones with a Sb-Sb distance sensibly lower than in Sb metal. A large range of coordination angles results in the total disappearance of the spectral contributions beyond the first nearest neighbour shell, and hence of the long-range order. It is important to notice that such interpretation is complete agreement with the totally flat X-ray diffraction pattern observed at the end of the charge process. Finally, the fitting of Component 3 can be performed using the first two Sb-Na shells of hexagonal Na
Sb, as well as a minor contribution from a Sb-Sb shell at short distances, probably due to the presence of some residual unreacted Sb metal.
With these spectral information in mind, it is now possible to follow the evolution of these different phases during the different sodiation/desodiation/sodiation processes shown in
Figure 4b. In fact, not only pristine Sb metal is gradually transformed into Na
Sb during the first discharge, but simultaneously some amorphous Sb appears too, in line with the gradual amorphisation of the system during the reaction with Na. Almost pure Na
Sb is obtained at the end of sodiation, and during the following charge, this phase is desodiated leading to amorphous Sb metal. This phase is then reversibly sodiated/desodiated during the following discharge/charge cycles.
However, it is important to notice that, with the exception of the amorphisation of Sb during the first sodiation (which might occur with the insertion of some Na in the Sb lattice), these analyses could not evidence the formation of any intermediate Na-Sb species. This result is somehow in contradiction not only with the work of Baggetto et al. [
9], who suggested the formation of an amorphous form of NaSb as an intermediate phase during the discharge, but also with more recent results that we obtained by
operando PDF and ex situ
Na Solid State NMR analysis [
7]. In that work, two different electrochemically formed intermediates could be identified: (i) amorphous Na
Sb (with
x≈ 0.4–0.5), having a local structure similar to crystalline Na
Sb but with a significant number of sodium vacancies and a limited correlation length, and (ii) amorphous Na
Sb, with a highly amorphous structure featuring some Sb-Sb bonding. Even though the first of these two phases seem to form during the first sodiation, the second one is expected to appear only during the following desodiation. It is important to notice that such phases, even though mostly amorphous, can be identified by PDF in the direct space using the series of peaks from 2 to about 10 Å. Contrary to PDF, in the EXAFS spectra measured during the
operando processes, only the first coordination shells are visible due to the amorphous nature of the samples, with the notable exception of pristine Sb where also the second coordination shell is visible. This limit of EXAFS compared to PDF is inherent to the nature of the probe: scattered electrons and X-rays in EXAFS and PDF, respectively, which have different diffusion path lengths in the materials. Therefore, even though EXAFS is more sensitive to the nature of the neighbouring atoms, and Sb atoms can thus be distinguished from the Na ones in the fits, the analysis remains restricted to the neighbours corresponding to only the first peak of the PDF signal, and is thus not sufficient to differentiate among the variety of possible amorphous phases.
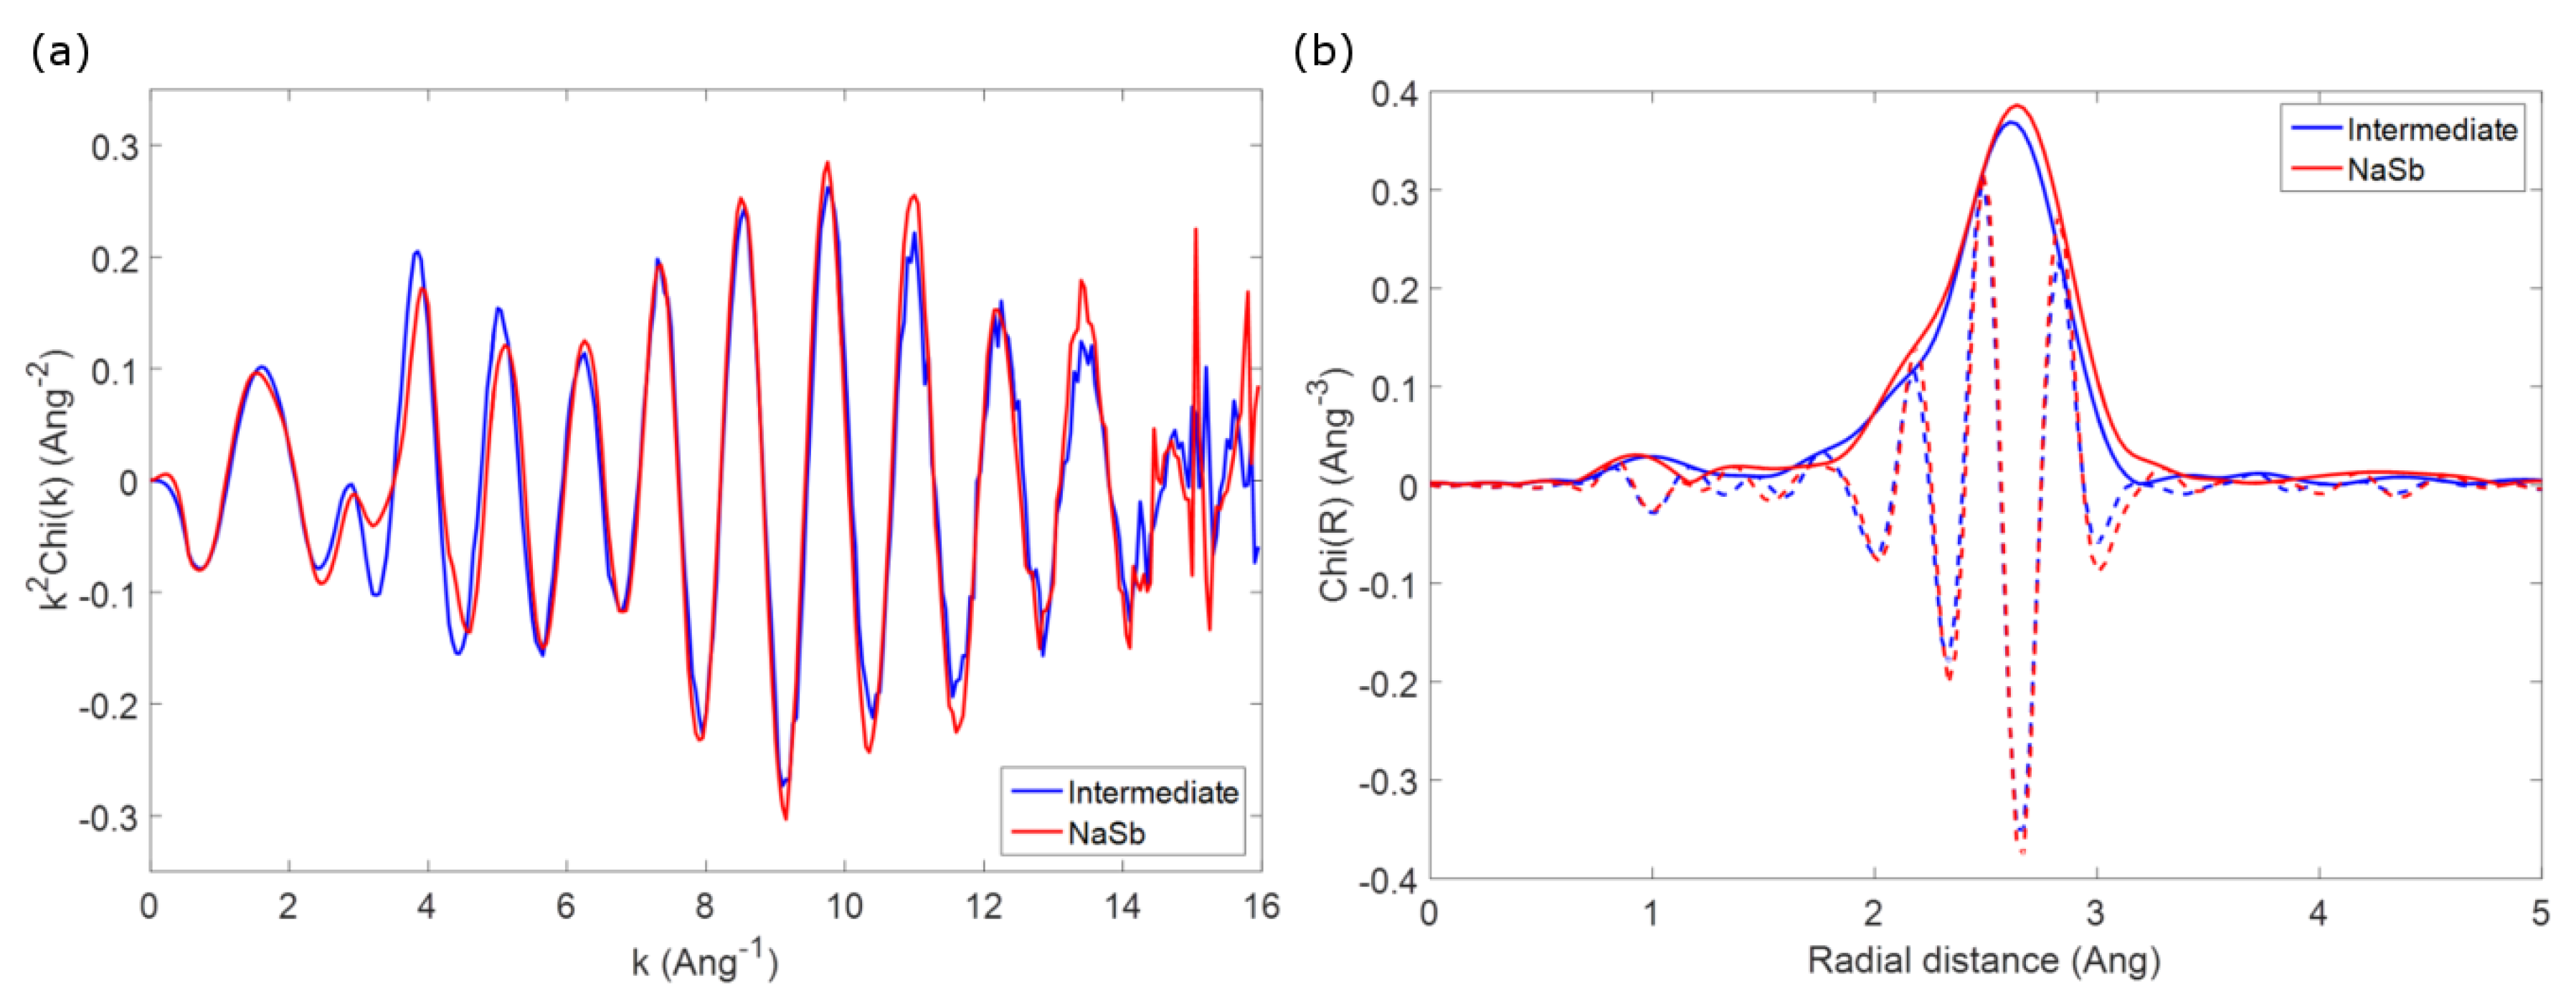
As an example to outline this difficulty in identifying possible intermediate phases, one can compare the first coordination shell of the spectrum of crystalline NaSb (prepared by ball milling as a reference, vide supra) with that observed for spectrum #33 of the
operando spectra series, corresponding to the reaction of about 1 mol Na during second discharge. The two EXAFS spectra, shown in
Figure 5, are almost identical, and this similarity becomes more evident if one looks at the Fourier transform of the two spectra, which are practically identical in both the envelope and the imaginary part of the function. Considering that the
operando spectrum can be obtained by a simple linear combination of the second and the third components issued from the MCR-ALS analysis, corresponding to amorphous antimony and Na
Sb, respectively, it is clear that the possible formation of NaSb is impossible to spot in the whole series of spectra. The similarity of the two spectra is on the other hand not surprising, since the first Sb-Na and Sb-Sb coordination shells in Na
Sb and amorphous Sb have similar bond distances to those in the structure of NaSb, and an appropriate ratio of the two phases would correspond to the expected ratio in NaSb. Since similar conclusion can be drawn for the other possible expected intermediates, it is clear that no conclusive information about the possible formation of intermediates during the electrochemical reaction of Sb with Na can be obtained by EXAFS.
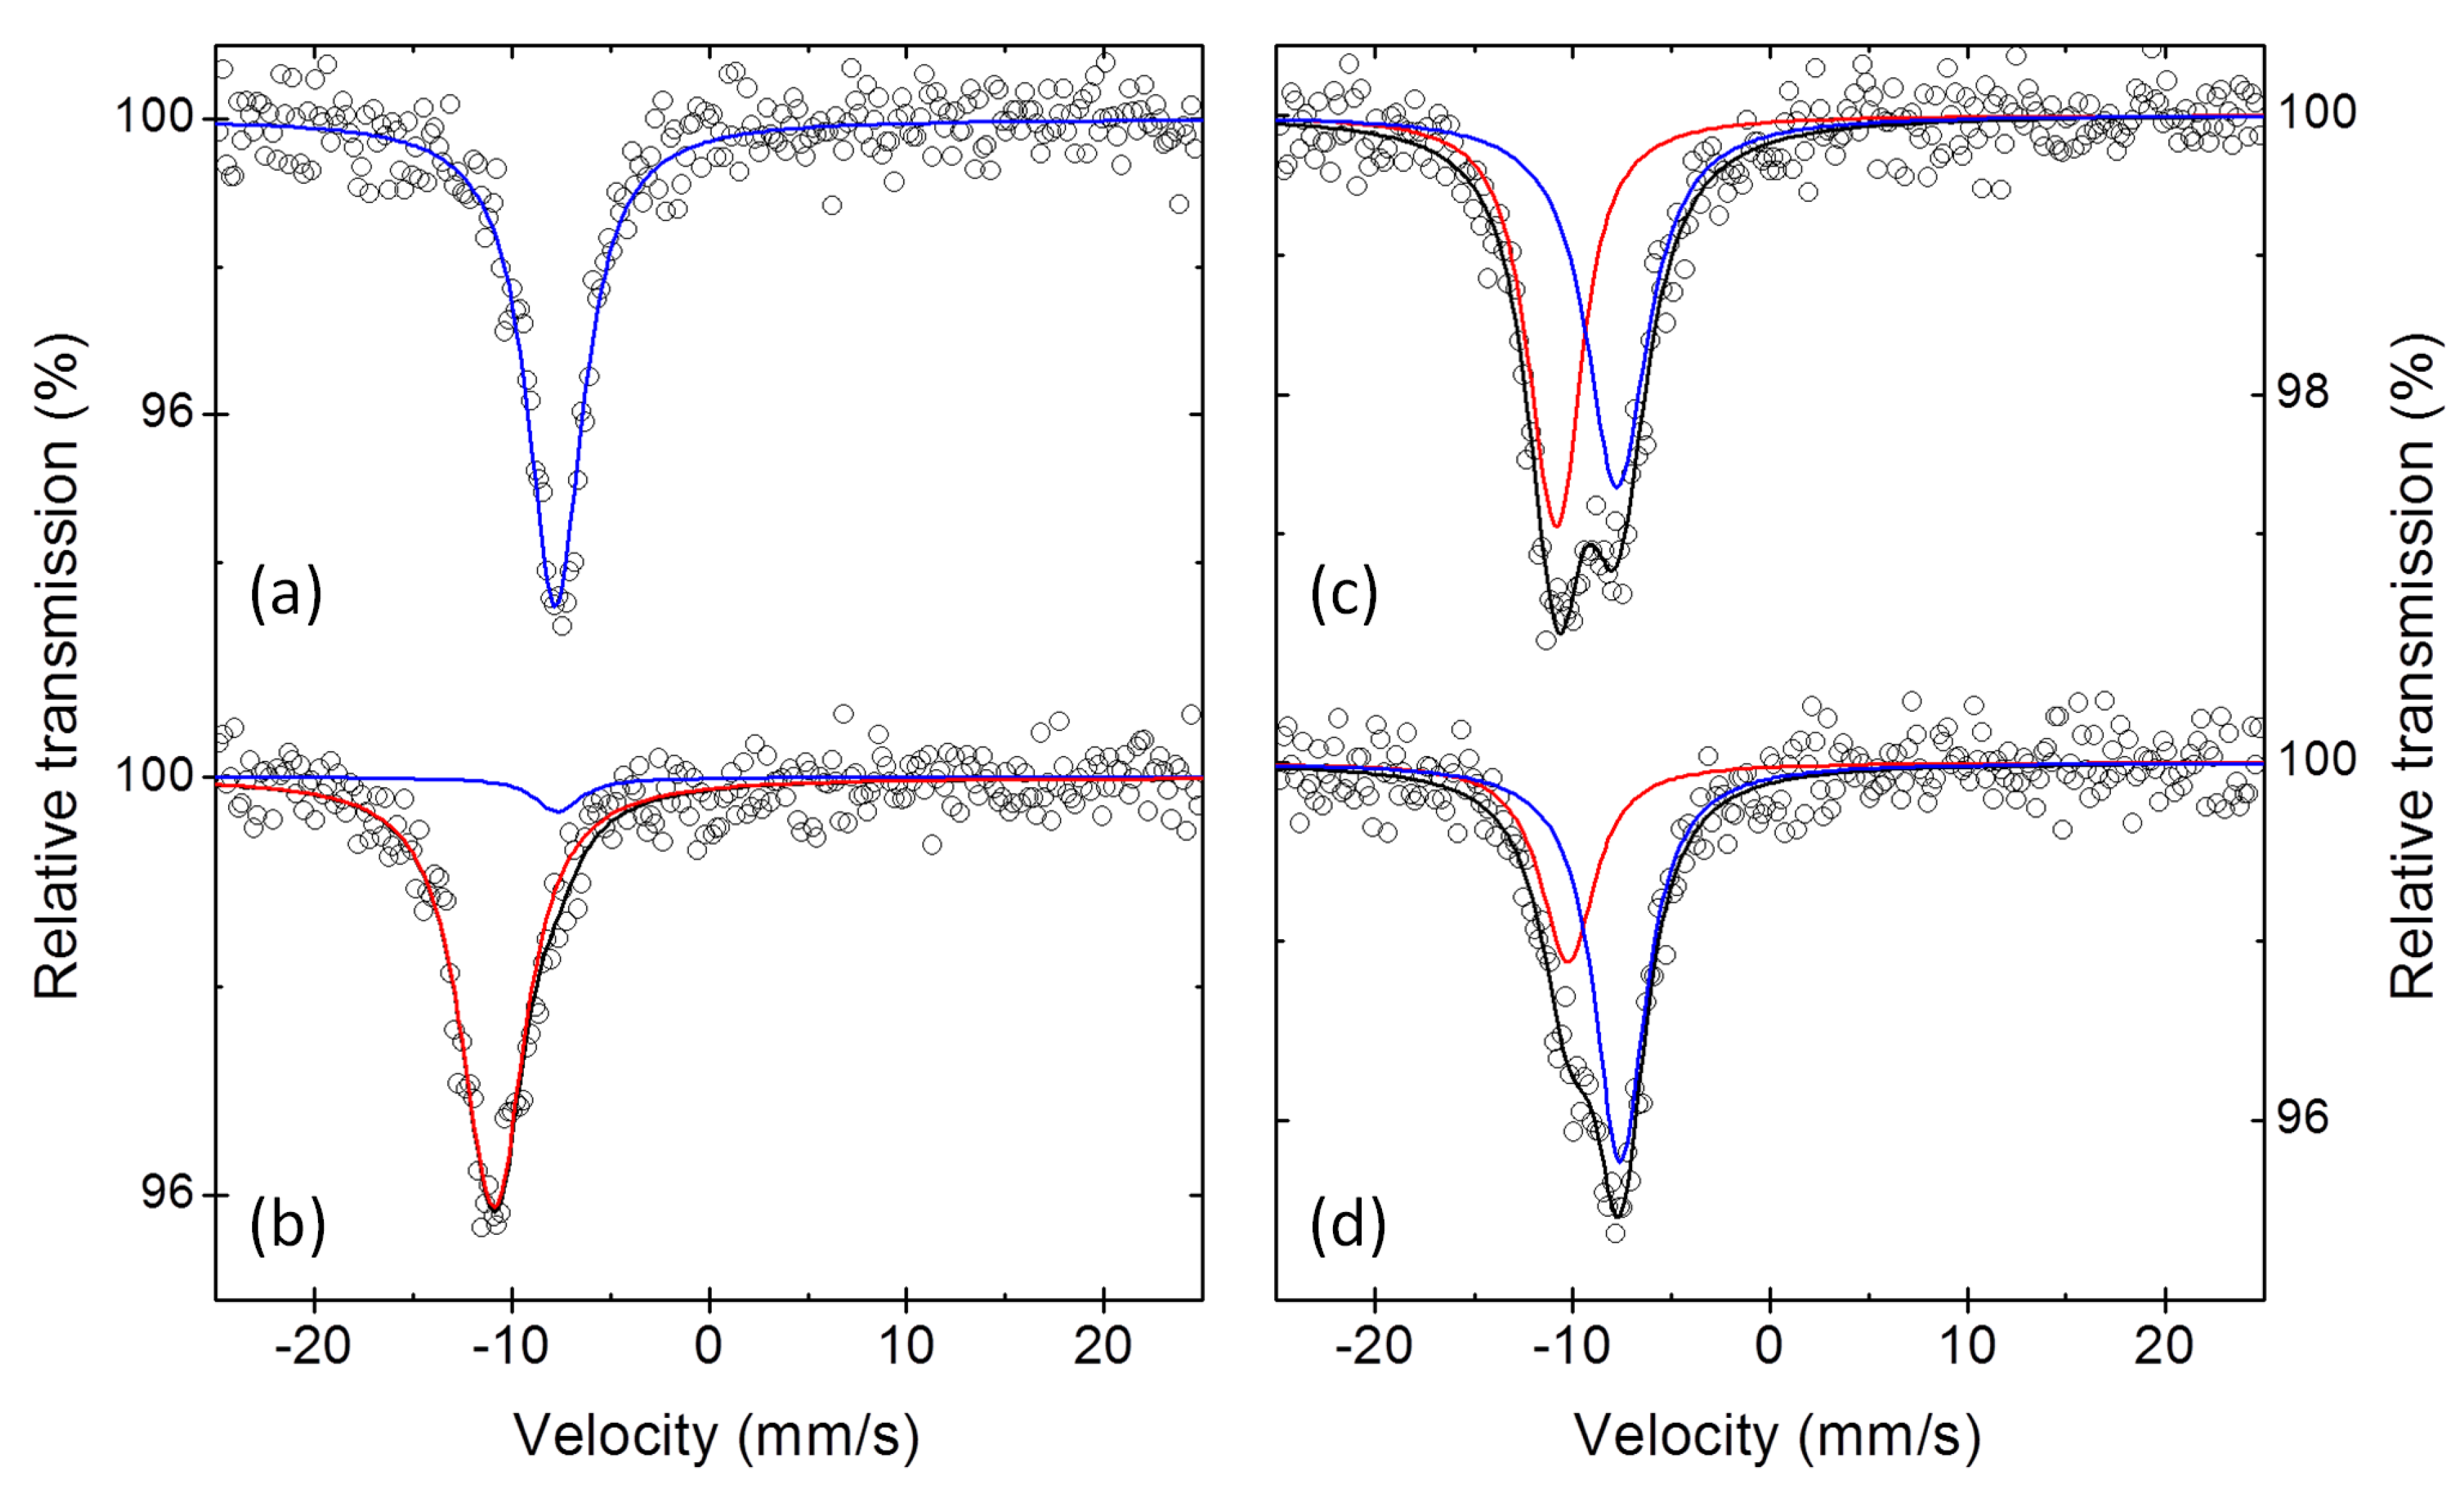
Similar problems concerning the identification of possible intermediates arise also from the analysis of ex situ
Sb Mössbauer spectra. The Mössbauer spectra of two Sb electrodes collected at the end of first discharge and at the end of the first charge, and of two additional electrodes stopped after the reaction of 1.5 and 2 mol of Na per mol of Sb during the first discharge, are shown in
Figure 6. The interpretation of the Mössbauer spectra of the first two electrodes is rather straightforward: (i) the spectrum of the fully discharged sample is practically identical to that of pure Na
Sb (cf.
Table 1 and
Table 5), in line with the full sodiation of the starting antimony, whereas (ii) the spectrum of the fully charged sample is only slightly different from that of the starting antimony. In fact, in addition to a minor impurity of unreacted Na
Sb, the dominant component of the latter spectrum has an isomer shift slightly more positive than that of bulk antimony. This difference can be simply explained either by an incomplete desodiation of the antimony, or more likely by the formation of amorphous Sb, which has a slightly different coordination shell compared to bulk antimony, as testified by both the EXAFS results and the previously published XRD and PDF analyses [
5,
7].
The interpretation of the two intermediate spectra, however, is not so straightforward. For simplicity, they were first fitted with two spectral components, as shown in
Figure 6, with the parameters reported in
Table 5. Using the results of this fitting, one obtains, after the reaction of 1.5 Na, i.e., halfway through first discharge, the presence of half Na
Sb and half amorphous Sb. After the reaction of 2.0 Na, i.e., at two thirds of the first discharge, the spectral component of Na
Sb represents about two thirds of the spectrum, whereas the remaining one third is represented by a component with an isomer shift significantly more positive than those of both bulk and amorphous Sb. The latter component could be interpreted with the presence of a sort of amorphous Sb containing some Na. For both samples, the relative intensities of the two observed components would follow well the stoichiometry of the system, thus supporting this interpretation. The possible presence of intermediate phases, however, is virtually impossible to distinguish from the simultaneous presence of Na
Sb and amorphous Sb. In fact, species such as NaSb would give rise to quadrupole split components (cf.
Table 1 and
Figure 1) with a global shape that resembles the sum of the two components representing Na
Sb and amorphous Sb. Consequently NaSb would be thus completely disguised by their signals.
It is interesting to notice that Baggetto et al. proposed the formation of NaSb during the electrochemical sodiation of Sb on the basis of such an ambiguous spectrum [
8]. On the basis of our results, however, it is now clear that such an interpretation is not at all unequivocal, and that the possible formation of NaSb is difficult to differentiate by
Sb Mössbauer spectroscopy from the simultaneous presence of Na
Sb and amorphous Sb. This ambiguity might be resolved, perhaps, by combining
Sb Mössbauer spectroscopy with synchrotron radiation Nuclear Forward Scattering, which has better resolution [
31].
In summary, both EXAFS
Sb Mössbauer spectroscopy support the formation of Na
Sb after full sodiation and of amorphous Sb after desodiation, in line with the previously published results. However, even applied together, these two techniques appear as intrinsically unable to spot the possible formation of intermediate Na-Sb phases during the electrochemical cycling of Sb vs. Na. Until today, only the simultaneous application of PDF and
Na Solid State NMR spectroscopy have allowed the unequivocal determination of the formation of such intermediates [
7].

 ,
, 


