Li-NMC Batteries Model Evaluation with Experimental Data for Electric Vehicle Application
by

Aleksandra Baczyńska
1, 
Waldemar Niewiadomski
1,*,
Ana Gonçalves
2,
Paulo Almeida
2 and
Ricardo Luís
2,3 1
Institute of Electrical Power Engineering, Lodz University of Technology, Bohdana Stefanowskiego 18/22, 90-924 Lodz, Poland
2
Instituto Superior de Engenharia de Lisboa, Polytechnic Institute of Lisbon, R. Conselheiro Emídio Navarro 1, 1959-007 Lisboa, Portugal
3
INESC-ID, Instituto Superior Técnico, Universidade de Lisboa, 1049-001 Lisboa, Portugal
*
Author to whom correspondence should be addressed.
Batteries 2018, 4(1), 11; https://doi.org/10.3390/batteries4010011
Submission received: 30 December 2017
/
Revised: 22 January 2018
/
Accepted: 1 February 2018
/
Published: 13 February 2018
Abstract
:The aim of the paper is to present the battery equivalent circuit for electric vehicle application. Moreover, the model described below is dedicated to lithium-ion types of batteries. The purpose of this paper is to introduce an efficient and transparent method to develop a battery equivalent circuit model. Battery modeling requires, depending on the chosen method, either significant calculations or a highly developed mathematical model for optimization. The model is evaluated in comparison to the real data measurements, to present the performance of the method. Battery measurements based on charge/discharge tests at a fixed C-rate are presented to show the relation of the output voltage profiles with the battery state of charge. The pulse discharge test is presented to obtain the electric parameters of the battery equivalent circuit model, using a Thévenin circuit. According to the Reverse Trike Ecologic Electric Vehicle (VEECO RT) characteristics used as a case study in this work, new values for vehicle autonomy and battery pack volume based on lithium nickel manganese cobalt oxide cells are evaluated.
1. Introduction
Nowadays, environmental concerns are triggering research in the electric vehicles area, due to high pollution produced by internal combustion engine-powered vehicles and its impact on global warming, as well as the decrease of petroleum resources on Earth. Strengthening of fuel consumption emissions and consumption regulations have a huge impact on the automotive industry, who are changing their approach and starting to develop this technology. Additionally, the electric car is considered as a clean energy technology without any combustion. However, the advancement of Electric Vehicles (EV) is hampered by other technologies such as batteries and their management systems.
Recently, the development of electric vehicles and energy storage systems is driving interest toward battery modeling. On the other hand, advancement in batteries has resulted in lower price, which has a significant impact on the development of vehicles and storage systems. Undoubtedly, it has a significant influence on the price of devices powered by batteries, which is crucial in the developing market. Vehicles available on the market to reach the performance required by clients are being improved every few years in the battery capacity area, due to the continuously developing technologies and high competition. Rigorous electric vehicle control units, especially the battery management system, require an appropriate model of the battery.
The battery technologies used in widely-known car applications are lithium-ion, lithium Nickel Manganese Cobalt oxide (NMC), lithium Nickel Cobalt Aluminum oxide (NCA) cells and Lithium Manganese Oxide (LMO). The aim of the paper is to build a Li-NMC battery model, which responds in experiments similarly to a cell, to enable further use of the battery in the VEECO (Veículo Elétrico Ecológico, in portuguese) application. Li-NMC batteries will be applied in the VEECO RT (VEECO, Gaia, Portugal) high efficiency Reverse Trike (RT) electric vehicle. Its autonomy reaches to on average 217 km, although further development of battery packs is needed. Nowadays, the market share of the NMC batteries is growing significantly due to their high performance and price drop within the last few years. These batteries were recognized as good alternatives to be applied to the VEECO RT electric car, due to the possibility of increasing the battery pack capacity, while maintaining the pack weight and voltage range. This is achieved due to the higher specific energy of NMC cells compared to the LiFePO cells that the VEECO RT uses. On the other hand, the NMC batteries have a lower thermal runaway temperature, about 210 C, than LiFePO, about 320 C.
The equivalent circuit model of the battery is an efficient way of identifying the parameters of the battery in comparison to electrochemical models, which are more precise and therefore more complex. The equivalent circuit consist of the voltage source, internal resistance and parallel resistance and capacitance branches. There are few methods able to recognize the number of branches needed to accurately map the experimental data and the model of the specific battery [1]. The application of the experimental data to the model (the parameters estimation) can be performed with the use of various methods, such as curve fitting using MATLAB® (The MathWorks Inc., Natick, MA, USA) functions [1]. Estimation of the model parameters is performed using pulse charging or discharging experimental tests [1,2,3,4,5,6,7,8,9]. In [2], the impact of the temperature was additionally taken into consideration, although it is not in the scope of this paper. However, further work may consider the influence of temperature on equivalent circuit parameters. On the other hand, it can be a preferable solution in the future.
In [2], the mathematical model was built, and the parameters’ estimation was performed on the basis of the genetic algorithms, particle swarm optimization and differential evolution optimization techniques. The model presented in this publication takes into consideration the state of charge, rate of charge/discharge and temperature variations. The idea of using optimization techniques introduces another possibility to bring the modeling results closer to the data from experiments. In [3], parameters’ estimation is performed by using a high-gain adaptive observer, which is a very precise method composed additionally of an experimental test. The results of those tests are fitted to a specific curve to calculate the parameters of the model. The difference lies in the adaptive parameter estimator usage, which adapts the parameters of the model to minimize the error of estimation. In [4], parameter estimation puts emphasis on the temperature-dependent internal resistance in the battery model. Parameter sensitivity analysis was performed to show the dependency between specific parameters. More views of physics in battery modeling can be found in [10], although the same approach of pulse discharge is applied. In [11], the parameters’ estimation is performed on the base of the response curve from the pulse discharge. The parameters are then subsequently optimized by the Kalman filter algorithm. A similar approach is applied using the Kalman filter in [12], whereas almost identical parameter identification occurs in [13], although further processing is performed in the Simulink® (The MathWorks Inc., Natick, MA, USA) toolbox.
Model parameter estimation used in this paper is based on Thévenin’s equivalent circuit [14], in which parameter identification is based on equations from [11] with the usage of experimental data. It consists of the utilization of pulse discharge results to approximate parameters of the model. Parameter estimation is simplified to parameters of internal resistance, resistance and capacitance of the branch. Additionally, the results from the model are compared with the results of the experiments performed on the different C-rate. The comparison embraces the discharging and charging processes of the two types of Li-NMC batteries. The study performed covers standard charging and discharging, as well as pulse discharge needed to execute parameter estimation.
The content of the manuscript is presented in the following way. Firstly, the experimental tests are brought closer, considering the performance methods and the equipment of standard charge/discharge, as well as of pulse discharge. The results of the experiments are additionally introduced. The second part covers the model simulation methodology and results. The following part introduces a comparison between experiments and simulation results, performed at different C-rates. Finally, possible further developments are presented, as well as the application to VEECO RT.
The main goal of this paper is to estimate the performance of the battery on the different State Of Charge (SOC) levels. The State Of Health of the battery (SOH) is out of scope of this manuscript. The influences on battery life and degradation of cells are also not examined in this paper. The temperature was not taken into consideration, but further work can pay special attention to this issue.
2. Batteries Measurements
This section describes the experimental tests performed on the Li-NMC batteries. The first subsection presents briefly the equipment and types of batteries used for measurements and tests, whereas the second describes the procedures of the tests. The last section introduces the methodology of parameters’ estimation. The authors of the article believe that the approach presented in the model is more efficient and valuable for EV batteries’ simulation. The most time-consuming part of modeling is the standard charge and discharge cycles of the cells, which in fact can be done automatically, without the physical presence of a human.
2.1. Equipment and Batteries
This subsection presents the equipment and batteries used for standard testing, as well as for pulse discharge tests. Table 1 presents the parameters of batteries from the manufacturer’s data sheets. It was used to configure the charge and discharge processes of batteries. NMC1 is the battery cell Model IXP74/212/269PA (Tianjin EV Energies Co, Ltd., Tianjin, China), whereas NMC2 is the battery cell Model LG60AH-3.6V/60Ah (LG Chem, Seoul, Korea). Tests were performed on two types of cells of Li-NMC chemistry, which differ in capacity level and dimensions, although they both are pouch-type batteries. The main difference among them is their capacities of 37 Ah and 60 Ah, respectively. Batteries additionally differ in nominal voltage, although this parameter will not have a significant influence on further estimation of the parameters.
Testing workstation performing modeling consists of the power source, the microprocessor charger (Revolectrix™ Cellpro PowerLab 6 (Revolectrix Group, MD, USA)) and a PC with software. Lead acid batteries are used as the power source; therefore, this solution enables one to recover energy from the discharged cell. All tests were performed in harmony with the environment, by using the battery as the power supply and as the storage system. This solution allows one to restore a significant part of the energy, only with losses of the converter, which are not recovered.
Another test that was carried out was the pulse discharge test. It was performed to estimate the parameters of the equivalent circuit, such as internal resistance, the resistances of branches and the time constants for the capacitor. These tests were carried out with the same devices, with an additional usage of the switch to connect and disconnect the resistor acting as a load. The resistor is a passive element, with a resistance of 1 .
2.2. Testing Methods
Experimental tests are divided into two parts: discharge/charge curves and pulse discharge. The analysis of the tests will be presented in the first and second subsection, respectively.
2.2.1. Dependency between State of Charge and Battery Voltage
One of the simplest estimations of SOC is based on the Open Circuit Voltage (OCV), which is applicable to most of the battery types. Usually, it provides a sufficient approximation of SOC. However, for some types of batteries, there is not a sufficient dependence between the state of charge and OCV to assess SOC, based on OCV. This case may happen when the voltage capacity curve is too flat, mostly in the middle part, between 40% and 70% of capacity.
Batteries modeled in this paper represent a sufficient dependency between SOC and OCV. Two curves from the first battery are presented below: one for discharge and one for the charge process. SOC is estimated on the base of energy flow on the output from the battery workstation and initial state of charge. Discharge current rates were chosen according to the possibilities of the workbench and the maximal rates of batteries. In the first battery cycle, a 0.25 C -rate was used. This rate resulted in a current of 9.25 A. The second cycle was performed with a 0.1 C-rate, resulting in a current of 3.7 A. In the second part of the cycle, mostly the discharge curve will be used in the evaluation of the proposed solution. Curves for the 0.25 C-rate are presented in Figure 1 with voltage as a function of SOC.
Charge/discharge curves of Li-NMC differ significantly from other types of lithium cells. The main difference is that it is not as flat as the other types of batteries, mainly in the area between 0.2 and 0.55 of the SOC. Moreover, the voltage grows more rapidly from 0.55 of the SOC, whereas in other types, the curve may be described by the exponential zone after 0.9 SOC. In the analyzed case, the exponential description is not noticeable.
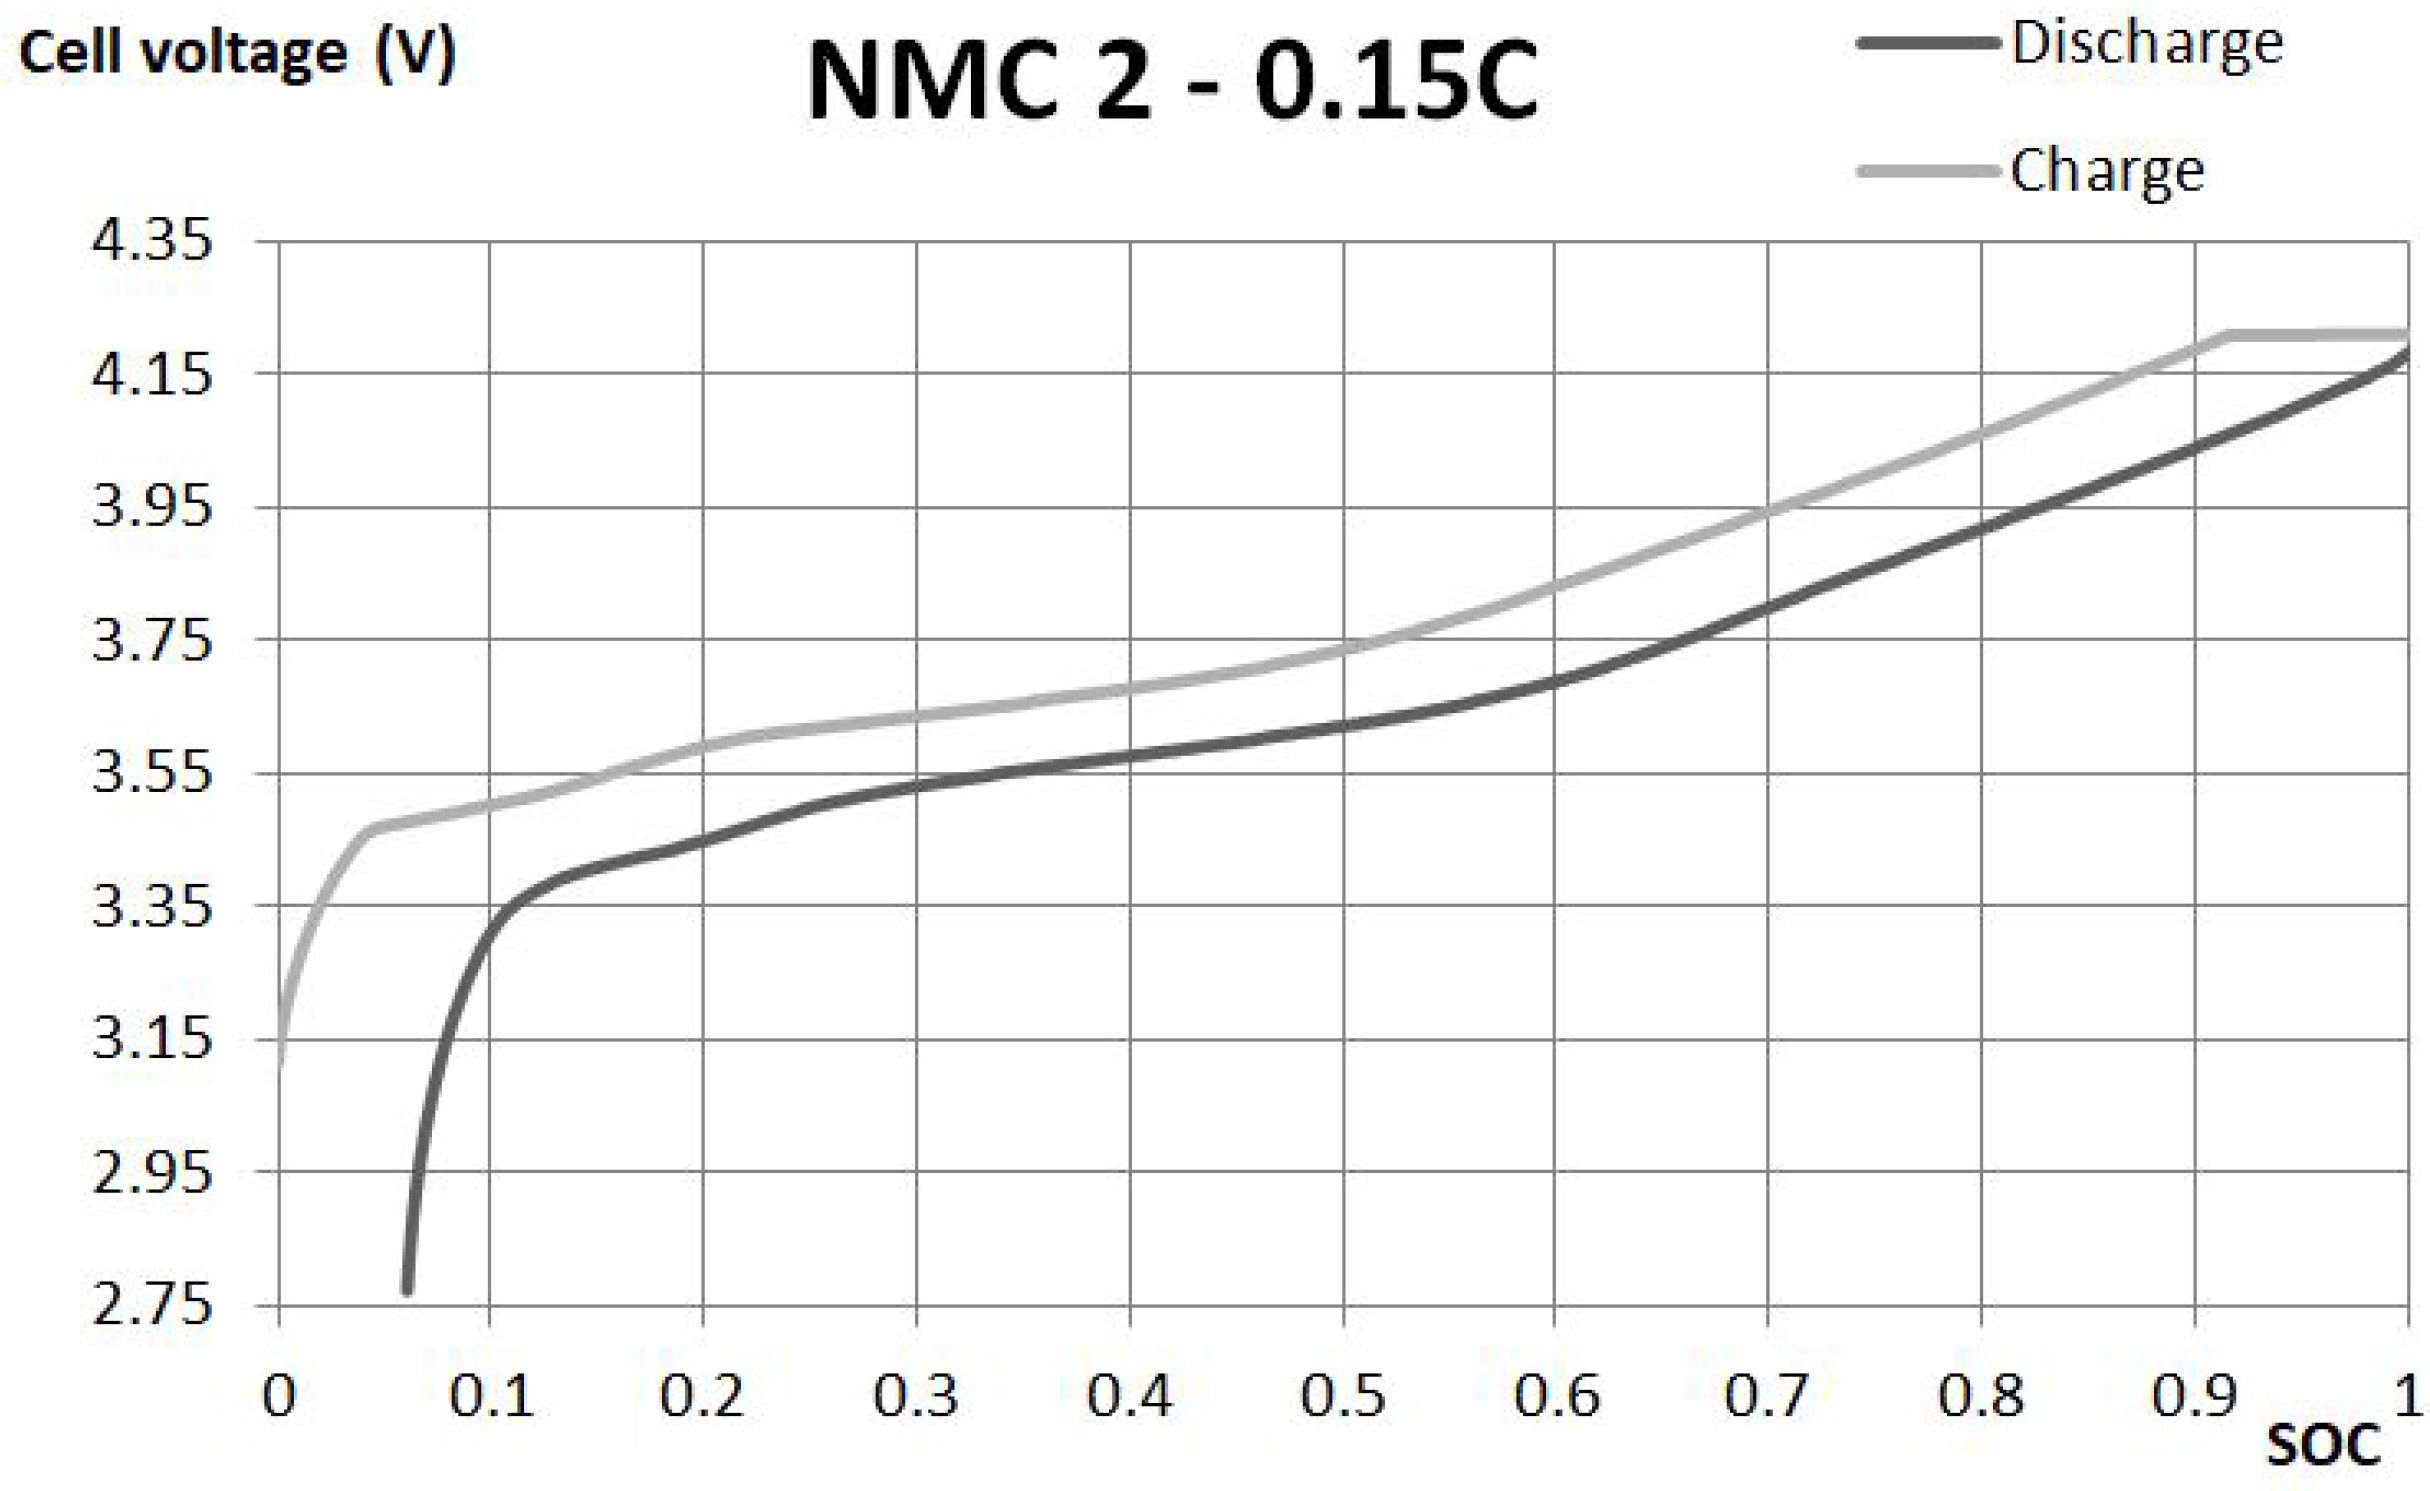
The second battery curves are presented above. Due to larger capacity of the cell and limited output current of the workstation, for those measures, the rate of 0.15 C was used, resulting in a current equal to 9 A; whereas the second rating was equal to 0.10 C, and 6 A of current was achieved. The second cycle will be used in further evaluation of the model. Charge and discharge curves from the first cycle are presented below as a function of SOC in Figure 2.
Both cases represent similar dependency. On this basis, it can be concluded that both cells represent similar proportions of additional components. However, cells are differing in exact fractions. During tests in the case of NMC1, all nominal capacity was available, whereas in the second case, the capacity was slightly smaller than nominal, and both cells were not used previously.
2.2.2. Parameters of Branches and Internal Resistance
Non-ideal battery models consist of internal resistances and parallel RC branches. Internal resistance reflects an instant drop or increase of battery voltage, resulting from connection and disconnection of the load; whereas parallel RC branches result in delayed response, a smooth approach to the voltage value in the steady state. In Figure 3 and Figure 4, the pulse discharge curves are presented. The tests give information about the battery dynamics, as well as their OCV. On the grounds of this, there is a possibility to extract the main parameters of the Thévenin’s battery model.
The tests were performed on specific SOC levels and different widths of current pulses; although, the same level of current was carried out. One of the important things is to select a sufficient width of the current pulse, due to the fact that it may strongly influence the results if pulses are too short. The optimal pulse time during these tests, taking into consideration these types of batteries, is for NMC1 about 400 s, and for NMC2, it is 600 s. These values are obtained due to the time duration of the transient state and following the discharge of the battery. The optimal relaxation time differs between these batteries: for NMC1, it is 300 s, and for NMC2, it is equal to 400 s. The testing workstation performing pulse discharge was additionally equipped with a variable resistor and switch, to be able to connect and disconnect the resistor from the whole system.
The first phase of testing was aimed at monitoring the voltage of the battery. The second step was the performance of the pulse of the current for a specific amount of time, which was specified by the width of the pulse. The last stage covered another monitoring, in which the battery voltage was recovered. The difference between these charts is that they were performed on different cells, as well as they were created on the basis of various SOC.
3. Model Simulation
The simulation was prepared using the Simscape™ (The MathWorks Inc., Natick, MA, USA) toolbox. The model and its preparation are presented in this section. Two models were prepared to allow the simulation of two types of batteries, and for both, the same equivalent circuit was used.
3.1. Proposed Model
The equivalent circuit model chosen for simulation is Thévenin’s battery equivalent circuit. Batteries’ models consist of controlled voltage source, internal resistance and sets of branches connected in parallel. The branches are composed of capacitance and resistance. The number of parallel branches depends on the application of the model. If the application requires greater accuracy, the number of branches has to increase, to be able to follow the real model precisely. The number of branches has a significant impact on the short time response of the model. Each branch allows modeling additional time constants. For the presented application, sufficient accuracy may be obtained with one branch.
Figure 5 shows the overall arrangement of the proposed model with Thévenin’s equivalent circuit of the battery workstation as the current source and load with the switch for pulse discharge. It additionally consists of the current and voltage sensor, the first to estimate the state of charge and the second to measure the voltage for tests. The battery model is supplied by the signal resulting from the state of charge to control the voltage source. This signal is computed in an additional block on the basis of the discharge current and initial SOC. The discharge current is measured on the battery terminal for both tests. The controlled current source is used to perform discharge and charge curves. The control signal is calculated on the basis of the capacity of the cell and charge/discharge rate. Since the process of charge and discharge is performed only in constant current mode, the input signal also remains constant during simulation. It is controlled only by the inserted parameters. To operate in pulse discharge mode, it additionally consists of a switch and resistor, which allow modeling the load, as was performed during tests on the workstation. The switch is controlled by a timer, and it can be fixed to any sort of value of the current width, which is connected to a pulse discharge. During pulse discharge, the controlled current source is supplied with a zero signal. Finally, the model contains the voltage sensor for the output of the simulation.
3.2. Open Circuit Voltage
Open circuit voltage is represented by the voltage source, the main element of every equivalent circuit of batteries. Circuits for ideal batteries consider only a controlled voltage source. This kind of model does not consider any change of voltage between OCV and voltage, when the battery is connected to the load. This change is a result of the internal resistance R and parallel branch, resistance R and capacitance C, which will be described in further subsections.
The model prepared for the electric vehicle application uses charge and discharge curves to estimate the open circuit voltage. OCV is referred to a value of the voltage on the controlled voltage source or on the battery terminals without any load connected. During discharge, the value of OCV in comparison to the voltage on cell terminals is greater by the voltage drop on internal resistance and on parallel branches. However, during the charge, the workstation needs to set the voltage to level greater than the voltage of the controlled source and the drop on the elements. In other words, OCV is obtained from the discharge curve as the value of the voltage measured on battery terminals increased by the voltage drop on resistances, caused by the known current.
3.3. Equivalent Circuit Parameters
The equivalent circuit of the NMC battery consists of internal resistance and the parallel branch of resistance and capacitance. The parameters of this scheme represent voltage drop, when the load is connected to the battery. Those branches are also responsible for the delayed voltage response of the battery.
In Figure 3 and Figure 4, pulse discharge tests are shown. The instantaneous drop of the voltage can be associated with the drop of the voltage on the internal resistance of the battery. The voltage increase during the disconnection of the load should be similar, although taking into some disturbances, there are small differences between them. The further response of the battery is modeled by the capacitance and resistance of the parallel RC branch. The response results in exponential parts of the pulse discharge. Parameter identification is based on the equations from [11] with the usage of experimental data. The resistance of the parallel branch was established by the voltage drop on the exponential part, whereas to model the capacitance, time constants were needed. They were found from the exponential curves. The period of discharging the battery can be additionally seen on these curves, which results from the long time duration of the pulses.
In Table 2, the parameters of the equivalent circuit are presented for two types of batteries tested. For the battery of higher capacity (60 Ah), the internal resistance and resistance of the parallel branch have higher values than in the first battery. Furthermore, the values of the capacitance in these two equivalent circuit models are different, greater in the case of NMC2 than in that of NMC1. The values of the parameters of the models have significant meaning with respect to the strong influence of the battery model behavior, which needs to be as close to reality as possible.
4. Evaluation
This section will present the outputs of the prepared model in comparison to the real battery response to the load. In particular, this subsection presents the evaluation of the model with the data collected at the test-bench. Firstly, the evaluation of the discharge and pulse discharge for NMC1 will be presented; secondly, both tests for NMC2 will be described.
4.1. Discharge NMC1
In Figure 6, the real discharge and response of the model in the same process are presented. To be able to compare them, they are presented in one graph. Firstly, the model reaches higher values than the experiments, then for the specific SOC, the model perfectly reflects the real behavior of the battery. Finally, for lower SOC of the battery, the real values are higher than the modeled ones, and then, at the minimum possible SOC (about 30%), the model fits the real data.
Figure 7, presented below, shows the error of the simulation compared to the expected output. The error reflects the areas of the highest differences between the model and the real behavior of the battery. As was mentioned above, the highest inequalities occur at the highest and in the middle of the SOC. What can be concluded is that the model strongly maps the real experimental data, trying to maintain equilibrium with minor errors.
Both figures present a sufficient level of accuracy. For 95% of the time, the relative error is smaller than 0.5%. Moreover, larger errors appear only at the beginning and at the end of the discharge process, which is not part of the main interest of this study.
4.2. Pulse Discharge NMC1
This subsection presents the evaluation of the first battery (NMC1) during the pulse discharge test. The results of the data comparison and of the error are presented on Figure 8 and Figure 9, respectively. The comparison is performed on the basis of the differences in voltages, during the pulse discharge.
The differences between the model and real experimental data are the most visible in the moments of connecting and disconnecting the load. Those errors appear mainly due to the low frequency of data collection on the workstation, and the authors are not able to change this setting. The following errors during the current pulse are relatively small and represent less than 0.1%. In the relaxation period after the pulse, the errors increase and level off at nearly 0.2%. The biggest errors occur at the moment of changing the configuration of the circuit. This takes place approximately within the first hundred seconds and between nine hundred and one thousand seconds, respectively. It can be concluded that with better accuracy of measurements, the error could be reduced. The main differences between the model and collected data are caused by a too low frequency of the measures on the workstation. This has a significant impact on the error presented in the above figures. The other cause of the differences between the model and real experimental data can be the characterization of the variation of the equivalent circuit parameters as not depending on the SOC, which may be considered in further work.
4.3. Discharge NMC2
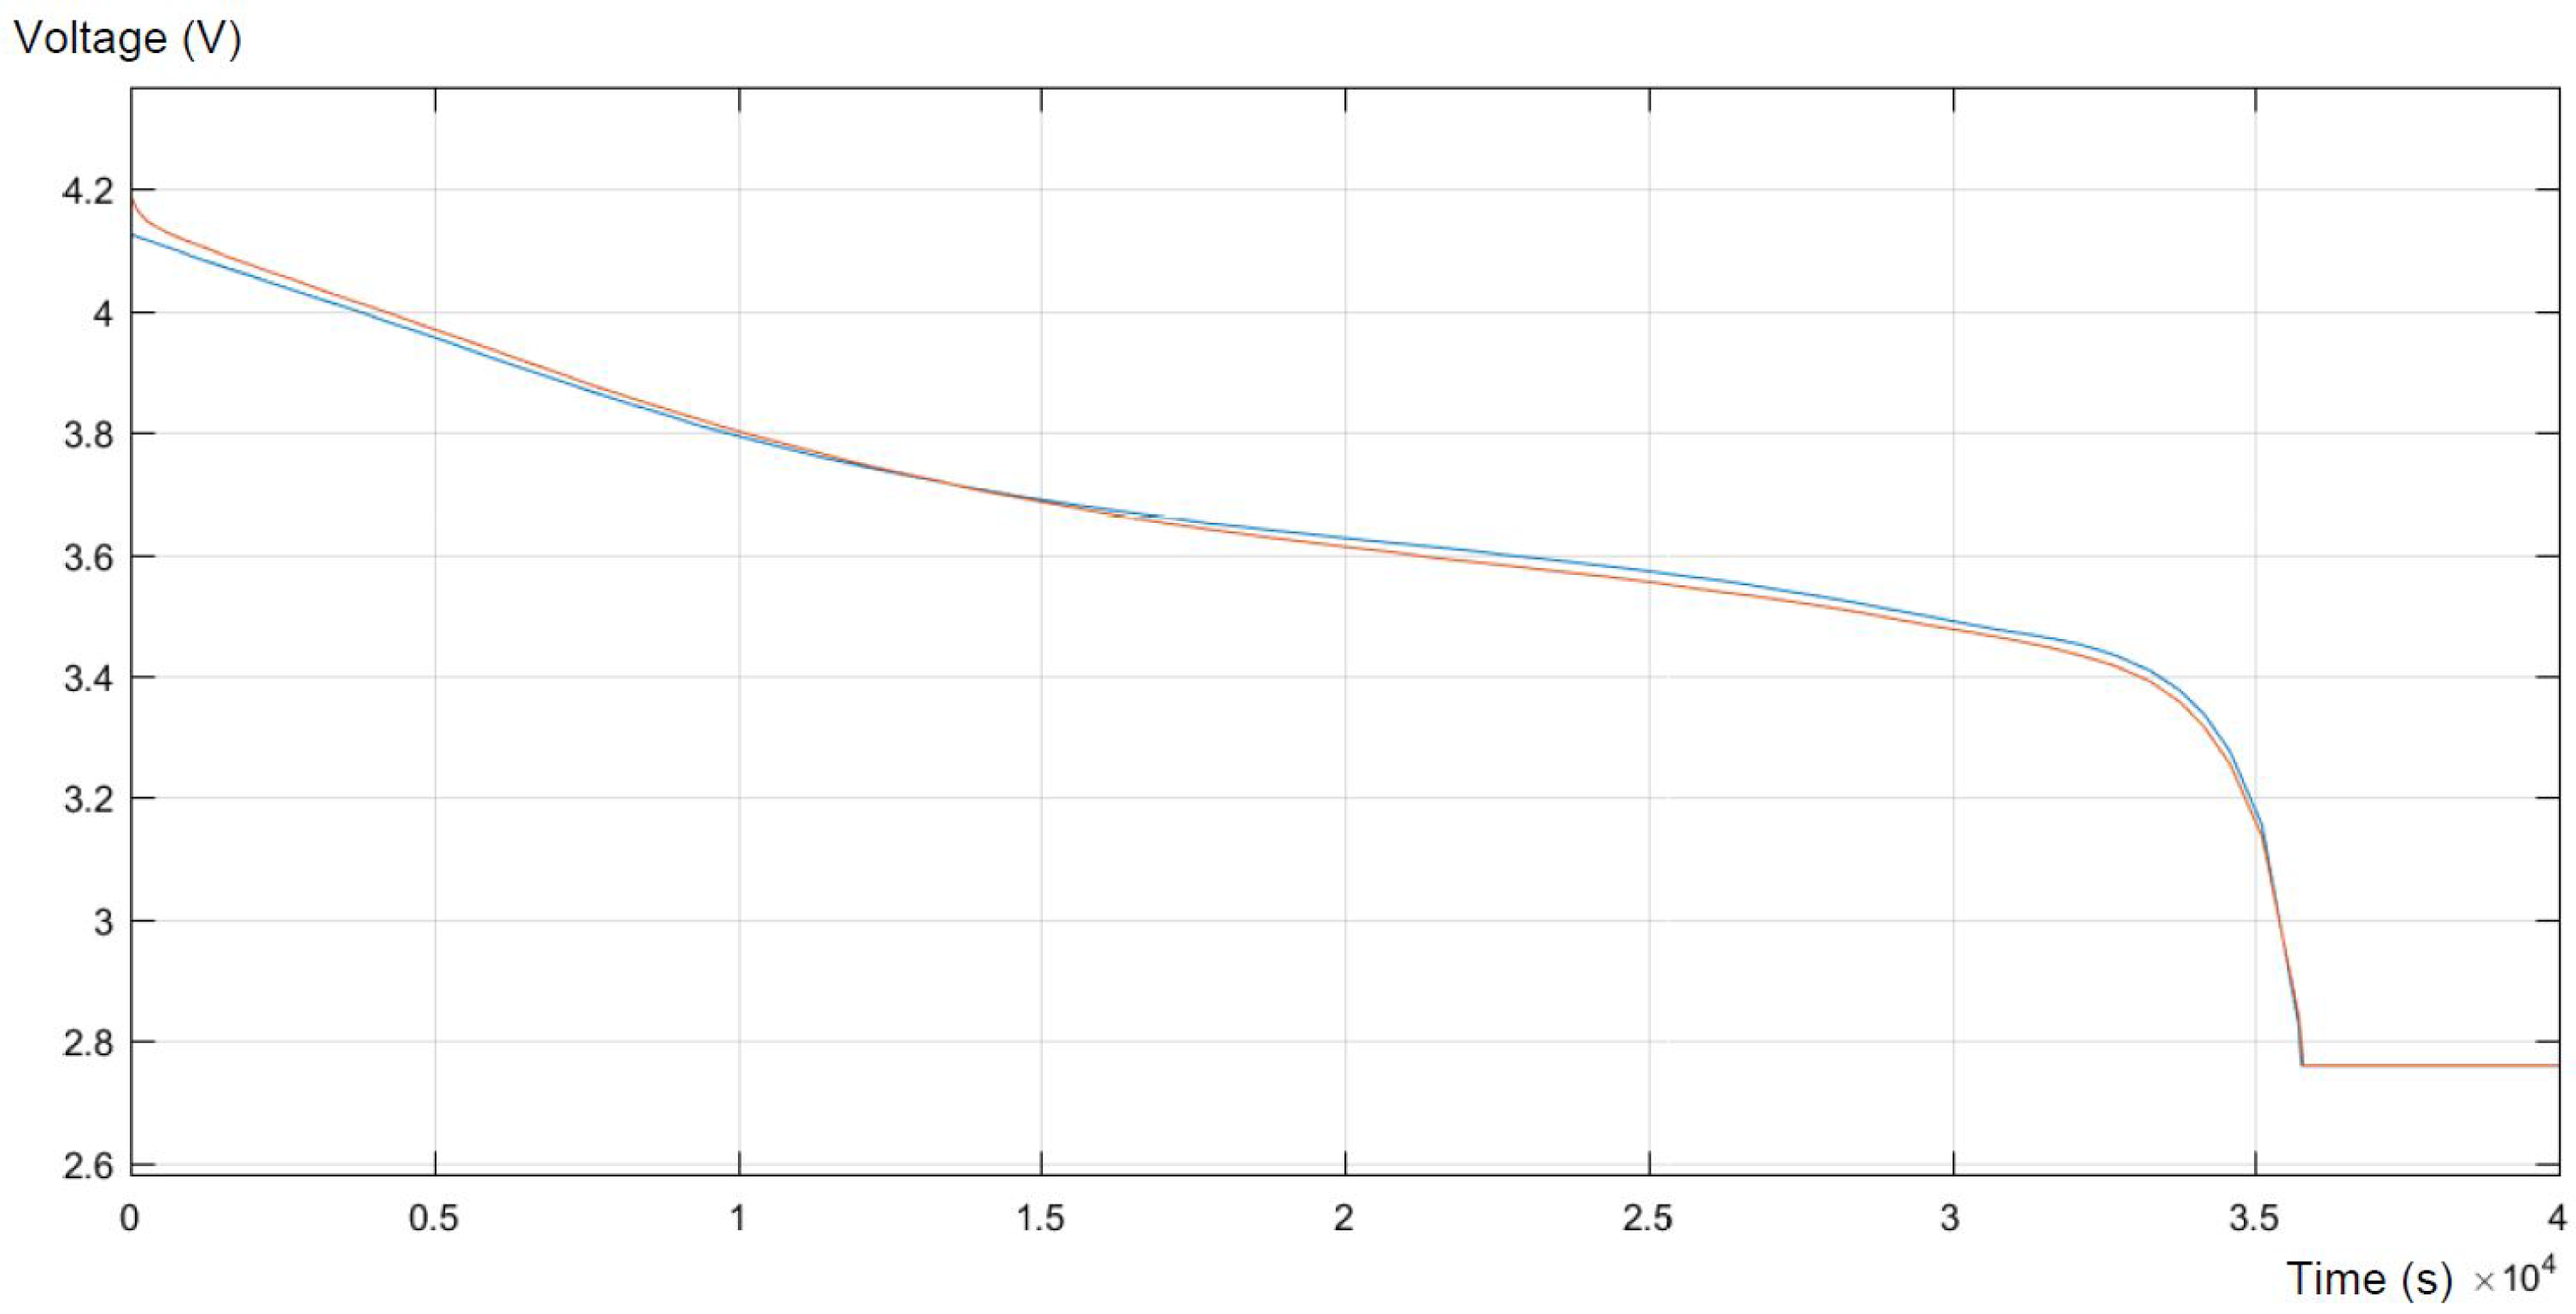
In this subsection, standard discharge and pulse discharge evaluation of the NMC2 battery will be shown. The experimental data will be compared with the model results. In Figure 10, the real discharge and response of the model in the same process are presented.
There are some differences between the model response and the real behavior of the battery, mainly at the beginning of discharge, in the almost full SOC. Relative errors in the middle part may be reduced by increasing the number of pulse-discharges at the different states of charge. More pulse discharge tests give the possibility to vary the parameters of the equivalent circuit according to the SOC. These differences are of the rank of hundreds of units. In those two periods, the response of the model gives a higher value of the voltage than the real experimental values. For most of the time, the response of the model meets the real experimental data.
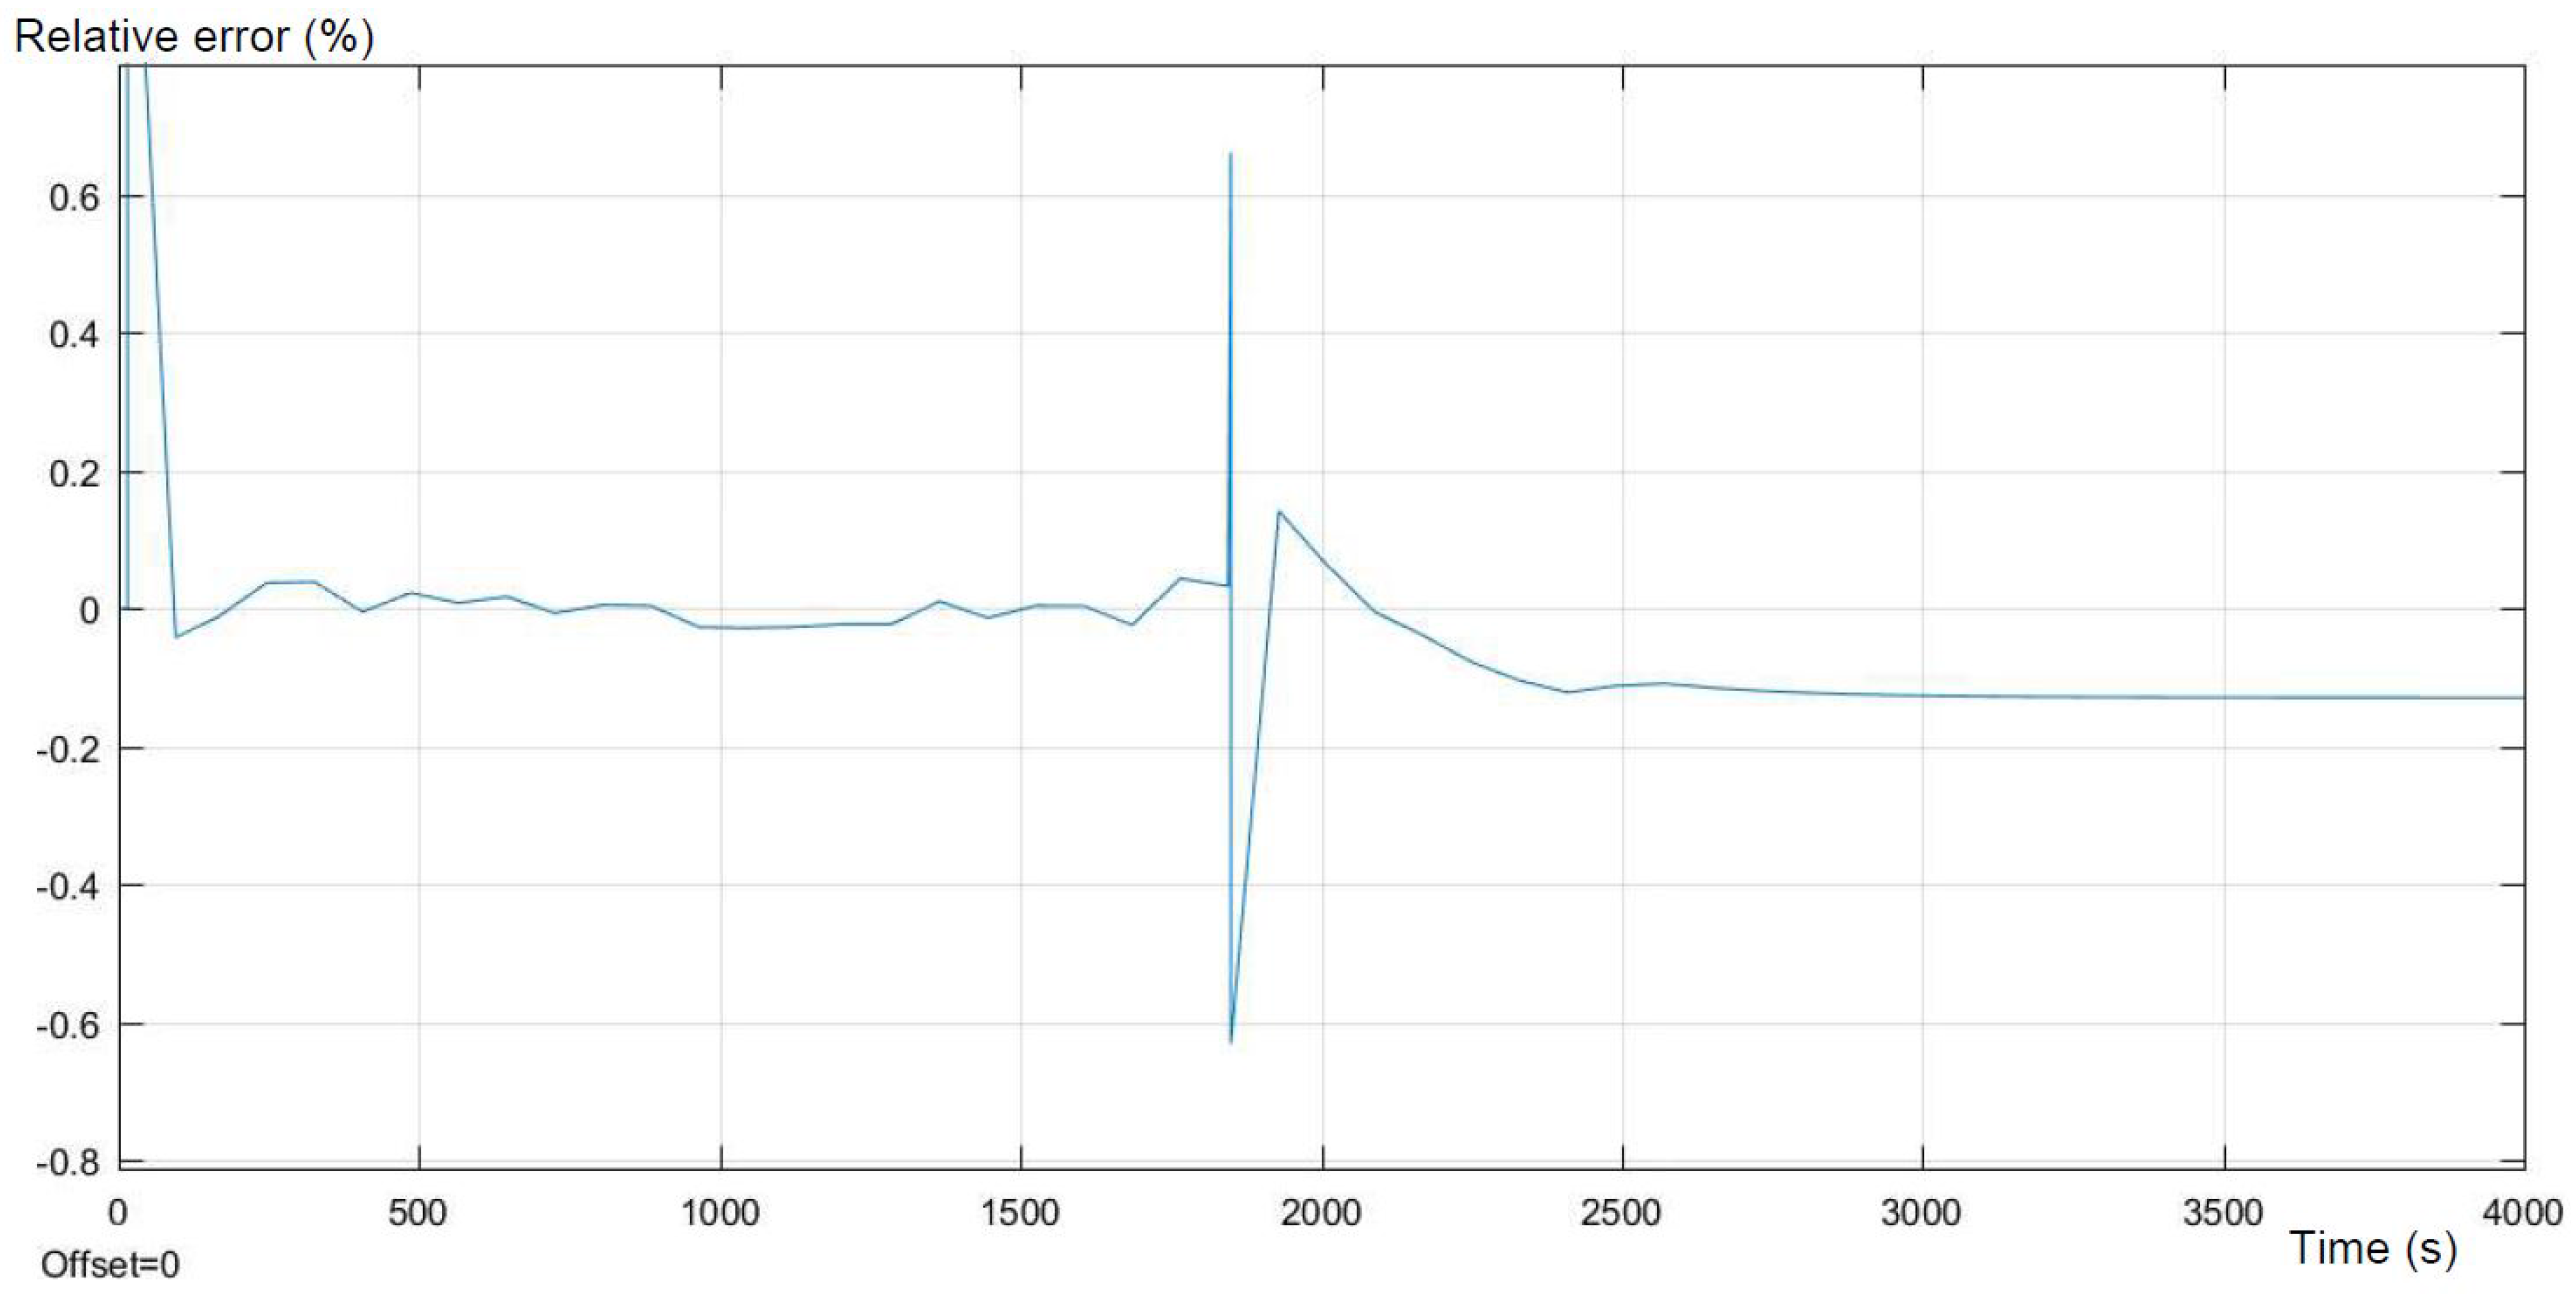
Figure 11 presented above shows the error of the simulation, compared to the expected output. The error presents higher accuracy than in the case of the NMC1 battery. For more than 95% of the time, the error is smaller than −0.5%. Moreover, for more than half of the time, the error is smaller than 0.2%. The model represents accurate mapping of the obtained results from the experiments.
4.4. Pulse Discharge NMC2
This subsection presents the evaluation of the second battery (NMC2) during the pulse discharge test. The results are presented in Figure 12 and Figure 13. They present the comparison between the real experimental data and the pulse discharge model, respectively.
The differences between the model and real experimental data are the most visible in the moments of connecting and disconnecting the load, in the same moments as for NMC1. This can be caused by a too low frequency of the measures on workstation, as was concluded before. What differentiates these two batteries is the better accuracy of the model response, which can be seen in the current pulse period. However, the model still reflects the relaxation period with constant error, which can be reduced by performing more pulse discharge tests.
4.5. Evaluation of the Proposed Battery Pack for the Electric Vehicle
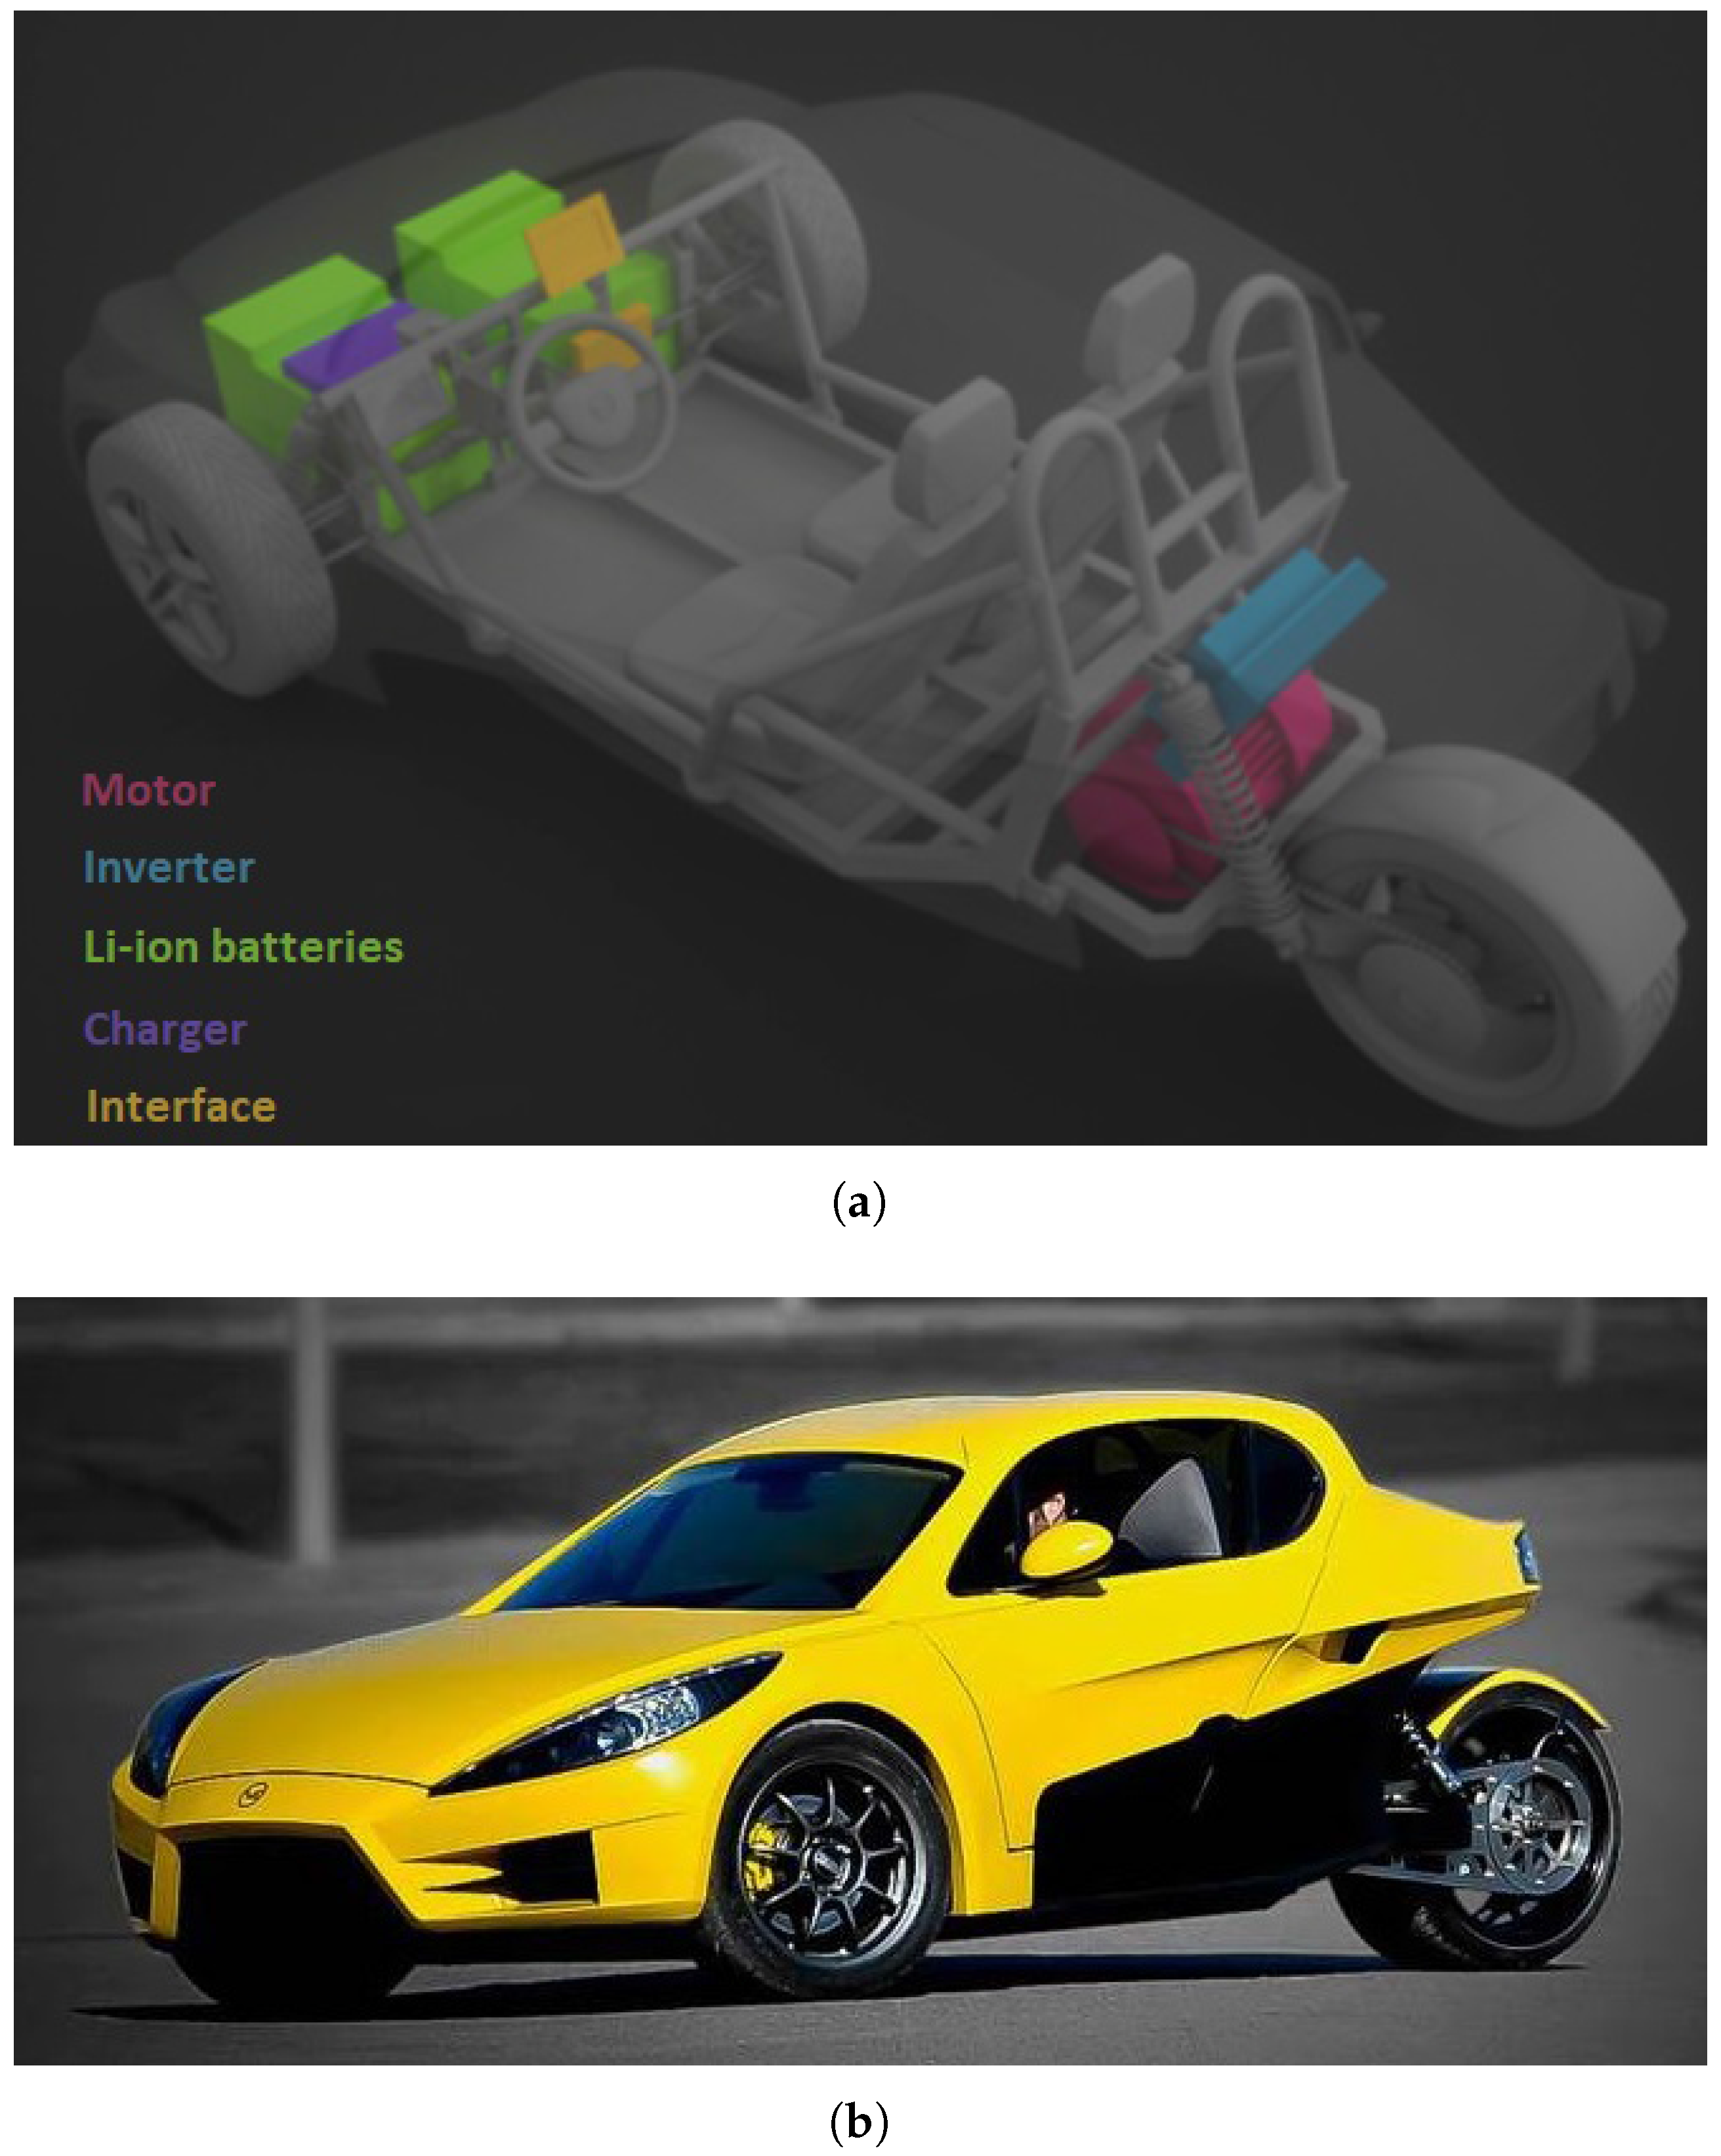
The model presented in this manuscript will be applied to the electric car VEECO RT (VEECO, Gaia, Portugal) [15]. The VEECO RT presented in Figure 14 is a two-seater electric sport reverse trike, merging the car with the motorcycle concept, which provides excellent aerodynamic characteristics. Previous versions of this vehicle used different battery types in various configurations. The latest model used LiFePO cells with a capacity of 480 Ah and a voltage between 33.6 and 48.0 V depending on SOC. An overview of the cell data is presented in Table 3. This configuration resulted in an average autonomy of 218 km. The average energy consumption is equal to 9 kWh/100 km.
The presented battery model is essential to further design the battery pack for the VEECO RT. The VEECO RT simulation model [16], integrating the NMC battery model focused on in this paper instead of the actual LiFePO battery in-use, will allow validation of the expected performance. The authors of this paper propose two variants of the battery pack for the VEECO application, using a smaller volume of space in the vehicle, as with the previous battery pack. Each solution will consider different types of cells as presented in Table 4.
In the case of the NMC1 type of battery, the authors suggest the use of 252 cells, configured as 36S7P (36 series of seven parallel cells), to be able to supply a similar voltage range and to improve pack capacity. The proposed configuration will result in a capacity of 259 Ah (33.6 kWh), a voltage range between 99.0 and 151.2 V and an autonomy of on average 373 km. Despite the performance issues, the improvement of this configuration also reduces the volume of space needed for the battery pack by 22.3%, and the mass of the pack is increased only by 3.7%.
The configuration of the second type of tested cells (NMC2) is identical to the previous one (252 cells, 36S7P). This configuration maintains the voltage in the same range as presented in the previous solution, and the battery capacity reaches a value of 420 Ah (55.2 kWh). Moreover, the approximated autonomy in this case will be 613 km. In this arrangement, the volume of the battery pack may be reduced by 24.2% with an increase of only 2.5% of the mass of the battery pack. Both packs are able to cover the peak power demand of the vehicle.
4.6. Possible Further Improvement
Further improvement of the model may consider the variability of internal resistance and the parameters of branches as functions of SOC. The improvement of the model can be seen in the area of parameters’ optimization in the equivalent circuit model, by using multiple RC branches optimized by the algorithm. The development can additionally include the thermal aspect: the influence of temperature on the calculated parameters, especially resistance. In that case, the model will be able to compensate for the variability of temperature, and it will be more accurate. Further development can take into consideration an increase of the number of parallel RC branches, which can cause an increase of accuracy. Further experimental tests will draw attention to more specialized equipment, to be able to perform the test without constraints, such as the precision of measures and the frequency of collecting the data.
5. Conclusions
The aim of the paper is to present the battery model for an electric vehicle application: VEECO. The proposed model based on the one RC branch connected in series with the internal resistance simplifies the methodology of parameters’ identification. The main goal was to shorten the time of preparation with reasonable accuracy of the model. Adding RC branches will introduce higher precision, although the obtained accuracy of the model is satisfying. This model should be considered broadly due to its simplicity and good mapping of the fundamental charging/discharging, as well as pulse discharge tests. Although, the error of the parameters’ estimation is still significant, that can be improved further by the optimization tools. Moreover, the model may be improved by taking into account the variability of the estimated parameters for different SOC. The model evaluation is based on a comparison to the real data measurements, to be able to verify the accuracy of the method and enable its further development. In this paper, the authors propose a technique of equivalent circuit modeling, which is further compared with the real behavior of the battery. The experimental tests include standard charge and discharge, as well as pulse discharge, which resulted in the estimation of the parameters of the equivalent circuit model. The single-pulse discharge test was performed, to make the modeling process rapid. When the results of tests were compared with the model, the errors were not significant. Further work may consider more pulse discharge tests at different SOC to enable the possibility to vary the parameters as a function of SOC. Probably, this concept will reduce relative errors even further. The main issue of this paper was to create the accurate modeling of the Li-NMC batteries. Simulation and experiments demonstrated strong convergence, although the main differences between them are caused by the low frequency of measures on the workstation and simplification of the model, which can be further developed. However, the model may be used for electric vehicle applications. The proposed model introduces an efficient and transparent method to model Li-NMC batteries. Moreover, due to the better performance compared to the previously-used type of battery, the Li-NMC cells will result in the autonomy improvement of VEECO RT, by 82% and 199%, using the NMC1 and NMC2 cells, respectively.
Acknowledgments
The authors thank VEECO for providing samples of lithium-ion cells for this research work. This work was supported by national funds through Fundação para a Ciência e Tecnologia (FCT) with Reference UID/CEC/50021/2013.
Author Contributions
Aleksandra Baczyńska, Ana Gonçalves and Waldemar Niewiadomski performed the experiments, analyzed the data and wrote the main manuscript parts. Paulo Almeida helped with the experiments and wrote the analysis for the EV application. Ricardo Luís supervised the research, providing guidance and key suggestions. All authors revised and approved the publication of the paper.
Conflicts of Interest
The authors declare no conflict of interest.
Abbreviations
The following abbreviations are used in this manuscript:
| DOD | Depth of Discharge |
| EV | Electric Vehicle |
| Li-NMC | Chemistry of tested and modeled battery |
| LMO | Lithium Cobalt Oxide |
| NCA | Lithium Nickel Cobalt Aluminum Oxide |
| NMC | Lithium Nickel Manganese Cobalt Oxide |
| OCV | Open Circuit Voltage |
| RC branch | Resistance-Capacitance branch |
| SOC | State Of Charge |
References
- Santos, R.M.S.; de S. Alves, C.L.G.; Macedo, E.C.T.; Villanueva, J.M.M.; Hartmann, L.V. Estimation of Lithium-ion Battery Model Parameters Using Experimental Data. In Proceedings of the 2017 2nd International Symposium on Instrumentation Systems, Circuits and Transducers (INSCIT), Fortaleza, Brazil, 28 August–1 September 2017. [Google Scholar]
- Sangwan, V.; Sharma, A.; Kumar, A.; Rathore, A.K. Equivalent circuit model parameters estimation of Li-ion battery: C-rate, SOC and temperature effects. In Proceedings of the 2016 IEEE International Conference on Power Electronics, Drives and Energy Systems (PEDES), Trivandrum, India, 14–17 December 2017. [Google Scholar]
- Ali, D.; Mukhopadhyay, S.; Rehman, H. A novel adaptive technique for Li-ion battery model parameters estimation. In Proceedings of the 2016 IEEE National Aerospace and Electronics Conference (NAECON) and Ohio Innovation Summit (OIS), Dayton, OH, USA, 26–29 July 2017. [Google Scholar]
- Pózna, A.I.; Magyar, A.; Hangos, K.M. Model identification and parameter estimation of lithium ion batteries for diagnostic purposes. In Proceedings of the 2017 IEEE International Symposium on Power Electronics (Ee), Novi Sad, Serbia, 19–21 October 2017. [Google Scholar]
- Barsali, S.; Ceraolo, M. Dynamical models of lead-acid batteries: Implementation issues. IEEE Trans. Energy Convers. 2002, 17, 16–23. [Google Scholar] [CrossRef]
- Ceraolo, M.; Lutzemberger, G.; Huria, T. Experimentally-Determined Models for High-Power Lithium Batteries. In Proceedings of the World Congress and Exhibition SAE, Detroit, MI, USA, 4 December 2011. [Google Scholar]
- Kapoor, D.; Sodhi, P.; Keyhani, A. Estimation of Parameters for Battery Storage Models. In Proceedings of the 2014 IEEE Conference on Energy Conversion (CENCON), Johor Bahru, Malaysia, 13–14 October 2014. [Google Scholar]
- Landi, M.; PacieHo, V.; Aurilio, G.; Gallo, D.; Landi, C.; Luiso, M.; Rosano, A. A Battery Equivalent-Circuit Model and an Advanced Technique for Parameter Estimation. In Proceedings of the IEEE International Instrumentation and Measurement Technology Conference (I2MTC), Pisa, Italy, 11–14 May 2015. [Google Scholar]
- Ciortea, F.; Hintea, S.; Gatea, C.; Nemes, M. Measurement method and parametric modeling of LiFePO4 cell for SOC estimation in EVs. In Proceedings of the International Conference on Optimization of Electrical and Electronic Equipment (OPTIM), Intl Aegean Conference on Electrical Machines and Power Electronics (ACEMP), Brasov, Romania, 25–27 May 2017. [Google Scholar]
- Lashway, C.R.; Mohammed, O.A. Adaptive Battery Management and Parameter Estimation Through Physics-Based Modeling and Experimental Verification. IEEE Trans. Transp. Electrification 2016, 2, 454–464. [Google Scholar] [CrossRef]
- Cheng, P.; Zhou, Y.; Song, Z. Modeling and SOC estimation of LiFePO4 battery. In Proceedings of the IEEE International Conference on Robotics and Biomimetics (ROBIO), Qingdao, China, 3–7 December 2016. [Google Scholar]
- Wang, D.; Bao, Y.; Shi, J. Online Lithium-Ion Battery Internal Resistance Measurement Application in State-of-Charge Estimation Using the Extended Kalman Filter. Energies 2017, 10, 1284. [Google Scholar] [CrossRef]
- Jackey, R.; Saginaw, M.; Sanghvi, P.; Gazzarr, J. Battery Model Parameter Estimation Using a Layered Technique: An Example Using a Lithium Iron Phosphate Cell. SAE International 2013. [Google Scholar] [CrossRef]
- Li, S.; Liao, C.; Wang, L. Research progress of equivalent circuit models for SOC estimation of batteries in electric vehicles. In Proceedings of the IEEE Conference and Expo Transportation Electrification Asia-Pacific (ITEC Asia-Pacific), Beijing, China, 31 August–3 September 2014. [Google Scholar]
- VEECO-Website. Available online: http://veeco.pt/en/index.html (accessed on 29 December 2017).
- Rodeia, N. Desenvolvimento do Sistema de Tracção de um Veículo Eléctrico Ecológico com Travagem Regenerativa. Master’s Thesis, Electrical Engineering Department, Instituto Superior de Engenharia de Lisboa, Polytechnic Institute of Lisbon, Lisbon, Portugal, December 2011. (In Portuguese). [Google Scholar]
Figure 1.
Charge and discharge voltages at 0.25 C in dependence of SOC for the NMC1 battery.
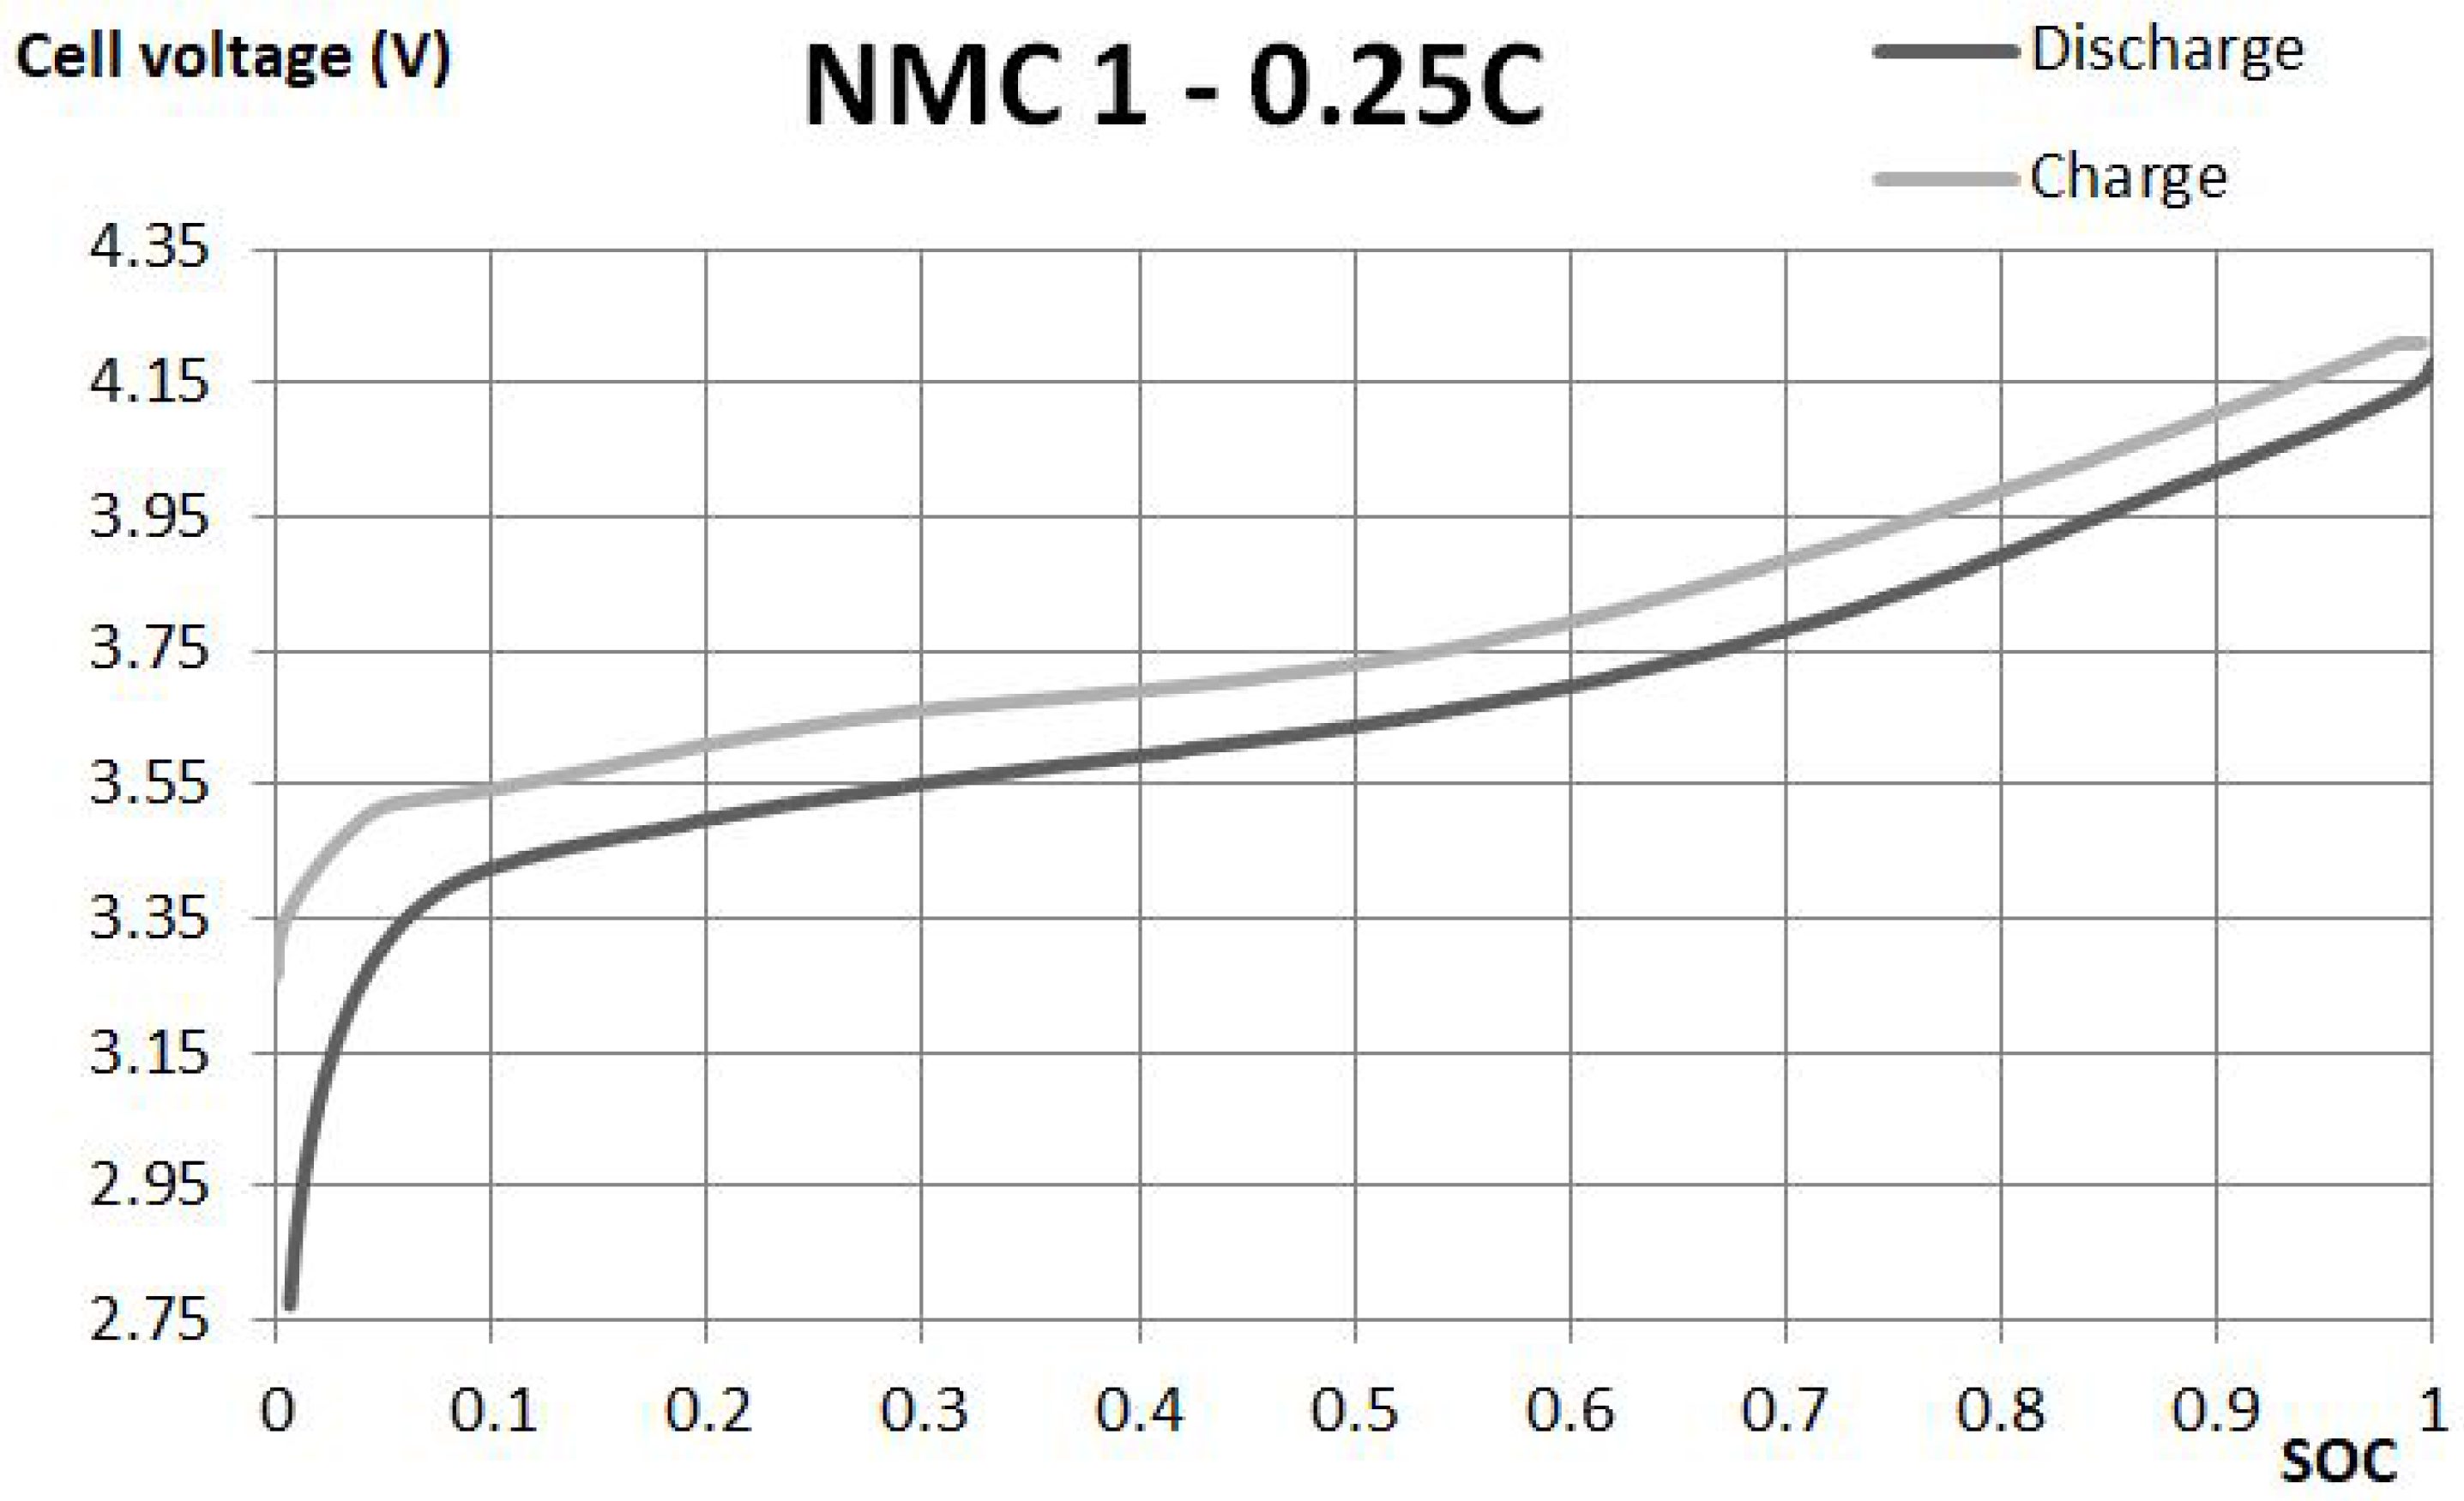
Figure 2.
Charge and discharge voltages at 0.15 C in dependence of SOC for the NMC2 battery.
Figure 3.
Dependency between the voltage of the NMC1 cell and time during pulse discharge tests.
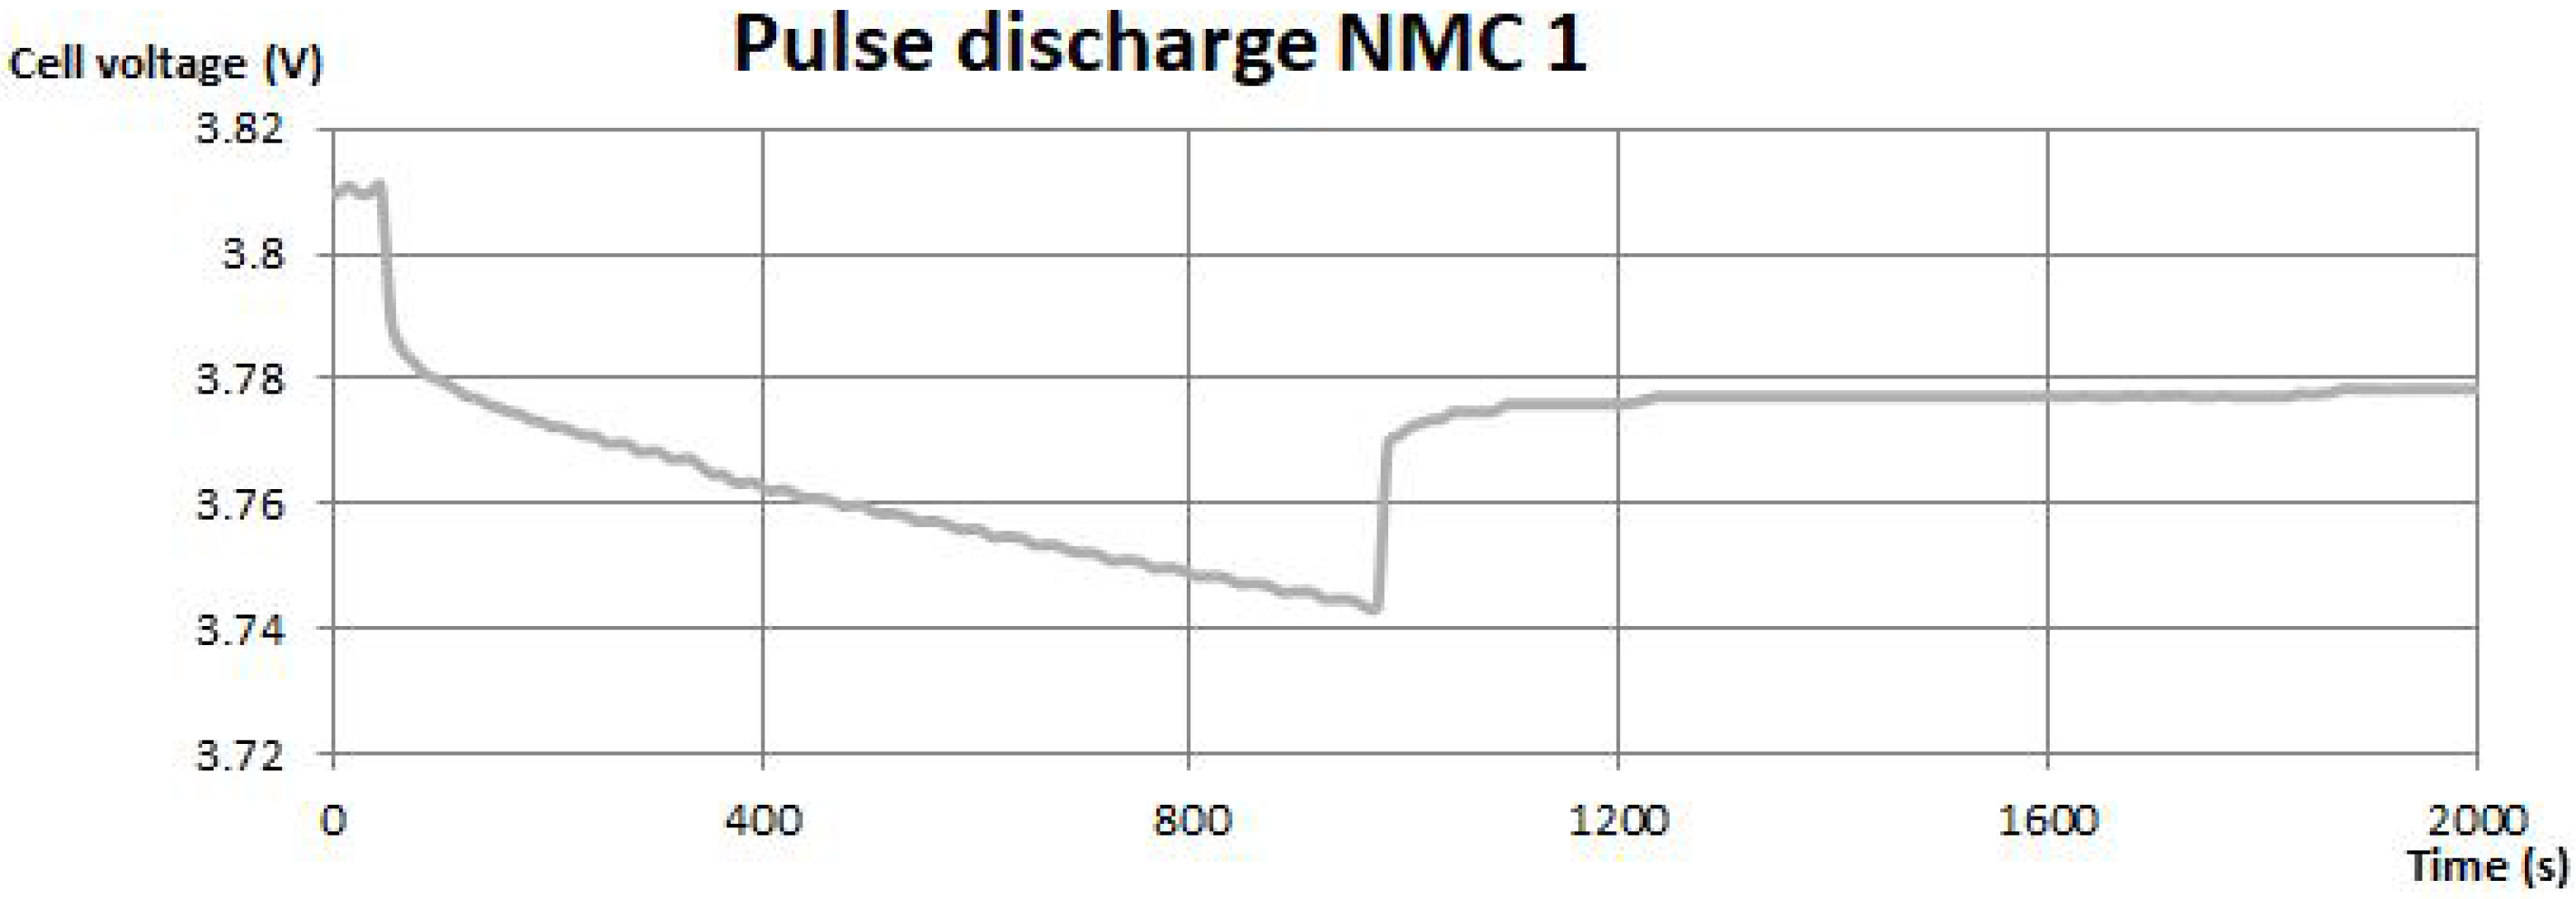
Figure 4.
Dependency between the voltage of the NMC2 cell and time during pulse discharge tests.
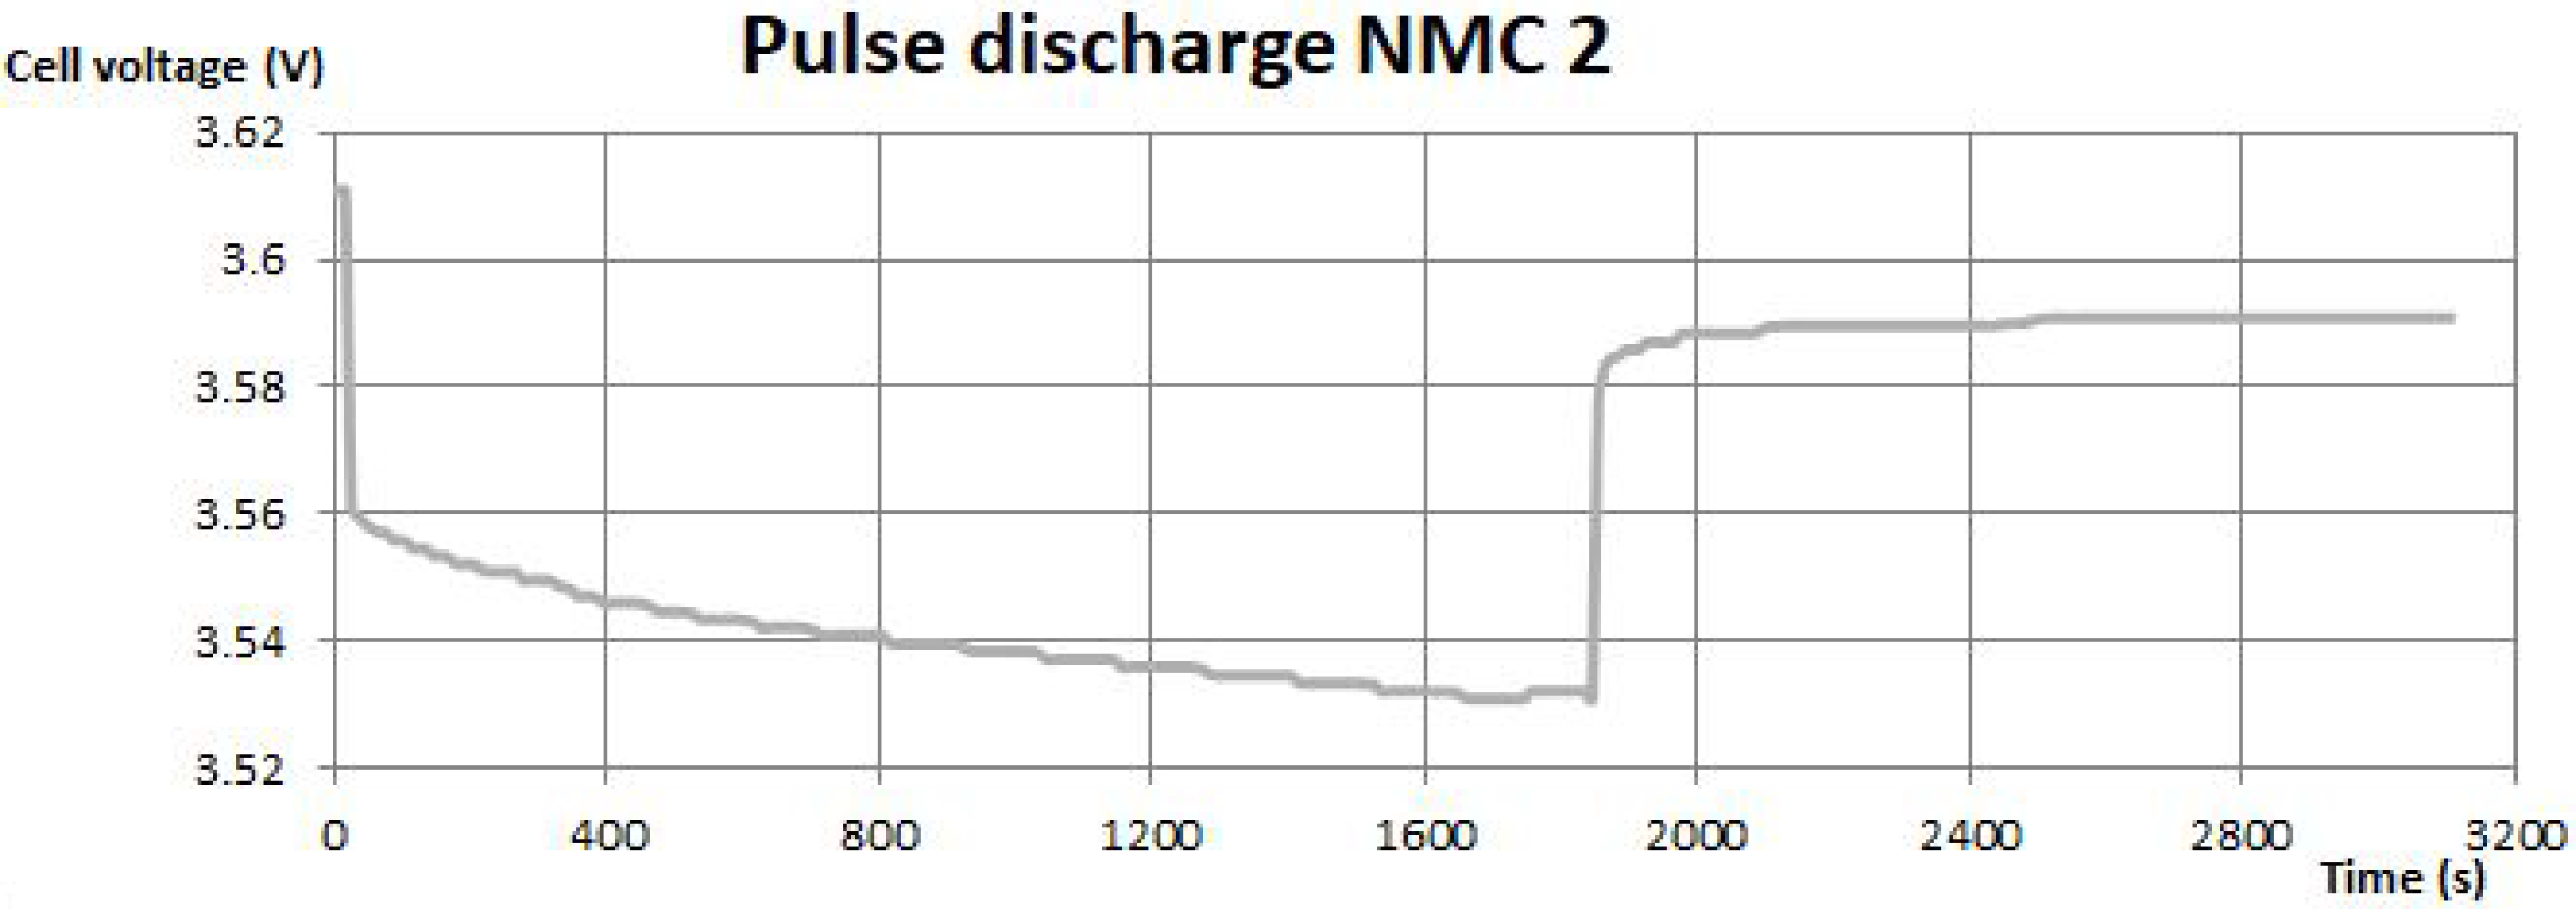
Figure 5.
Proposed model arrangement.
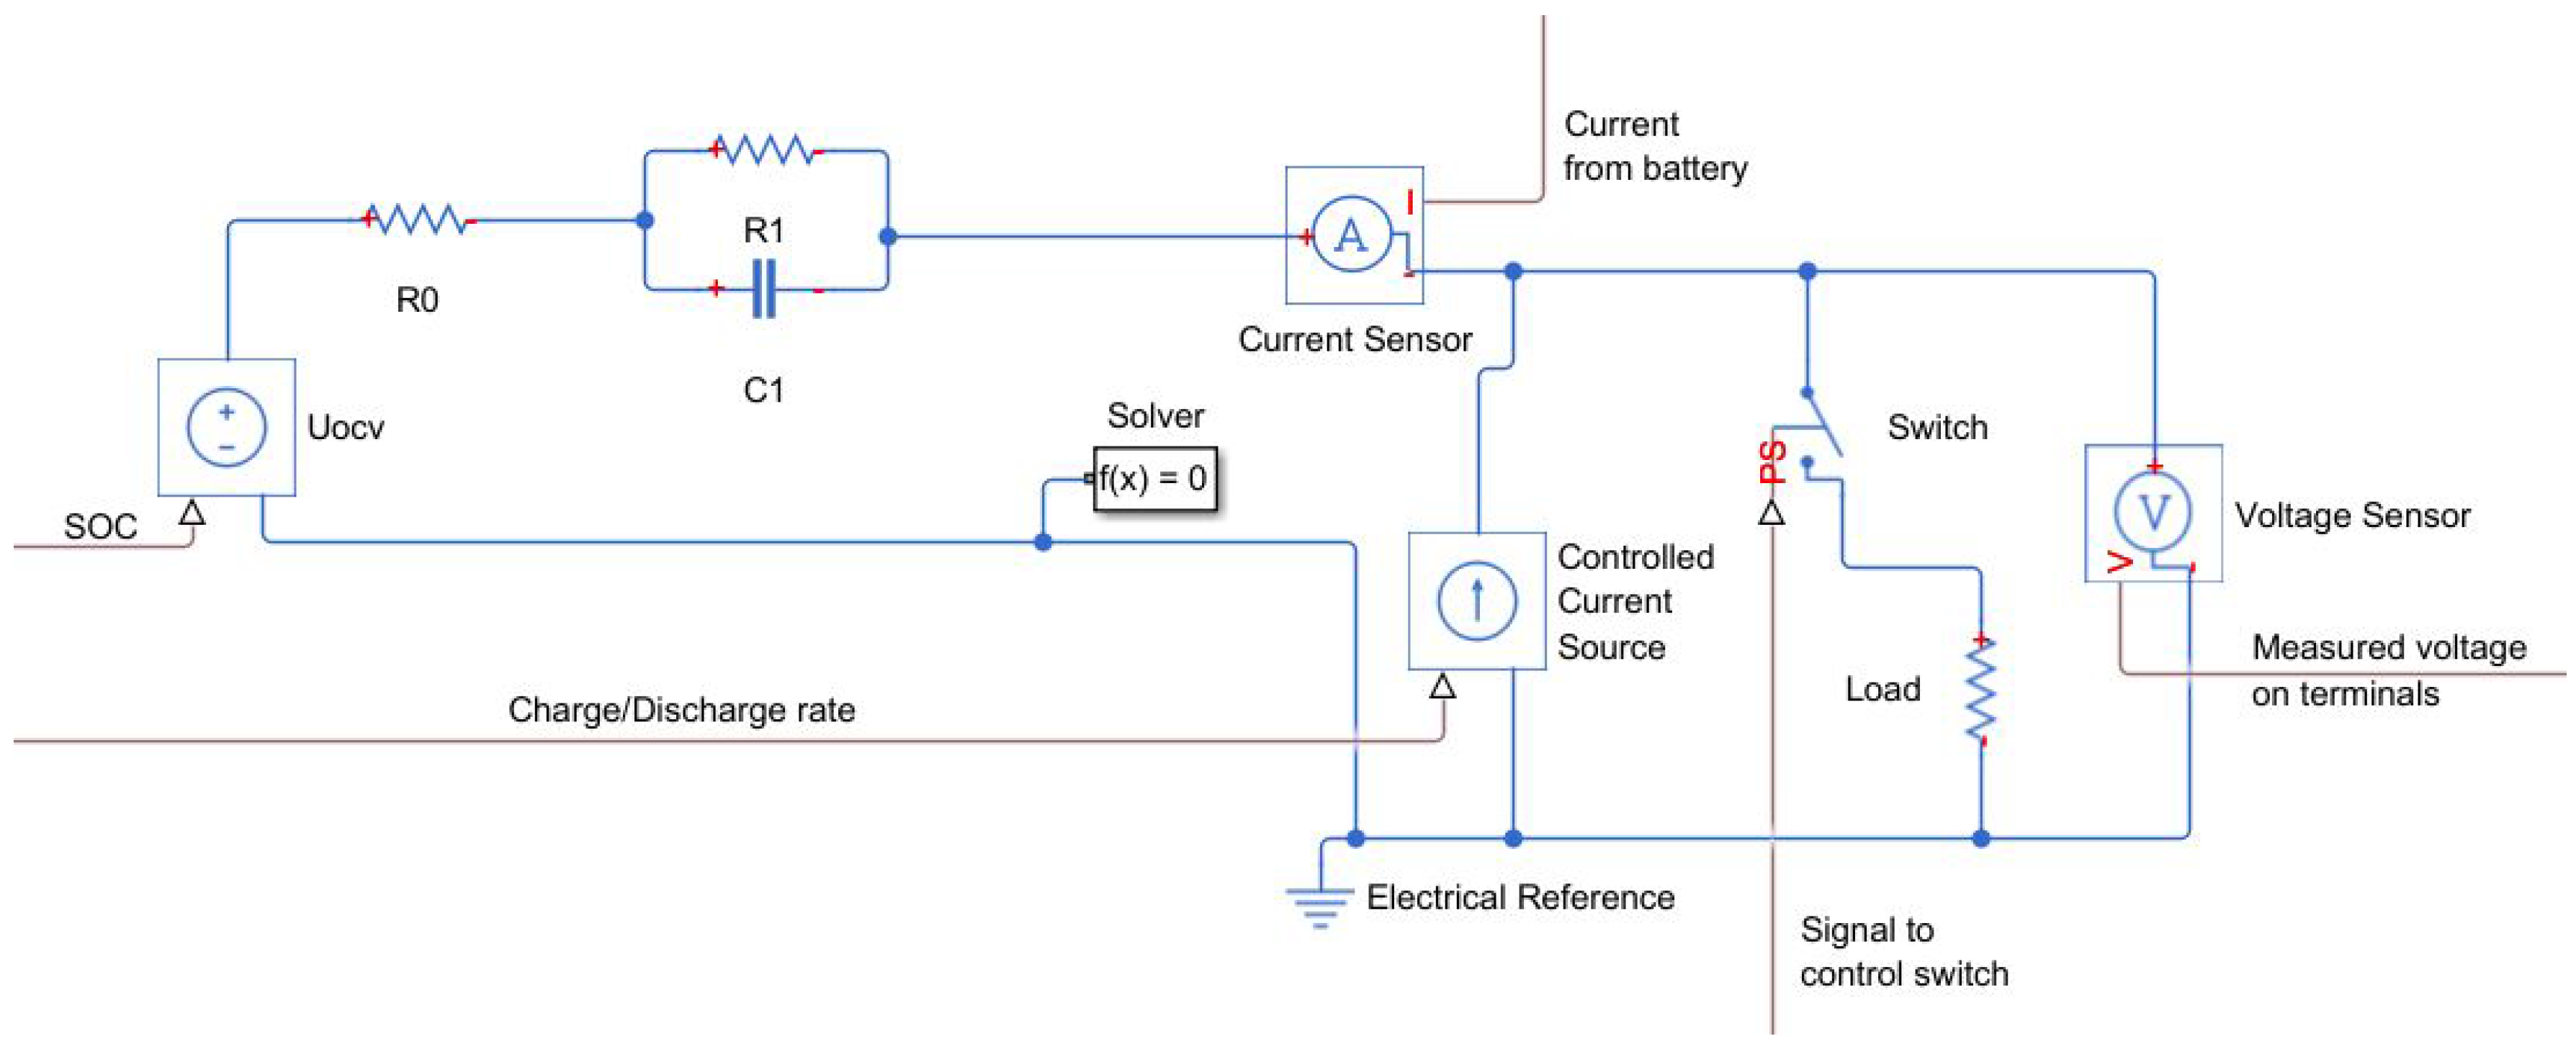
Figure 6.
Comparison between the model and NMC1 during the discharge process performed with 0.1 C. The blue curve is the real discharge process measured on the workstation. The red curve presents the model response in the same case.
Figure 6.
Comparison between the model and NMC1 during the discharge process performed with 0.1 C. The blue curve is the real discharge process measured on the workstation. The red curve presents the model response in the same case.

Figure 7.
Relative error of the model.
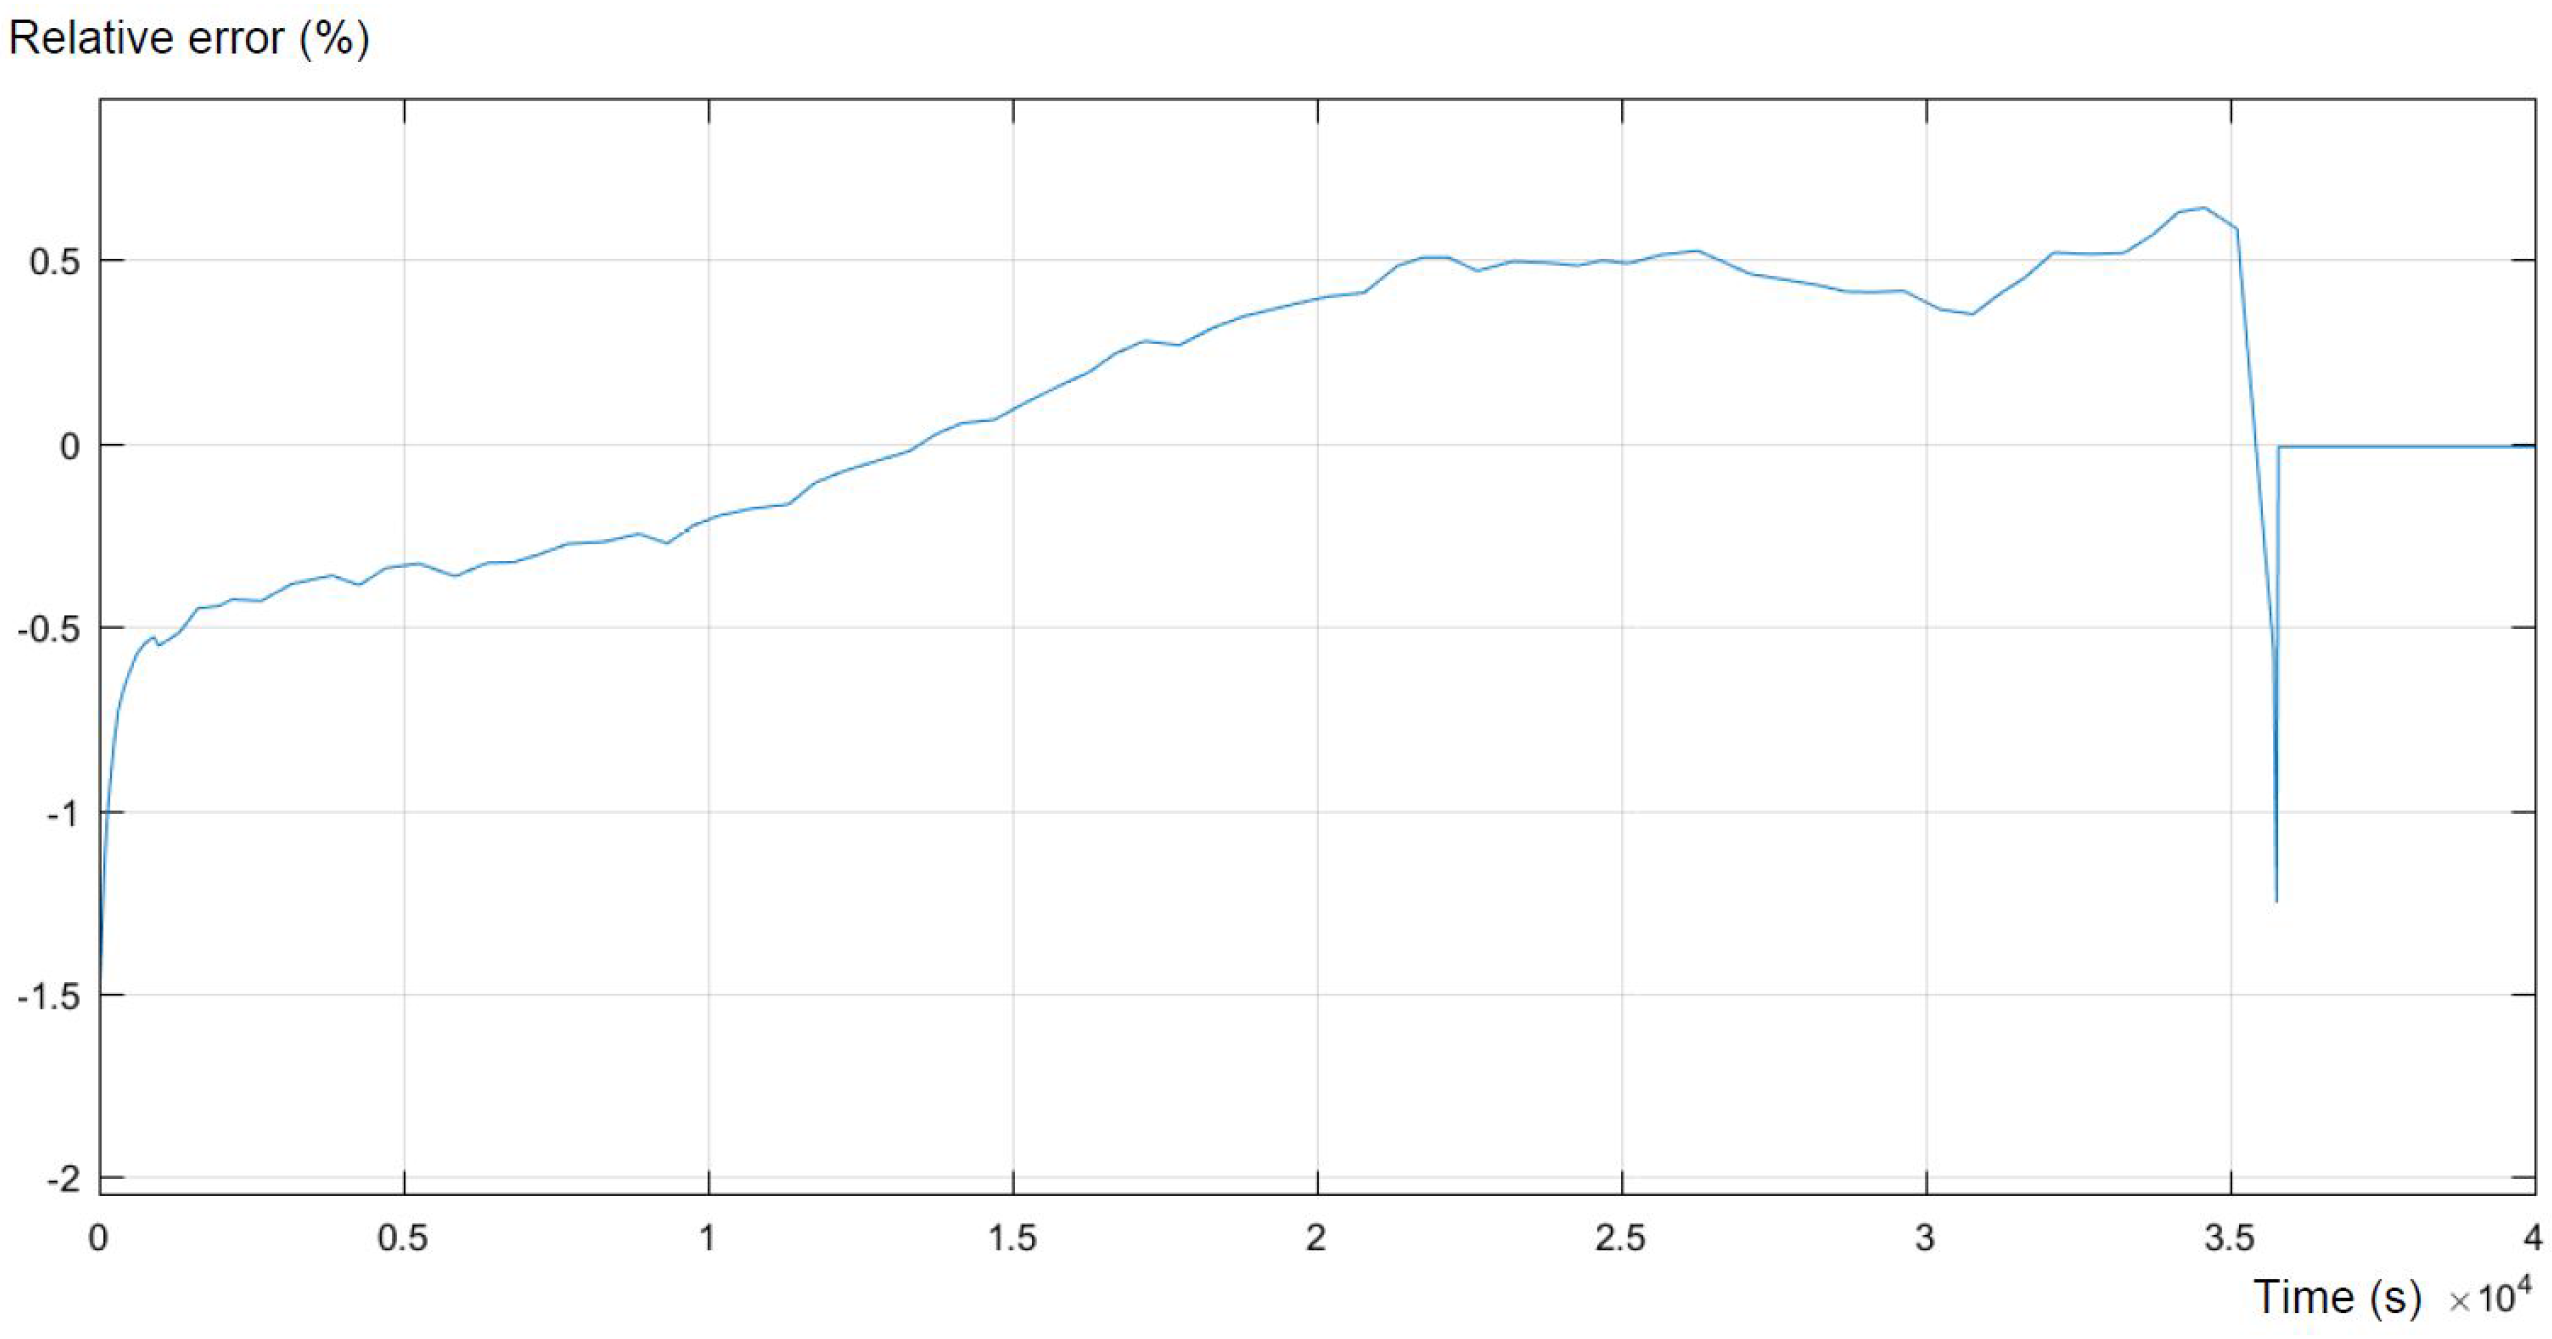
Figure 8.
Comparison between the model and NMC1 during pulse discharge tests. The blue curve is the real pulse discharge process measured on the workstation. The red curve presents the model response in the same case.
Figure 8.
Comparison between the model and NMC1 during pulse discharge tests. The blue curve is the real pulse discharge process measured on the workstation. The red curve presents the model response in the same case.
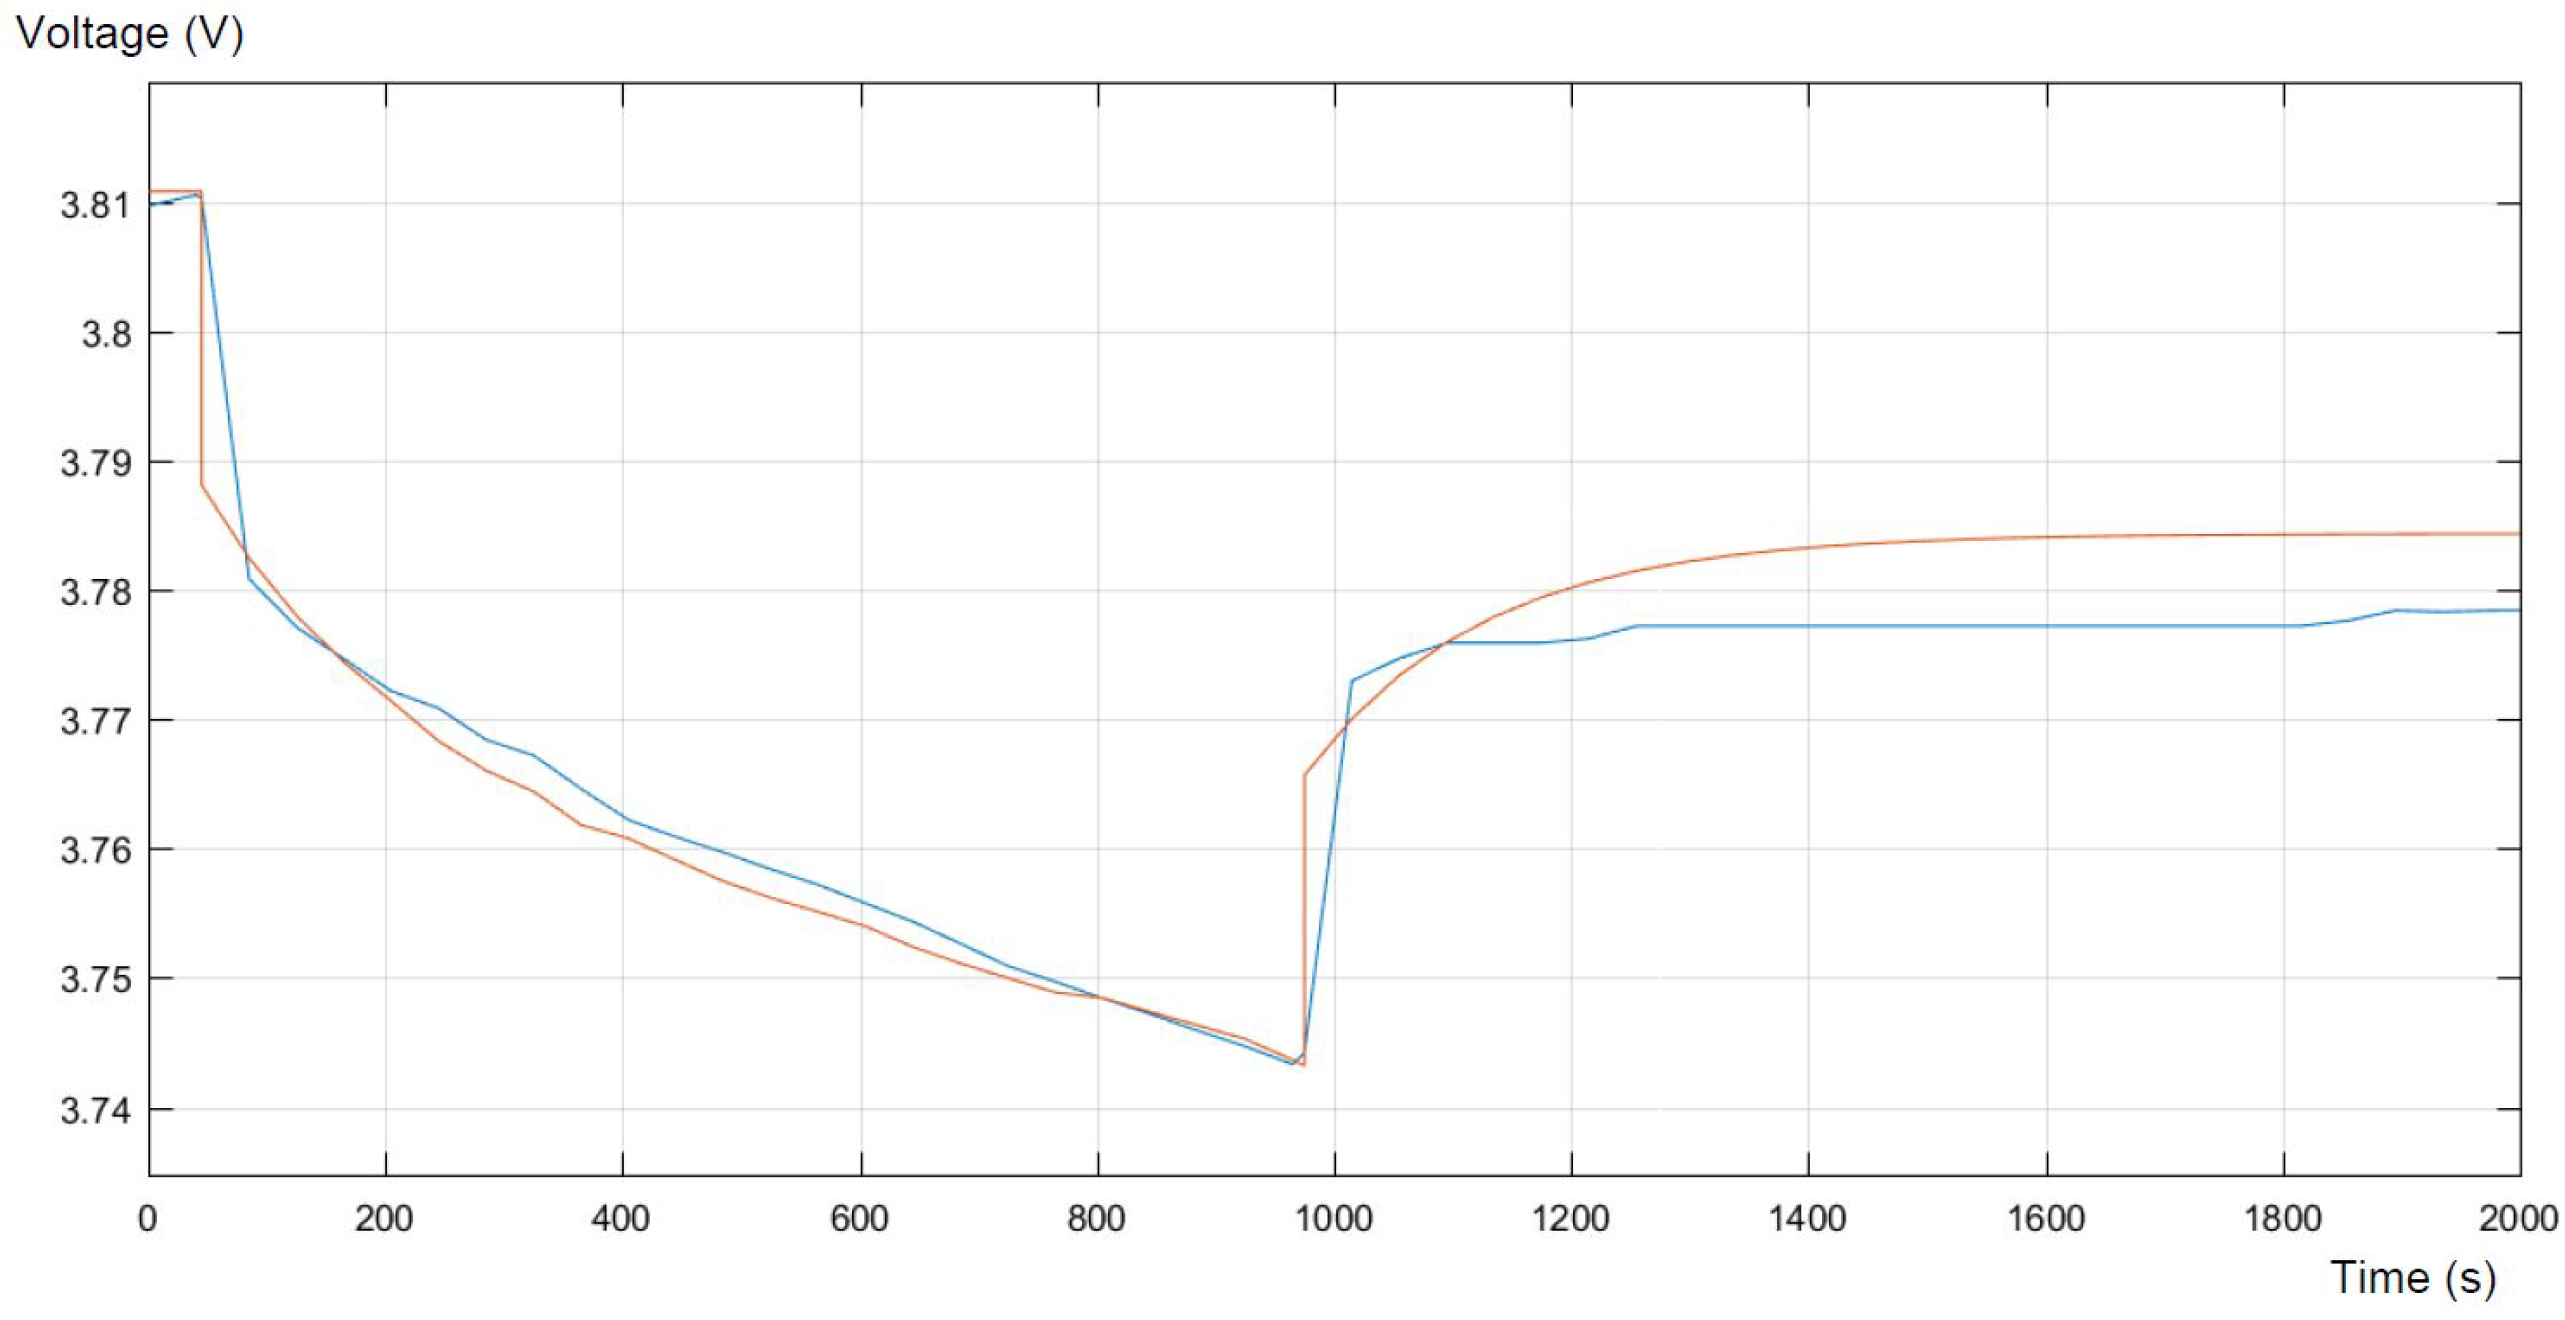
Figure 9.
Relative error of the model.
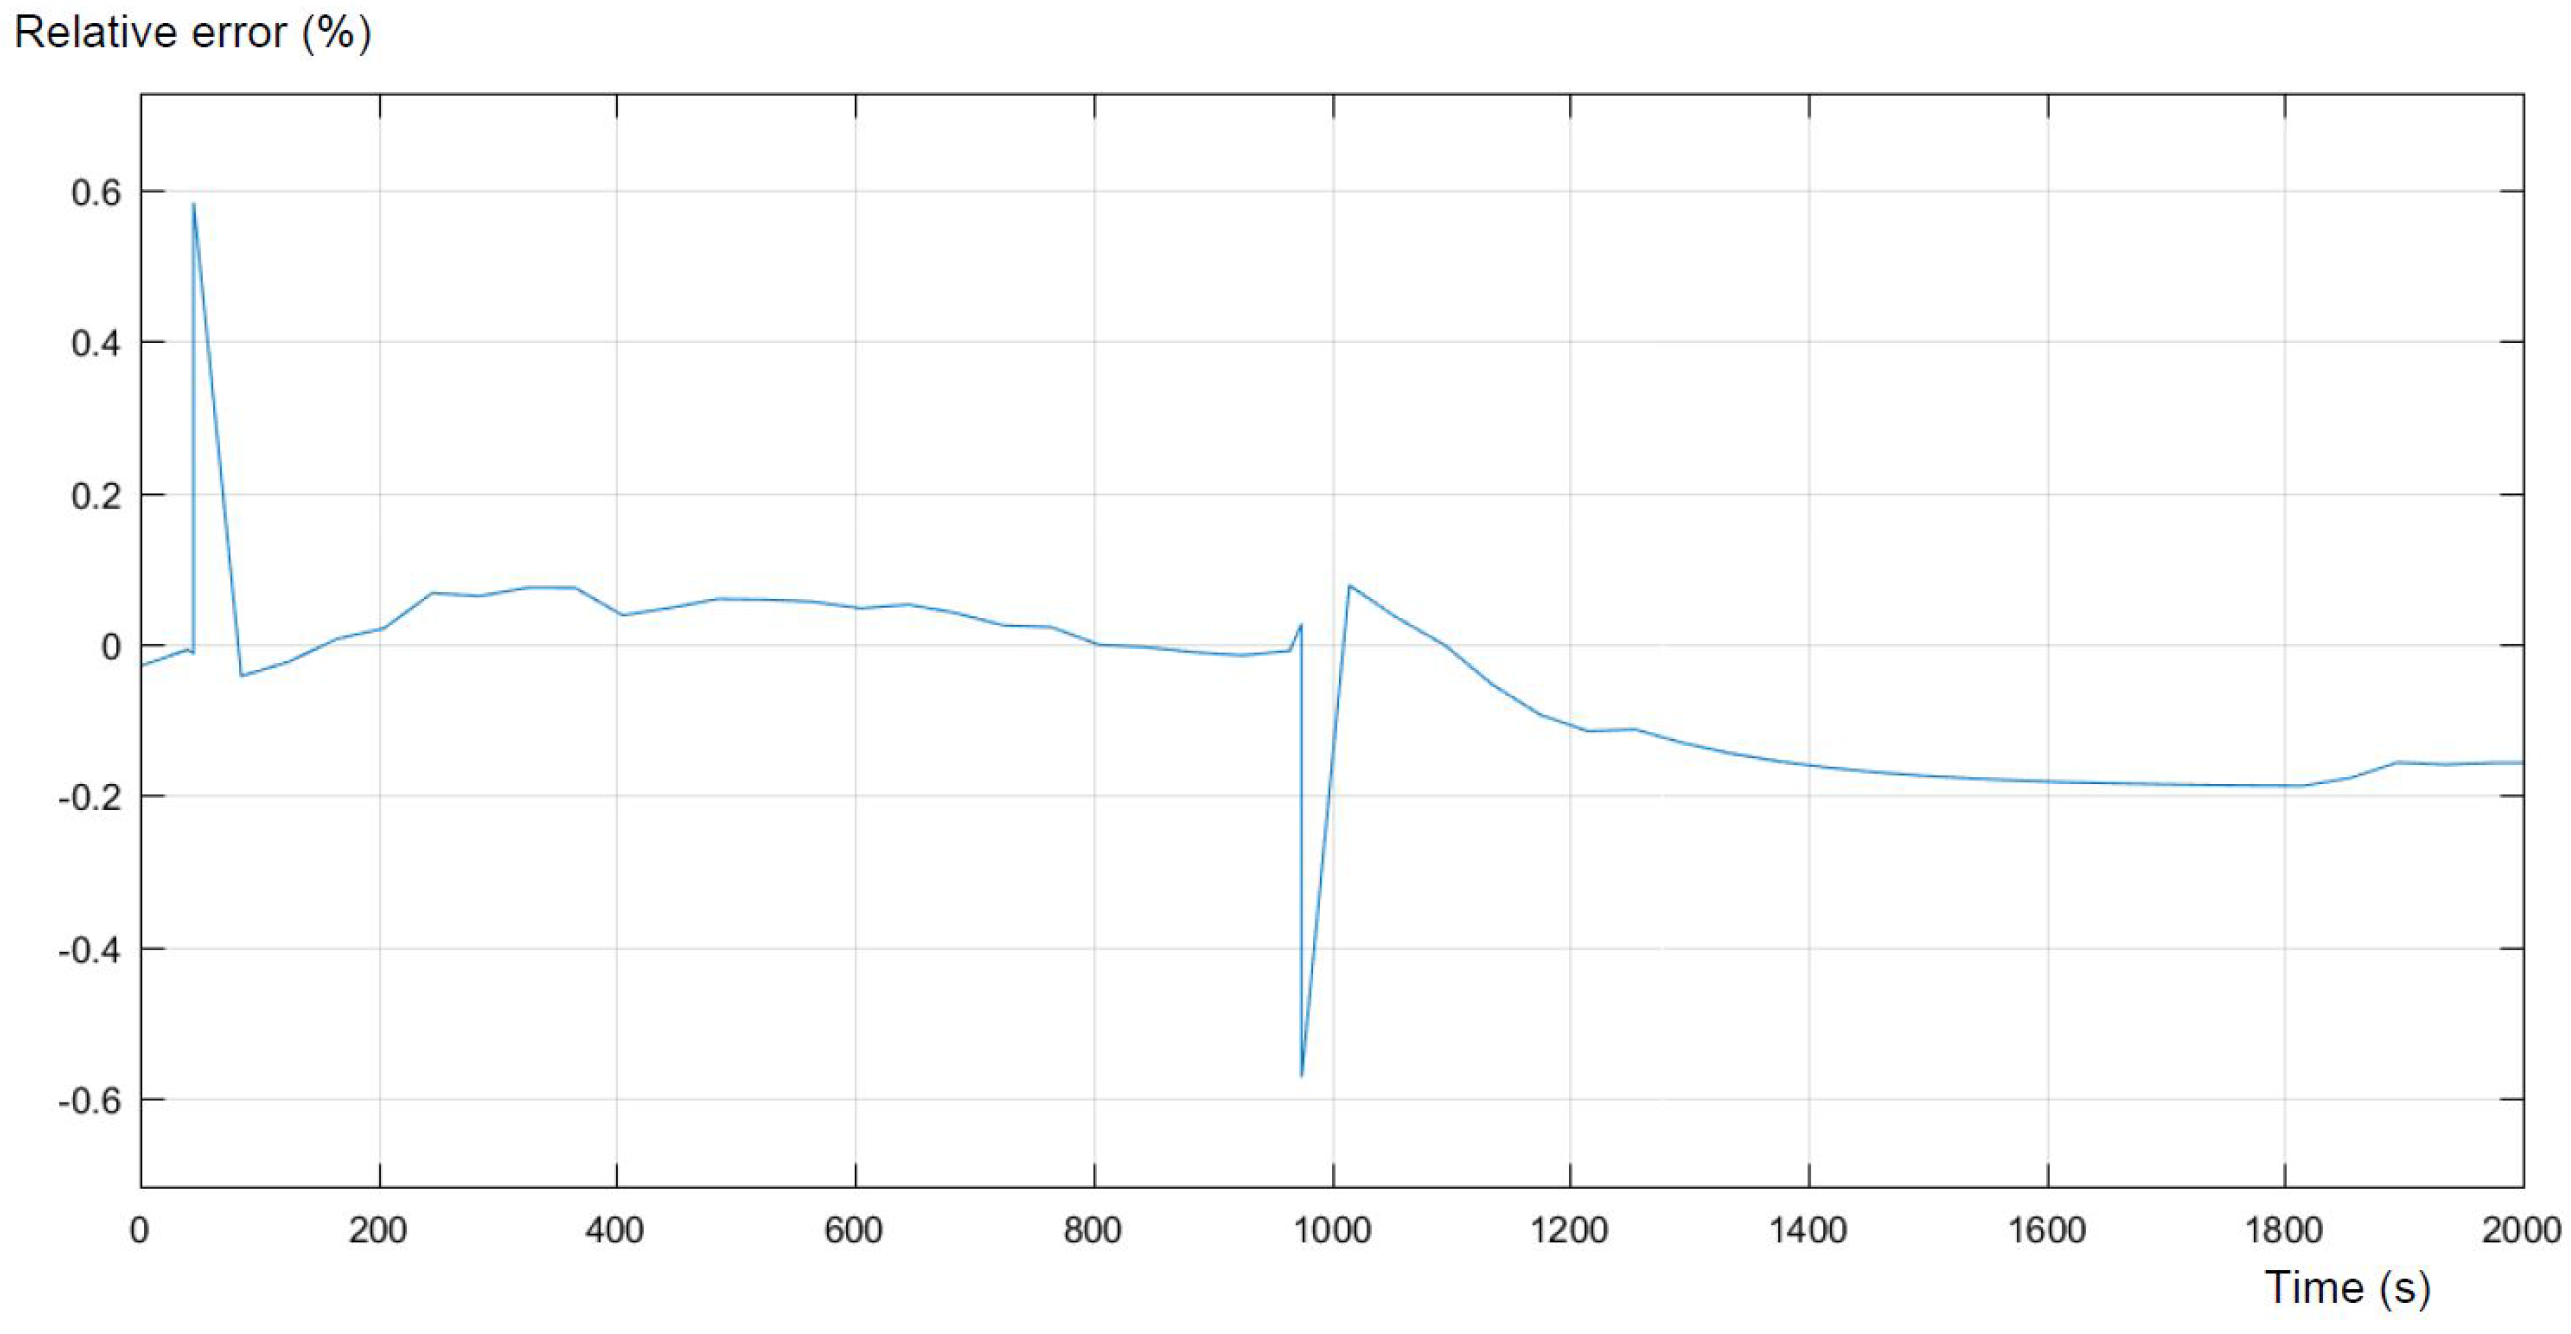
Figure 10.
Comparison between the response of the model and experimental results from the discharge process performed with 0.1 C. The blue curve is the real, measured discharge process. The red curve presents the model response in the same case.
Figure 10.
Comparison between the response of the model and experimental results from the discharge process performed with 0.1 C. The blue curve is the real, measured discharge process. The red curve presents the model response in the same case.
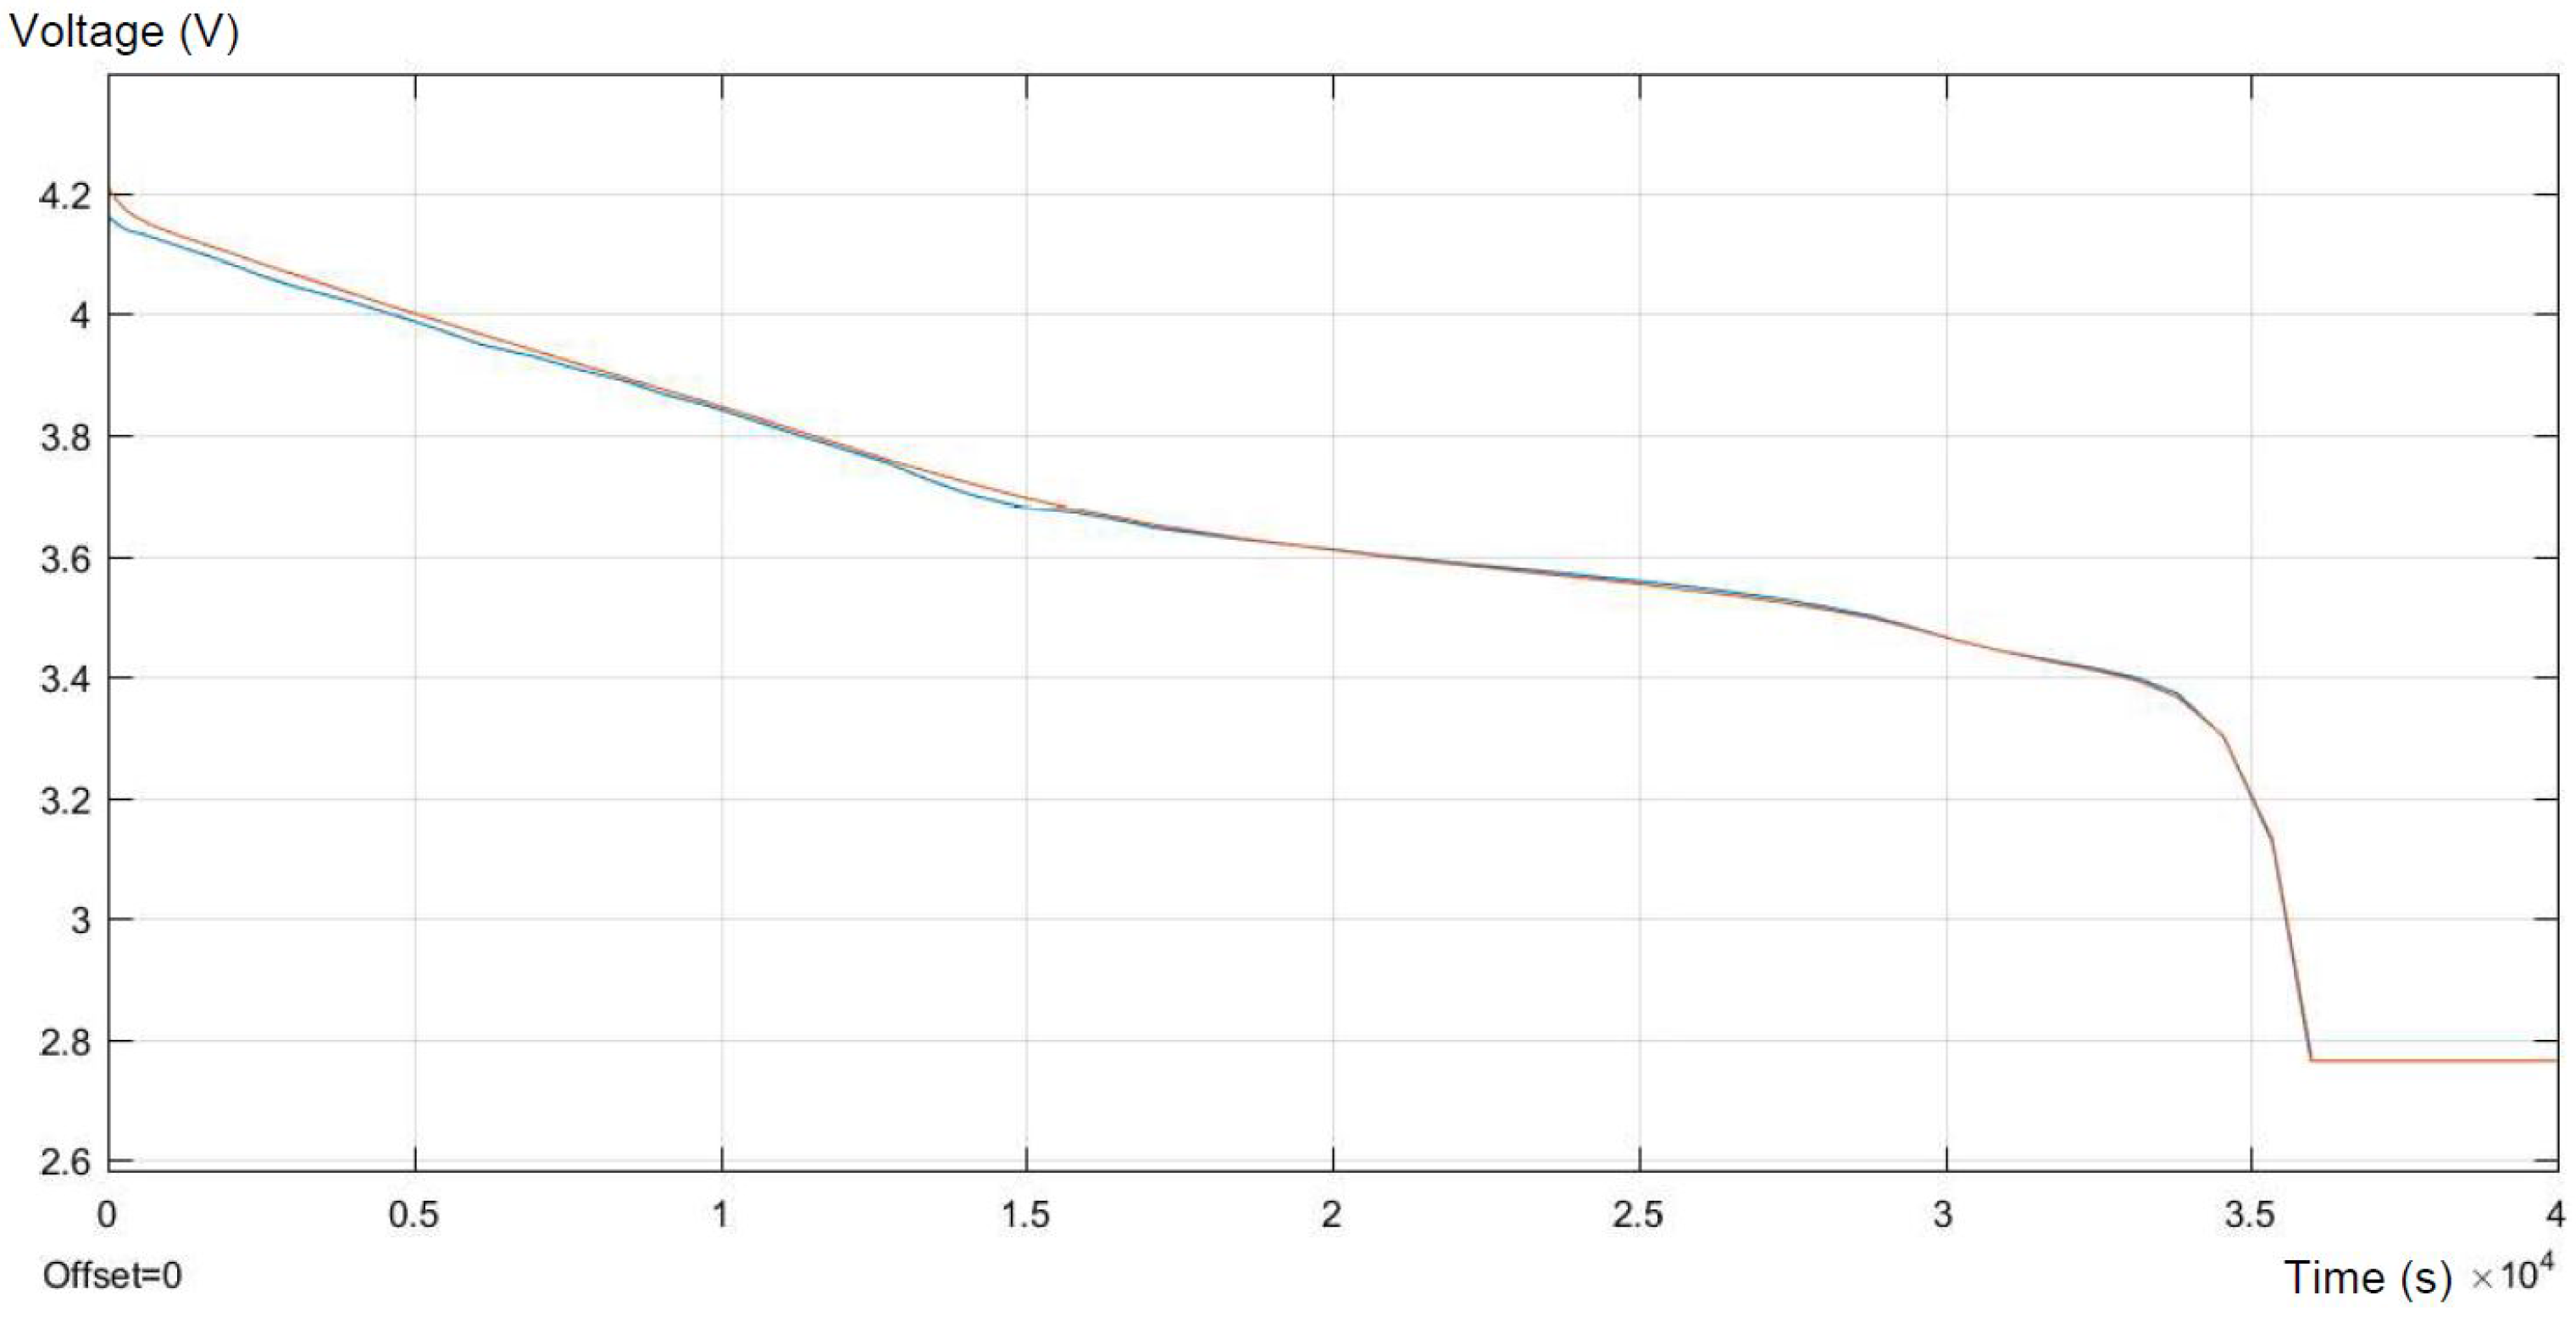
Figure 11.
Relative error of the model.
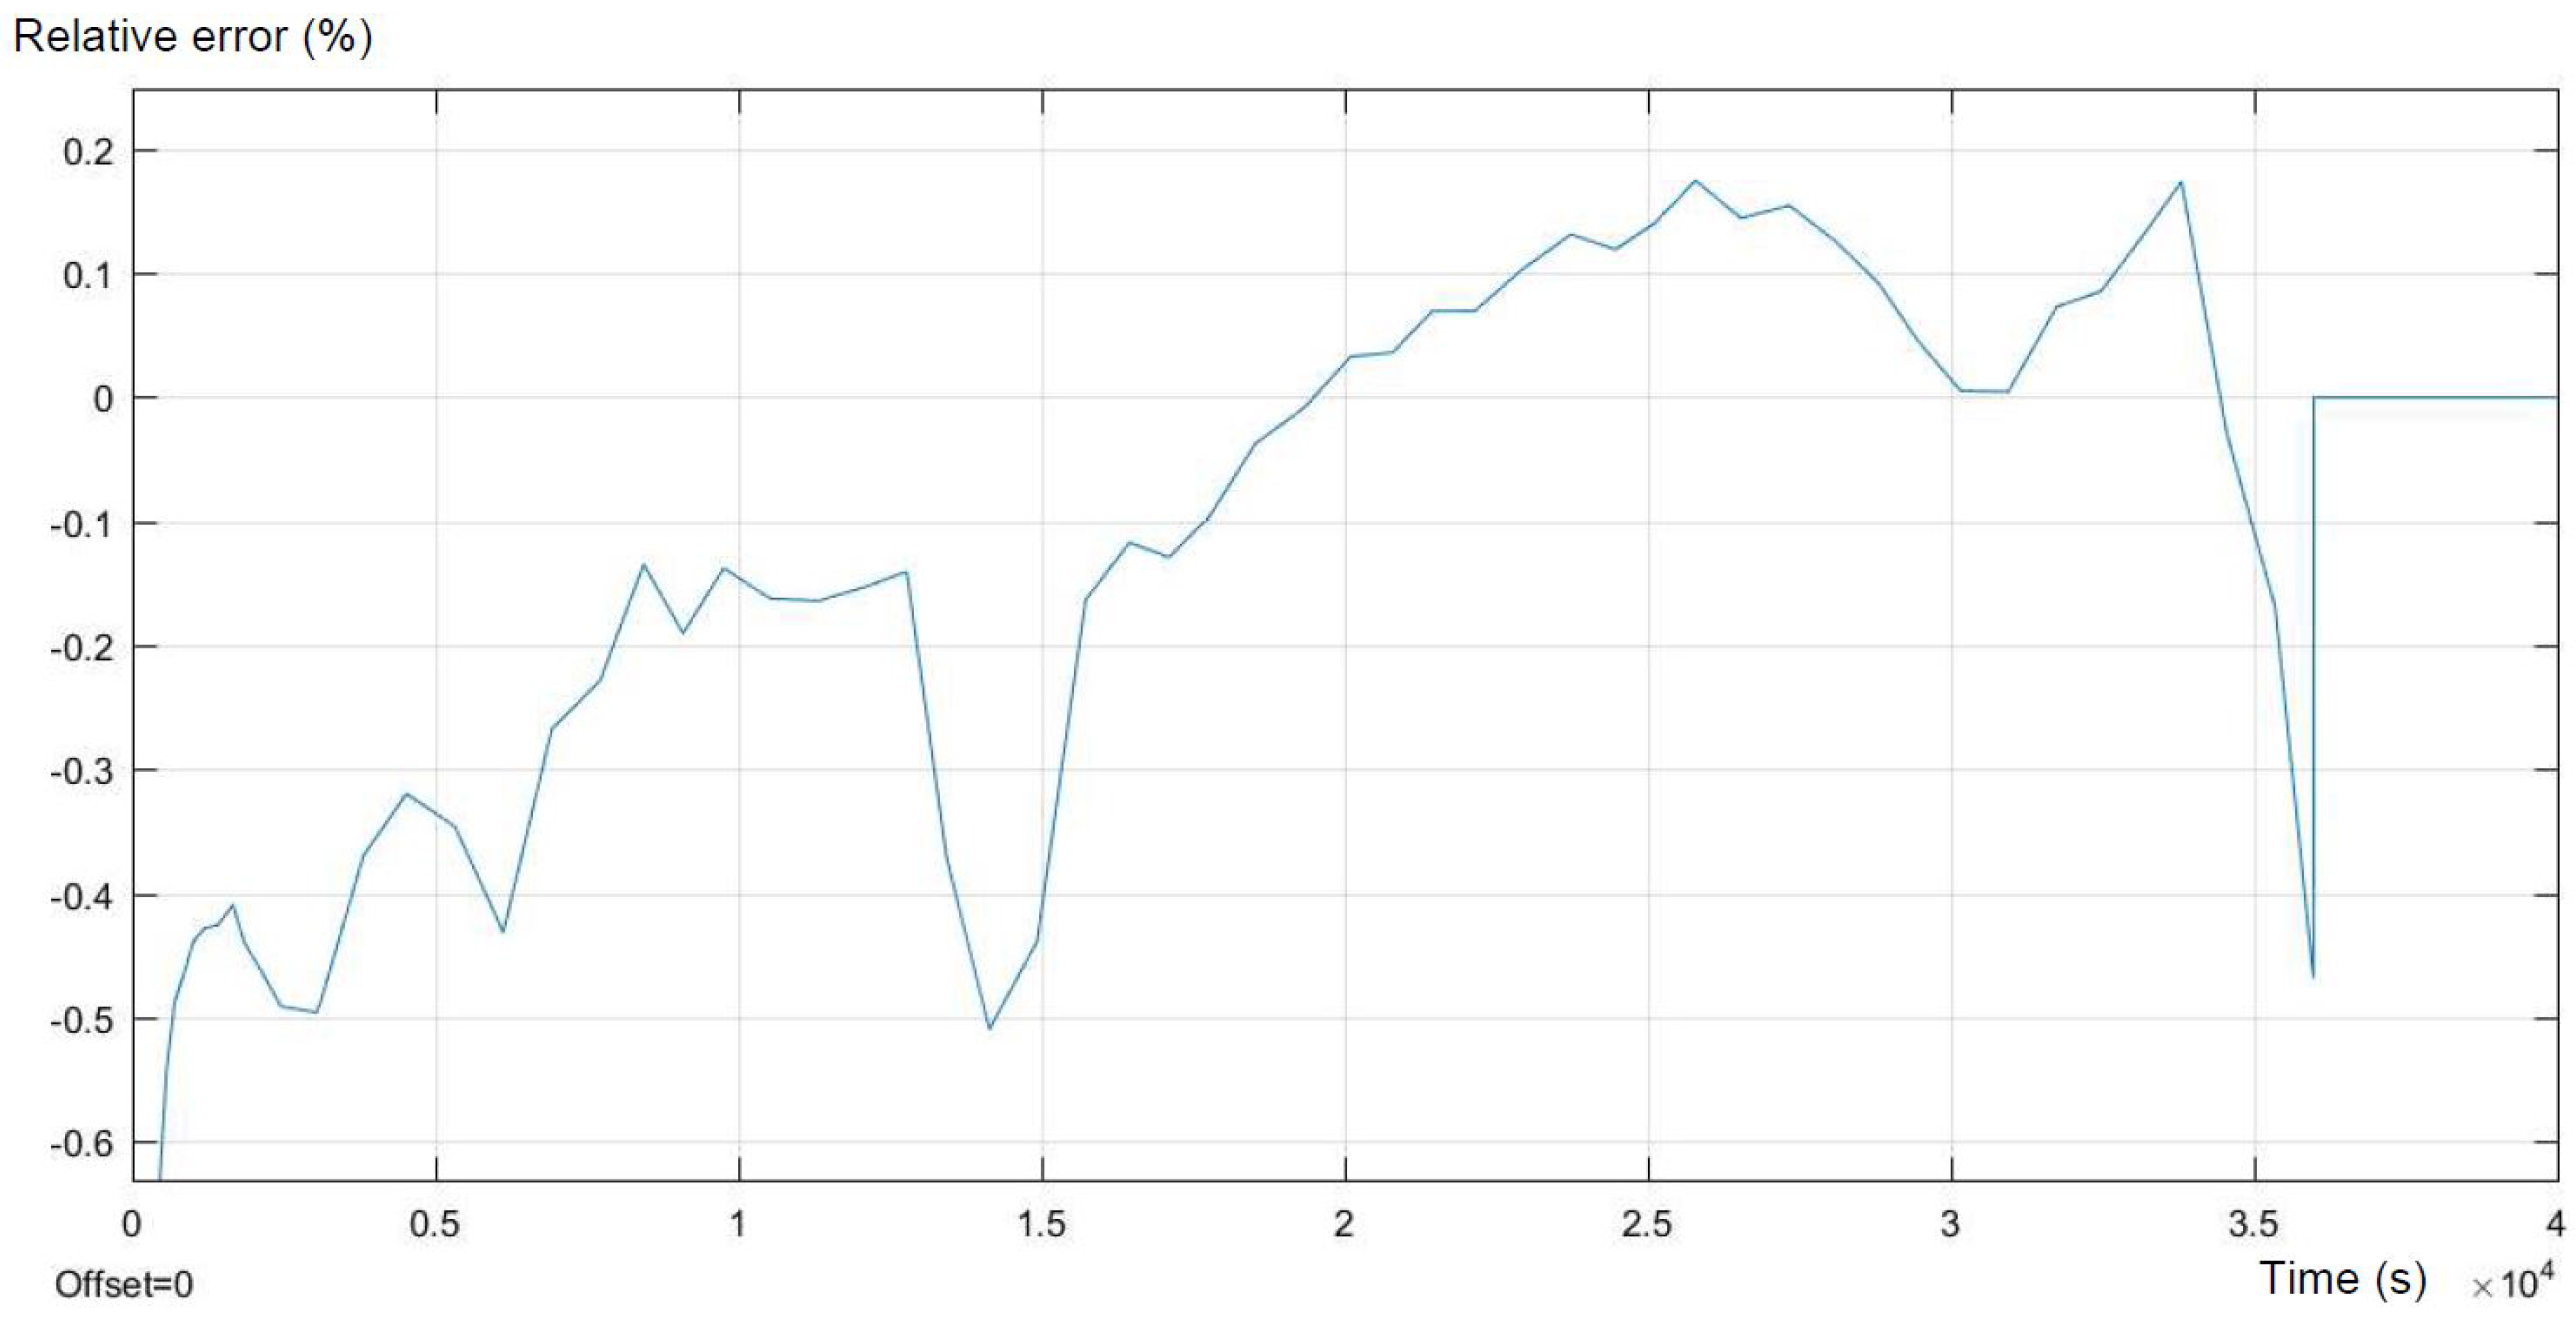
Figure 12.
Comparison of the model response and experimental results from the discharge process performed with a 0.1 C-rate. The blue curve is the real pulse discharge process measured on the workstation. The red curve presents the model response in the same case.
Figure 12.
Comparison of the model response and experimental results from the discharge process performed with a 0.1 C-rate. The blue curve is the real pulse discharge process measured on the workstation. The red curve presents the model response in the same case.
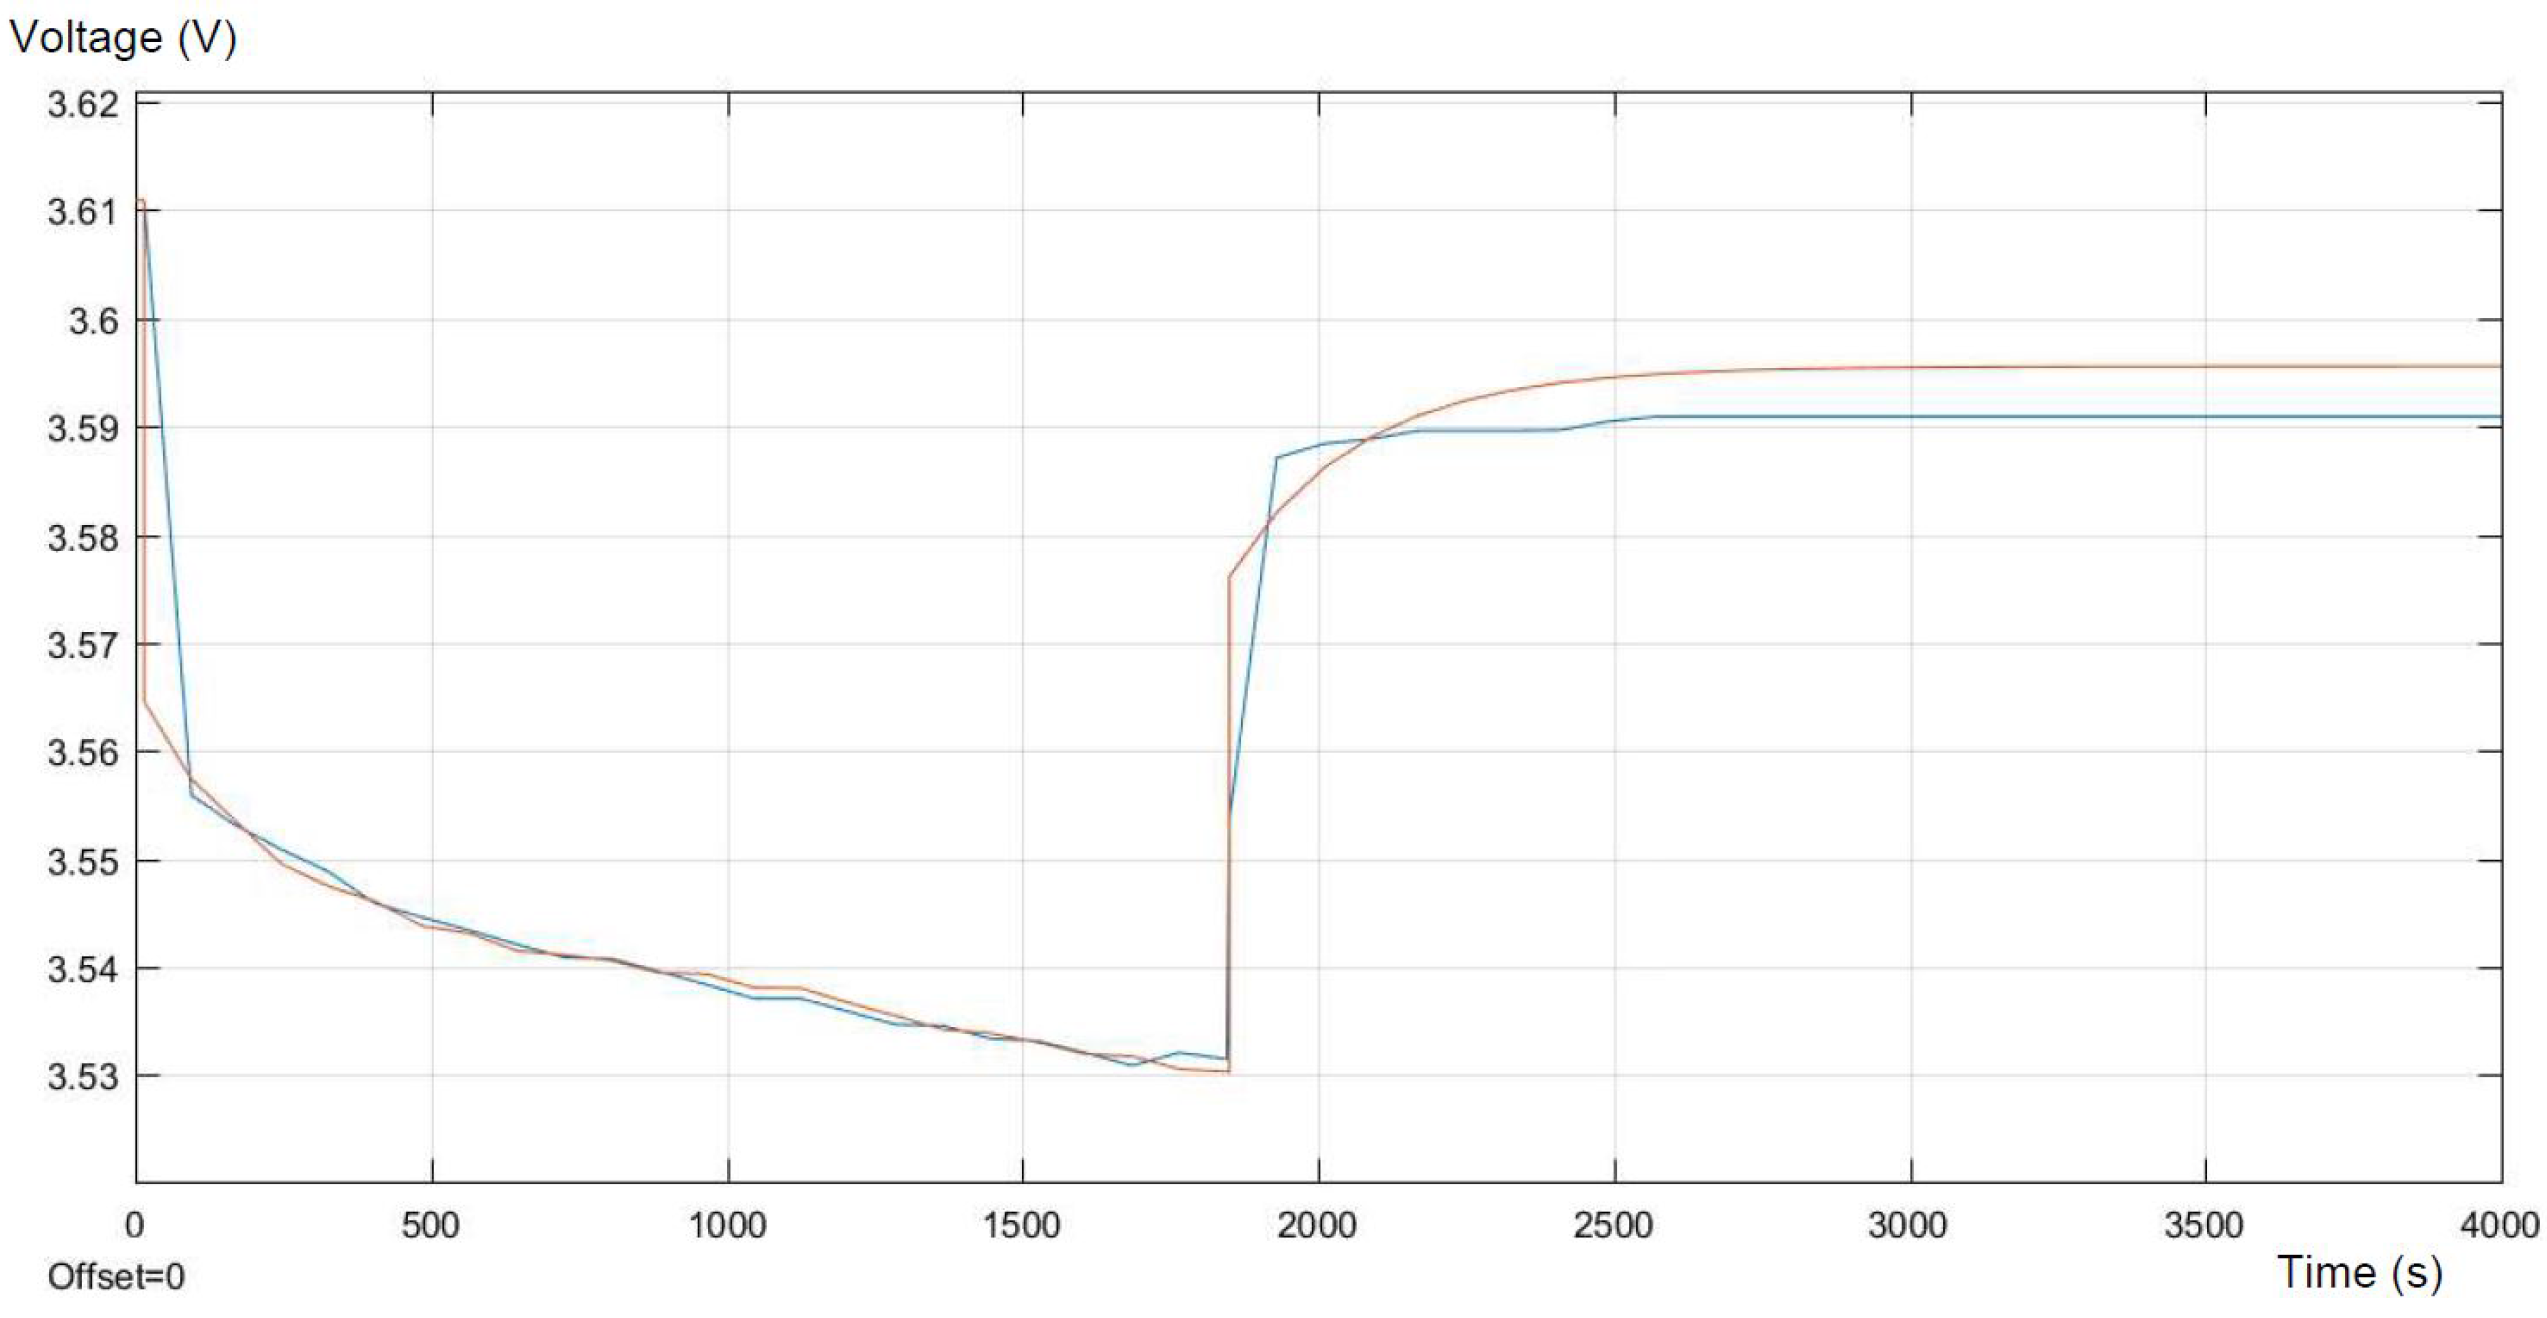
Figure 13.
Relative error of the model.
Figure 14.
Model of the electric car VEECO. (a) Main component layout; (b) the VEECO RT.


Table 1.
Specification of tested batteries.
| Parameter | NMC1 | NMC2 |
|---|---|---|
| Capacity (Ah) | 37 | 60 |
| Nominal Voltage (V) | 3.6 | 3.65 |
| Max Charging Current (C) | 2 (74 A) | 1 (60 A) |
| Charge Cut-Off Voltage (V) | 4.2 | 4.2 |
| Max Discharging Current (C) | 3 (111 A) | 3 (180 A) |
| Discharge Cut-Off Voltage (V) | 2.75 | 2.75 |
| Standard Current (C) | 0.5 (18.5 A) | 0.5 (30 A) |
| Dimensions (Thickness/Width/Length) (mm) | 7.4/212/269 | 14/98/300 |
| Model No. | IXP74/212/269PA | LG60AH-3.6 V/60 Ah |
Table 2.
Parameters of the equivalent circuit.
| Parameter | NMC1 | NMC2 |
|---|---|---|
| Internal Resistance R (m) | 6 | 13 |
| Resistance R (m) | 5 | 5.5 |
| Capacitance C (kF) | 30 | 40 |
Table 3.
Specification of the LiFePO battery used in VEECO RT [15].
Table 3.
Specification of the LiFePO battery used in VEECO RT [15].
| Parameter | LiFePO |
|---|---|
| Capacity (Ah) | 160 |
| Nominal Voltage (V) | 3.2 |
| Max Charging Current (C) | 3 (480 A) |
| Charge Cut-Off Voltage (V) | 4.0 |
| Max Discharging Current (C) | 3 (480 A) |
| Discharge Cut-Off Voltage (V) | 2.8 |
| Standard Current (C) | 0.5 (80 A) |
| Dimensions (Thickness/Width/Length) (mm) | 65/209/280 |
Table 4.
Specification of the battery packs proposed for VEECO RT.
| LiFePO | NMC1 | NMC2 | |
|---|---|---|---|
| Serial Cells | 36 | 36 | 36 |
| Parallel Cells | 1 | 7 | 7 |
| Discharge Cut-Off Voltage (V) | 100.8 | 99.0 | 99.0 |
| Charge Cut-Off Voltage (V) | 144.0 | 151.2 | 151.2 |
| Capacity (Ah) | 160 | 259 | 420 |
| Capacity (kWh) | 18.4 | 33.6 | 55.2 |
| Weight (kg) | 201.6 | 209.2 | 206.6 |
| Volume (m) | 0.137 | 0.106 | 0.104 |
| Range (km) | 205 | 373 | 613 |
© 2018 by the authors. Licensee MDPI, Basel, Switzerland. This article is an open access article distributed under the terms and conditions of the Creative Commons Attribution (CC BY) license (http://creativecommons.org/licenses/by/4.0/).
Share and Cite
MDPI and ACS Style
Baczyńska, A.; Niewiadomski, W.; Gonçalves, A.; Almeida, P.; Luís, R. Li-NMC Batteries Model Evaluation with Experimental Data for Electric Vehicle Application. Batteries 2018, 4, 11. https://doi.org/10.3390/batteries4010011
AMA Style
Baczyńska A, Niewiadomski W, Gonçalves A, Almeida P, Luís R. Li-NMC Batteries Model Evaluation with Experimental Data for Electric Vehicle Application. Batteries. 2018; 4(1):11. https://doi.org/10.3390/batteries4010011
Chicago/Turabian StyleBaczyńska, Aleksandra, Waldemar Niewiadomski, Ana Gonçalves, Paulo Almeida, and Ricardo Luís. 2018. "Li-NMC Batteries Model Evaluation with Experimental Data for Electric Vehicle Application" Batteries 4, no. 1: 11. https://doi.org/10.3390/batteries4010011
Note that from the first issue of 2016, this journal uses article numbers instead of page numbers. See further details here.