Effects of Alkaline Pre-Etching to Metal Hydride Alloys


1
BASF/Battery Materials–Ovonic, 2983 Waterview Drive, Rochester Hills, MI 48309, USA
2
Department of Chemical Engineering and Materials Science, Wayne State University, Detroit, MI 48202, USA
*
Author to whom correspondence should be addressed.
Batteries 2017, 3(4), 30; https://doi.org/10.3390/batteries3040030
Submission received: 10 September 2017
/
Revised: 28 September 2017
/
Accepted: 29 September 2017
/
Published: 5 October 2017
(This article belongs to the Special Issue Nickel Metal Hydride Batteries 2017)
Abstract
:The responses of one AB5, two AB2, four A2B7, and one C14-related body-centered-cubic (BCC) metal hydrides to an alkaline-etch (45% KOH at 110 °C for 2 h) were studied by internal resistance, X-ray diffraction, scanning electron microscope, inductively coupled plasma, and AC impedance measurements. Results show that while the etched rare earth–based AB5 and A2B7 alloys surfaces are covered with hydroxide/oxide (weight gain), the transition metal–based AB2 and BCC-C14 alloys surfaces are corroded and leach into electrolyte (weight loss). The C14-predominated AB2, La-only A2B7, and Sm-based A2B7 showed the most reduction in the internal resistance with the alkaline-etch process. Etched A2B7 alloys with high La-contents exhibited the lowest internal resistance and are suggested for use in the high-power application of nickel/metal hydride batteries.
1. Introduction
Metal hydride (MH) alloy, or hydrogen storage alloy, is a group of intermetallic alloys (IMCs) capable of storing hydrogen in the solid form [1]. One of its key applications is the rechargeable nickel/metal hydride (Ni/MH) battery, which is used widely in consumer electronics, as well as stationary and transportation energy storage areas. A large variety of IMCs have been used/proposed as the active materials in the negative electrode of Ni/MH battery, such as A2B [2], AB [3,4], AB2 [5], AB3 [6], A2B7 [7], A5B19 [8], AB5 [9], body-centered-cubic (BCC) solid solution [10], and their combinations [11,12]. These IMCs are composed of mostly transition metals (TM), and some may contain rare-earth (RE) elements. The electrochemical high-rate performances of some of these MH alloys were compared in 2010 and the RE-based AB5 MH alloy had the best high-rate dischargeability (HRD) performance [13]. The magnetic susceptibilities of these alloys, and a couple new ones, were compared in a 2013 article [14]. With several new MH alloys, especially the recently discovered superlattice A2B7-based ones with improved electrochemical properties, it is important to update the comparison results.
A few pre-activation processes, such as surface fluorination, alkaline bath, acid etch, mechanical alloying, etc., were proposed to shorten the activation process and improve the electrochemical performance of the MH alloys (see a review in [15]). Among these processes, the alkaline bath is very effective in dissolving the native oxide, so as to form a porous oxide surface with catalytic Ni clusters imbedded [13,16,17,18,19,20,21,22] and to increase the surface reactive area [23]. In the past, we have used this technique to prepare the alloy for the study of activated surfaces without going through electrochemical formation cycling [24].
2. Experimental Set-Up
MH alloys were prepared by either vacuum induction melting (VIM) or arc melting (AM). Details of the melting process were reported before [25,26]. The main difference between these two preparation methods is the size of ingot. While the former is usually used in large production (1–1000 kg), the latter is mostly used in laboratories (5–200 g) [15]. Some alloys went through annealing either in vacuum or Ar. The obtained ingot was hydrided first, followed by grinding and sifting into a −200 mesh size powder. To make the electrode, the powder was compacted directly onto a 1 cm × 1 cm expanded Ni substrate without any binder or conductive metal powder. The loading of powder per electrode ranged from 70 to 100 mg. The KOH etching (activation) experiment was performed on the electrode assembly in 45 wt % KOH at 110 °C for 2 h. After the etching process, the electrode was pulled out, rinsed by deionized water, dried, and tested. A Suzuki-Shokan multi-channel pressure-concentration-temperature system (PCT, Suzuki Shokan, Tokyo, Japan) was used to measure the MH-hydrogen interaction in gaseous phase. PCT measurements at various temperatures were performed after activation, which consisted of a 2 h thermal cycle between room temperature and 300 °C under 2.5 MPa H2 pressure. A Varian Liberty 100 inductively coupled plasma optical emission spectrometer (ICP-OES, Agilent Technologies, Santa Clara, CA, USA) was used to study the chemical composition of the solution after etching. A Philips X'Pert Pro X-ray diffractometer (XRD, Philips, Amsterdam, The Netherlands) was used to perform the phase analysis, and a JEOL-JSM6320F scanning electron microscope (SEM, JEOL, Tokyo, Japan) was also used to investigate the phase distribution and composition.
A 30 wt % KOH electrolyte, a Hg/HgO reference electrode, and a sintered Ni(OH)2/NiOOH counter electrode were used for the electrochemical testing. The internal resistance measurement was performed in the following steps:
- (1)
- Charge at 0.1 C and discharge at 0.1 C (to ‒0.7 V vs. Hg/HgO). Record discharge capacity;
- (2)
- Charge at 0.1 C, discharge 0.1 C to 80% state-of-charge (SOC);
- (3)
- Conduct internal resistance test at 80% SOC (1st internal resistance test):
- Put in open circuit for 10 min;
- Discharge at 0.5 C for 10 s;
- Charge at 0.5 C for 10 s;
- Put in open circuit for 10 min;
- Discharge at 2 C for 10 s;
- Charge at 2 C for 10 s;
- Put in open circuit for 10 min;
- Calculate internal resistance.
- (4)
- Charge at 0.1 C back from 80% SOC to 100% SOC;
- (5)
- Conduct 4 more capacity tests at 0.2 C charge rate and 0.1 C discharge rate. Record discharge capacities;
- (6)
- Repeat step 3 (2nd internal resistance test);
- (7)
- Repeat step 4;
- (8)
- Conduct rate test:
- Charge at 0.2 C, discharge at 0.1 C;
- Charge at 0.2 C, discharge at 0.2 C;
- Charge at 0.2 C, discharge at 0.5 C;
- Charge at 0.2 C, discharge at 1 C;
- Charge at 0.2 C, discharge at 2 C;
- Charge at 0.2 C, discharge at 3 C;
- Charge at 0.2 C, discharge at 5 C.
- (9)
- Repeat step 3 (3rd internal resistance test).
A Solartron 1250 Frequency Response Analyzer (Solartron Analytical, Leicester, UK) with a sine wave amplitude of 10 mV and a frequency range of 0.5 mHz to 10 kHz was used for the alternative current (AC) impedance measurements.
3. Results and Discussions
3.1. Alloys Selection
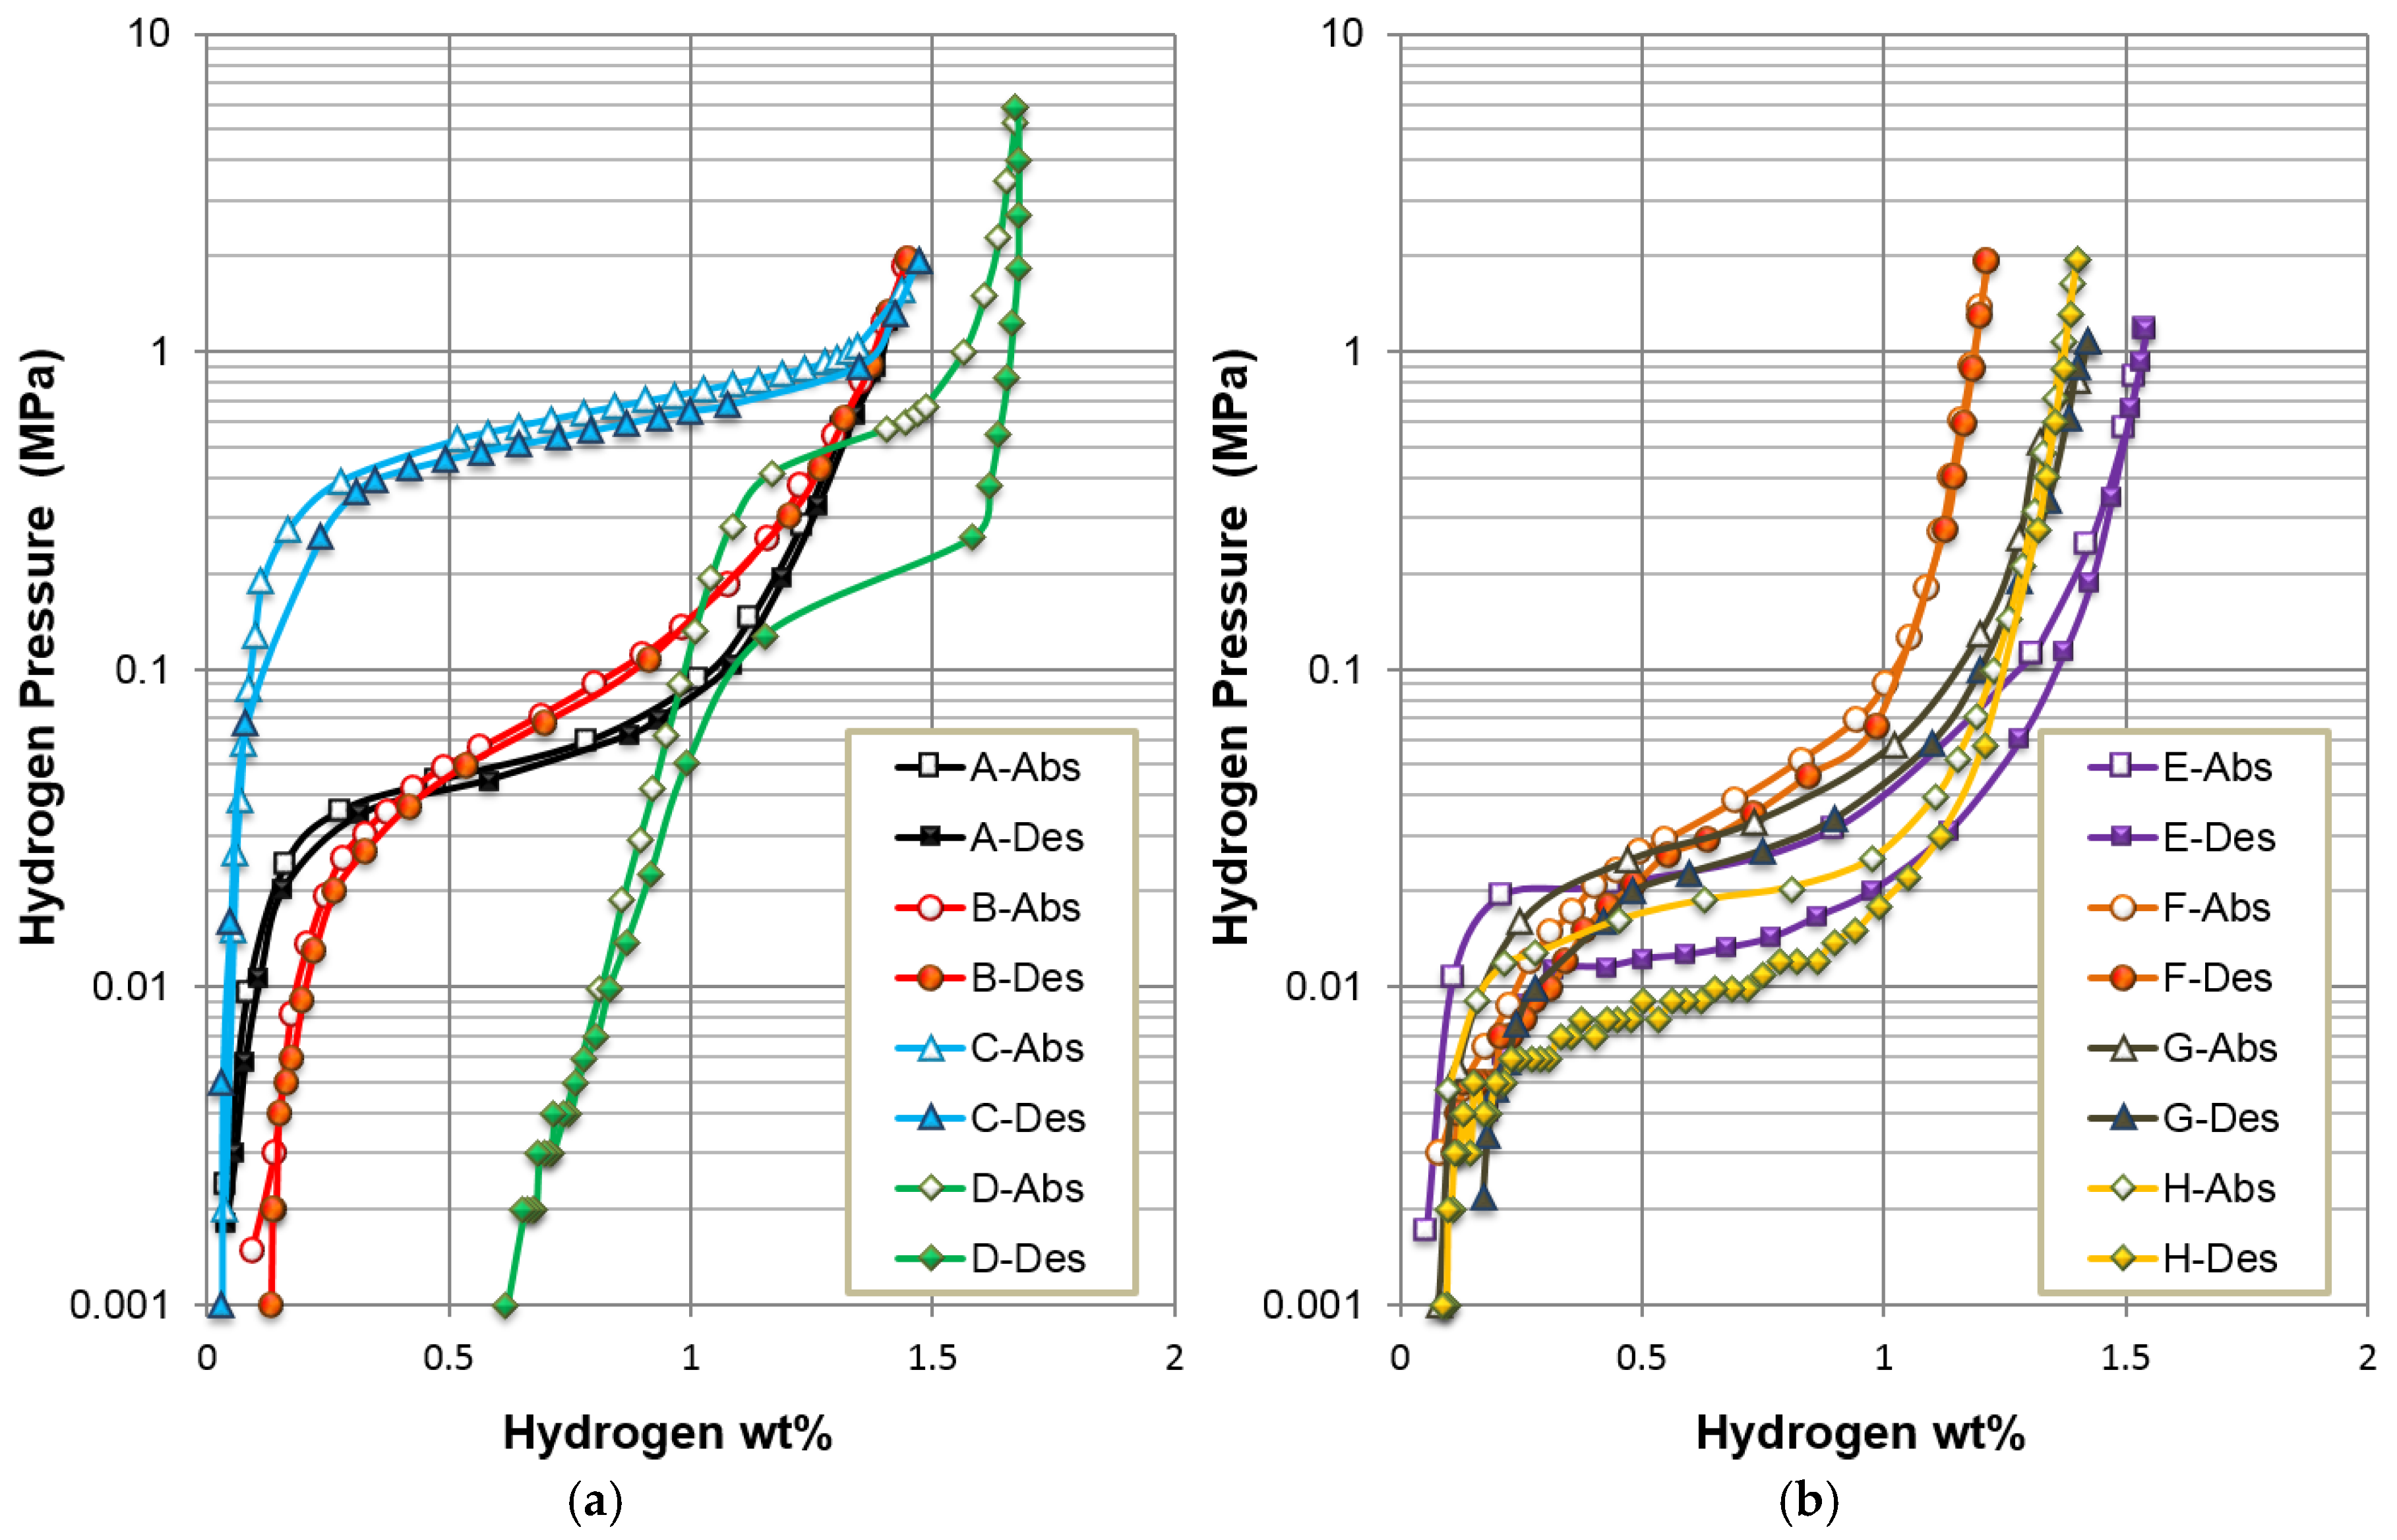
Eight MH alloys (A–H) were selected for this study. The composition and preparation method of each alloy are summarized in Table 1. Details in microstructures of these alloys can be found in the cited reference at the last column in Table 1. A is the most commonly used RE-based AB5 alloy in the Ni/MH battery. B and C are TM-based AB2 alloys with dominating C14 and C15 structures, respectively. D is a Laves-phase related BCC solid solution MH alloy composed of a main BCC phase and C14 and TiNi secondary phases, and shows a high capacity at a moderate rate that is suitable for electric vehicle application [12]. Alloys E–H are RE-and Mg-containing A2B7-based superlattice alloys used mainly in the high-performance consumer Ni/MH batteries [7,27,28]. PCT isotherms measured at 30 °C and room temperature half-cell discharge capacities in the first 10 electrochemical cycles for eights alloys in this study are compared in Figure 1 and Figure 2, respectively. The capacities of these alloys are summarized in Table 1. The BCC-C14 alloy (D) has the highest hydrogen-storage capacity whereas C14 AB2 alloys (B), and superlattice alloys (E, G, and H) are next, followed by the standard AB5 alloy (A). The half-cell discharge capacity of C15 AB2 alloy (C) is the lowest due to its relatively high hydrogen equilibrium pressure, which makes it difficult to charge into higher state-of-charge in the open-air environment. Alloy F has the lowest discharge capacity in the superlattice alloy family (E–H) because of its high Sm-content. From Figure 2, the ease of activation in order is E, F, G > C, H > A > D, B. In general, Mg-containing superlattice alloys are easier to activate, and alloys without La (B, D) take more cycles to reach their maximum capacities. The addition of rare elements to a TM-based MH alloy to improve the activation behavior is a well-known recipe for the preparation of electrochemical applications [29,30,31,32,33,34,35,36].
3.2. Electrochemical Results
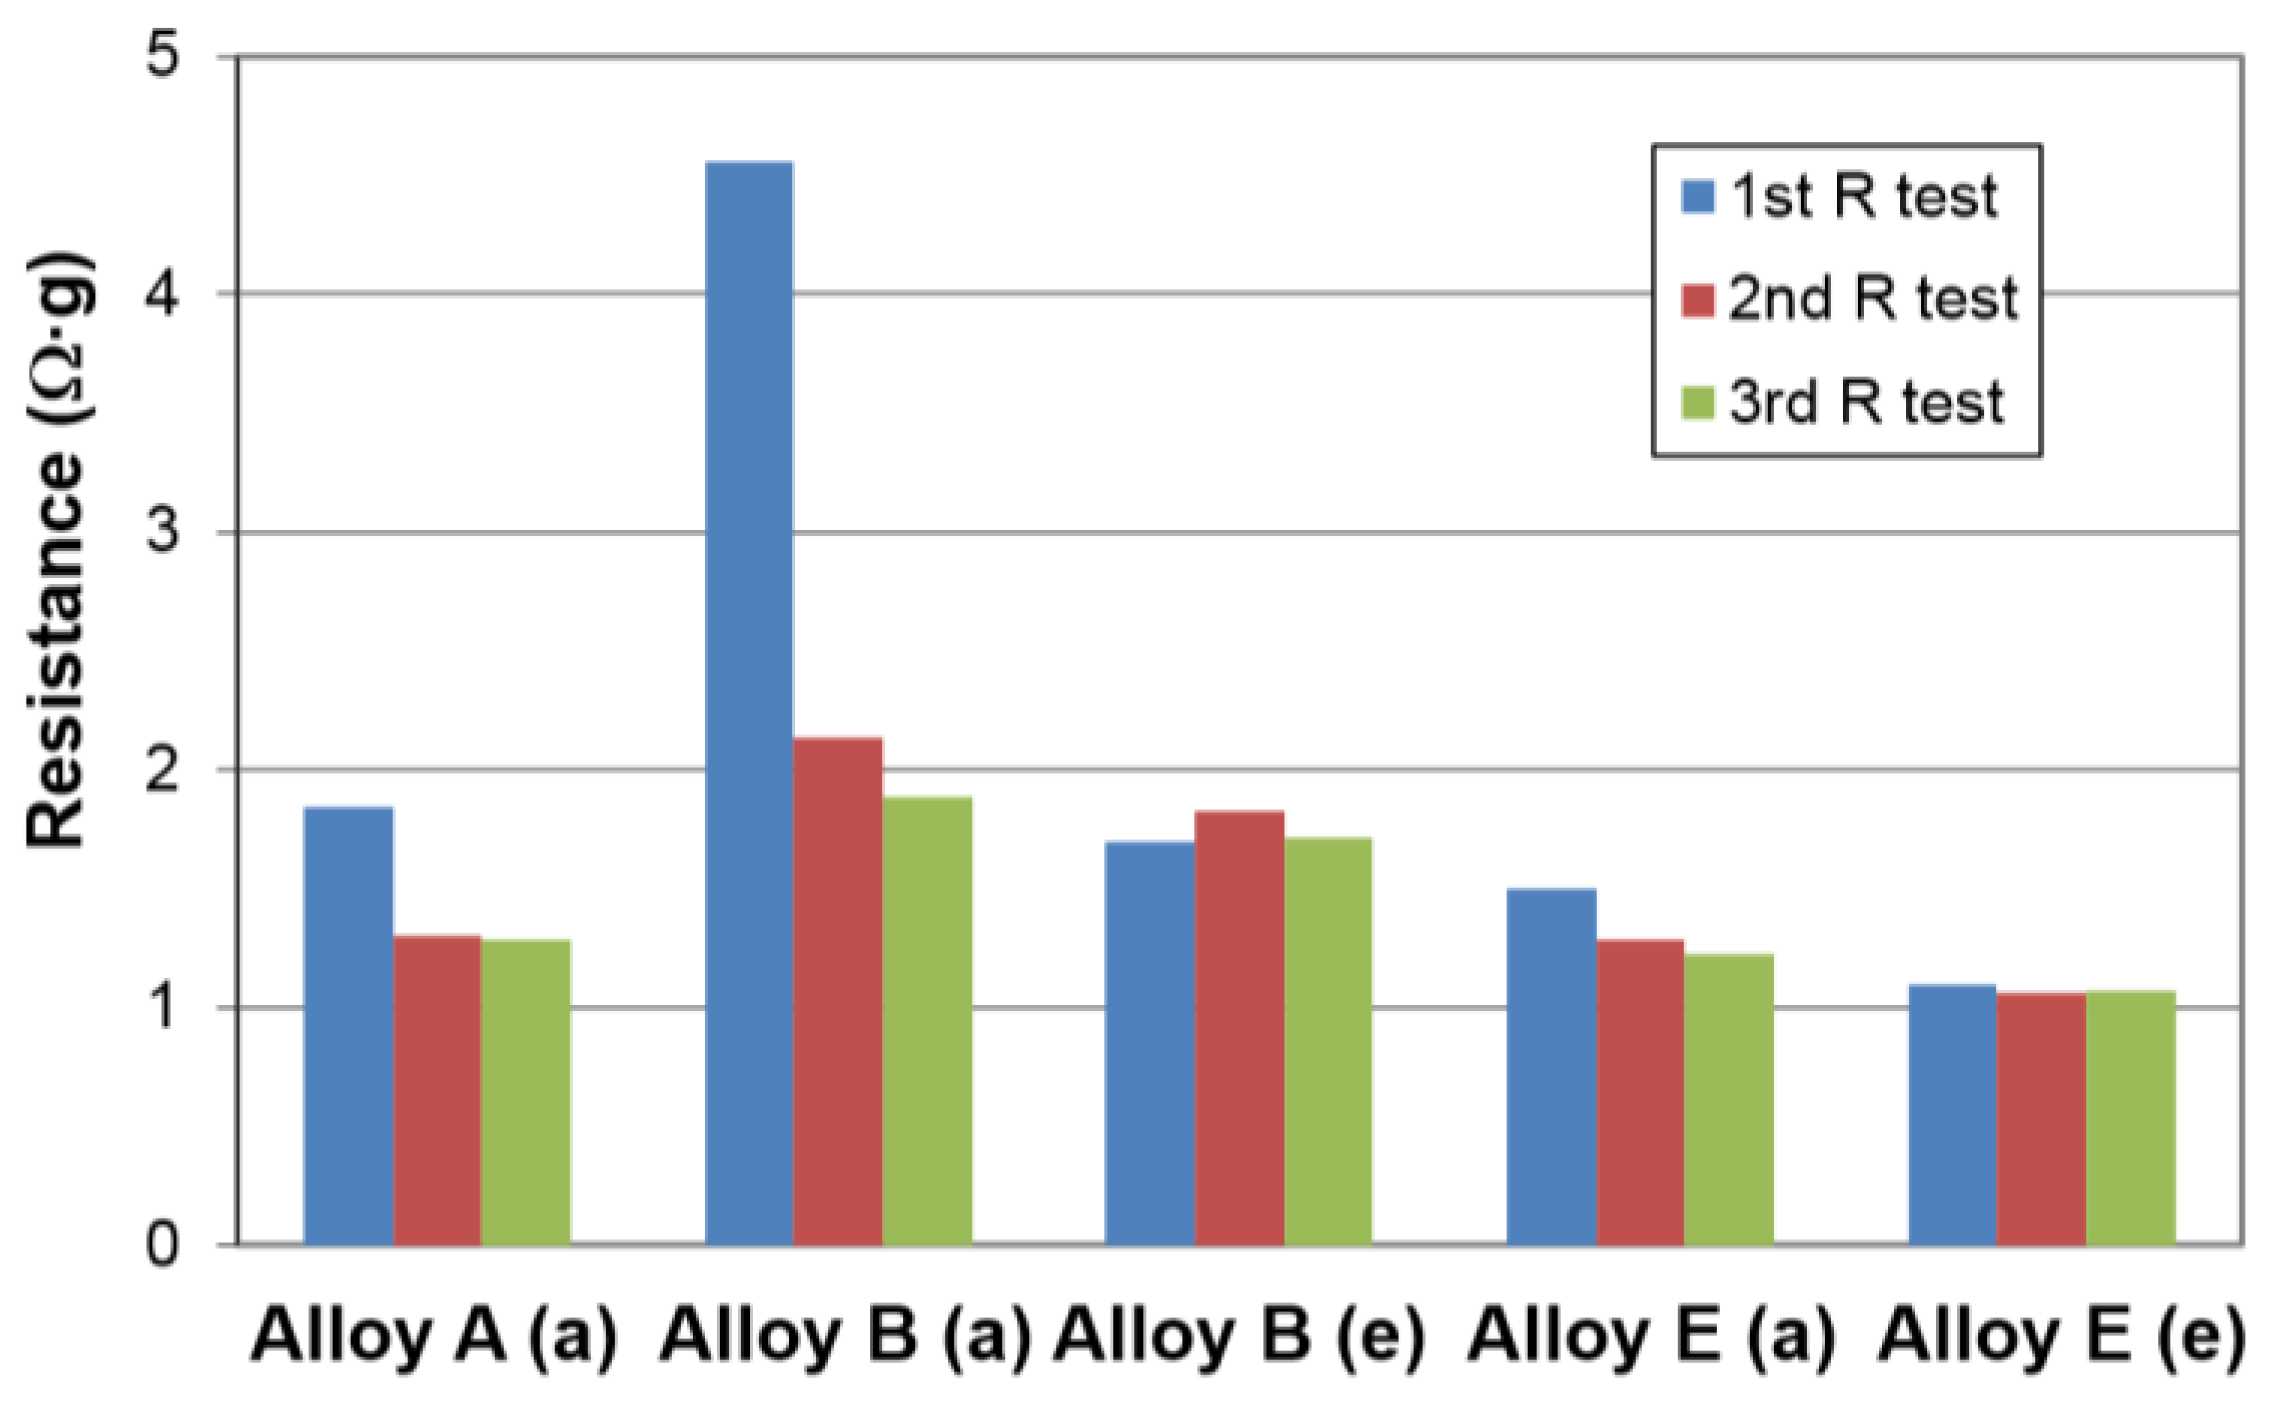
Four electrodes from each alloy went through half-cell electrochemical testing. Examples of capacities measured at different rates and three internal resistances (R) from alloy A (as-is), alloy B (as-is and etched), and alloy E (as-is and etched) are plotted in Figure 3 and Figure 4. The voltage dropped very quickly with the increase in the discharge current, which resulted in a significant decrease in measured capacity. The etched C14 AB2 alloy (B) shows the highest discharge capacity, up to a 2 C rate. In the comparison of R, the etched E shows the lowest resistance, and, in general, the HRD capability is in the order of A2B7 (E) > AB5 (A) > AB2 (B) regardless of being etched. This finding is consistent with our previous reports [40,43].
The electrochemical testing results are summarized in Table 2. The reported capacity and internal resistance are highest when obtained with a 0.1 C discharge rate and the lowest value in the three measurements, respectively. The specific power (P) was estimated by using formula:
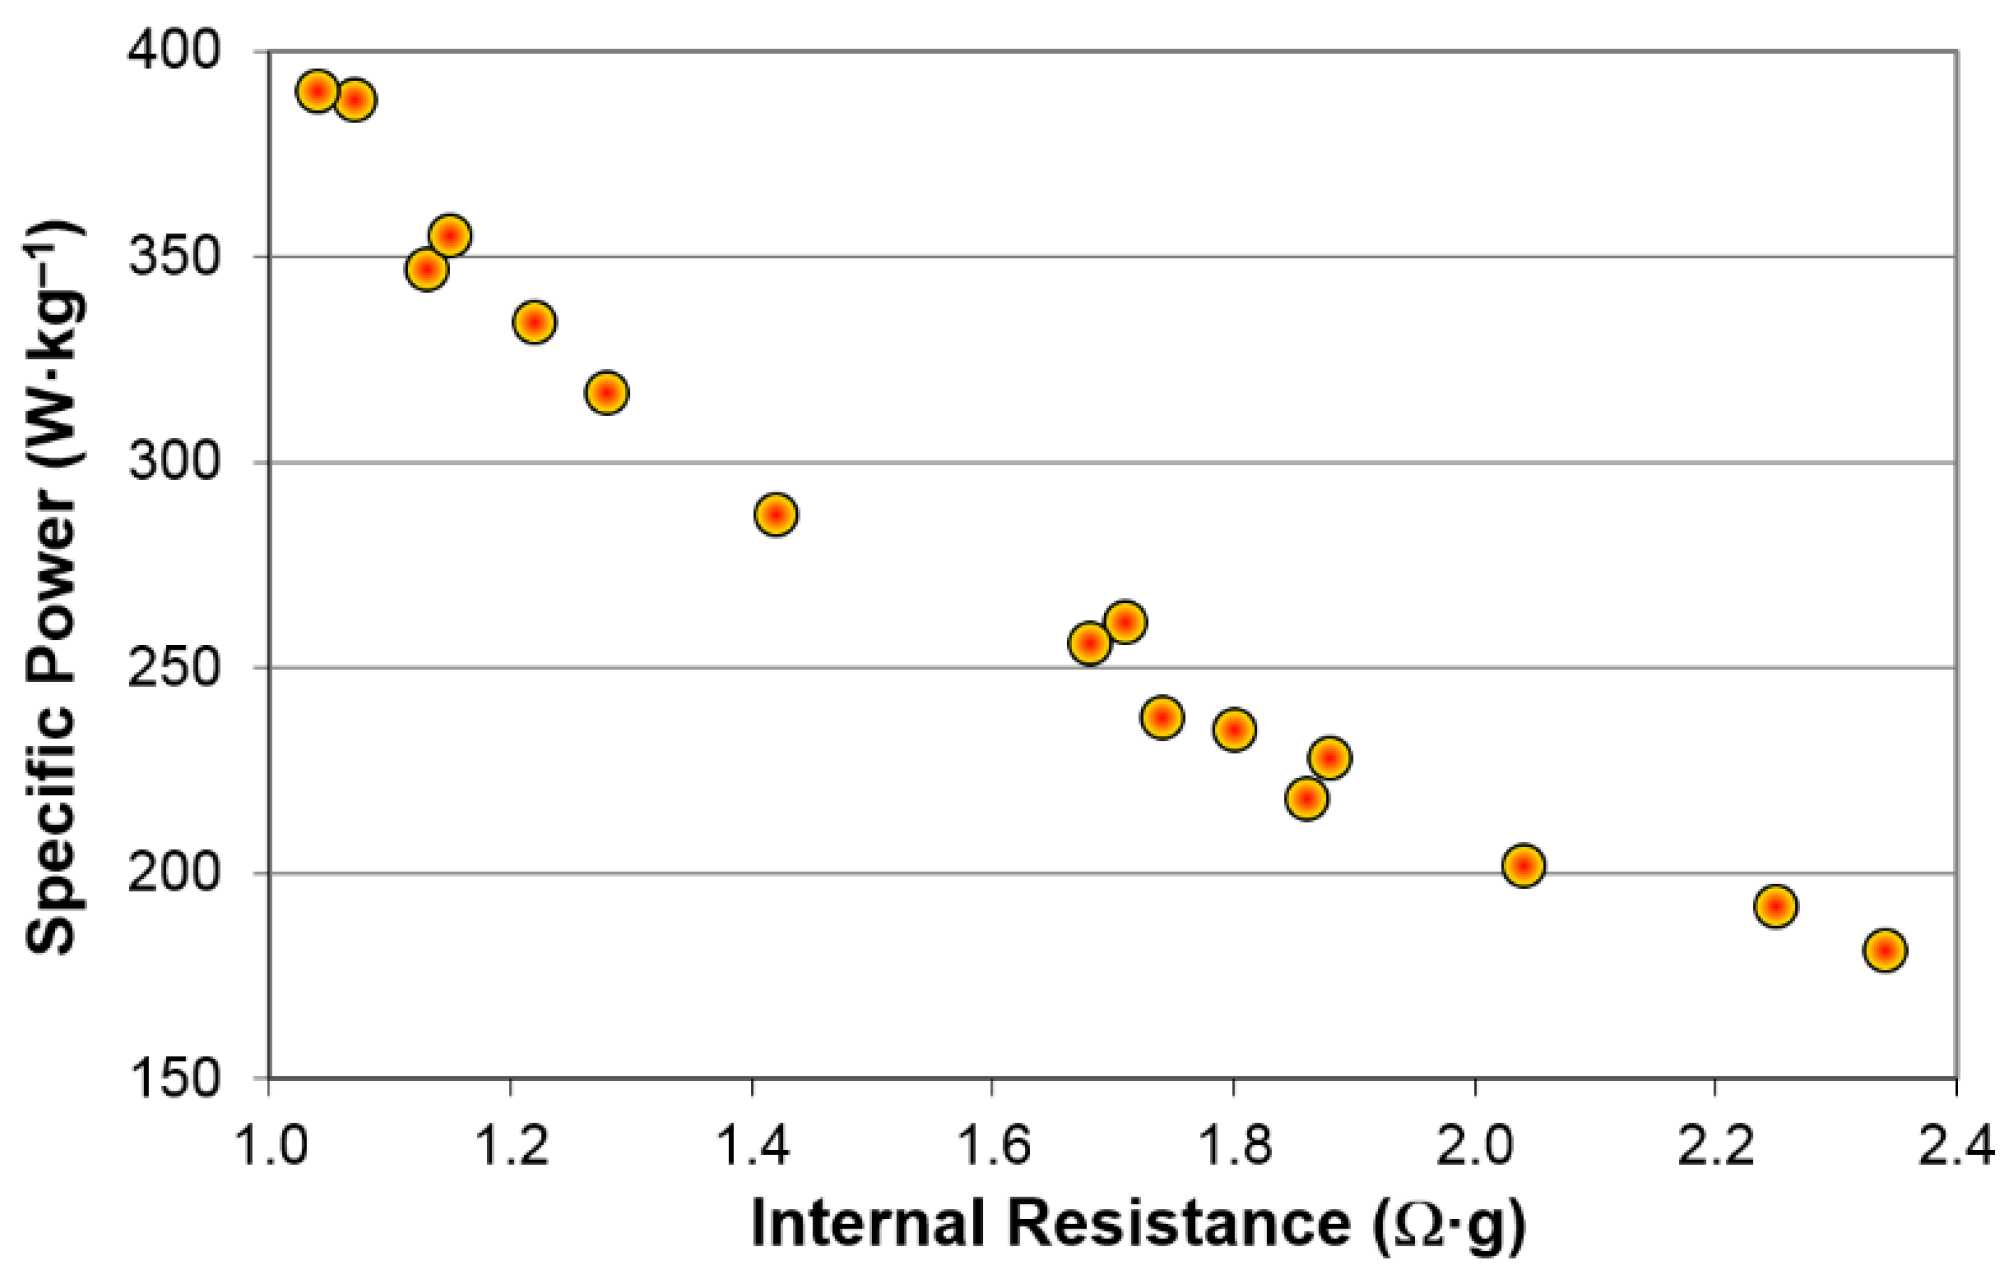
where 0.45 and Voc are the voltage of Ni(OH)2/NiOOH electrode and the open-circuit voltage of the tested alloy electrode vs. Hg/HgO reference electrode, respectively. The estimated specific power is inversely proportional to the measured internal resistance as shown in Figure 5. From Table 2, it is obvious that KOH-etching (activation) is very effective to reduce the internal resistance in C15 AB2 (C, ‒25%) and Sm-based A2B7 (F, ‒19%) alloys. The reduction in the internal resistance is less significant in La-based A2B7 (E, ‒12%), C14 AB2 (B, ‒9%) and Mm-based Al-free A2B7 (G, ‒8%) alloys. Etching in KOH (activation) even increases the internal resistance of AB5 (A, +36%) and BCC-C14 (D, +30%) alloys by large percentages. Three A2B7 alloys (E, F, and G) show lower R than that of the standard AB5 (A) after KOH-etching. The as-prepared (no etch) E and G show even lower R than that from A and have been used in the high-power design of Ni/MH batteries [41,44]. Overall, G shows the lowest R and the highest estimated specific power of 390 W·kg‒1, which is considerably higher than that from the standard A (317 W·kg‒1).
P = 2(0.45 − Voc)2/9R
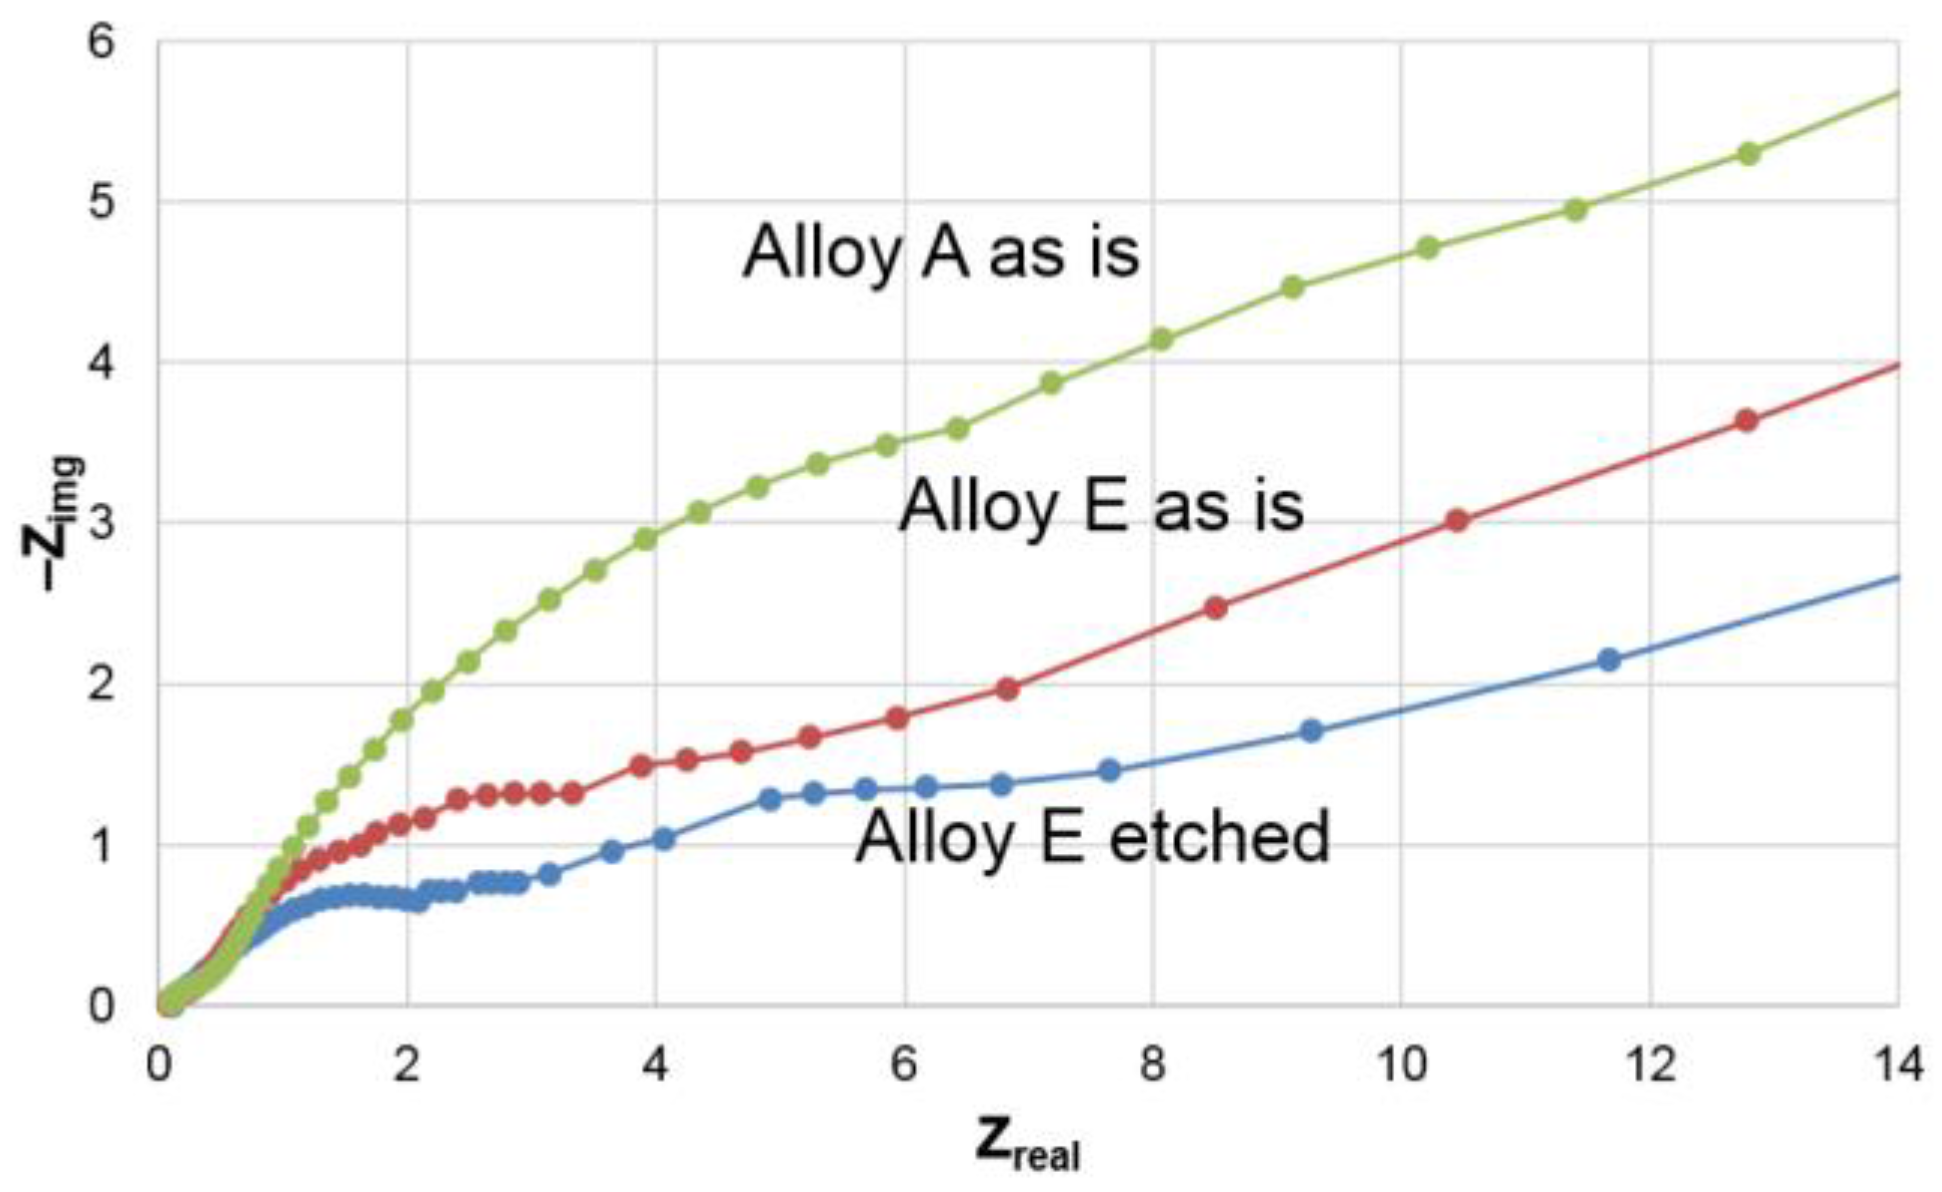
The superiority of E vs. A in the high-rate performance has been verified by room-temperature AC impedance measured at different frequencies as shown in Figure 6. The radius of the semi-circle represents the surface charge-transfer resistance and shows the trend of as-is A > as-is E > etched E, which is in total agreement with the internal resistance measurement.
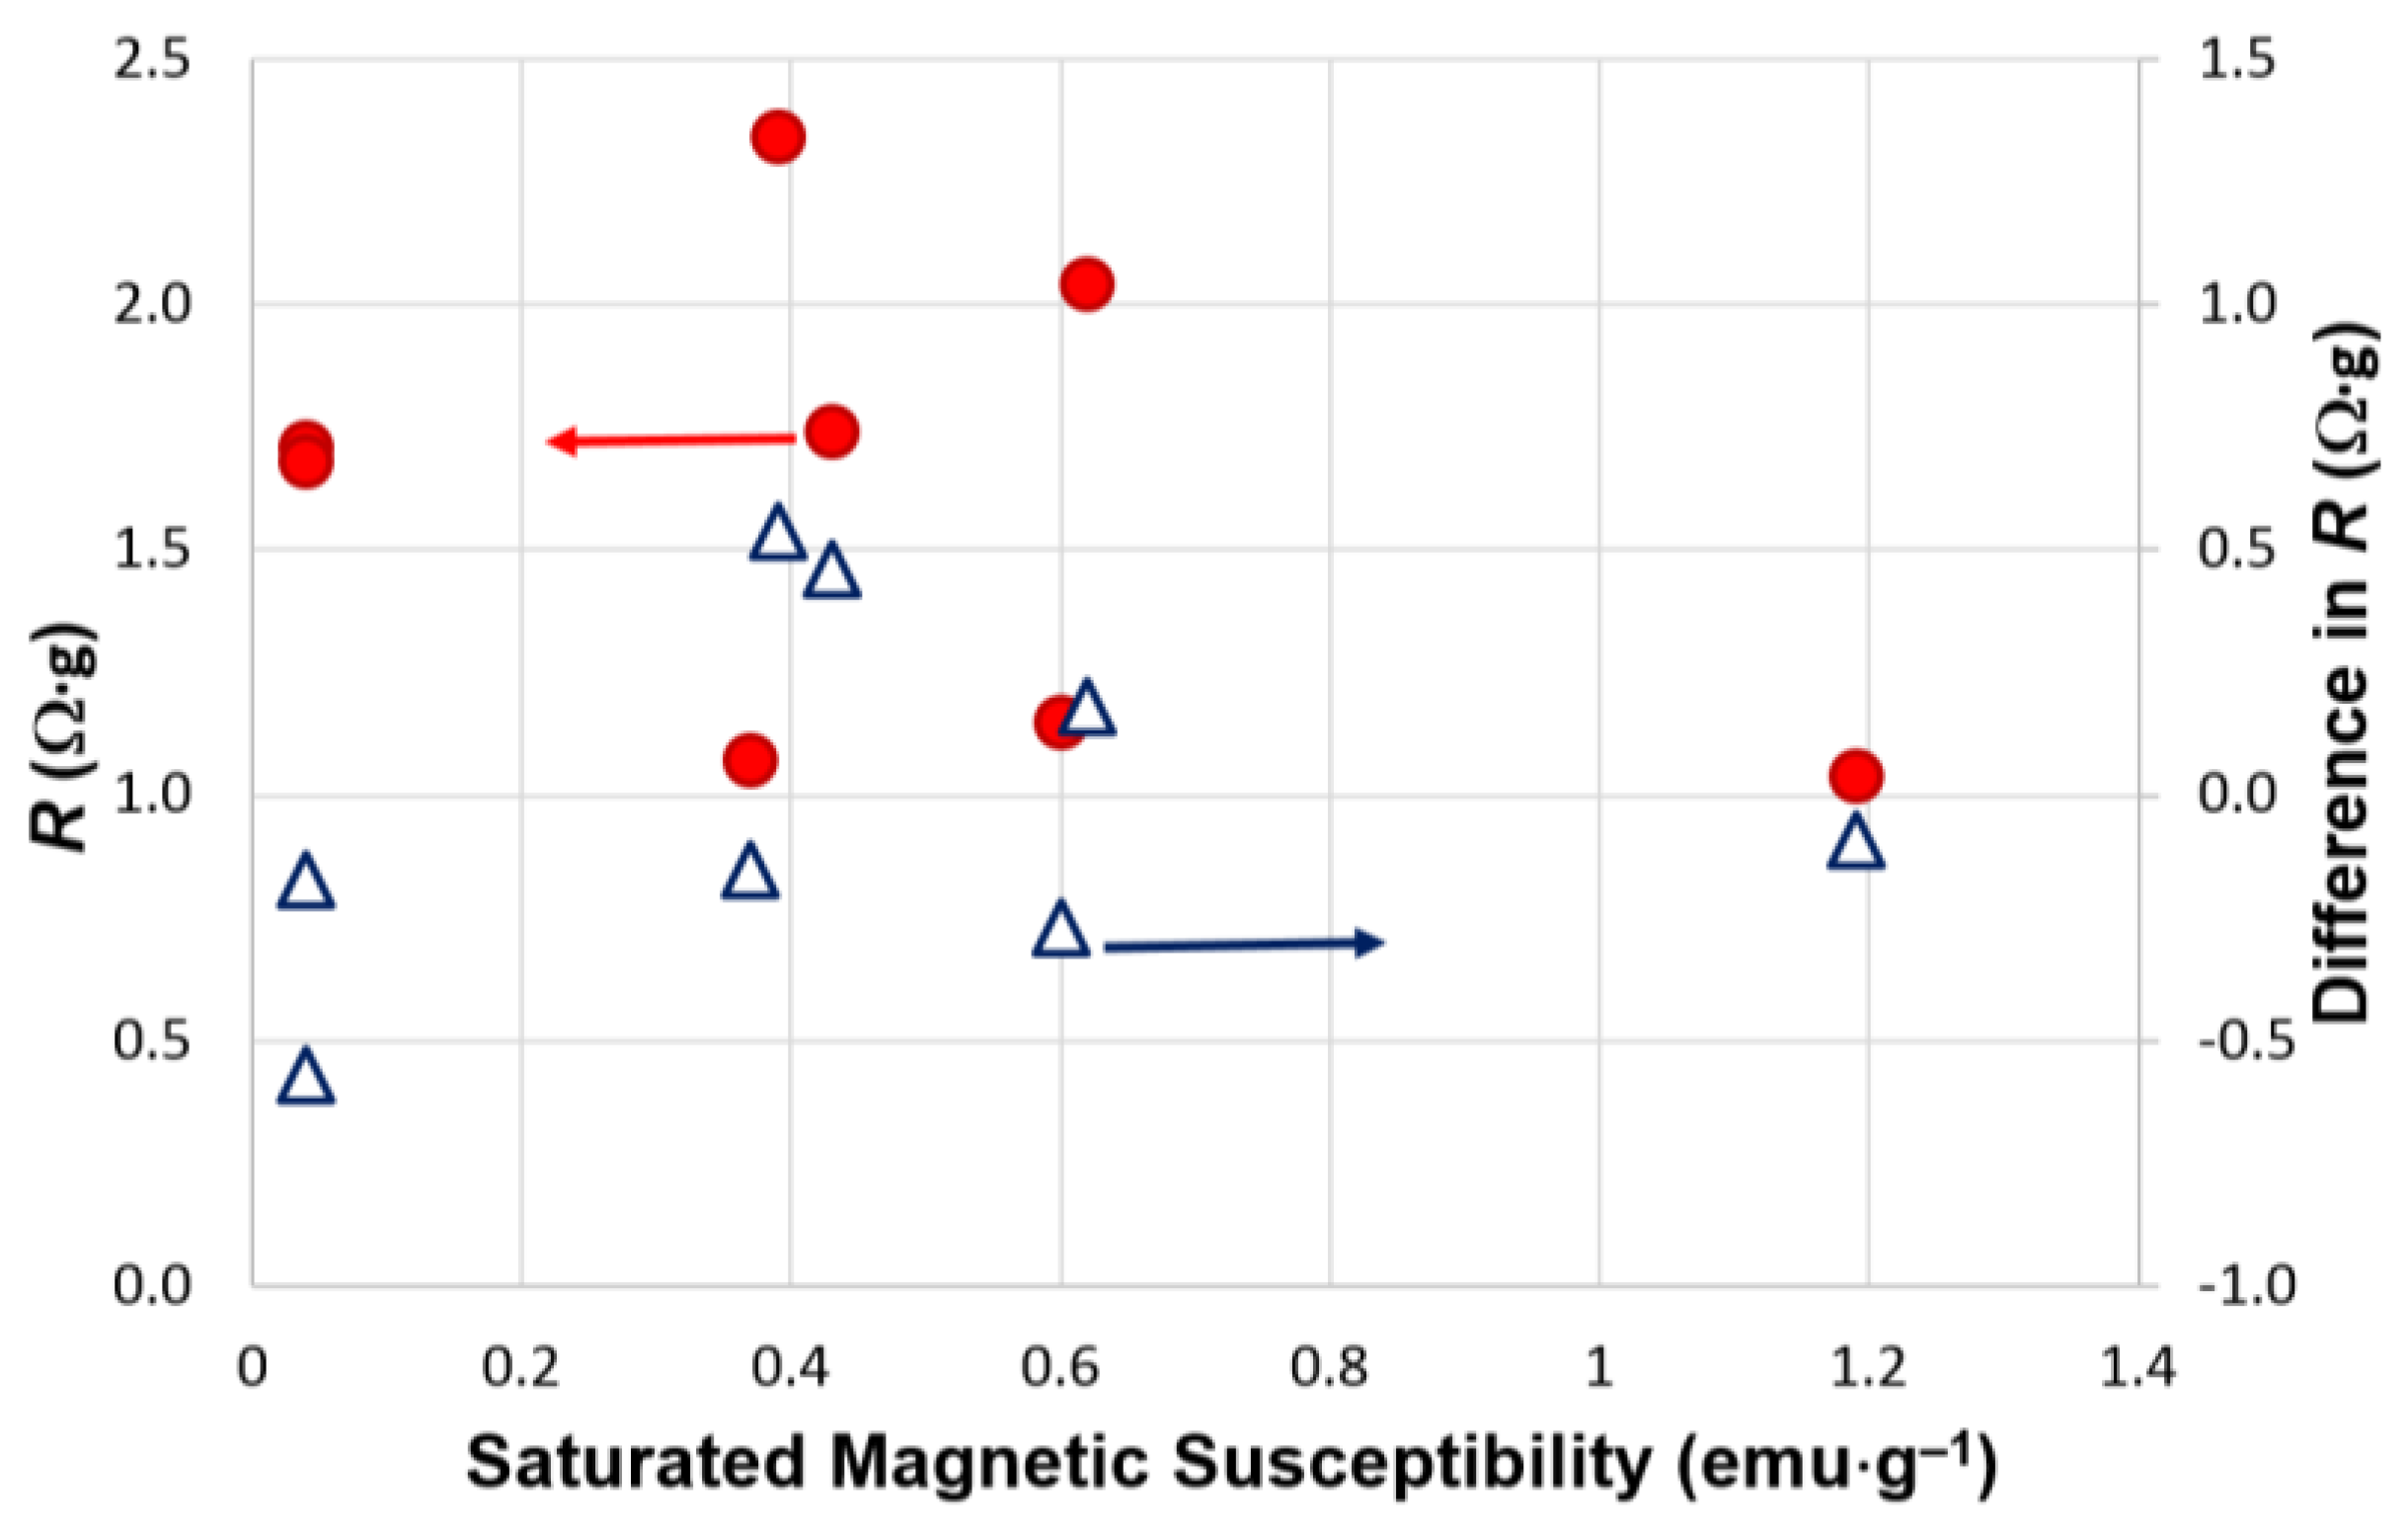
The HRD capability of MH alloy was associated with the metallic nickel clusters embedded in its surface oxide after activation [45,46]. The saturated magnetic susceptibility (MS) obtained from the magnetic susceptibility measurement shows clear correlation to the HRD of a series of A2B7 MH alloys [13]. However, we also reported that some MH alloys with HRD were more related to the structure of the metal/oxide interface [47,48]. Therefore, it is interesting to compare the internal resistance of the etched alloy with the MS values reported in the literature (Table 1). The resulting plot is shown in Figure 7 (red dots) and does not reveal any clear correlation. The difference in R before and after etching is also plotted in the same figure (triangles) and no clear trend can be seen. We conclude that an MS estimation of surface catalytic ability can be used only in the comparison of a series of MH alloys with a similar composition/structure and cannot be elaborated freely among various alloy systems.
3.3. Microsnalysis of the Activated Surface
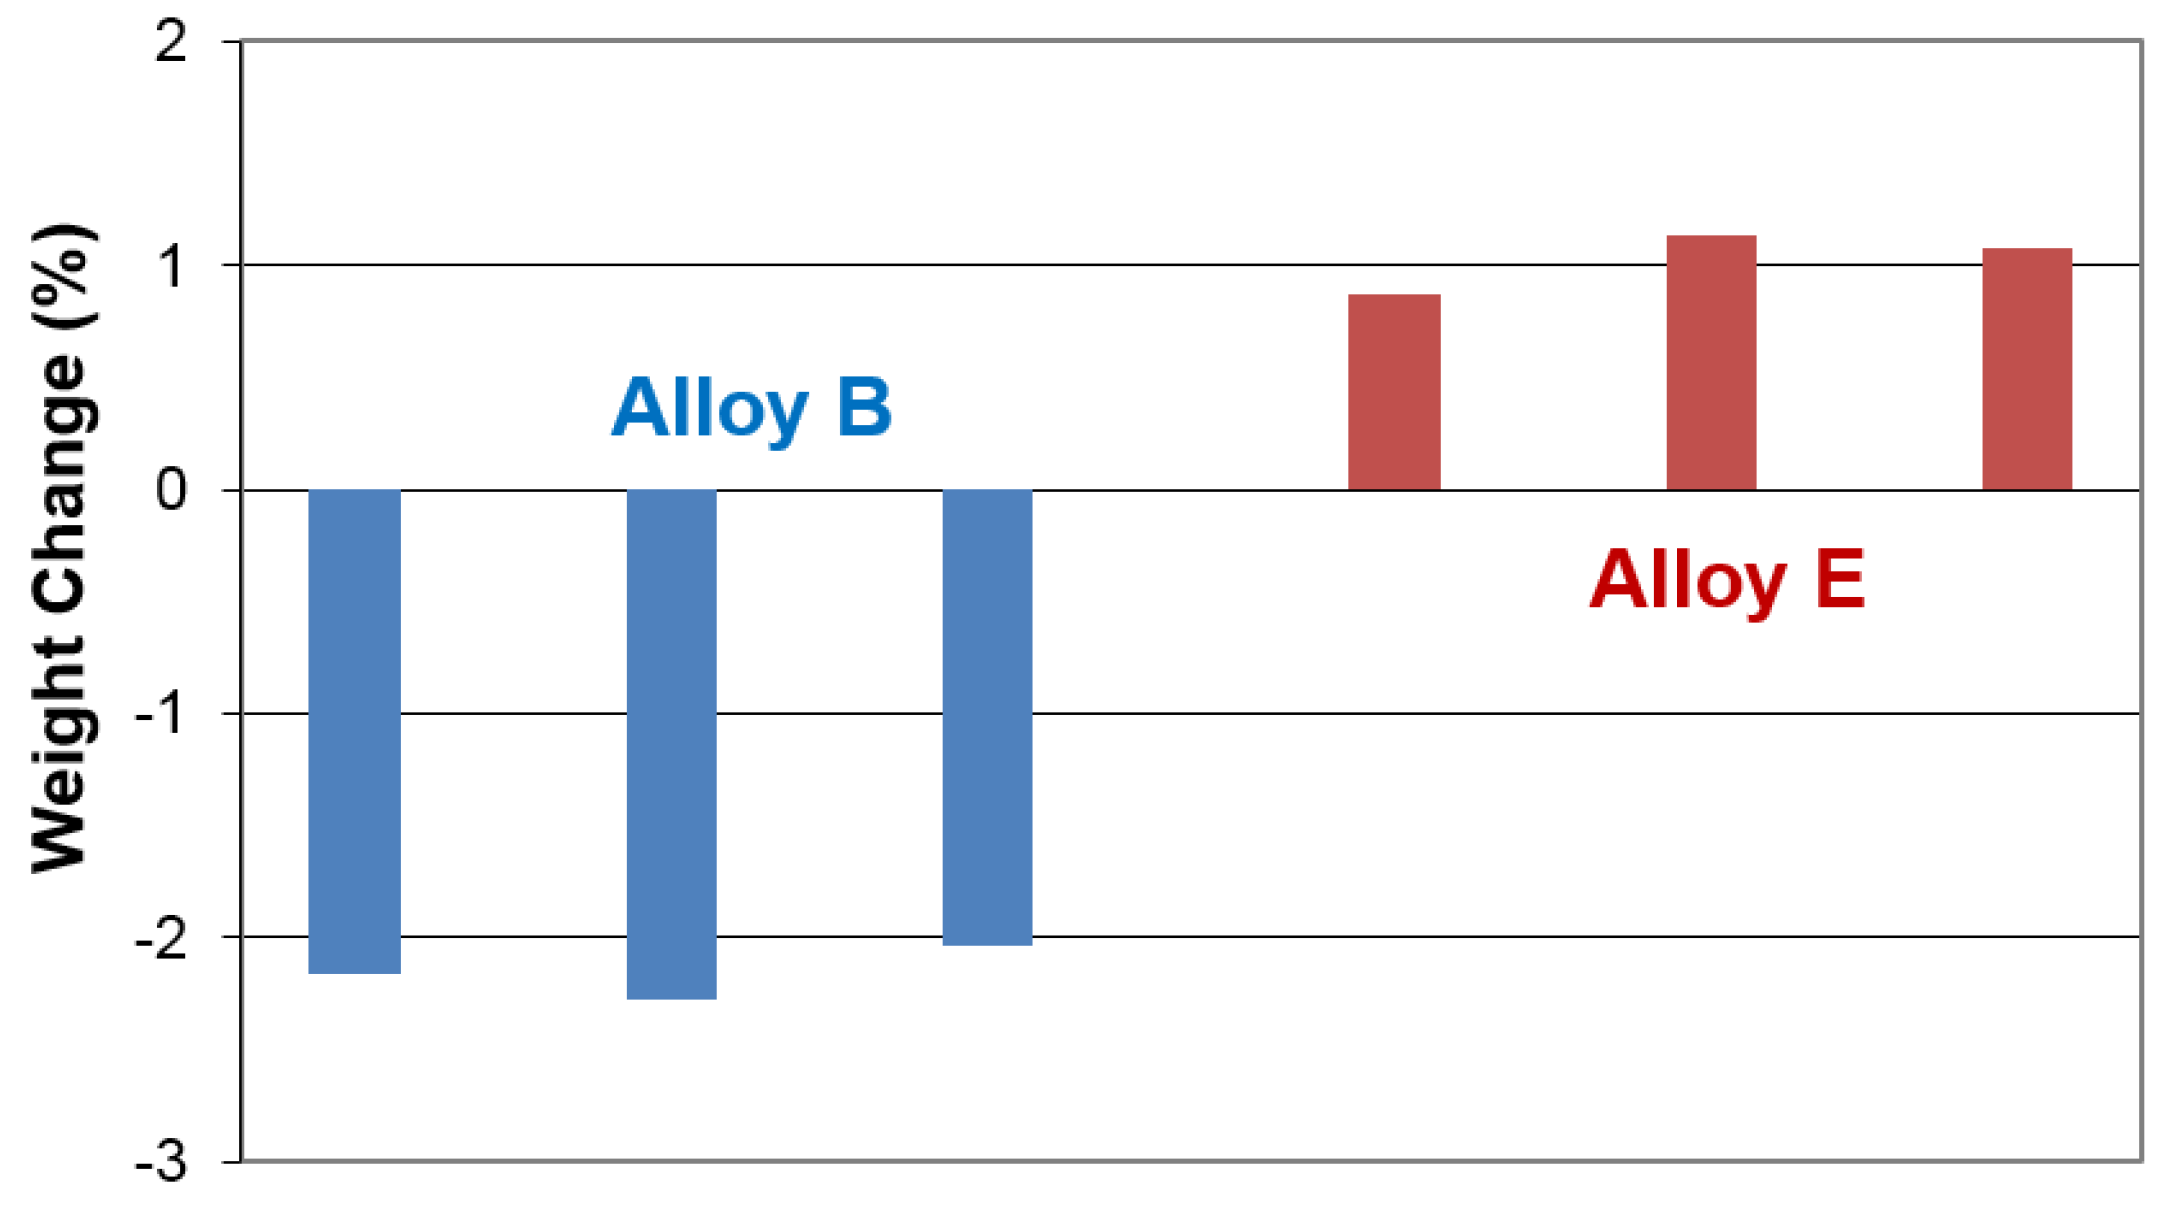
SEM micrographs taken from the surfaces of etched alloys are shown in Figure 8. While the surfaces of RE-based AB5 (A) and A2B7 (E–H) alloys are covered with RE(OH)3 needles, those from TM-based AB2 (B and C) and BCC-C14 (D) are modified by patches of ZrO2. Needles from La(OH)3 are smaller compared to hydroxides from other RE elements [24]. The microstructures of RE- and TM-based MH alloys were studied by transmission electron microscope before and can be summarized as a 50 nm buffer oxide (amorphous) and a 100 nm surface oxide with Ni-inclusion with RE(OH)3 needles on top in the former and a 100 nm buffer oxide layer and a 200 nm surface oxide with Ni-inclusion with patches of ZrO2 on top in the latter [24]. While the RE in AB5 and A2B7 alloys formed an impeccable passive surface oxide when reacting with hot KOH, the TM just leaches out into electrolyte. The weight comparison of three B (AB2) and three E (A2B7) electrodes before and after KOH-etching (dried in vacuum over for 24 h) were conducted and results are listed in Table 3 and plotted in Figure 9. The average weight loss (gain) for B and E (MH powder only) are −2.2% and +1.0%. The leached-out species were further analyzed by examining the composition of the alkaline solution after the etching experiment with ICP and results are summarized in Table 4. In the solutions with RE-based alloys, only Al (A, F, and H) and a very small amount of Mg (E, F, and G) are detected. In the TM-based alloys (B–D), larger concentrations of Ti, V, and Zr are found. The Ni-concentrations in the solutions from TM-based alloys are much higher than those from the RE-based one, while the former have smaller Ni-content in their compositions. This is additional evidence showing that when the TM-based alloys were attached by hot KOH they went through a preferential leach-out and the RE-based alloys formed a passive hydroxide layer under the same situation.
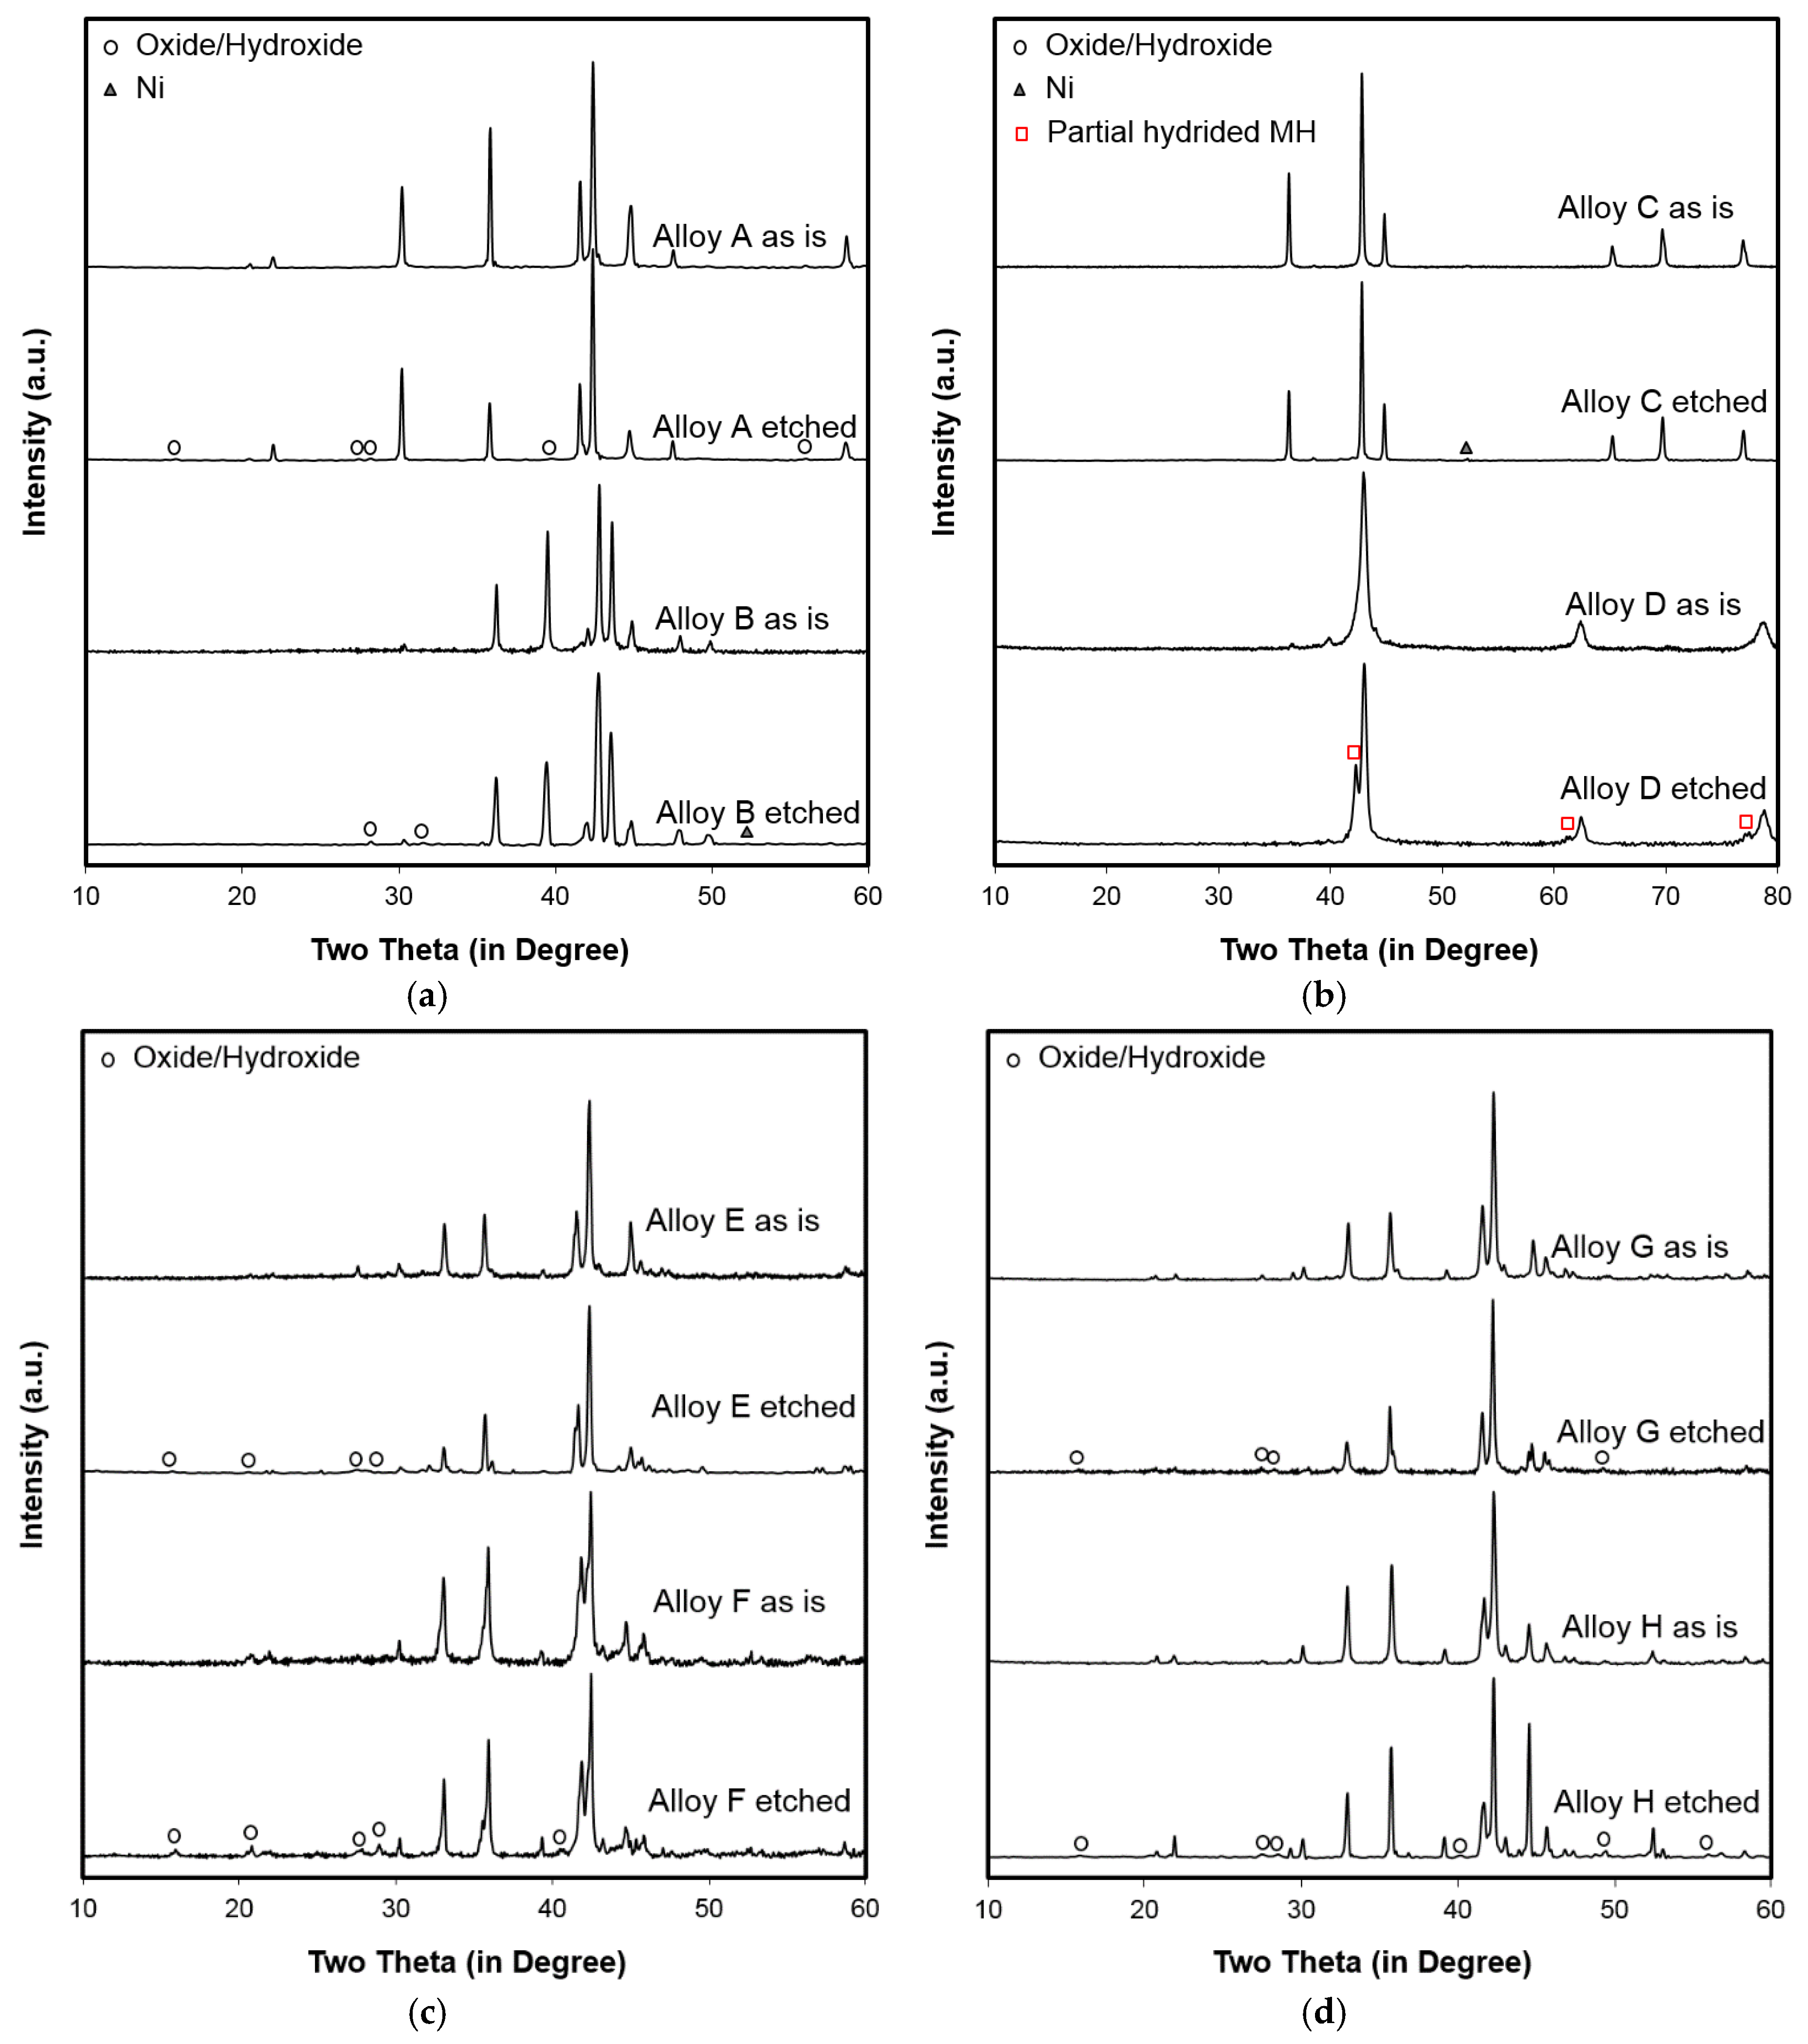
To confirm the results from SEM and ICP analysis, XRD was performed, and the resulting patterns obtained before and after KOH-etch for each alloy in this study are plotted in Figure 10. All RE-based MH alloys (A, E–H) show peaks of RE(OH)3 after etching. Only etched B shows ZrO2 phase, and both AB2 alloys (B and C) contain metallic Ni as a product of corrosion after etching. D exhibited a small portion of partially hydride (α-phase) formed by storing the hydrogen generated from the high level of oxidation of TM (mainly V [11]). The metal-hydrogen bond of the product from the initial hydrogenation is very strong, as seen from the large portion of low-pressure irreversible hydrogen storage in D (PCT in Figure 1). The XRD analysis results indicate that the leaching-out (corrosion) of the alloy surface by hot KOH is in the order of D > C > B > the rest.
4. Conclusions
Combining the electrochemical testing results and microstructure analysis, we have the following findings: The improvement in the high-rate capability (reduction in R) by KOH-etch is the most prominent in C15 AB2 (C) with a small La-content, followed by two A2B7 alloys (E and F) with Mg, and then C14 AB2 (A) and an A2B7 with Mg and no Al (G). The KOH-etch deteriorates the high-rate performance (increase in R) in the standard Mg-free AB5 (A) and V-rich BCC-C14 (D) alloys, whereas Mg-content in A2B7 MH alloys responds well with the KOH-etch and La also helps the decrease in surface charge-transfer resistance by etching. BCC phase in a multiple phase alloy is more robust against the KOH corrosion [49] and is inert in the electrochemical environment [50,51,52]. Etching at a high temperature will increase the density of BCC phase on the surface and impede the electrochemical reaction, which explains the severe degradation in high-power performance of alloy D after KOH-etch.
Acknowledgments
The authors would like to thank the following individuals from BASF-Ovonic for their help: Taihei Ouchi, Jean Nei, Shuan Chang, Su Cronogue, Baoquan Huang, William Mays, Diana F. Wong, David Pawlik, Allen Chan, and Ryan J. Blankenship.
Author Contributions
Tiejun Meng performed the experiment and analyzed results. Kwo-Hsiung Young contributed to data analysis and manuscript preparation. Chaolan Hu and Benjamin Reichman provided the KOH-etching recipe and helped in AC impedance measurement and data interpretation.
Conflicts of Interest
The authors declare no conflict of interest.
Abbreviations
The following abbreviations are used in this manuscript:
| MH | Metal hydride |
| IMC | Intermetallic compound |
| Ni/MH | Nickel/metal hydride |
| BCC | Body-centered-cubic |
| TM | Transition metal |
| RE | Rare earth |
| HRD | High-rate dischargeability |
| VIM | Vacuum induction melting |
| AM | Arc melting |
| PCT | Pressure–concentration–temperature |
| ICP-OES | Inductively coupled plasma-optical emission spectrometer |
| XRD | X-ray diffractometer |
| SEM | Scanning electron microscope |
| SOC | State of charge |
| MS | Saturated magnetic susceptibility |
| AC | Alternative current |
| R | Internal resistance |
| P | Specific power |
| Voc | Open-circuit voltage |
References
- Young, K. Metal Hydride. In Elsevier Reference Module in Chemistry, Molecular Sciences and Chemical Engineering; Reedijk, J., Ed.; Elsevier: Waltham, MA, USA, 2013. [Google Scholar]
- Goo, N.H.; Woo, J.H.; Lee, K.S. Mechanism of Rapid Degradation of Nanostructured Mg2Ni Hydrogen Storage Alloy Electrode Synthesized by Mechanical Alloying and the Effect of Mechanically Coating with Nickel. J. Alloys Compd. 1999, 288, 286–293. [Google Scholar] [CrossRef]
- Zhang, Q.A.; Lei, Y.Q.; Wang, C.S.; Wang, F.S.; Wang, Q.D. Structure of the Secondary Phase and Its Effects on Hydrogen-storage Properties in a Ti0.7Zr0.2V0.1Ni Alloy. J. Power Sour. 1998, 75, 288–291. [Google Scholar] [CrossRef]
- Nei, J.; Young, K. Gaseous Phase and Electrochemical Hydrogen Storage Properties of Ti50Zr1Ni44X5 (X = Ni, Cr, Mn, Fe, Co, or Cu) for Nickel Metal hydride Battery Applications. Batteries 2016, 2, 24. [Google Scholar] [CrossRef]
- Züttel, A.; Meli, F.; Schlapbach, L. Electrochemical and Surface Properties of Zr(VxNi1‒x)2 Alloys as Hydrogen-absorbing Electrodes in Alkaline Electrolyte. J. Alloys Compd. 1994, 203, 235–241. [Google Scholar]
- Liao, B.; Lei, Y.Q.; Chen, L.X.; Lu, G.L.; Pan, H.G.; Wang, Q.D. A Study on the Structure and Electrochemical Properties of La2Mg(Ni0.95M0.05)9 (M = Co, Mn, Fe, Al, Cu, Sn) Hydrogen Storage Electrode Alloys. J. Alloys Compd. 2004, 376, 186–195. [Google Scholar] [CrossRef]
- Yasuoka, S.; Magari, Y.; Murata, T.; Tanaka, T.; Ishida, J.; Nakamura, H.; Nohma, T.; Kihara, M.; Baba, Y.; Teraoka, H. Development of High-capacity Nickel-metal Hydride Batteries Using Superlattice Hydrogen-Absorbing Alloys. J. Power Sour. 2006, 156, 662–666. [Google Scholar] [CrossRef]
- Zhao, Y.; Zhang, L.; Ding, Y.; Cao, J.; Jia, Z.; Ma, C.; Li, Y.; Han, S. Comparative Study on the Capacity Degradation Behavior of Pr5 Co19-type Single-phase Pr4MgNi19 and La4MgNi19 Alloys. J. Alloys Compd. 2017, 694, 1089–1097. [Google Scholar] [CrossRef]
- Willems, J.J.G.; Buschow, K.H.J. From Permanent Magnets to Rechargeable Hydride Electrodes. J. Less Common Met. 1987, 129, 13–30. [Google Scholar] [CrossRef]
- Young, K.; Ouchi, T.; Huang, B.; Nei, J. Structure, Hydrogen Storage, and Electrochemical Properties of Body-centered-cubic Ti40V30 Cr15Mn13X2 alloys (X = B, Si, Mn, Ni, Zr, Nb, Mo, and La). Batteries 2015, 1, 74–90. [Google Scholar] [CrossRef]
- Young, K.; Nei, J.; Wong, D.F.; Wang, L. Structural, Hydrogen Storage, and Electrochemical Properties of Laves Phase-related Body-centered-cubic Solid Solution Metal Hydride Alloys. Int. J. Hydrog. Energy 2014, 39, 21489–21499. [Google Scholar] [CrossRef]
- Young, K.; Ng, K.Y.S.; Bendersky, L.A. A Technical Report of the Robust Affordable Next Generation Energy Storage System-BASF program. Batteries 2016, 2, 2. [Google Scholar] [CrossRef]
- Young, K.; Ouchi, T.; Huang, B.; Chao, B.; Fetcenko, M.A.; Bendersky, L.A.; Wang, K.; Chiu, C. The Correlation of C14/C15 Phase Abundance and Electrochemical Properties in the AB2 Alloys. J. Alloys Compd. 2010, 506, 841–848. [Google Scholar] [CrossRef]
- Young, K.; Nei, J. The Current Status of Hydrogen Storage Alloy Development for Electrochemical Applications. Materials 2013, 6, 4574–4608. [Google Scholar] [CrossRef] [PubMed]
- Young, K.; Chang, S.; Lin, X. C14 Laves Phase Metal Hydride Alloys for Ni/MH Batteries Applications. Batteries 2017, 3, 27. [Google Scholar] [CrossRef]
- Schlapbach, L.; Seiler, A.; Siegmann, H.C.; Waldkirch, T.V.; Zücher, P.; Brundle, C.R. Self Restoring of the Active Surface in LaNi5. Int. J. Hydrog. Energy 1979, 4, 21–28. [Google Scholar] [CrossRef]
- Fetcenko, M.A.; Young, K.; Ovshinsky, S.R.; Reichman, B.; Koch, J.; Mays, W. Modified Electrochemical Hydrogen Storage Alloy Having Increased Capacity, Rate Capability and Catalytic Activity. US Patent 6,740,448, 25 May 2004. [Google Scholar]
- Meli, F.; Schlapbach, L. Surface Analysis of AB5-type electrodes. J. Less Common Met. 1991, 172, 1252–1259. [Google Scholar] [CrossRef]
- Broom, D.P.; Kemali, M.; Ross, D.K. Magnetic Properties of Commercial Metal Hydride Battery Materials. J. Alloys Compd. 1999, 255, 293–295. [Google Scholar] [CrossRef]
- Yu, B.; Chen, L.; Wen, M.F.; Tong, M.; Chen, D.M.; Tian, Y.W.; Zhai, Y.C. Surface Modification of AB2 and AB5 Hydrogen Storage Alloy Electrodes by the Hot-charging Treatment. J. Mater. Sci. Technol. 2001, 17, 247–251. [Google Scholar]
- Shen, Y.; Peng, F.; Kontos, S.; Noréus, D. Improved NiMH Performance by a Surface Treatment that Creates Magnetic Ni-clusters. Int. J. Hydrog. Energy 2016, 41, 9933–9938. [Google Scholar] [CrossRef]
- Tan, S.; Shen, Y.; Şahin, E.Q.; Noréus, D.; Öztürk, T. Activation Behavior of an AB2 Type Metal Hydride Alloy for NiMH Batteries. Int. J. Hydrog. Energy 2016, 41, 9948–9953. [Google Scholar] [CrossRef]
- Ye, Z.; Noréus, D. Metal hydride electrodes: The Importance of Surface Area. J. Alloys Compd. 2016, 664, 59–64. [Google Scholar] [CrossRef]
- Young, K.; Chao, B.; Liu, Y.; Nei, J. Microstructures of the Oxides on the Activated AB2 and AB5 Metal Hydride Alloys Surface. J. Alloys Compd. 2014, 606, 97–104. [Google Scholar] [CrossRef]
- Chang, S.; Young, K.; Ouchi, T.; Meng, T.; Nei, J.; Wu, X. Studies on Incorporation of Mg in Zr-based AB2 Metal Hydride Alloys. Batteries 2016, 2, 11. [Google Scholar] [CrossRef]
- Young, K.; Wong, D.F.; Nei, J. Effects of Vanadium/nickel Contents in Laves Phase-related Body-centered-cubic Solid Solution Metal Hydride Alloys. Batteries 2015, 1, 34–53. [Google Scholar] [CrossRef]
- Teraoka, H. Development of Low Self-Discharge Nickel-Metal Hydride Battery. Available online: http://www.scribd.com/doc/9704685/Teraoka-Article-En (accessed on 9 April 2016).
- Kai, T.; Ishida, J.; Yasuoka, S.; Takeno, K. The Effect of Nickel-Metal Hydride Battery’s Characteristics with Structure of the Alloy. In Proceedings of the 54th Battery Symposium in Japan, Osaka, Japan, 7–9 October 2013; p. 210. [Google Scholar]
- Liu, F.J.; Kitayama, K.; Suda, S. La and Ce-incorporation Effects on the Surface Properties of the Fluorinated (Ti,Xr)(Mn,Cr,Ci)2 Hydriding Alloys. Vacuum 1996, 47, 903–906. [Google Scholar] [CrossRef]
- Kim, S.; Lee, J. Activation behaviour of ZrCrNiM0.05 metal hydride electrode (M = La, Mm (misch metal), Nd). J. Alloys Compd. 1992, 185, L1–L4. [Google Scholar] [CrossRef]
- Park, H.Y.; Chang, I.; Cho, W.I.; Cho, B.W.; Jang, H.; Lee, S.R.; Yun, K.S. Electrode Characteristics of the Cr and La Doped AB2-type Hydrogen Storage Alloys. Int. J. Hydrog. Energy 2001, 26, 949–955. [Google Scholar] [CrossRef]
- Liu, F.J.; Sandrock, G.; Suda, S. Surface and Metallographic Microstructure of the La-added AB2 Compound (Ti, Zr)(Mn, Cr, Ni)2. J. Alloys Compd. 1995, 231, 392–396. [Google Scholar] [CrossRef]
- Sun, D.; Latroche, M.; Percheron-Guégan, A. Effects of Lanthanum or Cerium on the Equilibrium of ZrNi1.2Mn0.6V0.2 Cr0.1 and Its Related Hydrogenation Properties. J. Alloys Compd. 1997, 248, 215–219. [Google Scholar]
- Yang, X.G.; Lei, Y.Q.; Shu, K.Y.; Lin, G.F.; Zhang, Q.A.; Zhang, W.K.; Zhang, X.B.; Lu, G.L.; Wang, Q.D. Contribution of Rare-earths to Activation Property of Zr-based Hydride Electrode. J. Alloys Compd. 1999, 293, 632–636. [Google Scholar] [CrossRef]
- Sun, J.C.; Li, S.; Ji, S.J. The Effects of the Substitution of Ti and La for Zr in ZrMn0.7V0.2 Co0.1Ni1.2 Hydrogen Storage Alloys on the Phase Structure and Electrochemical Properties. J. Alloys Compd. 2007, 446, 630–634. [Google Scholar]
- Chen, W.X. Effects of Addition of Rare-earth Element on Electrochemical Characteristics of ZrNi1.1Mn0.5V0.3 Cr0.1 Hydrogen Storage Alloy Electrodes. J. Alloys Compd. 2001, 319, 119–123. [Google Scholar]
- Young, K.; Ouchi, T.; Huang, B.; Reichman, B.; Fetcenko, M.A. Effect of Molybdenum Content on Structural, Gaseous Storage, and Electrochemical Properties of C14-predominant AB2 Metal Hydride Alloys. J. Power Sour. 2011, 196, 8815–8821. [Google Scholar] [CrossRef]
- Young, K.; Nei, J.; Wan, C.; Denys, R.V.; Yartys, V.A. Comparison of C14- and C15-predominated AB2 Metal Hydride Alloys for Electrochemical Applications. Batteries 2017, 3, 22. [Google Scholar] [CrossRef]
- Young, K.; Ouchi, T.; Meng, T.; Wong, D.F. Studies on the Synergetic Effects in Multi-phase Metal Hydride Alloys. Batteries 2016, 2, 15. [Google Scholar] [CrossRef]
- Young, K.; Ouchi, T.; Nei, J.; Koch, J.M.; Lien, Y. Comparison among constituent phases in superlattice metal hydride alloys for battery applications. Batteries 2017. submitted. [Google Scholar]
- Koch, J.M.; Young, K.; Nei, J.; Hu, C.; Reichman, B. Performance comparison between AB5 and superlattice metal hydride alloys in sealed cells. Batteries 2017. submitted. [Google Scholar]
- Wang, L.; Young, K.; Meng, T.; Ouchi, T.; Yasuoka, S. Partial Substitution of Cobalt for Nickel in Mixed Rare Earth Metal Based Superlattice Hydrogen Absorbing Alloy—Part 1 Structural, Hydrogen Storage and Electrochemical Properties. J. Alloys Compd. 2016, 660, 407–415. [Google Scholar] [CrossRef]
- Young, K.; Yasuoka, S. Past, present, and future of metal hydride alloys in nickel-metal hydride batteries. In Proceedings of the 14th International Symposium on Metal-Hydrogen Systems, Manchester, UK, 21–25 July 2014. [Google Scholar]
- Zhou, X.; Young, K.; West, J.; Regalado, J.; Cherisol, K. Degradation Mechanisms of High-energy Bipolar Nickel Metal Hydride Battery with AB5 and A2B7 Alloys. J. Alloys Compd. 2013, 580, S373–S377. [Google Scholar] [CrossRef]
- Stucki, F.; Schlapbach, L. Magnetic Properties of LaNi5, FeTi, Mg2Ni and Their Hydrides. J. Less Common Met. 1980, 74, 143–151. [Google Scholar] [CrossRef]
- Schlapbach, L.; Stucki, F.; Seiler, A.; Siegmann, H.C. Magnetism and Hydrogen Storage in LaNi5, FeTi and Mg2Ni. J. Magn. Magn. Mater. 1980, 15–18, 1271–1272. [Google Scholar] [CrossRef]
- Young, K.; Chao, B.; Nei, J. Microstructures of the Activated Si-containing AB2 Metal Hydride Alloy Surface by Transmission Electron Microscope. Batteries 2016, 2, 4. [Google Scholar] [CrossRef]
- Young, K.; Chao, B.; Pawlik, D.; Shen, H.T. Transmission Electron Microscope Studies in the Surface Oxide on the La-containing AB2 Metal Hydride Alloy. J. Alloys Compd. 2016, 672, 356–365. [Google Scholar] [CrossRef]
- Young, K.H.; Fetcenko, M.A.; Ovshinsky, S.R.; Ouchi, T.; Reichman, B.; Mays, W.C. Improved Surface Catalysis of Zr-based Laves Phase Alloys for NiMH Batteries. In Hydrogen at Surface and Interfaces; Jerkiewicz, G., Feliu, J.M., Popov, B.N., Eds.; Electrochemical Society: Pennington, NJ, USA, 2000. [Google Scholar]
- Lee, H.; Chourashiya, M.G.; Park, C.; Park, C. Hydrogen Storage and Electrochemical Properties of the Ti0.32 Cr0.43−x−yV0.25FexMny (x = 0–0.055, y = 0–0.080) Alloys and Their Composites with MmNi3.99Al0.29Mn0.3 Co0.6 Alloy. J. Alloys Compd. 2013, 566, 37–42. [Google Scholar] [CrossRef]
- Inoue, H.; Arai, S.; Iwakura, C. Crystallographic and Electrochemical Characterization of TiV4−xNix Alloys for Nickel-metal Hydride Batteries. Electrochim. Acta 1996, 41, 937–939. [Google Scholar] [CrossRef]
- Yu, X.B.; Wu, Z.; Xia, B.J.; Xu, N.X. A Ti-V-based bcc Phase Alloy for Use as Metal Hydride Electrode with High Discharge Capacity. J. Chem. Phys. 2004, 121, 987–990. [Google Scholar] [CrossRef] [PubMed]
Figure 1.
Pressure-concentration-temperature system (PCT) isotherms measured at 30 °C for as-is alloys (a) A–D and (b) E–H. Open and solid symbols represent the absorption and desorption curves, respectively.
Figure 1.
Pressure-concentration-temperature system (PCT) isotherms measured at 30 °C for as-is alloys (a) A–D and (b) E–H. Open and solid symbols represent the absorption and desorption curves, respectively.

Figure 2.
Electrochemical full-capacity activation behavior for as-is alloys (a) A–D and (b) E–H.
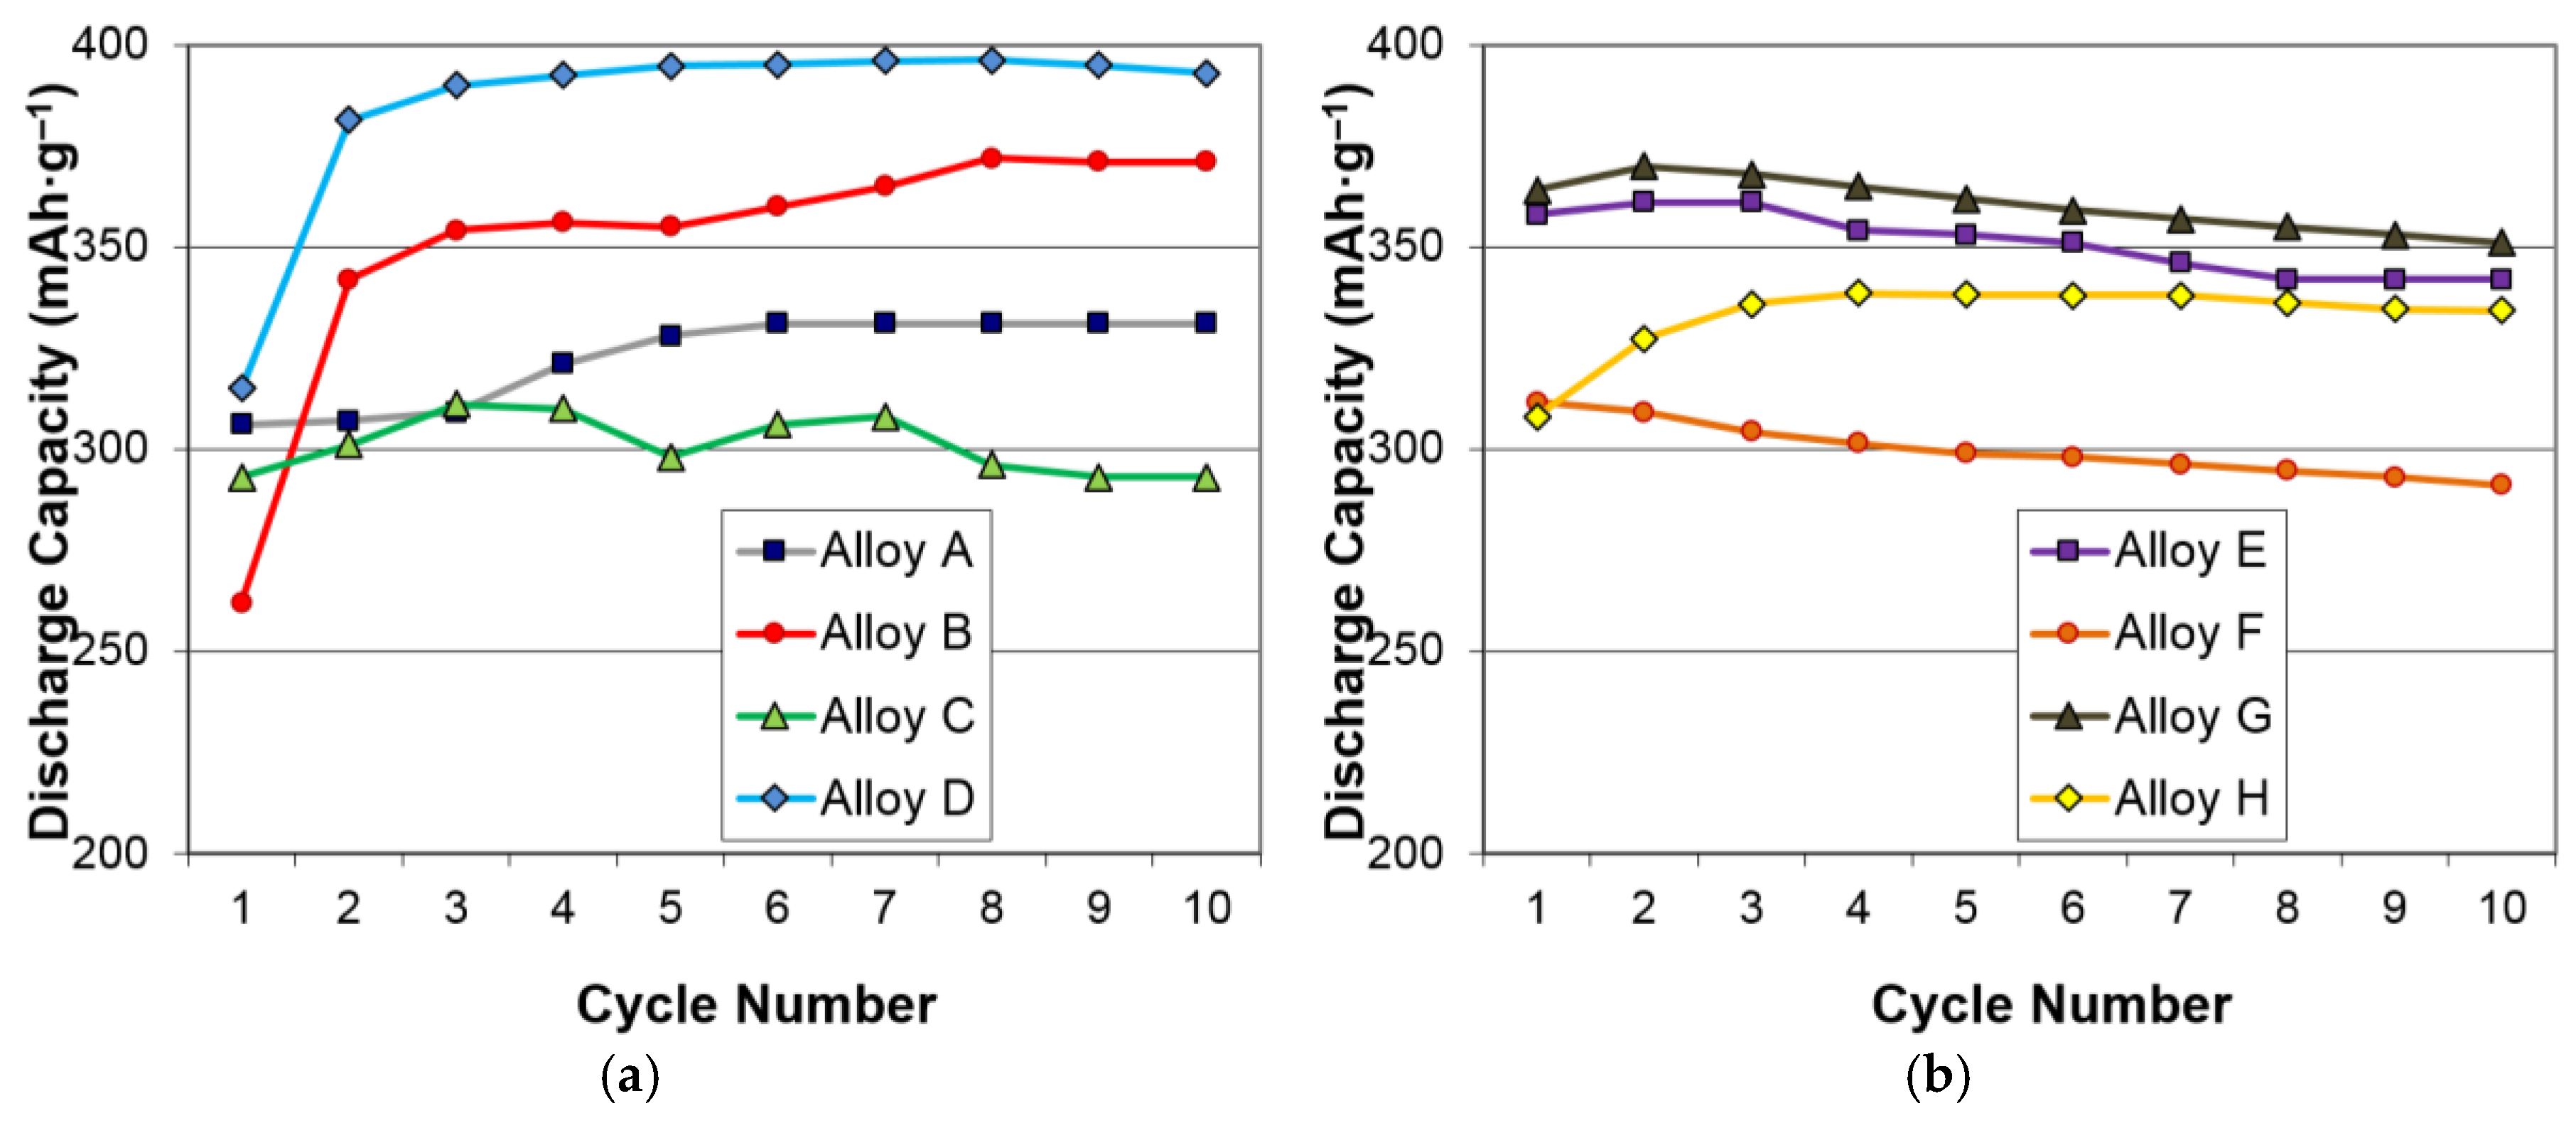
Figure 3.
Examples of half-cell discharge capacities measured with 0.1 C (cycle 1–6), 0.2 C (cycle 7), 0.5 C (cycle 8), 1 C (cycle 9), 2 C (cycle 10), 3 C (cycle 11), and 5 C (cycle 12) rates from A (as-in only), B (both as-is and etched) and E (both as-is and etched).
Figure 3.
Examples of half-cell discharge capacities measured with 0.1 C (cycle 1–6), 0.2 C (cycle 7), 0.5 C (cycle 8), 1 C (cycle 9), 2 C (cycle 10), 3 C (cycle 11), and 5 C (cycle 12) rates from A (as-in only), B (both as-is and etched) and E (both as-is and etched).

Figure 4.
Examples of three internal resistance results from A (as-is only), B (both as-is and etched), and E (both as-is and etched). (a) and (e) in parentheses represent for as-is and etched.
Figure 4.
Examples of three internal resistance results from A (as-is only), B (both as-is and etched), and E (both as-is and etched). (a) and (e) in parentheses represent for as-is and etched.
Figure 5.
Plot of the calculated specific power vs. internal resistance for as-is and etched A–H.
Figure 6.
Cole-Cole plots obtained from room temperature alternative current (AC) impedance measurements of A (as-is only) and E (both as-is and etched).
Figure 6.
Cole-Cole plots obtained from room temperature alternative current (AC) impedance measurements of A (as-is only) and E (both as-is and etched).
Figure 7.
Plots of the internal resistance (R measured from the annealed alloys and the difference in R before and after annealing (triangle) vs. the saturated magnetic susceptibility (MS) (red dots)).
Figure 7.
Plots of the internal resistance (R measured from the annealed alloys and the difference in R before and after annealing (triangle) vs. the saturated magnetic susceptibility (MS) (red dots)).
Figure 8.
Scanning electron microscopy (SEM) micrographs from the etched alloys (a) A, (b) B, (c) C, (d) D, (e) E, (f) F, (g) G and (h) H. The bar at the lower right corner in each micrograph represents 2.5 μm.
Figure 8.
Scanning electron microscopy (SEM) micrographs from the etched alloys (a) A, (b) B, (c) C, (d) D, (e) E, (f) F, (g) G and (h) H. The bar at the lower right corner in each micrograph represents 2.5 μm.
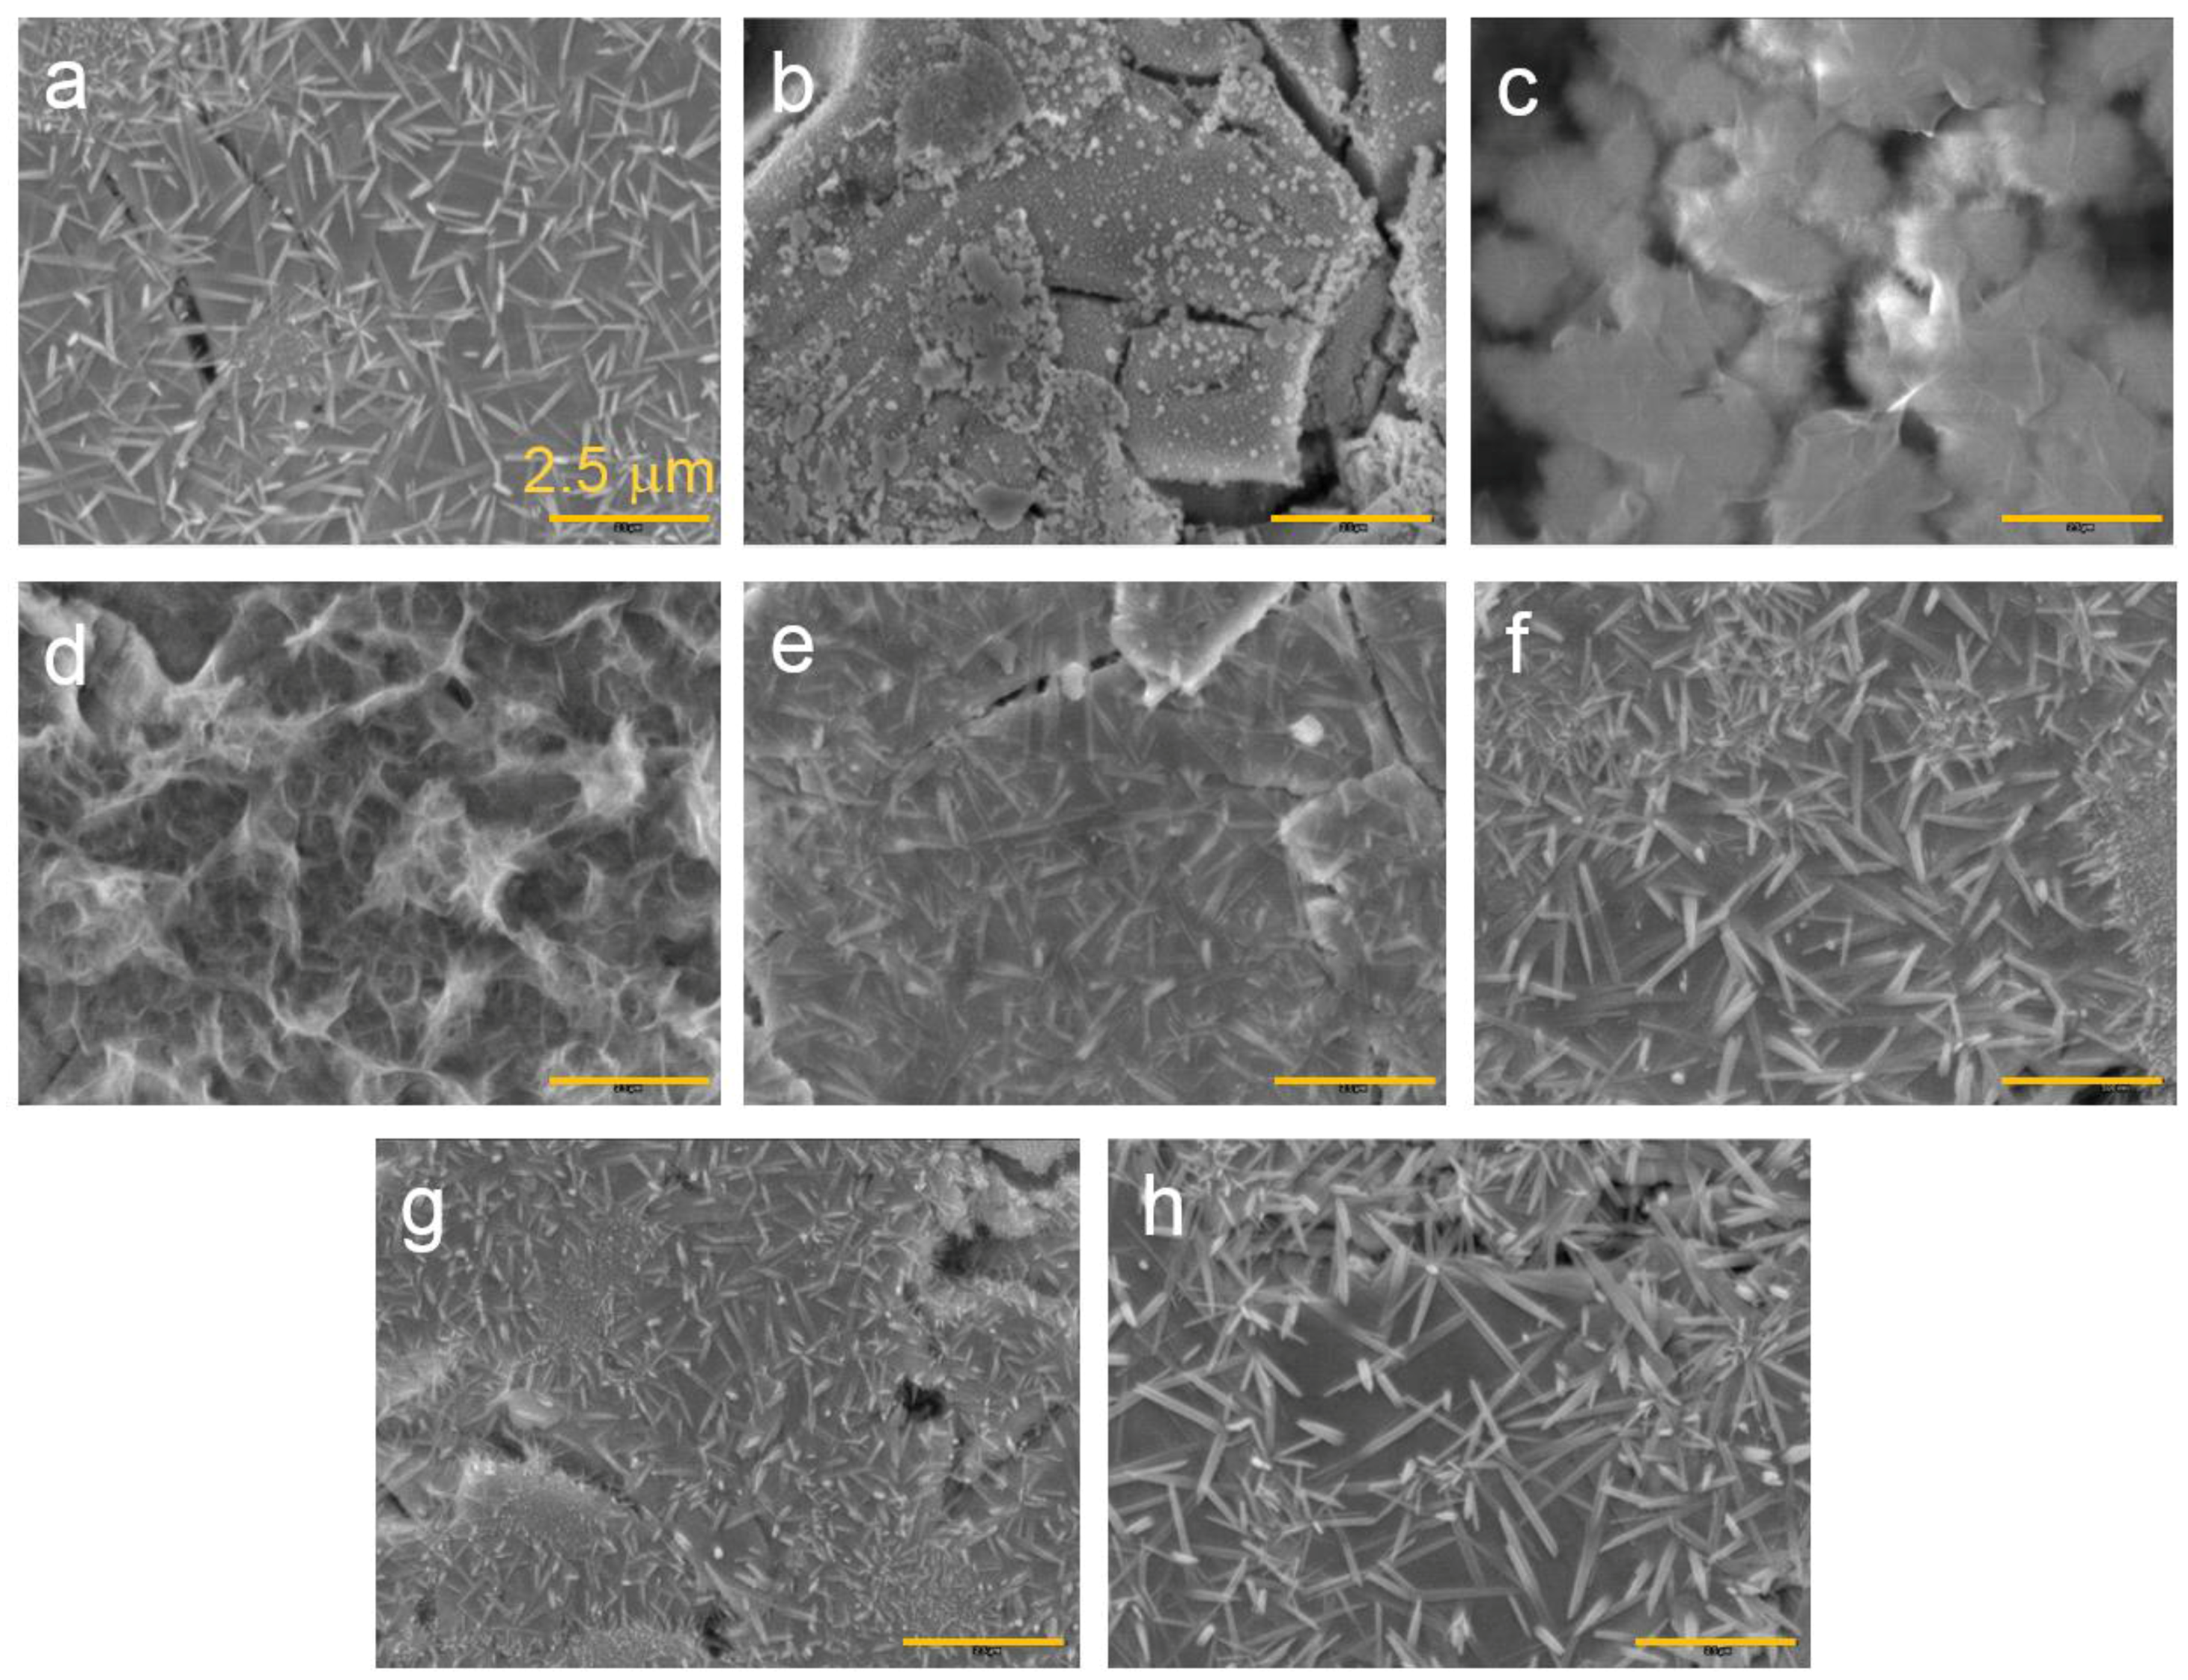
Figure 9.
Weight changes after KOH-etching for three electrodes from B (left) and three from E (right).
Figure 9.
Weight changes after KOH-etching for three electrodes from B (left) and three from E (right).
Figure 10.
X-ray diffractometer (XRD) patterns using Cu-Kα as the radiation source for alloys (a) A, B, (b) C, D, (c) E, F and (d) G, H before and after KOH-etching.
Figure 10.
X-ray diffractometer (XRD) patterns using Cu-Kα as the radiation source for alloys (a) A, B, (b) C, D, (c) E, F and (d) G, H before and after KOH-etching.

Table 1.
Preparation and properties of alloys used in this study. Low-rate discharge capacity and saturated magnetic susceptibility (Ms) are in the units of mAh·g‒1 and emu·g‒1, respectively. HRDs are the ratio of capacities between 50 and 4 mA·g‒1 for B–D and capacities between 100 and 8 mA·g‒1 for all other alloys.
| Alloys | System | Composition | Melting | Annealing | Capacity | HRD | MS | Reference |
|---|---|---|---|---|---|---|---|---|
| A | AB5 | La10.5 Ce4.3Pr0.5Nd1.4Ni60 Co12.7Mn5.9Al4.7 | VIM | In vacuum | 331 | 0.99 | 0.43 | A in [13] |
| B | AB2-C14 | Zr21.5Ti12V310 Cr7.5Mn8.1 Co8Ni32.2Sn0.3Al0.4 | VIM | None | 354 | 0.90 | 0.04 | Mo0 in [37] |
| C | AB2-C15 | Zr25Ti6.5V3.9Mn22.2Fe3.8Ni38Sn0.3La0.3 | AM | None | 307 | 0.99 | 0.04 | C15 in [38] |
| D | BCC-C14 | Zr2.1Ti15.6V44 Cr11.2Mn6.9 Co1.4Ni18.5Al0.3 | VIM | None | 397 | 0.95 | 0.39 | P17 in [39] |
| E | A2B7 | La16.3Mg7Ni65.1 Co11.6 | VIM | In Ar | 361 | 0.98 | 0.37 | C in [13] |
| F | A2B7 | La6Sm13.8Mg3Ni73.8Al3.4 | VIM | In Ar | 320 | 0.99 | 0.60 | A3 in [40] |
| G | A2B7 | La11.3Pr1.7Nd5.1Mg4.5Ni63.6 Co13.6Zr0.2 | VIM | In Ar | 370 | 0.98 | 1.19 | B in [41] |
| H | A2B7 | La3.9Pr7.7Nd7.7Mg3.9Ni68.1 Co4.7Al4 | VIM | In Ar | 354 | 0.94 | 0.62 | C3 in [42] |
Table 2.
Electrochemical discharge capacity measured at 50 mA·g‒1, surface charge-transfer resistance (R) from AC impedance measurement, and specific power density.
Table 2.
Electrochemical discharge capacity measured at 50 mA·g‒1, surface charge-transfer resistance (R) from AC impedance measurement, and specific power density.
| Alloys | Treatment | Capacity (mAh·g‒1) | Resistance (Ω·g) | Specific Power (W·kg‒1) |
|---|---|---|---|---|
| A | None | 321 | 1.28 | 317 |
| KOH-etch | 321 | 1.74 | 238 | |
| B | None | 360 | 1.88* | 228* |
| KOH-etch | 352 | 1.71* | 261* | |
| C | None | 290 | 2.25* | 192* |
| KOH-etch | 291 | 1.68* | 256* | |
| D | None | 390 | 1.80 | 235 |
| KOH-etch | 349 | 2.34 | 181 | |
| E | None | 356 | 1.22* | 334* |
| KOH-etch | 358 | 1.07* | 388* | |
| F | None | 300 | 1.42* | 287* |
| KOH-etch | 304 | 1.15* | 355* | |
| G | None | 353 | 1.13* | 347* |
| KOH-etch | 353 | 1.04* | 390* | |
| H | None | 345 | 1.86 | 218 |
| KOH-etch | 320 | 2.04 | 202 |
Note: * The reduced R from the KOH-etch treatment.
Table 3.
Measurement of weight change before and after KOH-etch for A and B. All numbers are in mg.
| Sample # | Substrate Weight | Electrode Wright Before | Electrode Weight After | Weight Difference |
|---|---|---|---|---|
| B 1 | 192.8 | 262.3 | 260.8 | −1.5 |
| B 2 | 182.7 | 257.4 | 255.7 | −1.7 |
| B 3 | 178.4 | 252.0 | 250.5 | −1.5 |
| E 1 | 199.5 | 279.6 | 280.3 | 0.7 |
| E 2 | 181.3 | 278.7 | 279.8 | 1.1 |
| E 3 | 186.4 | 289.0 | 290.1 | 1.1 |
Table 4.
ICP results (in unit of ppm) from the solutions after etching experiment. N.D. and LLD denote non-detectable (below LLD) and lowest limit of detection, respectively.
Table 4.
ICP results (in unit of ppm) from the solutions after etching experiment. N.D. and LLD denote non-detectable (below LLD) and lowest limit of detection, respectively.
| Alloy | A | B | C | D | E | F | G | H | LLD |
|---|---|---|---|---|---|---|---|---|---|
| Al | 58 | 1.6 | N.D. | 29 | N.D. | 78 | N.D. | 20 | 0.012 |
| Co | N.D. | 0.1 | N.D. | 1.0 | N.D. | N.D. | 1.2 | N.D. | 0.004 |
| Cr | N.D. | 4.3 | N.D. | 48 | N.D. | N.D. | N.D. | N.D. | 0.054 |
| Fe | N.D. | N.D. | 1.0 | N.D. | N.D. | N.D. | N.D. | N.D. | 0.002 |
| Mg | N.D. | N.D. | N.D. | N.D. | 0.05 | 0.3 | 0.5 | N.D. | 0.001 |
| Mn | N.D. | 2.0 | 0.1 | 8.0 | N.D. | N.D. | N.D. | N.D. | 0.001 |
| Ni | N.D. | 6.0 | 0.3 | 5.0 | N.D. | N.D. | N.D. | N.D. | 0.001 |
| Ti | N.D. | 150 | 7 | 416 | N.D. | N.D. | N.D. | N.D. | 0.004 |
| V | N.D. | 125 | 92 | 988 | N.D. | N.D. | N.D. | N.D. | 0.013 |
| Zr | N.D. | 495 | 518 | 309 | N.D. | N.D. | N.D. | N.D. | 0.002 |
© 2017 by the authors. Licensee MDPI, Basel, Switzerland. This article is an open access article distributed under the terms and conditions of the Creative Commons Attribution (CC BY) license (http://creativecommons.org/licenses/by/4.0/).
Share and Cite
MDPI and ACS Style
Meng, T.; Young, K.-H.; Hu, C.; Reichman, B. Effects of Alkaline Pre-Etching to Metal Hydride Alloys. Batteries 2017, 3, 30. https://doi.org/10.3390/batteries3040030
AMA Style
Meng T, Young K-H, Hu C, Reichman B. Effects of Alkaline Pre-Etching to Metal Hydride Alloys. Batteries. 2017; 3(4):30. https://doi.org/10.3390/batteries3040030
Chicago/Turabian StyleMeng, Tiejun, Kwo-Hsiung Young, Chaolan Hu, and Benjamin Reichman. 2017. "Effects of Alkaline Pre-Etching to Metal Hydride Alloys" Batteries 3, no. 4: 30. https://doi.org/10.3390/batteries3040030
Note that from the first issue of 2016, this journal uses article numbers instead of page numbers. See further details here.